Article

Blending for Achieving Theoretical Mechanical and Electrical Property Enhancement in Polyacrylonitrile/SWNT Materials

Department of Mechanical and Industrial Engineering, Northeastern University, 360 Huntington Avenue, Boston, MA 02115, USA
*
Author to whom correspondence should be addressed.
J. Compos. Sci. 2022, 6(5), 122; https://0-doi-org.brum.beds.ac.uk/10.3390/jcs6050122
Submission received: 7 March 2022 / Revised: 1 April 2022 / Accepted: 12 April 2022 / Published: 22 April 2022
(This article belongs to the Special Issue Advanced Conductive Polymer Composites)

Abstract

:
Filtration based processing of nanotube and polymer-nanotube dispersions is used to create polymer and nano-filler hybrid materials. The composite morphology consists of two layers: (1) a region where polymer chains have direct matrix interaction with the nano-fillers and (2) a nano-filler rich region excluded from matrix interactions. The experimental work here demonstrates the processing of this hybrid material using polyacrylonitrile (PAN) and single-wall carbon nanotubes (SWNT) at various PAN/SWNT weight concentrations. Mechanical analyses were performed to evaluate effective contributions from the SWNT in each of the defined layers. The region of high matrix-filler interactions exhibits blending behavior with material properties following suit. As a result, mechanical performance is consistent and begins to exceed theoretical predictions derived from Halpin–Tsai calculations. Tensile strength and modulus reached values as high as 60 MPa and 7.7 GPa, respectively, surpassing the performance of neat nano-filler (36 MPa, 3.9 GPa) and neat polymer matrix (44 MPa, 2.0 GPa) films. Additionally, the measurement of electrical properties shows that the blended polymer-SWNT region exhibits conductivity comparable to the filler. The results of this work suggest that blending polymers and nano-fillers is possible and may facilitate the production of materials with comparatively high mechanical performance and electrical conductivities.

1. Introduction

Filtration based processing of carbon nanotube (CNT) and polymer/CNT dispersions allows for the formation of easy to handle, free standing films. When such processing is performed on carbon nanotubes alone, the resulting film of entangled CNT bundles is termed a buckypaper (BP) [1]. Typical solvent-based procedures start from the well-dispersed suspension of nanoparticles that are subsequently driven out of the solution via a pressure differential (e.g., frit compression, vacuum filtration) or manipulation of CNT arrays (i.e., ‘domino pushing’) [1,2,3,4,5]. Composite films, termed hybrid polymer/CNT buckypapers (hPBPs) for this work, are fabricated in this manner by introducing polymers to the suspension in addition to single-walled carbon nanotubes (SWNTs). The combination of BP and polymers gives hPBPs distinctive mechanical [3,6] thermal [7,8] and electrical [7,9] properties. In this paper, a phase-separation method is employed as a pre-processing step for polyacrylonitrile (PAN)/SWNT dispersions to induce selective phases within the final composite film. In one phase, the polymer is well-blended with the SWNT and exhibits morphology and properties consistent with blended systems [10]. This study examines and characterizes the morphology and properties of this blended phase within the hPBP.
Aside from solvent-based filtration processing, other techniques developed for the formation of composite BPs include the infiltration of resin or acrylonitrile–butadiene–styrene (ABS) into an as-formed BP structure [3,7,11] and the in-situ crosslinking of BPs [5]. While the use of an as-formed BP substrate may be convenient, the depth of filler impregnation and infiltration is often limited by the dense, entangled structure of the BP and frequently leads to failure by debonding at the polymer-CNT interface upon loading. As such, good interfacial interaction between the polymer and CNT is critical for high mechanical reinforcement and performance. Both covalent and non-covalent functionalization methods may be employed to better promote interfacial interaction. Covalent methods are efficient yet potentially prone to defects or even oxidization-driven tube unzipping [12,13]. Additionally, these functionalizations induce changes to the atomic structure of CNT walls, which may prevent the formation of graphitic structures during heat treatment [14]. Non-covalent methods utilize surfactants and other polymers to create a dispersing energy barrier around the surface of nanotubes [15,16]. These non-covalent methods preserve the CNT’s strong atomic structure, enhance composite properties, and allow for the formation of graphitic structures post heat treatment [15]. This work uses the vacuum-driven solvent-based phase-separation method to form hPBPs specifically to take advantage of non-covalent interfacing techniques [17,18,19].
While processing the hPBPs, the addition of non-solvent was adjusted by ratio to understand its influence on polymer-SWNT interfacial interactions in solution [20]. The non-solvent adjusts the interaction parameter associated with the surrounding fluid, creating a greater affinity between the suspended polymer and SWNTs. In the case of PAN, the non-solvent method was also found to promote blending between a uniform distribution of SWNTs with specific bundle sizes and the PAN chains [20]. During filtration, these encapsulated bundles of SWNT become separated from the master-batch of SWNTs, forming a distinctive polymer-rich layer (PRL) in the hPBP. It is this PRL region where blended properties are observed. This non-solvent method was used in the fabrication of all hPBPs discussed in this work. It has also been observed to be critical for the retention of polymer during the filtration step. PAN has been a common choice for carbon fiber precursors and composites for decades. The results outlined in this paper serve to elucidate the effects of varying PAN-SWNT weight ratios on the morphological, mechanical, and electrical properties of hPBP films fabricated using this novel solvent-based phase separation technique. The formation of blended PAN-SWNT regions with these hPBPs is unique to this research. The experimental work here highlights a particular weight concentration ratio, where the PAN and SWNT show homogeneous properties that behave differently from what is observed for a similar composite material (i.e., loaded with the same components under similar processing parameters). Nanotubes have been described as polymeric [21], giving rise to the notion that blending between traditional polymeric materials and these nano-fillers may be possible. This work provides novel experimental observations of structural and property characteristics for miscible blend behavior between PAN and SWNT. Processing these materials required no need for alteration of the SWNT structures (i.e., functionalization) to enhance interactions with the polymer. Analogous to polymer-polymer miscible blends, these unique structures also form at a critical weight concentration ratio specific to this PAN-SWNT system. This work provides new insight into process-structure relationships that may be possible between such dissimilar materials.

2. Materials and Methods

2.1. Materials

The polymer used in this work was a poly(acrylonitrile-co-methacrylic acid) (PAN) random copolymer with methacrylic acid content of 4 wt% (Mw ∼513,000 g/mol), obtained from Exlan Co., Osaka, Japan. The SWNT material used was P-Tubes (HiPco® purified SWNT, metallic impurity <15 wt%, diameter 0.8 to 1.2 nm, length 0.1 to 1 µm) obtained from NanoIntegris, Inc. SWNT in this work are also referred to as ’PT’ tubes for brevity. Dimethyl formamide (DMF) was the solvent (S) purchased from Fisher Chemical (certified ACS, 99.9%) and used as-received. Deionized water was used as non-solvent (NS) in this study.

2.2. Dispersion Preparation

PAN powder was first dissolved in 90 °C DMF at a concentration of 250 mg/L. SWNTs of varying amounts were then dispersed in the polymer solution for 24 h via a bath sonicator (Fisher FS30, frequency 43 kHz, power 150 W). For neat (sans PAN) BP formation, SWNTs were dispersed in DMF under identical conditions. Various polymer weight concentration ratios of PAN to SWNT were used for the hPBPs: 12.5:1, 5:1, 2.5:1, 1:1, 0.67:1, 0.5:1, 0.25:1, and 0.1:1, respectively.

2.3. BP and hPBP Preparation

After sonication, the PAN/SWNT dispersion was subjected to a shear crystallization process at 90 °C with a constant speed of 350 rpms. Vacuum distillation was applied to remove ∼50% of solvent with specific time and temperature conditions. Subsequently, this system was cooled down to 60 °C. NS water held at 60 °C was added into dispersion at a DMF/H2O vol./vol. ratio of 1:2. After equilibration to 60 °C, the system was then cooled down to room temperature and filtered through a nylon membrane (0.45 µm, Millipore, Burlington, MA, USA) at controlled vacuum. After filtration and drying in a vacuum area, a free standing composite hPBP film was peeled off and characterized. These hPBPs consist of two layered regions: (1) an excluded nano-filler (SWNT) region (CRL) and (2) a blended region where the polymer matrix and SWNT interact directly. The relationship between the bundle size and polymer molecular weight leads to blending between the components [20]. The neat BP was also made via the same process with a S:NS ratio of 1:2 at 25 °C.

2.4. Paste Film Preparation

In an attempt to isolate the PRL, a process for making hPBP films was developed to capture only this region. The filtration process was halted after (∼50%) of the dispersion treated with non-solvent had been drawn through the nylon membrane. Excess dispersion was subsequently removed to leave a layer of polymer-rich ’paste’ on the surface of the nylon membrane. Vacuum is then applied to the paste resulting in a one-layer hPBP exhbiting only a PRL film, allowing for easier investigation of polymer-SWNT interfacial interaction. Small amounts of the solvated ’paste’ were also sampled (before formation of a film) and freeze dried for the purpose of electron microscopy.

2.5. Sample Characterization

2.5.1. Morphological Characterization

Morphological characterization was performed on a field emission scanning electron microscope (FE-SEM) (5 kV, Zeiss Supra-25). SEM samples were coated with gold/palladium (Au/Pd) or left uncoated depending on imaging analysis goals. PRL precursor paste (see paste film preparation above) was first frozen via liquid nitrogen, followed by continuous drying in a freeze dryer for 24 h (Labconco Freezone 6) before being visualized under SEM.

2.5.2. Wide Angle X-ray Diffraction

X-ray diffraction (XRD) patterns were collected on a Rigaku RAPID II equipped with a curved detector manufactured by Rigaku Americas Corporation (operating tube voltage at 40 kV, tube current at 30 mA, CuK α , λ = 0.1541 nm). Data conversion and analysis were processed through Rigaku software packages 2DP (version 1.0.3.4) and PDXL 2 (version 2.0.3.0).

2.5.3. Static Tensile Tests

Static analyses were performed on a RSA-G2 solid analyzer (loading gap × sample width = 5 mm × 1 mm, TA Instruments, New Castle, Delaware, USA) at a constant strain rate of 0.02 mm/s. Tensile test data were collected via TA Instruments’ TRIOS software, version number 4.5.0.42498.

2.5.4. Dynamic Mechanical Analyses

Dynamic analyses were also performed on the RSA-G2 to reveal the influence of polymer-SWNT interaction at different PAN weight concentrations on the glass transition temperature (Tg). The experiments were conducted at 1 Hz at a heating rate of 3 °C/min from −100 °C to 250 °C for neat BPs and the hPBP films, using a gauge length of 5 mm. A total of three tests were performed for each set of samples.

2.5.5. Electrical Properties

Conductivity measurements were collected using an in-house apparatus equipped with a high precision digital multimeter (DMM) using a 4-wire Ohms mode (model DMM 4050, Tektronix, Beaverton, OR, USA) coupled with a four-point probe head (model SP4, Lucas/Signatone Corporation, Gilroy, CA, USA). The sample dimensions used for the electrical measurements are identical to those for the mechanical tests. Spacing between probe tips is 1 mm.

2.5.6. Differential Scanning Calorimetry

Differential scanning calorimetry (DSC) was performed on various paste film samples using a Q200 (TA Instruments) with a T-Zero pan and lid. Samples were equilibrated at 0 °C before ramping to 450 °C at 1 °C/min. Nitrogen flowed into the sample chamber at a rate of 50 mL/min.

3. Results and Discussion

3.1. Morphological Characterization of hPBPs

As described in the experimental section, PAN/SWNT hPBP layered films were formed via filtration with the addition of non-solvent (water). A PAN control cast film and neat SWNT BP were also processed for property comparison. Additionally, single-layer hPBPs were fabricated. The intent of this procedure was to isolate the PRL and confirm the presence of PAN polymers in the lower polymer weight ratio samples via SEM and DSC investigations.
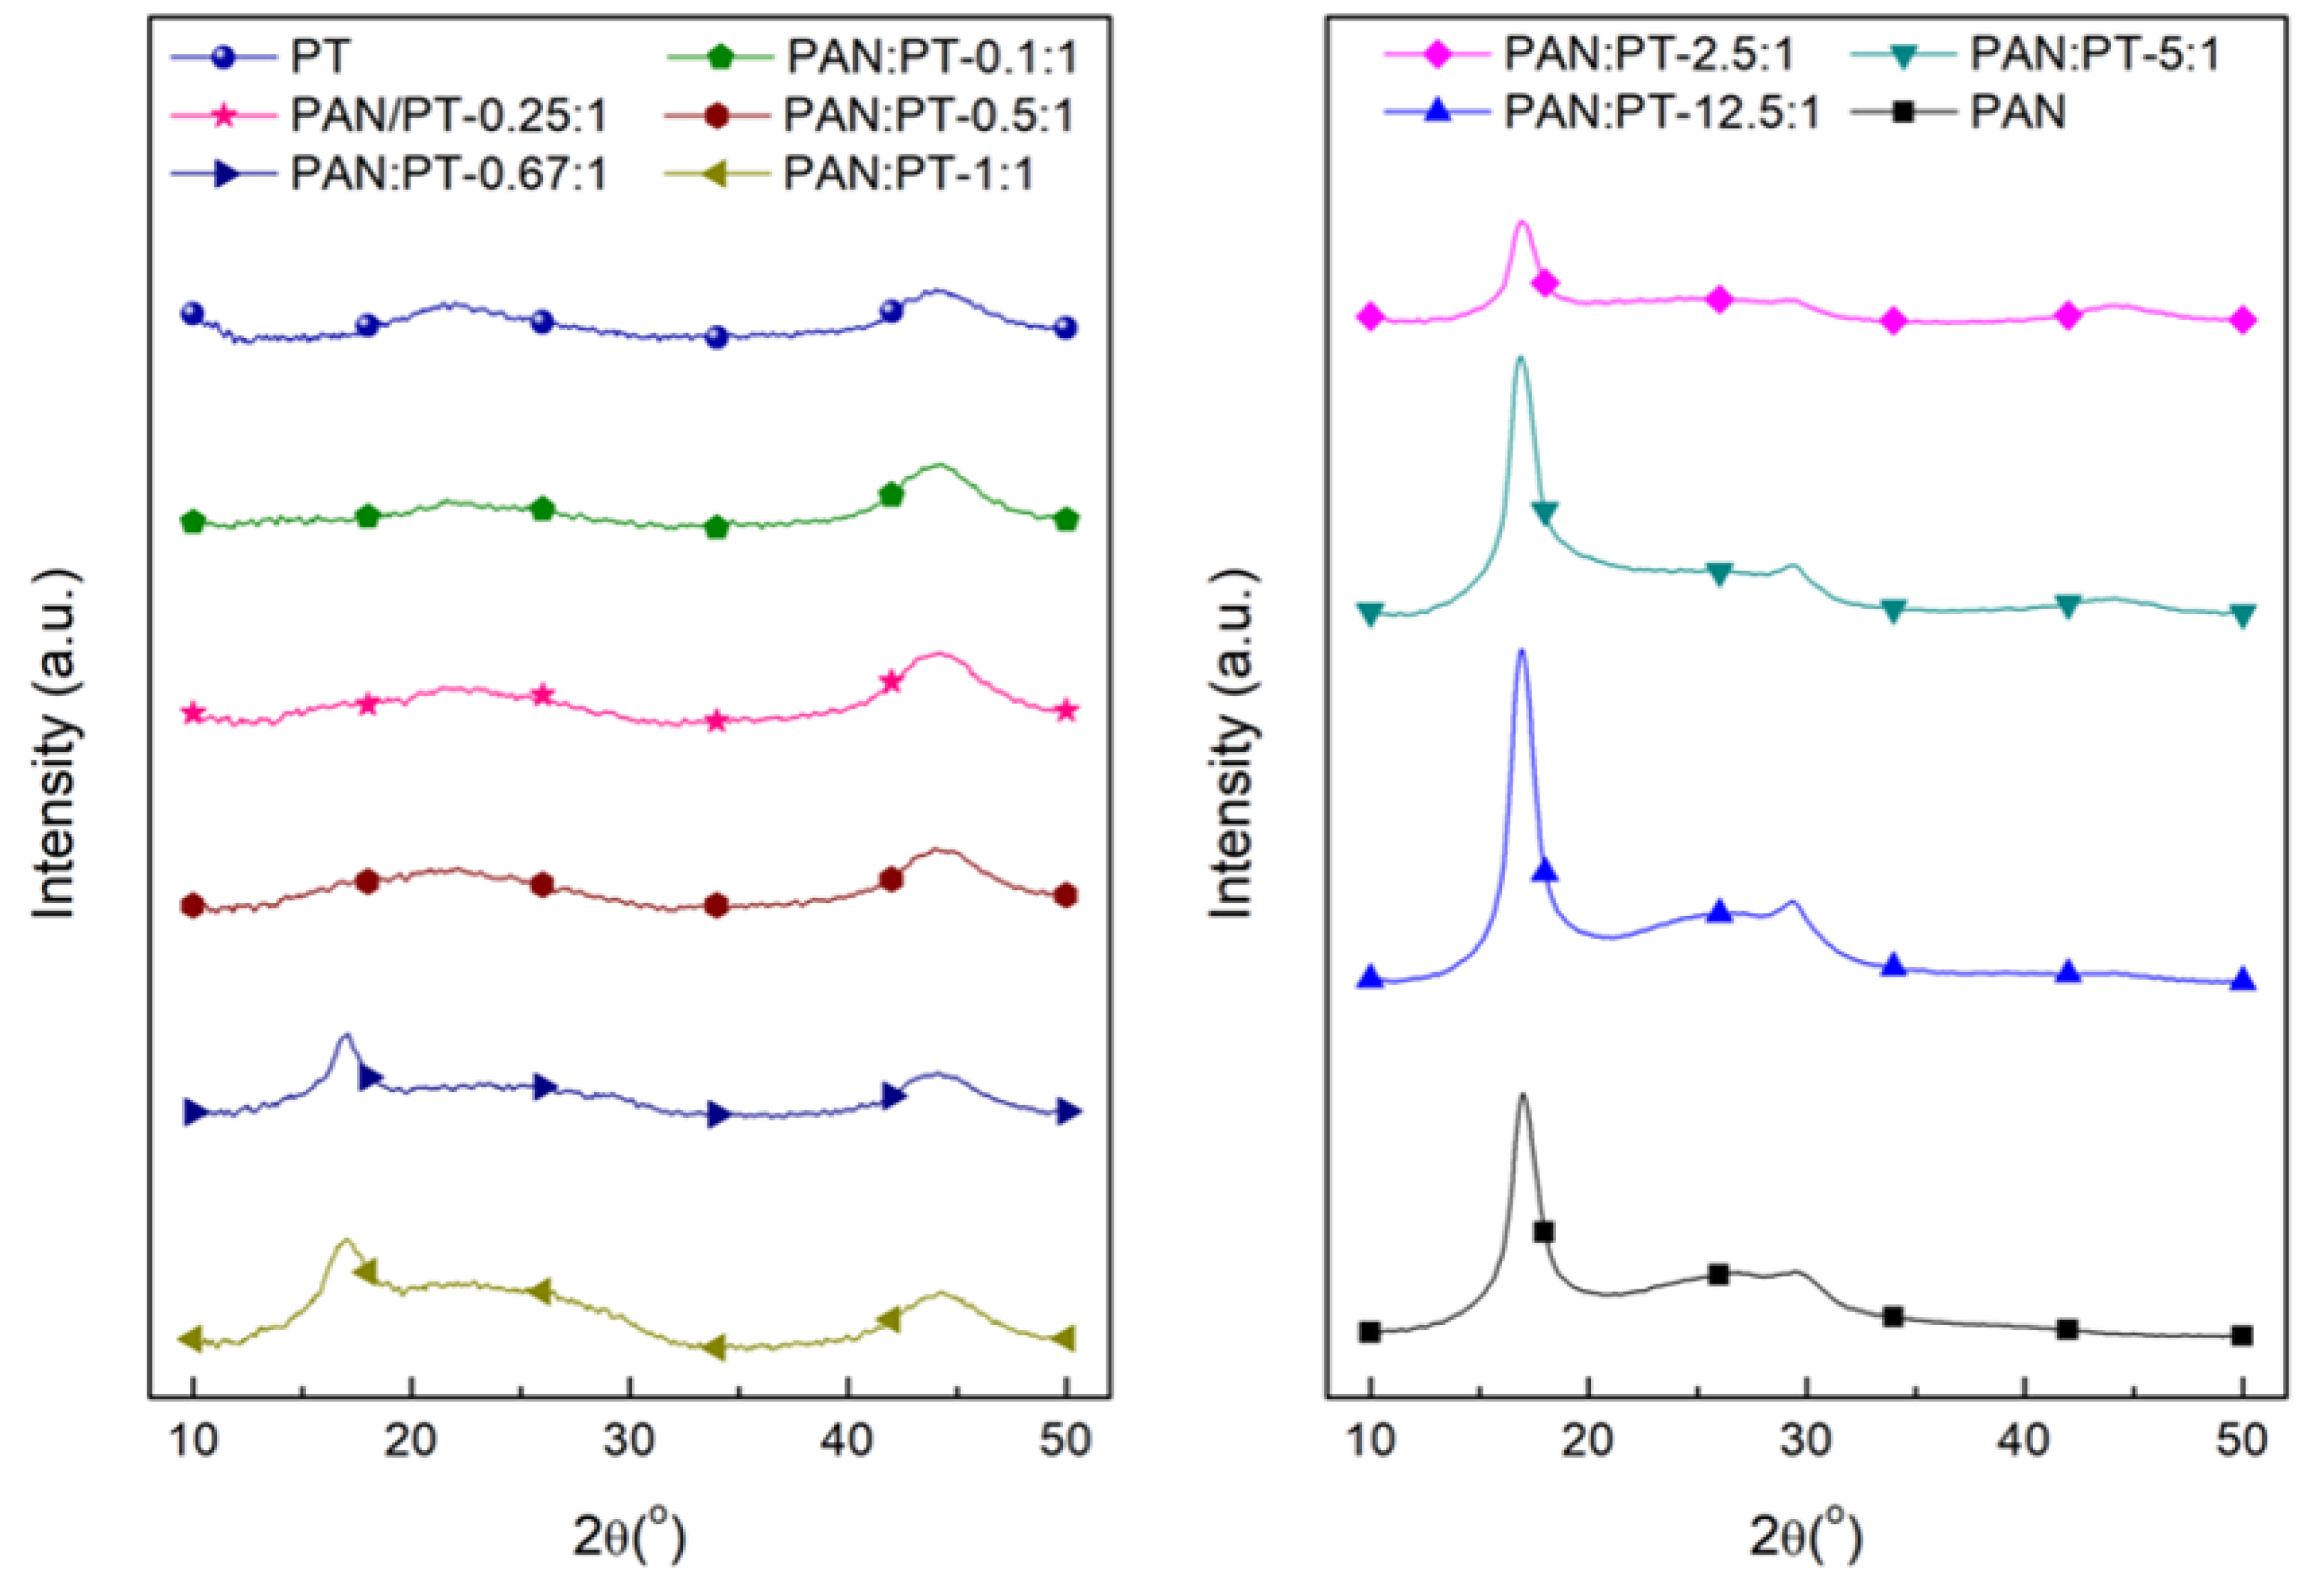
Figure 1 shows the wide-angle (WAXD) integrated curves for all hPBP samples. Based on the WAXD results, a PAN peak (at 2 θ ∼16.7°) can be observed in all composite samples. However, this peak is very weak for the 0.5:1, 0.25:1, and 0.1:1 hPBP samples, due to the low PAN polymer content. Previous work published by the group has shown that the most appropriate S/NS ratio for maximum PAN retention in the hPBP is 1:2. Therefore, for all hPBPs processed in this work this S/NS ratio is used [20].
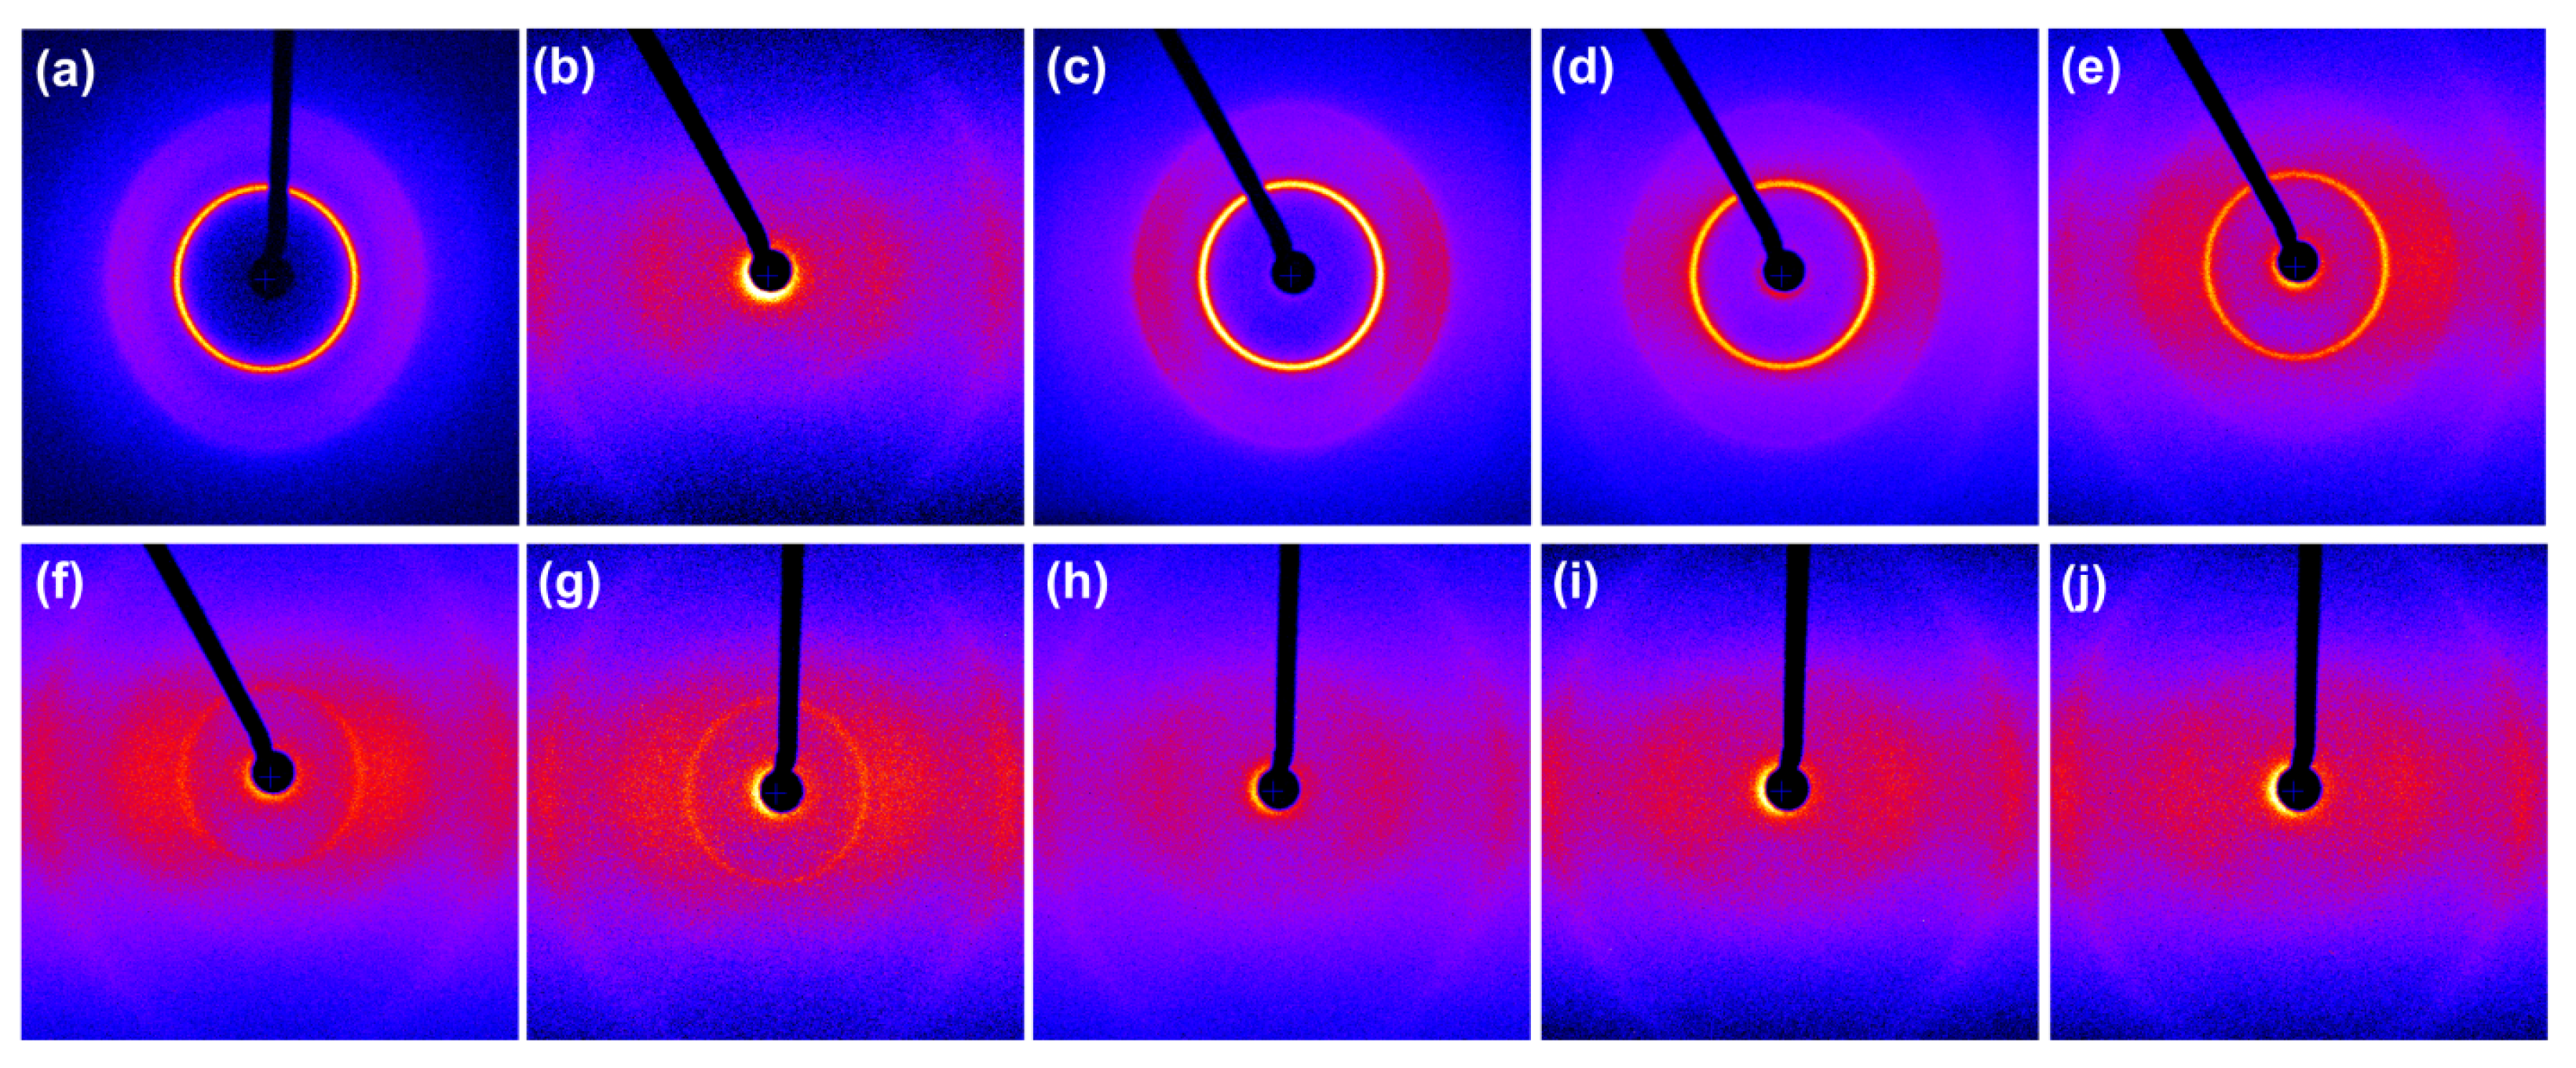
Figure 2 shows the WAXD patterns for all samples where a diffraction reflection for the (110) PAN reflection can be observed. This confirms the presence of PAN in the hPBP for all weight ratios greater than 0.5:1. For the low polymer weight concentration samples (i.e., 0.5:1, 0.25:1, and 0.1:1), the PAN peak is more diffused and not resolved clearly in the integrated curves (See Figure 1) nor the diffraction pattern. Regardless of weak XRD peaks for the low ratio samples, the SEM images (Figure 3) clearly show the PRL regions confirming the presence of PAN. This evidence is also shown in Figure 4 for the 0.25:1 single-layer hPBP. It is expected that for XRD, the SWNT scatter dominates the composite pattern, considering the weight content is 70% or greater for the lower PAN weight concentration samples. The WAXD results also show the presence of the carbon peak at 2 θ ∼42.0–43.5° resulting from the SWNT filler.
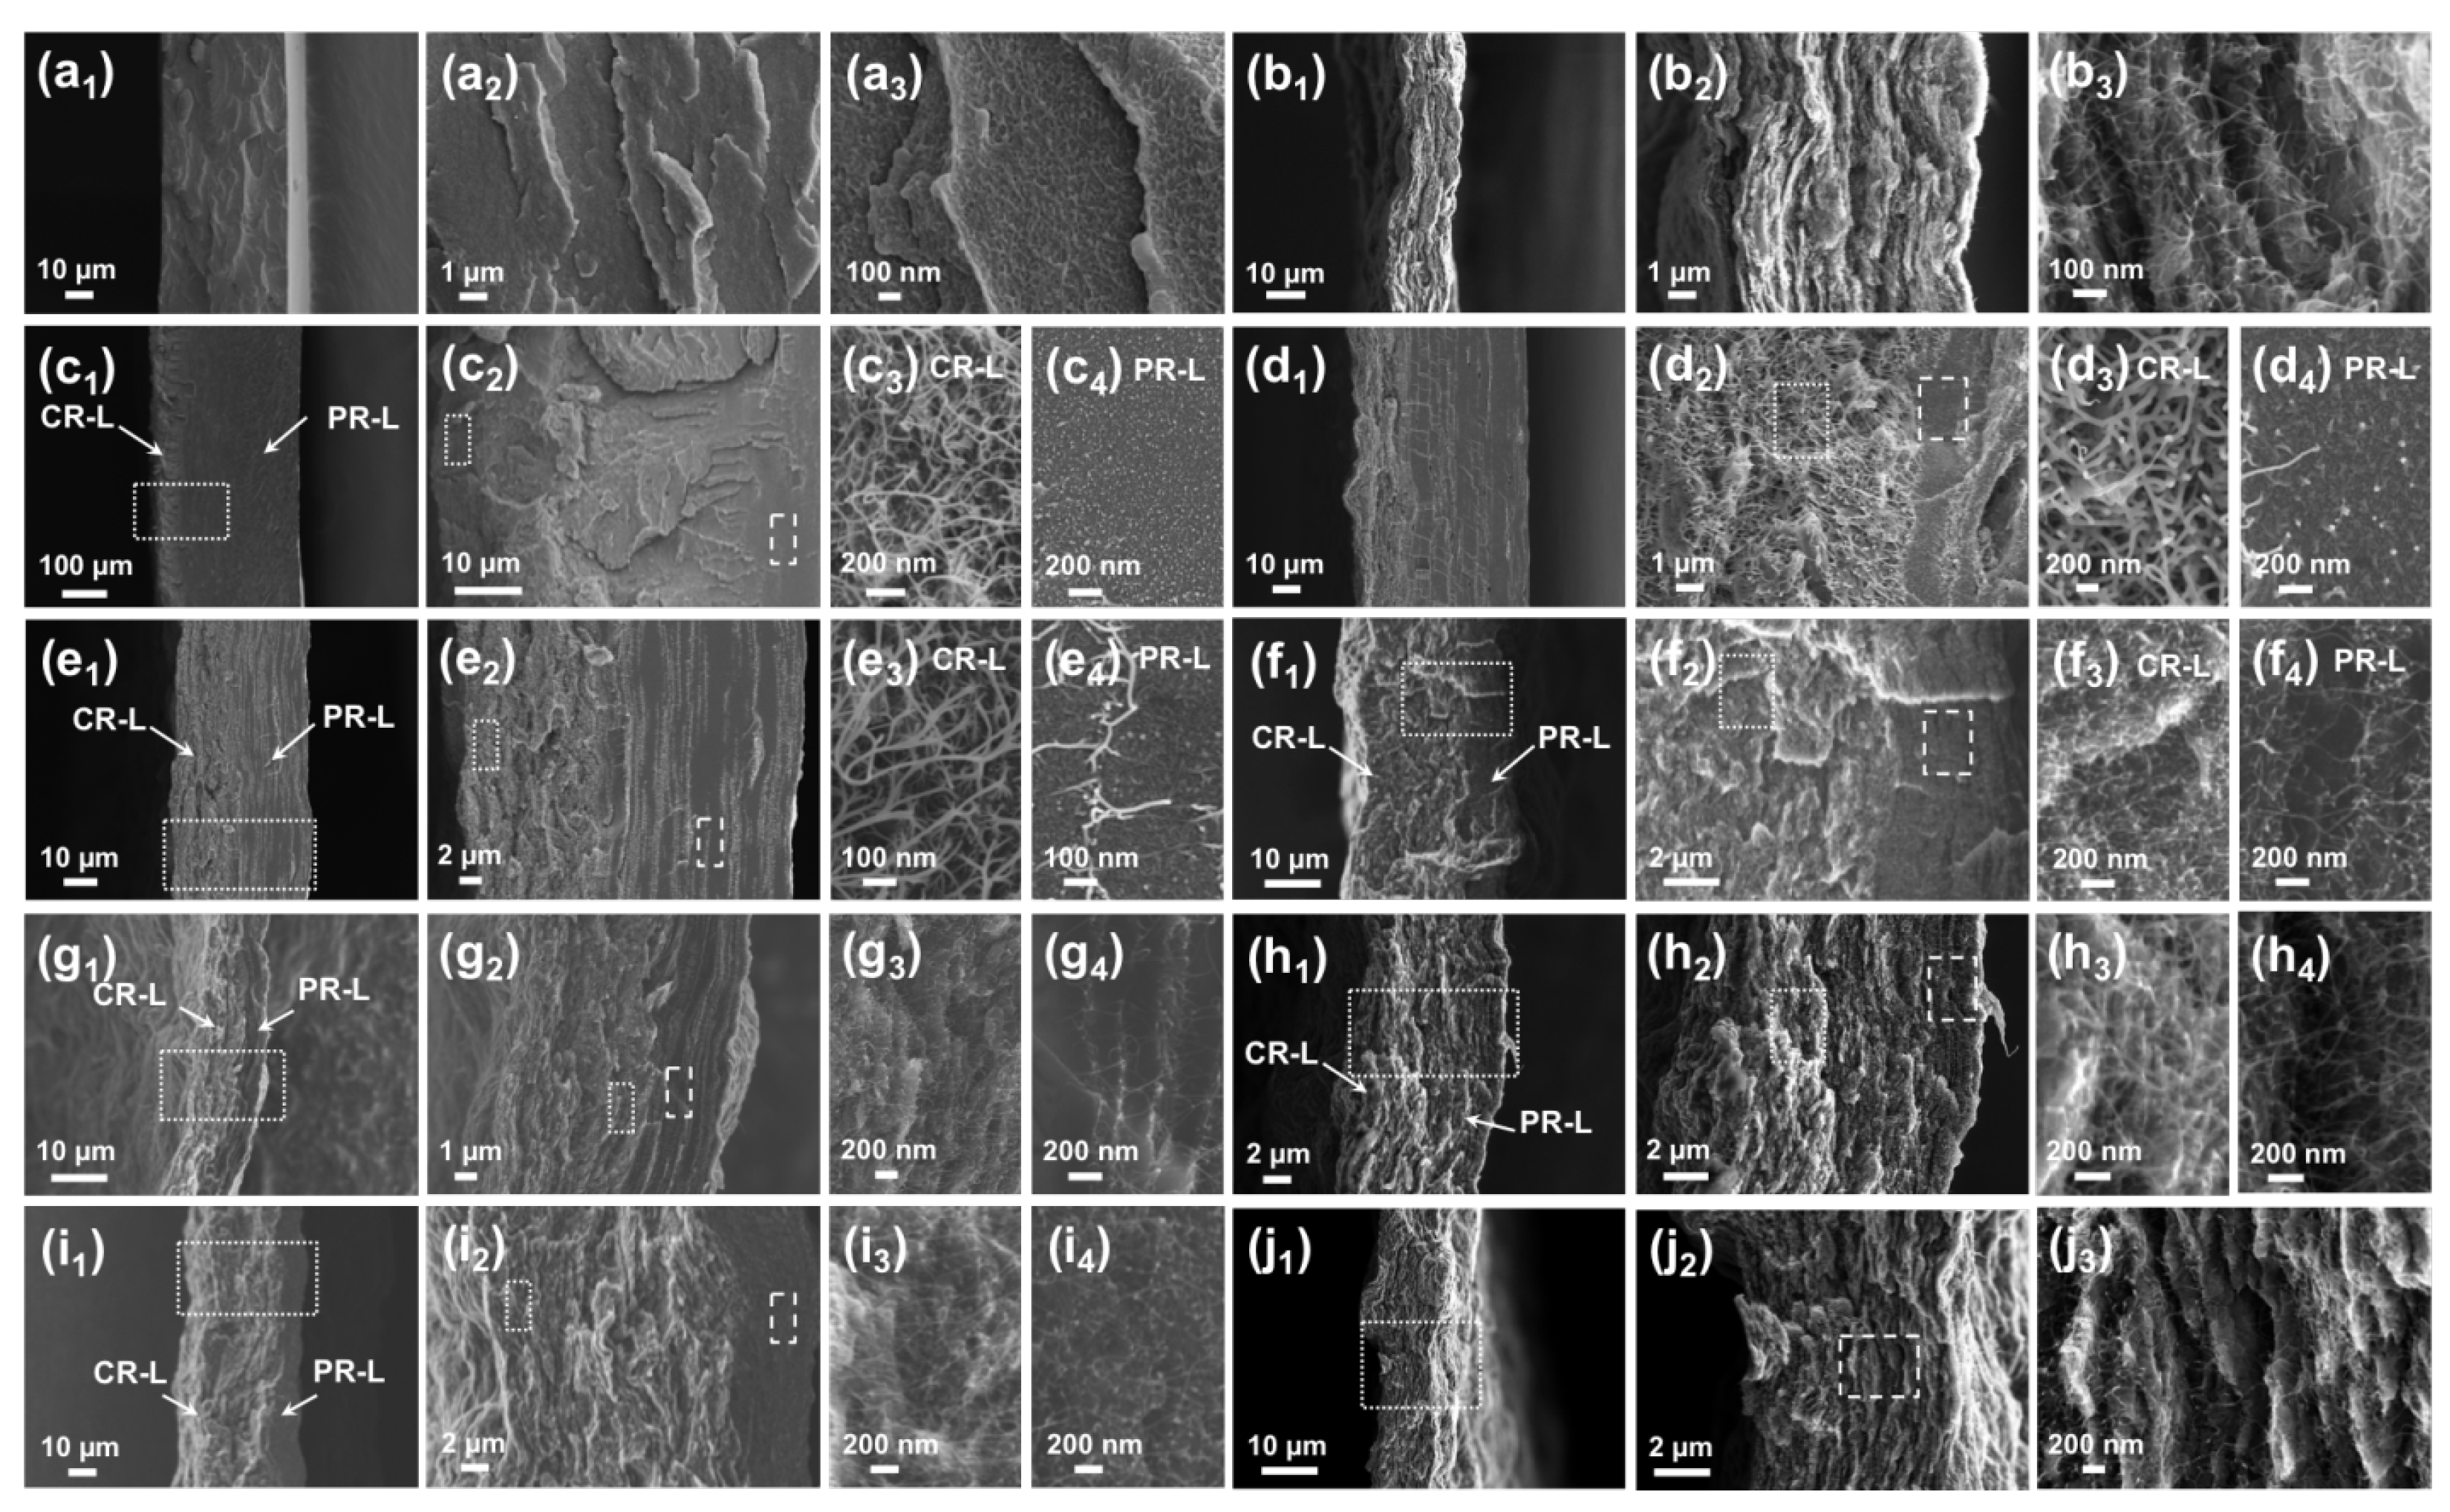
Scanning electron microscopy (SEM) was used to observe the morphology of the hPBP films (Figure 3). The PAN cast film shows a uniform matrix morphology (Figure 3a), and similarly the SWNT BP exhibits a consistent SWNT network throughout the sample thickness (Figure 3b). All hBPB films exhibit a layered morphology consisting of a PRL (PAN interacting directly with SWNT), as well as a CRL (excess SWNT not interacting with the polymer matrix) (Figure 3c–j). Magnified images for the hPBP samples clearly show this distinct layered structure. Although the WAXD analyses for the 0.5:1 to 0.1:1 weight concentration ratios do not show strong PAN reflections, the presence of polymer is clearly observed in the electron microscopy images of hPBP (Figure 3c–j).
To show the morphology of the layered structure more distinctly, a single-layer hPBP film was prepared and compared to a neat buckypaper film (Figure 4). The paste film is representative of the PRL, while the BP is representative of the CRL region, where no polymer is observed. Figure 4 serves to provide evidence for the presence of SWNT solvated by (blended with) the polymer by comparing the morphology of this PRL film to a neat SWNT buckypaper at the same magnification. The even coating of polymer (i.e., interphase PAN) can clearly be observed on the SWNT as compared to the BP, where uncoated SWNT morphology is more obvious. It is important to note that for this SEM characterization the samples are not treated with a metallic coating for image analysis.
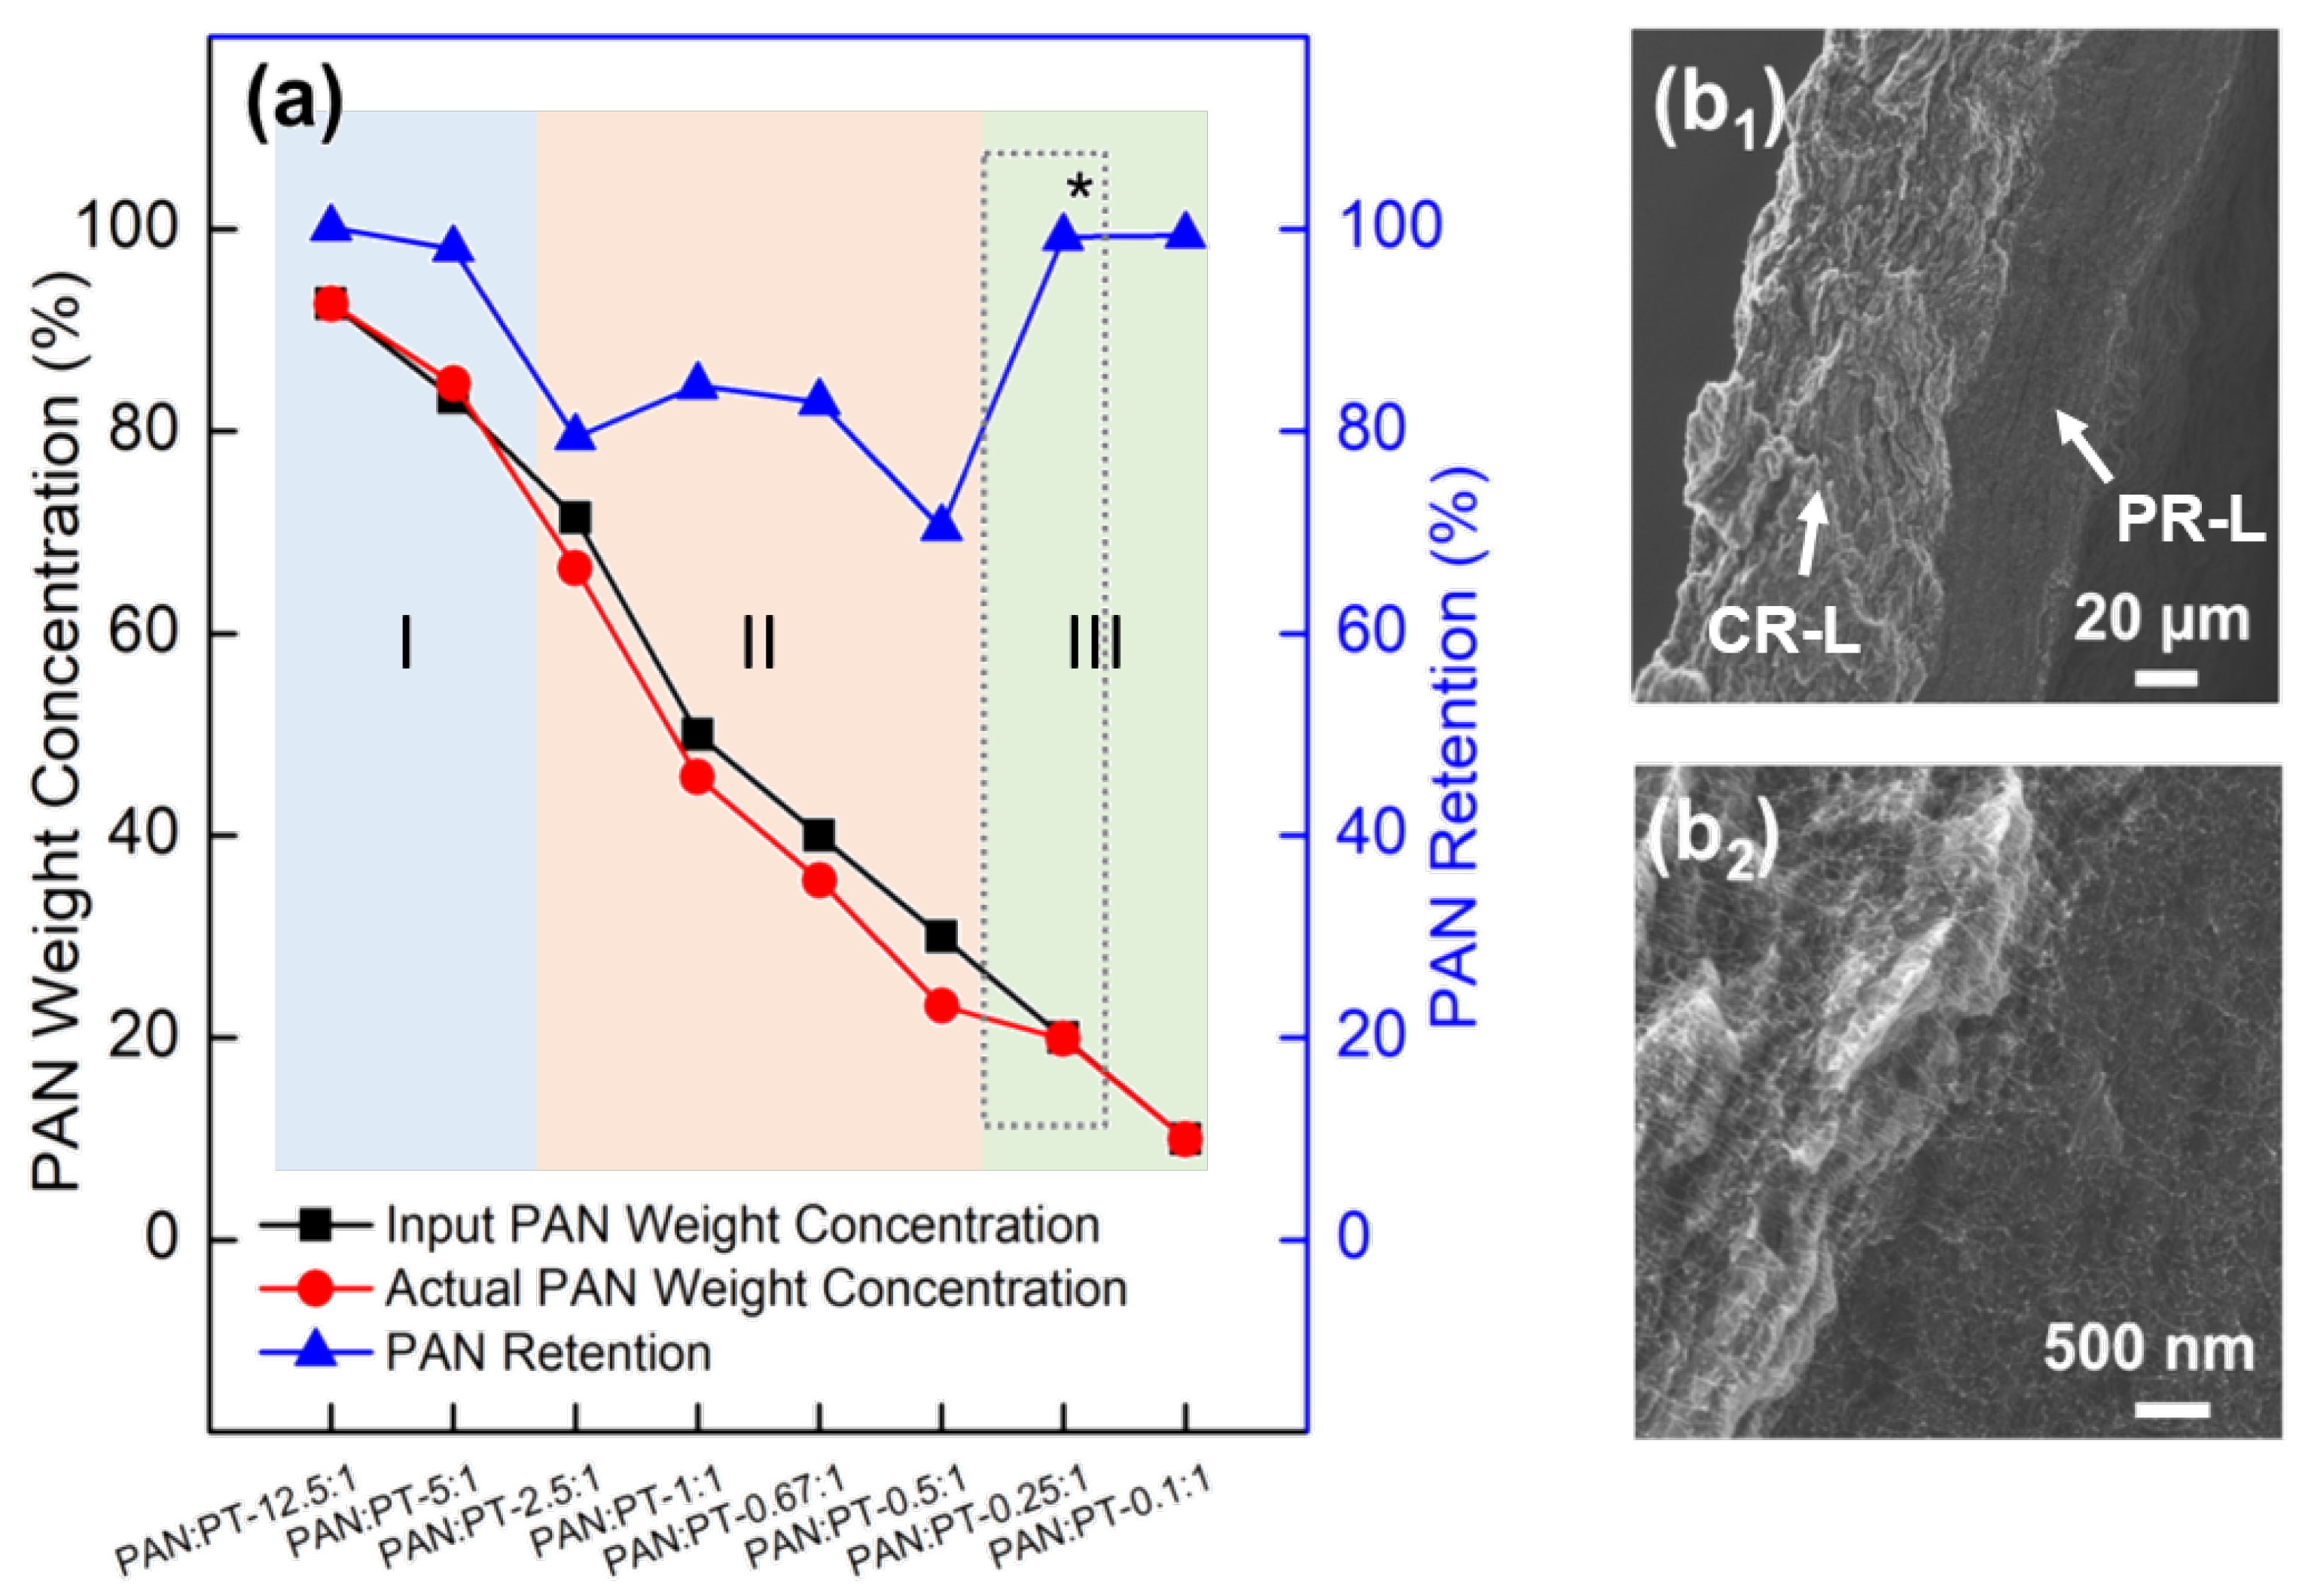
As mentioned, our previous work has shown that the presence of the NS leads to higher PAN retention in hPBP films during filtration to form the layered films. This trend arises due to the change in PAN solubility as solvent composition varies. However, some PAN polymer is lost during the filtration process. PAN retention in the films is tracked during processing. Figure 5a shows the retention curves for all samples, where PAN retention ranges from ∼80% to 100%. By tracking the PAN added and PAN retained in the films as a function of processing (solvent:nonsolvent ratio of 1:2), a trend in retention is observed and categorized into three stages (Figure 4a). During Stage One, the PAN weight concentration is very high. As a result, PAN polymer occludes the filter paper reducing the loss of any non-interacting PAN from the hPBP. In this way, the PRL regions are artificially thicker (Figure 3c,d), but this does not indicate that there is a strong PAN-SWNT interaction, only that the polymer was unable to diffuse through the crowded dispersion/solution during film formation. During Stage Two, as the PAN weight concentration is lowered the overall dispersion/solution becomes less crowded. Therefore, any PAN that is not interacting directly with SWNT is filtered out of the system resulting in a loss of ∼20% PAN. Stage Two observations are important as they confirm previous observations that the nano-filler/polymer interactions are size dependent, where our trapping model shows that for this PAN molecular weight, average SWNT bundle diameters of ∼6 nm or smaller are solvated [20]. With this knowledge, it is clear that not all SWNTs in the dispersion can be solvated by the PAN due to the heterogeneous nature of the filler make-up (i.e, variation in bundle size distribution in the as-received sample and after sonication). For this reason, some PAN loss is expected if the amount of chain molecules required for solvation exceeds the quantity of appropriately sized SWNT bundles. Using this same knowledge it is expected that if the PAN weight concentration/volume fraction is equal to the amount of appropriately sized SWNT bundles a properly blended PRL region will be achieved. If the PAN weight concentration is less than the amount of appropriately sized SWNT bundles, PAN loss will also not be observed, but property trends may indicate that the appropriate blending ratio has been surpassed. The onset of Stage Three in the retention curve likely represents the appropriate volume fraction of polymer to SWNT for ideal blending (i.e., complete PAN polymer solvating SWNT bundles/tubes). This ideal hPBP mass ratio (PAN:SWNT) of 0.25:1 is referred to as v*, and is additionally observed to result in optimal electrical and mechanical properties. It is denoted by an asterisk in Figure 5. Figure 5b shows a magnified version of a two-layered 0.25:1 (v*) hPBP film where clear distinctions of the PRL and CRL regions can be resolved. The PRL is uniform and exhibits well distributed SWNT of even size throughout the PAN matrix. Figure 4a shows the single-layer hPBP film at this ideal blending ratio of 0.25:1.
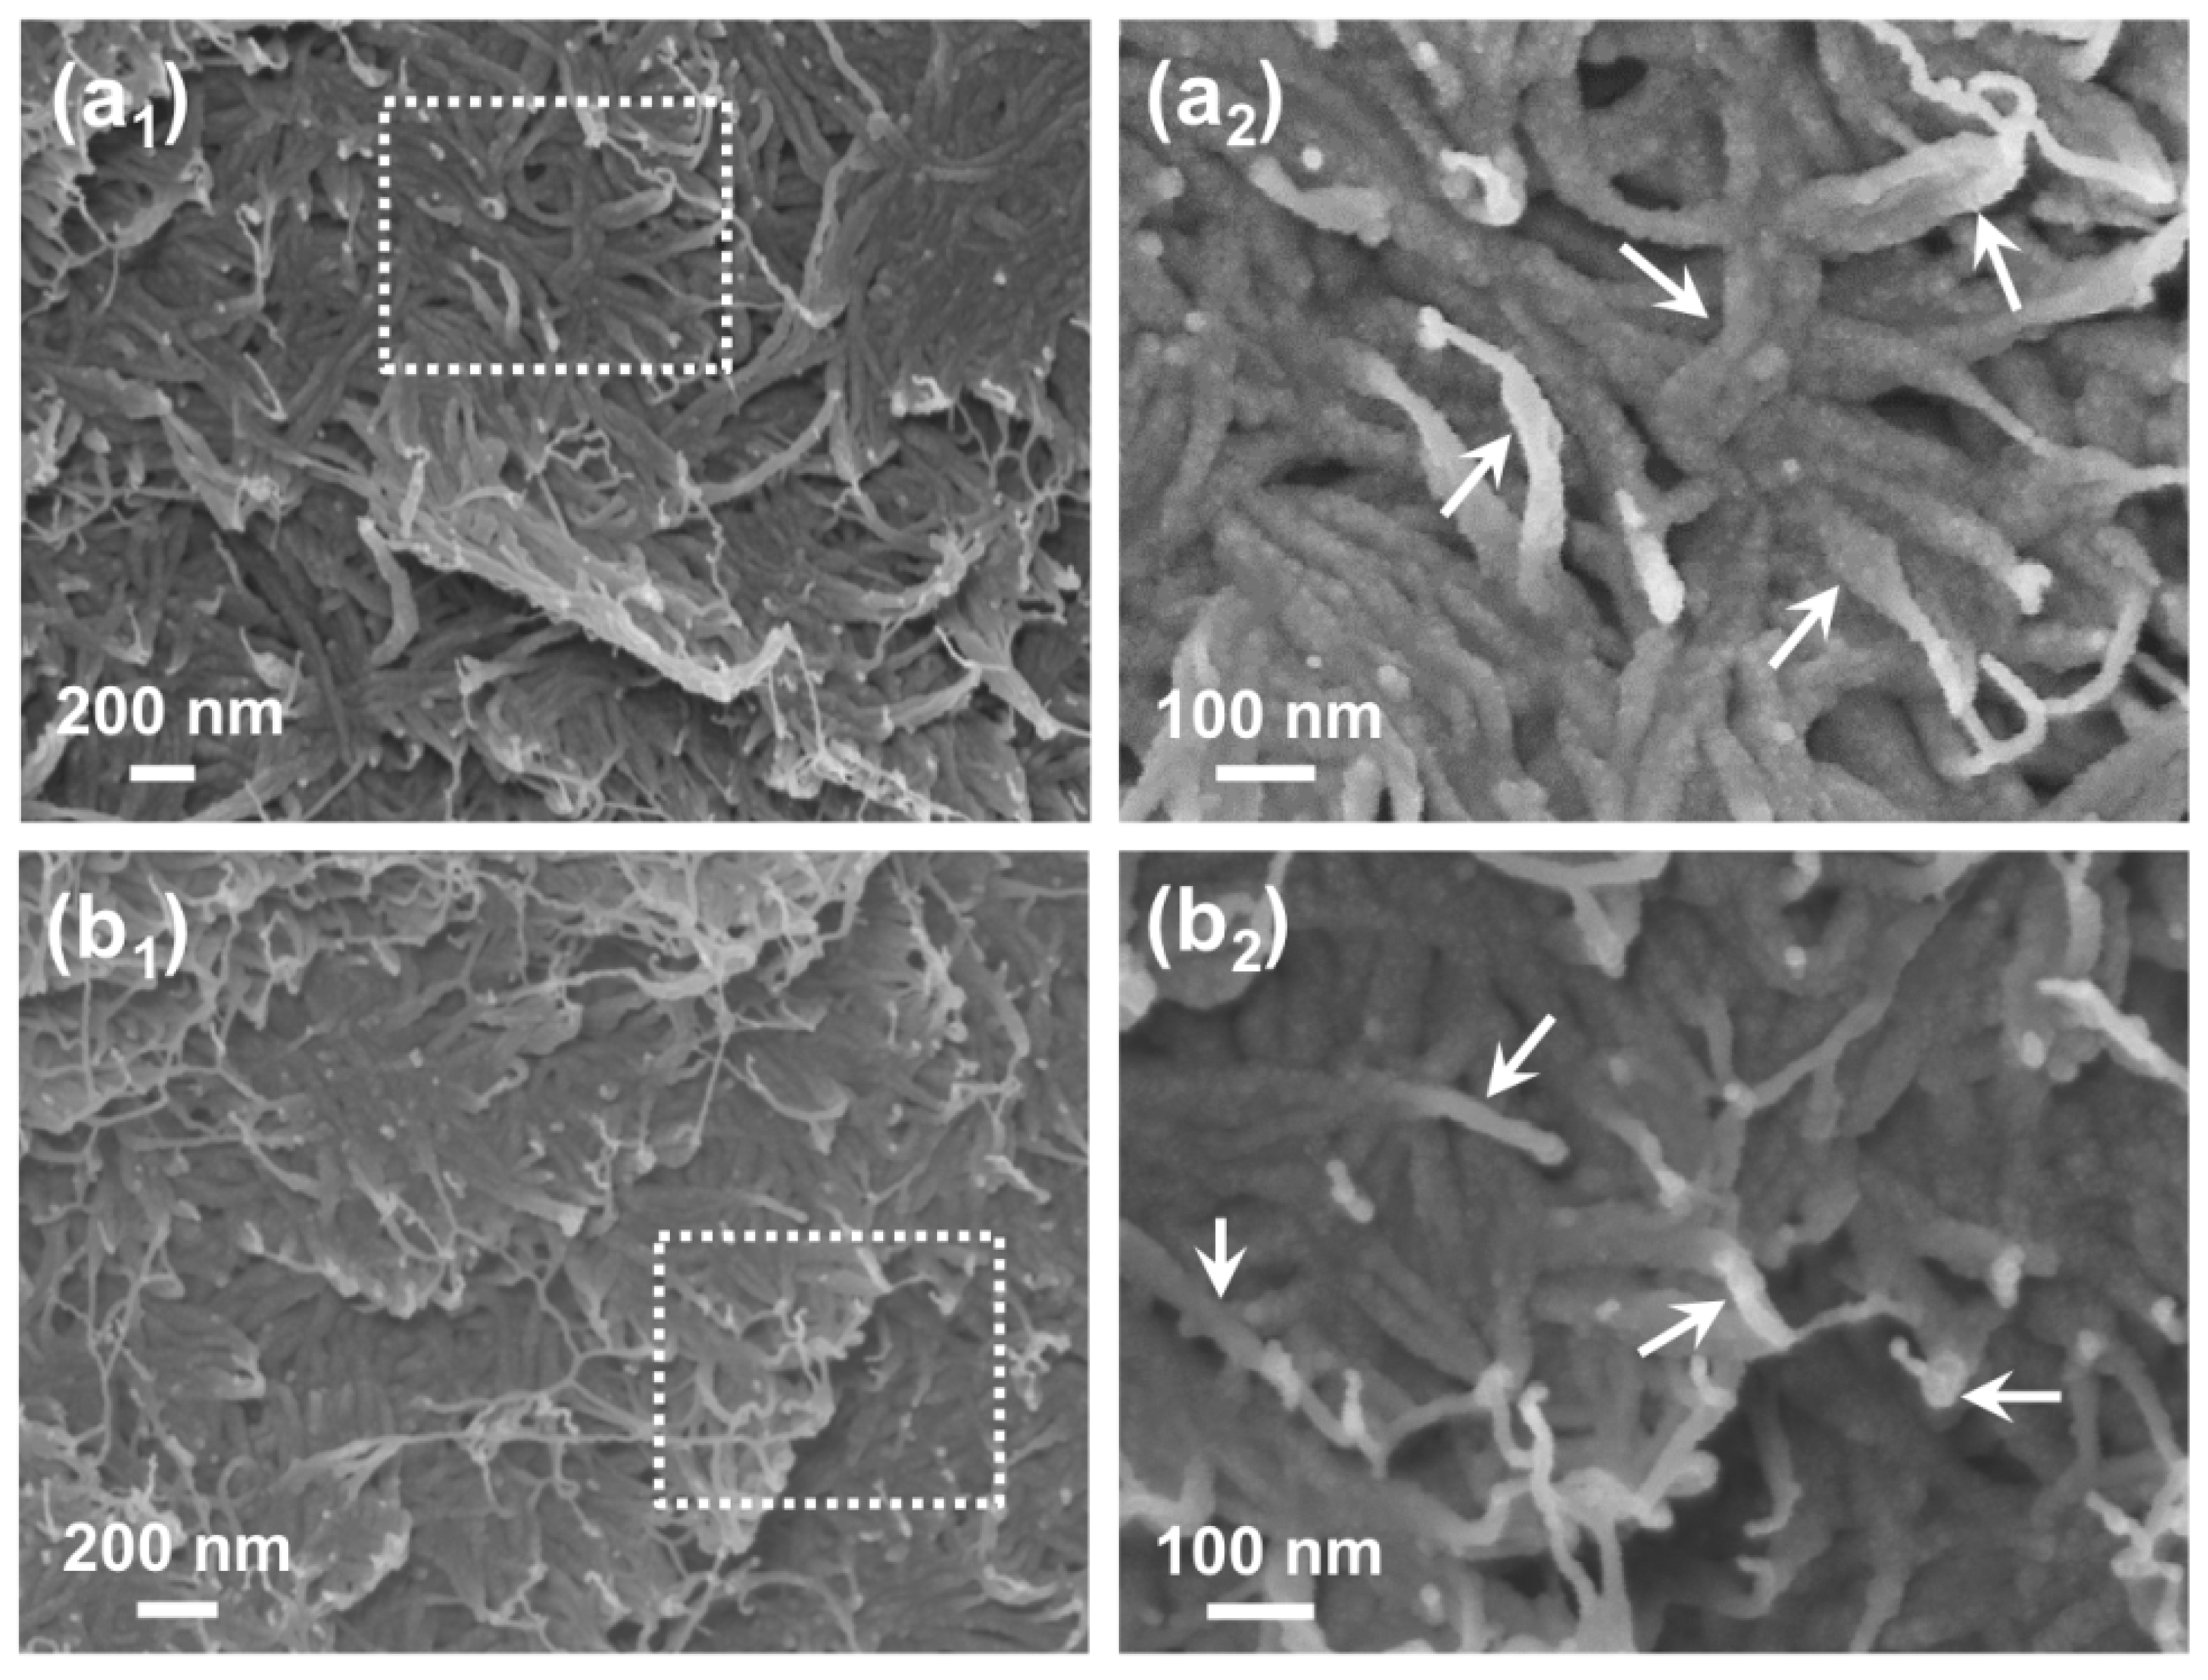
With the assistance of the non-solvent, SWNT below a certain threshold bundle size can be ‘solvated’ by the PAN coils [15]. Solvation is due to the polymers’ preference to interact with the SWNT over the non-solvent environment as well as its ability to accommodate (trap) the SWNT bundle within its available fractional free volume (FFV) [
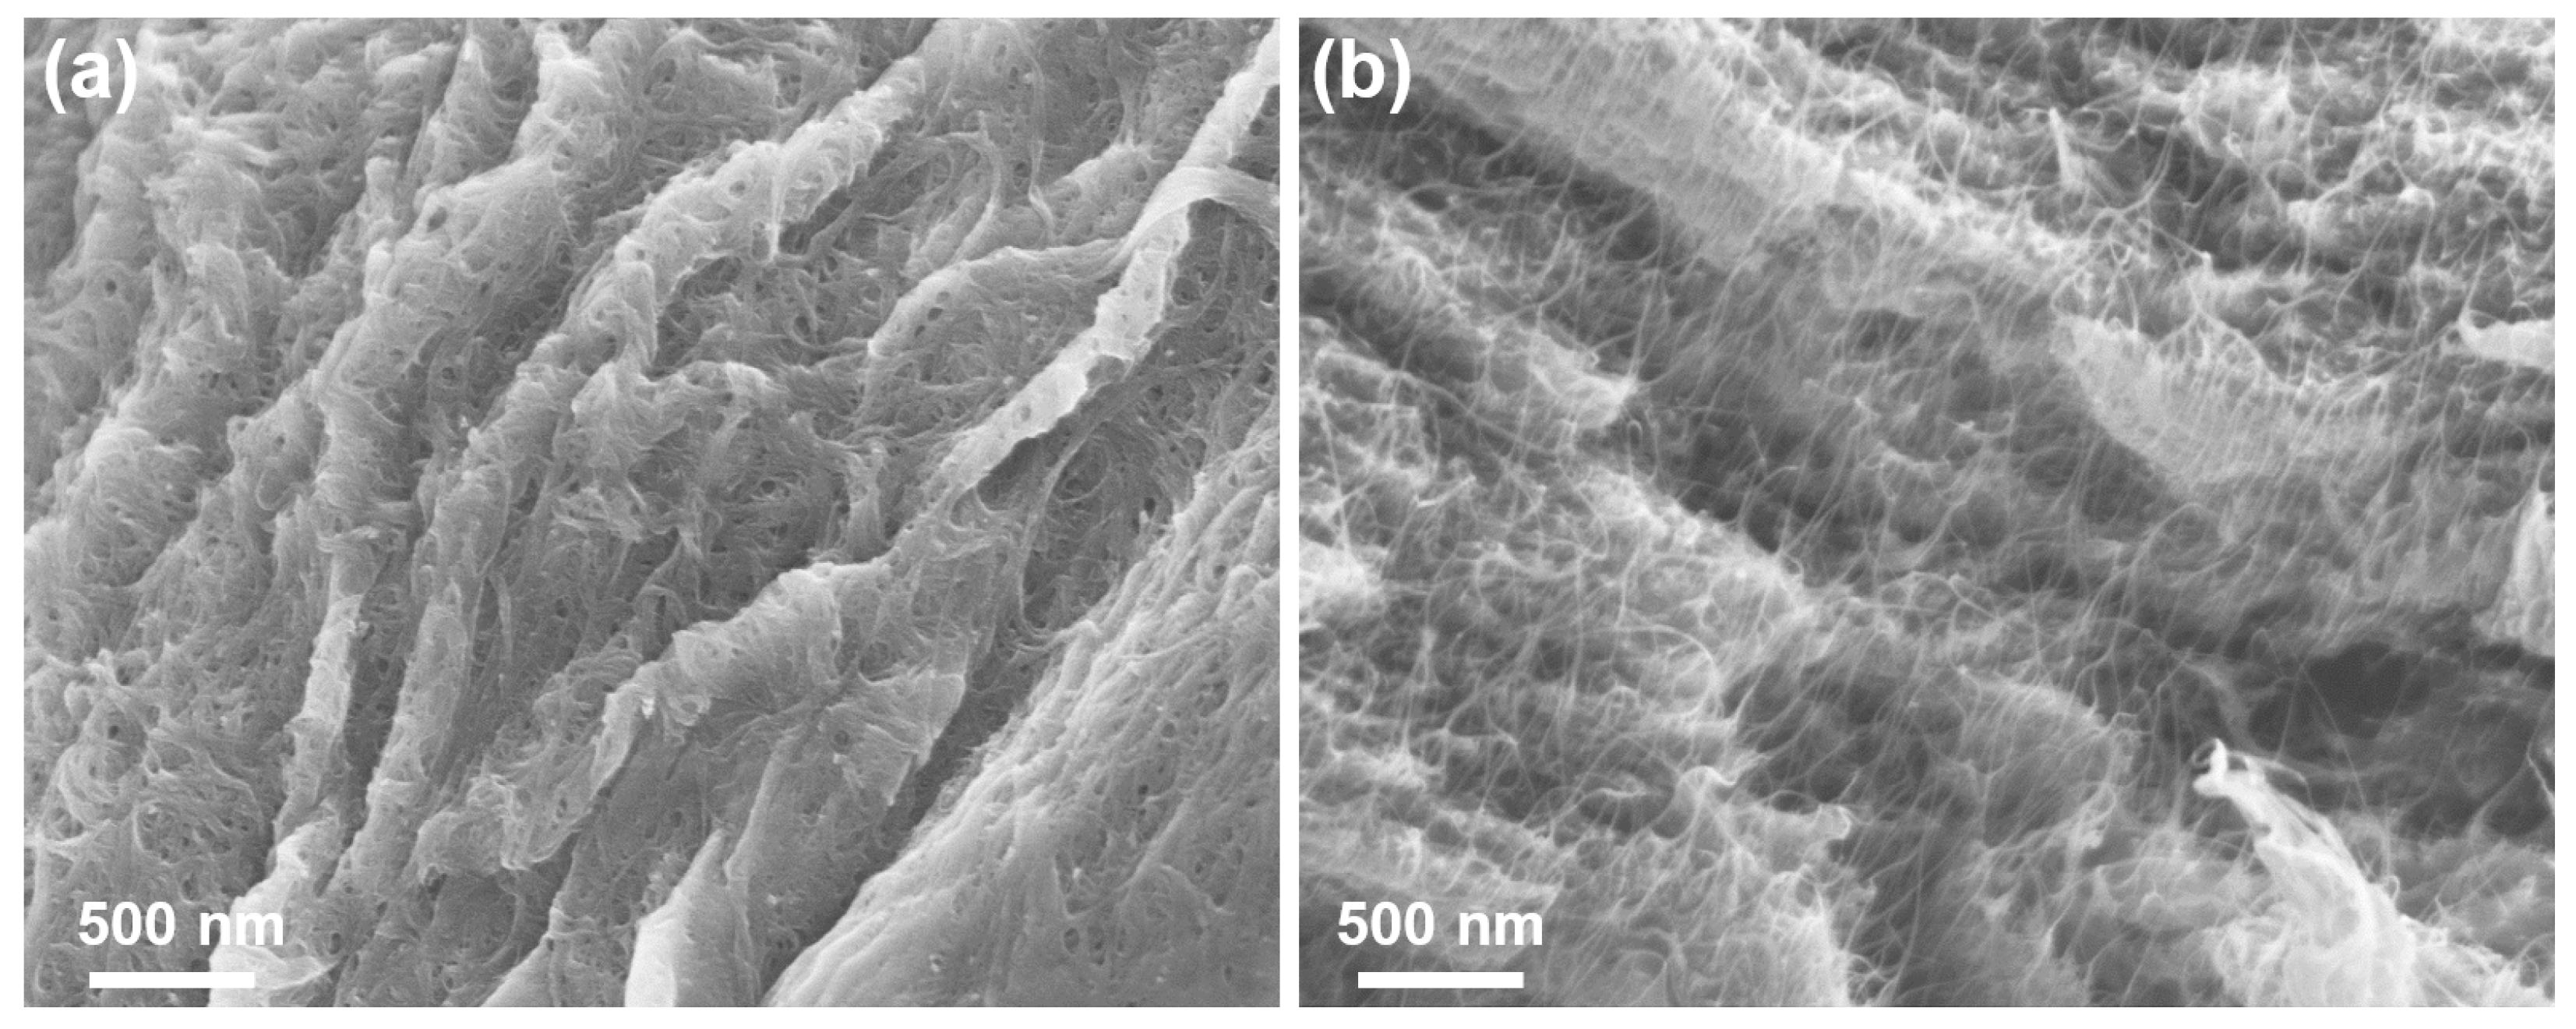
20]. For this reason, the solvated polymer paste was used for a more in-depth observation of the SWNT-PAN interaction during the liquid-solid phase separation before film formation. SEM was performed on freeze-dried 1:1 PAN:SWNT paste samples to visualize the SWNT bundles which have been ‘trapped’ by PAN (Figure 6a,b). It is clear from these SEM images that the PAN polymer in the PRL blended region shows complete coverage of the SWNT bundles/tubes throughout the network. Removal of the solvent via freeze drying allows for direct visualization of this interaction as it would be within the PRL liquid/paste prior to any film formation, which involves (i) some compaction due to the vacuum used in filtration as well as (ii) subsequent slow drying/removal of solvent in an oven which would result in changes in the polymer morphology (i.e., crystallization). Given this unique morphology for the hPBPs and the evidence for the blended phase (PRL), several studies were performed to characterize its properties toward elucidating blend behavior.

3.2. Electrical Characterization of hPBPs

The electrical properties of the hPBP materials were evaluated. Electrical behavior is strongly related to internal microstructures developed during processing [20,22,23,24,25]. However, literature studies are primarily focused on percolation phenomena of CNTs in the polymer matrix (i.e., CNT content < 0.1 vol%). Typical values for electrical conductivities of BPs and polymer composite BPs with respect to filler loadings are provided in Table 1.
For semiconducting materials, the effect of contact resistance is eliminated, making it necessary to separate the current and voltage contact points of the probe. For this reason, a four-point-probe method is used to measure DC electrical conductivity through each side (i.e., free surface) of the samples to understand the electrical properties for both PRL and CRL regions. The layered structures of the hPBP sample films (Figure 3) provide an appropriate morphology to enable this study. A geometric correction factor (G) is required and needs to be determined according to sample dimensions. Geometrical models for thin rectangular slices were used for these electrical measurements and calculations given the macroscopic film morphology. According to this model, the body resistivity ( ρ ) can be calculated using Equations (1) and (2) [26].
ρ = G · V I
G = t · C ( a d ; d s ) a n d t s 0.5
Here I is current applied, V is voltage measured and s is the spacing between the probe tips. Parameters a, d, and t are the sample length, width, and thickness, respectively. C is the correction factor accounting for the relationship between the sample and probe dimensions [26]. On average specimen thickness is below 70 µm, and satisfies the condition of Equation (1) to calculate bulk resistivity. C is determined to be 0.9994 across all samples. Bulk electrical conductivity ( σ 
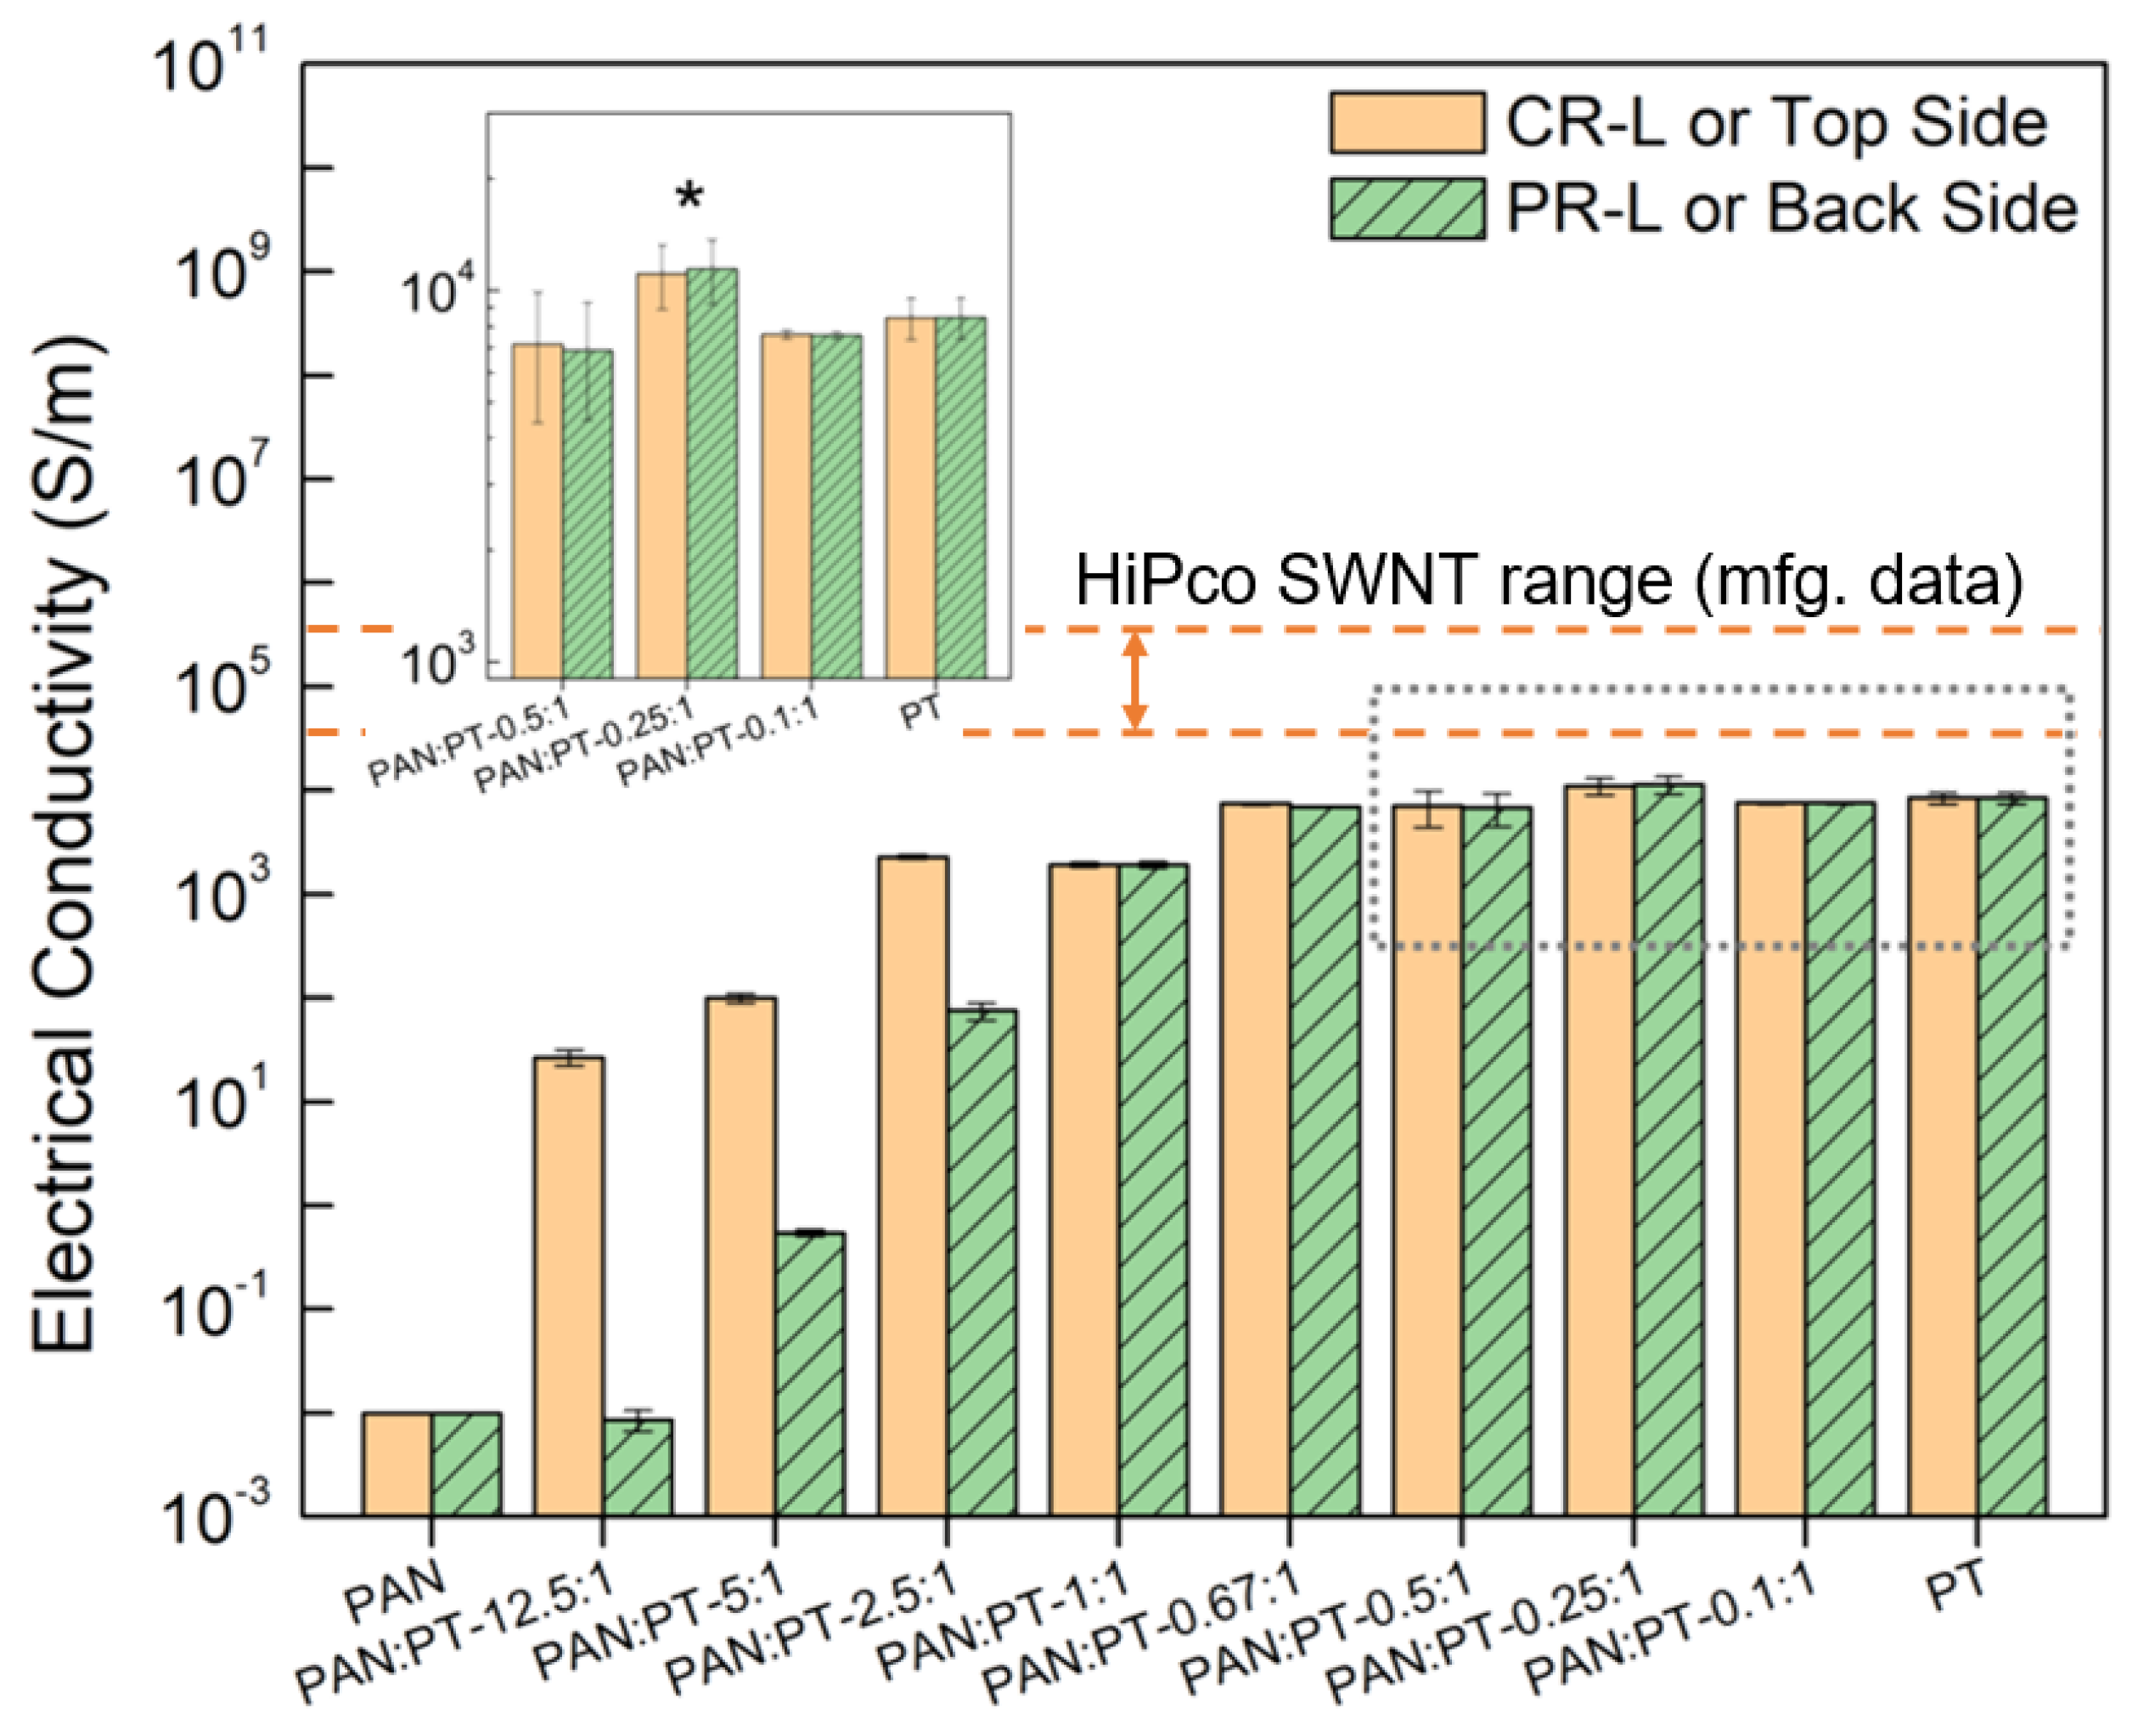
) is taken as the inverse of resistivity. Results for all samples are shown in the bar plot in Figure 7.
As expected, the control PT-BP sample exhibits a high electrical conductivity as compared to the PAN cast film. For PT-BP, the average bulk electrical conductivities are measured from free surfaces of the top and bottom sides. The free-surface results are comparable; measured at 8.45 × 10 3 S/m and 8.48 × 10 3 S/m, respectively, for the top and bottom. These values are also comparable to the bulk conductivities calculated from the resistance values for HiPco SWNT BPs provided by the manufacturer [28]. PAN cast films also show comparable but low conductivity values for the top and bottom sides of the sample. In analyzing the properties for the hPBPs, some different trends emerge. Considering that the films exhibit a layered morphology where the CRL consists primarily of SWNT, while the PRL is predominantly PAN polymer with SWNT, it is expected that each layer would show different electrical behavior. This layer dependent behavior is observed for the sample with a higher PAN ratio (e.g., 12.5:1, 5:1, and 2.5:1). However, at all lower PAN weight concentrations, the CRL and PRL behaves similarly with no siginificant difference in bulk conductivity. This may be attributed to the refined morphology (i.e., uniform dispersion and size of SWNT and even distribution in the polymer matrix) that is present in the PRL region as the PAN and SWNT blend into a homogenous phase.
Statistical percolation theory based on a lattice of identically sized filled/unfilled states shows that a transverse path of a filled state can be expected to form when the percentage of filled states reaches a level of ∼59.28% [29]. Based on PAN and SWNT densities of 1.18 and 1.6 g/cm3, the volume percentage of the SWNT reaches approximately this level (59.6%) at the weight ratio of 0.5:1, and will further increase with decreasing polymer weight fraction. While the influence of the node shape (in theory a perfect cell, in practice free form 1-D shape) has not been accounted for in this work, the apparent correlation between this theoretical threshold and the observed conductivities supports the conclusion of a fully percolated blended phase.
Previous work as well as the SEM image analysis (Figure 3 and Figure 6) confirms that the CRL and PRL morphologies in hPBPs are not similar despite the convergence of electrical conductivity. The results also show that as the overall hPBP PAN weight concentration is decreased the PAN retained in the PRL produces a region of high PAN weight concentration which has a more direct interaction with the SWNT forming a blended phase (Figure 5). In addition, the dispersion of SWNT in this PRL is uniform in terms of the network formed throughout the region and bundle size.
At the ratio v* (0.25:1 hPBP), the electrical behavior in both PRL and CRL regions shows the best performance with both layers at the highest refinement. First, the PRL consists of PAN blended with SNWT at the appropriate ratio, as well as the appropriate SWNT bundle size to allow for the PAN to completely solvate the filler. In this way there are no agglomerations or defects. Second, the CRL is also more refined in terms of SWNT bundle network considering the SWNT solvated by the PAN. The 0.25:1 weight concentration seemingly results in the highest amount of polymer/filler interactions as the filler majority ensures the availability of enough ideal SWNT bundle sizes for complete PAN/SWNT solvation to take place. This complete solvation prevents excess polymer from agglomerating or otherwise causing defects. The CRL of the 0.25:1 hPBP also exhibits the greatest refinement of all weight concentrations tested.

3.3. Thermal Characterization of hPBPs

Differential Scanning Calorimetry (DSC) was performed on samples of various paste films, hPBP films, and PAN morphologies from 0 to 450 °C at a ramp rate of 1 °C/min in an inert (i.e., nitrogen gas) environment. This process is used to simulate a stabilization process for PAN. The intent of this study was to provide further evidence for the existence of interphase PAN within the hPBP and specifically within the PRL. In the production of graphite and carbon fiber, stabilization refers the process of slowy ramping the precursor material (in this case PAN) from room temperature to ∼250–300 °C. This heat treatment allows exothermic reactions such as cyclization and dehydrogenation to take place, converting the individual PAN polymer chains into a cross-linked ladder structure capable of withstanding higher carbonization temperatures (900–1100 °C). In DSC, this process can be catalogued by tracking the exothermic peaks revealed during the temperature ramp.
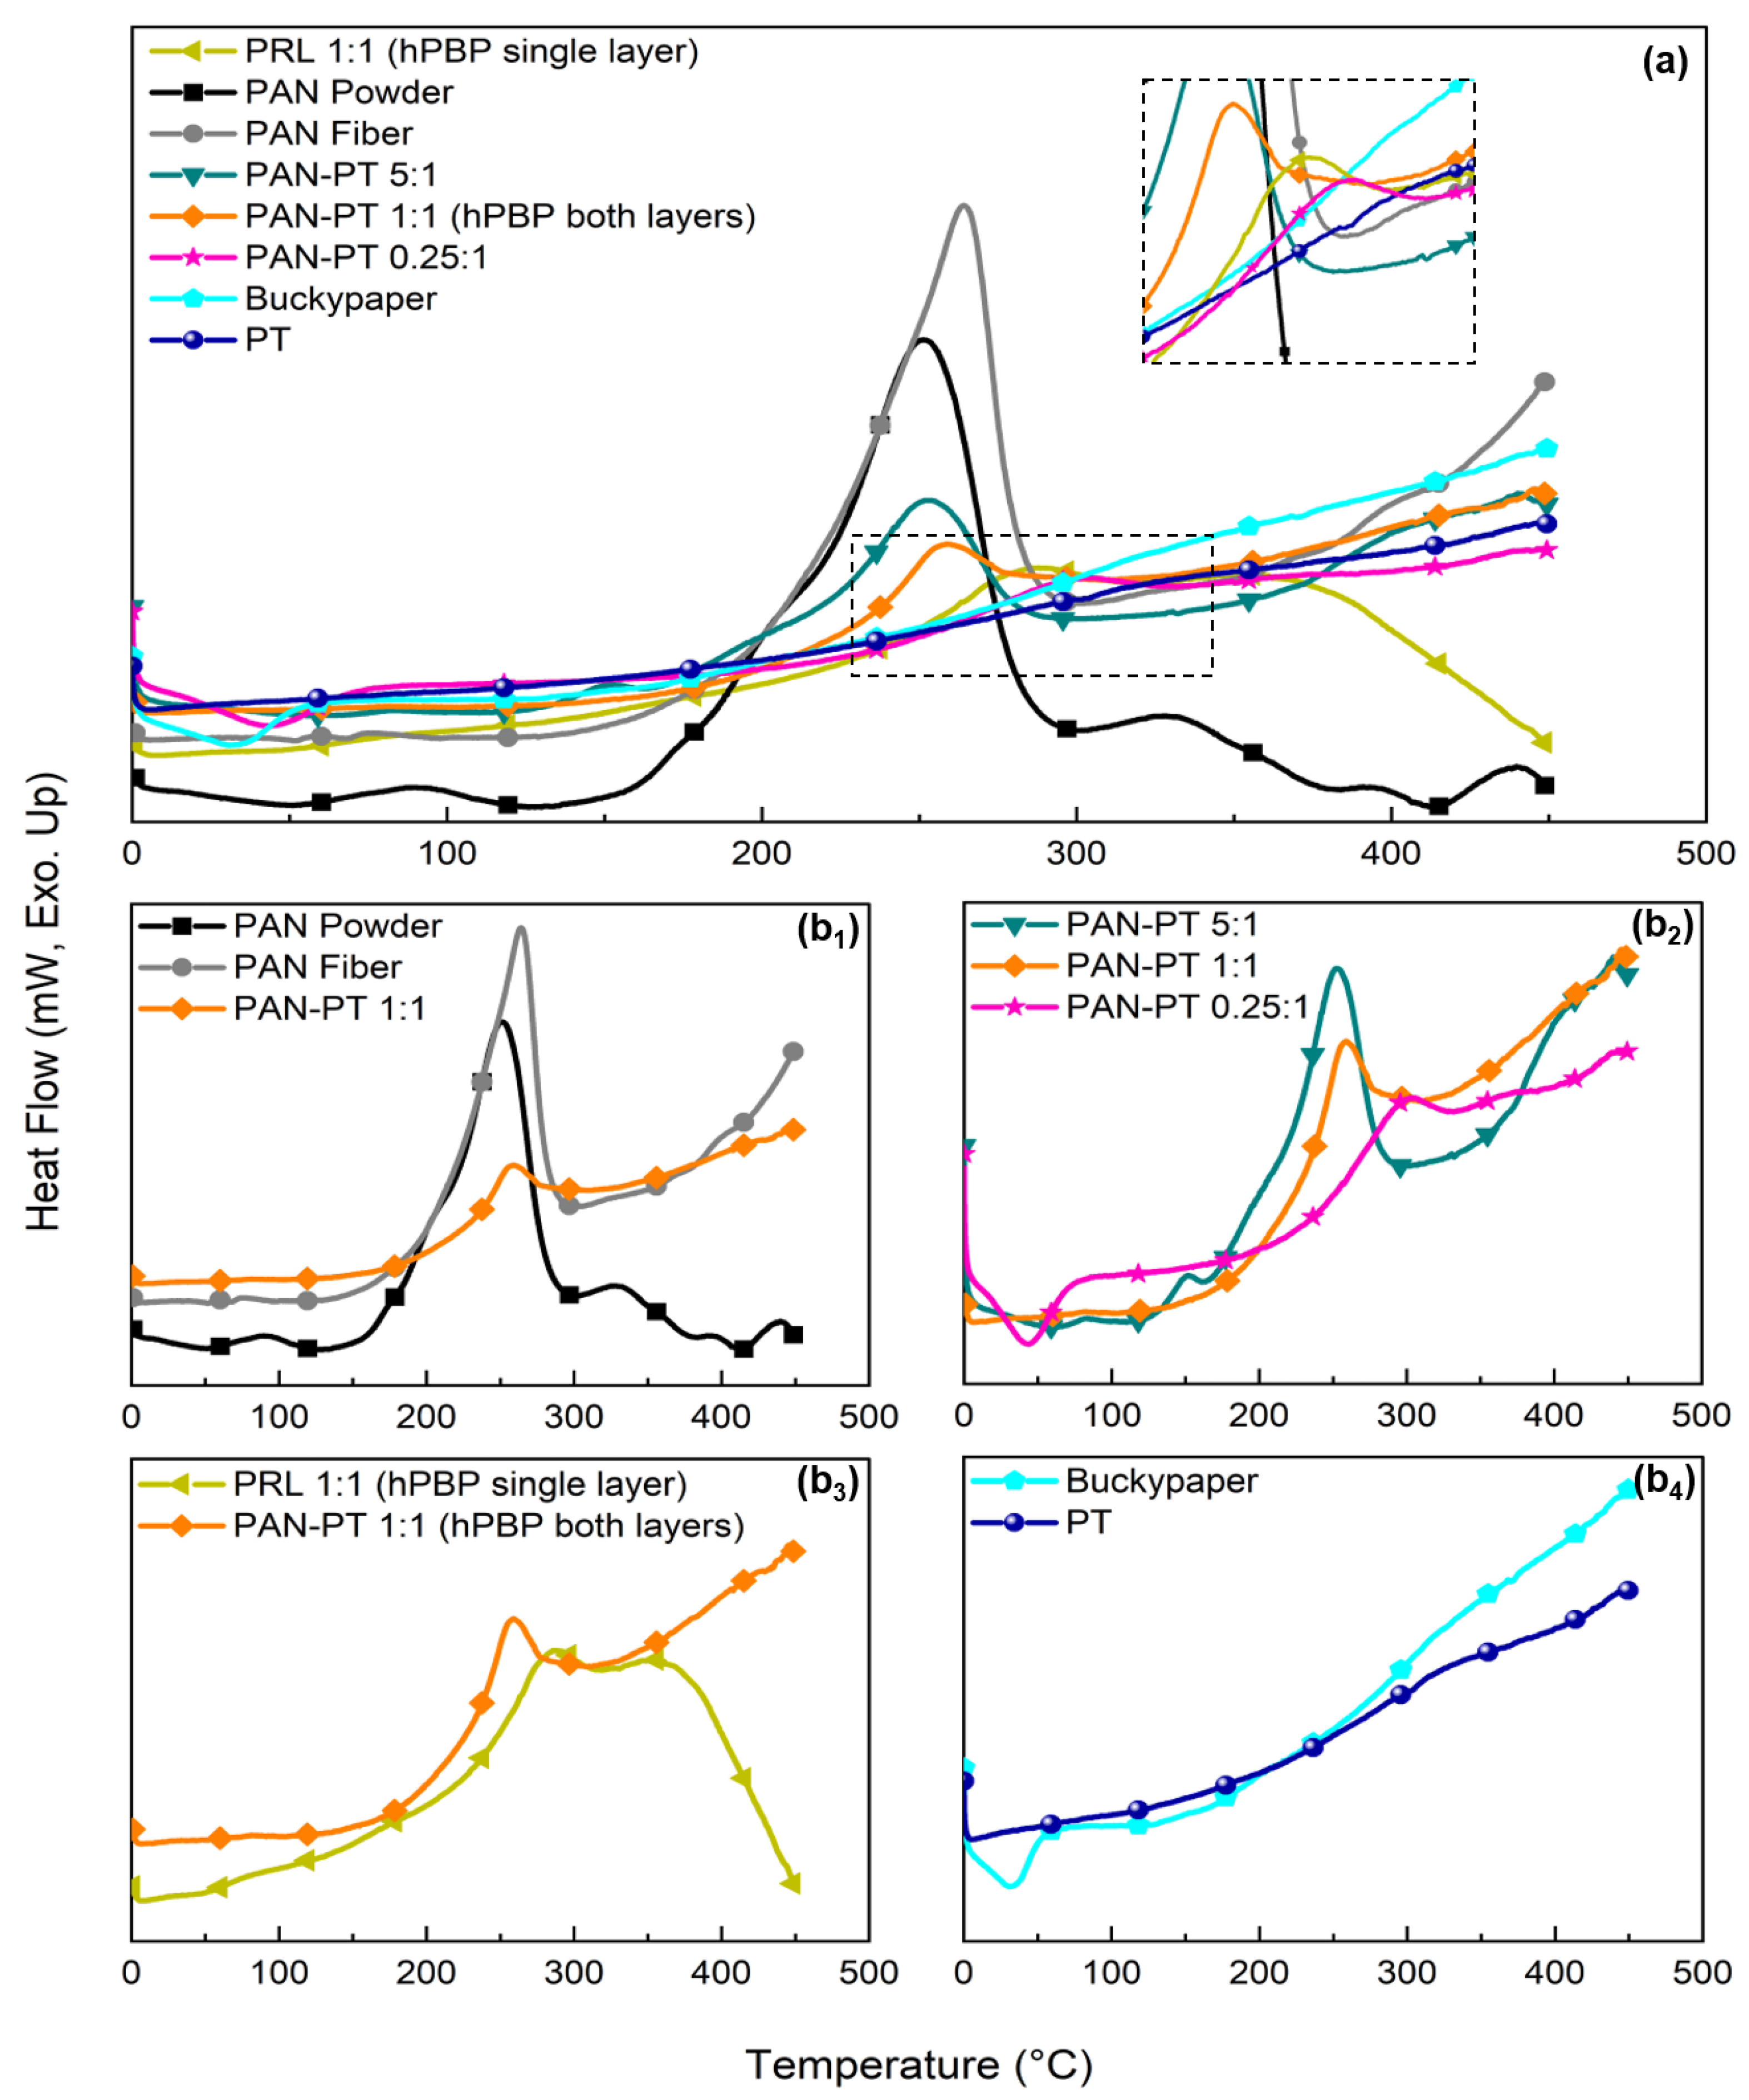
Figure 8 compares 1:1 hPBP film with both as-received powdered PAN and PAN fibers via wet spinning. The purpose of this comparison was to investigate the influence of process induced confinement on the exothermic peak’s maximum temperature and latent heat associated with the reaction. Depending on the process in question, this confinement may be caused by a number of different mechanisms. In the case of the PAN fiber, the drawing process causes chain alignment and long range ordering, both of which may result in increased confinement. Alternatively for the PAN/SWNT composites, confinement results from the formation of epitaxially-templated interphase polymer regions during sonication. The results show a shift in the exothermic peak temperature for both the PAN fiber and all hPBP concentrations, suggesting a directly proportional relationship between chain confinement and peak exothermic temperature. As confinement of the polymer chains increases, the peak shifts to a higher temperature [30,31]. Observed latent heat is significantly lower for the hPBP due to the presence of the SWNT, which does not undergo a phase change, as well as lower PAN weight concentrations.
Figure 8(b2) depicts DSC curves of three representative hPBP weight ratios. Reducing the polymer loading increases the shift in exothermic peak temperature. This is attributed to a higher probability of interphase templating due to the increased availability of favorable SWNT bundle sizes relative to the polymer chains. Figure 8(b3) compares a 1:1 PAN:SWNT hPBP to a single-layer PRL ’paste’ film of the same ratio. The paste film procedure eliminates the CRL, leaving behind just the blended PAN and SWNT in the PRL. Figure 8(b4) examines the DSC curves of neat buckypaper and PT SWNT to verify that the SWNTs themselves lack any impurities that may be causing an exothermic peak. It should be noted that the endothermic peaks less than 50 °C are attributed to residual solvent that was not completely expunged during vacuum oven drying of the BP an hPBP samples.

3.4. Mechanical Characterization of hPBPs

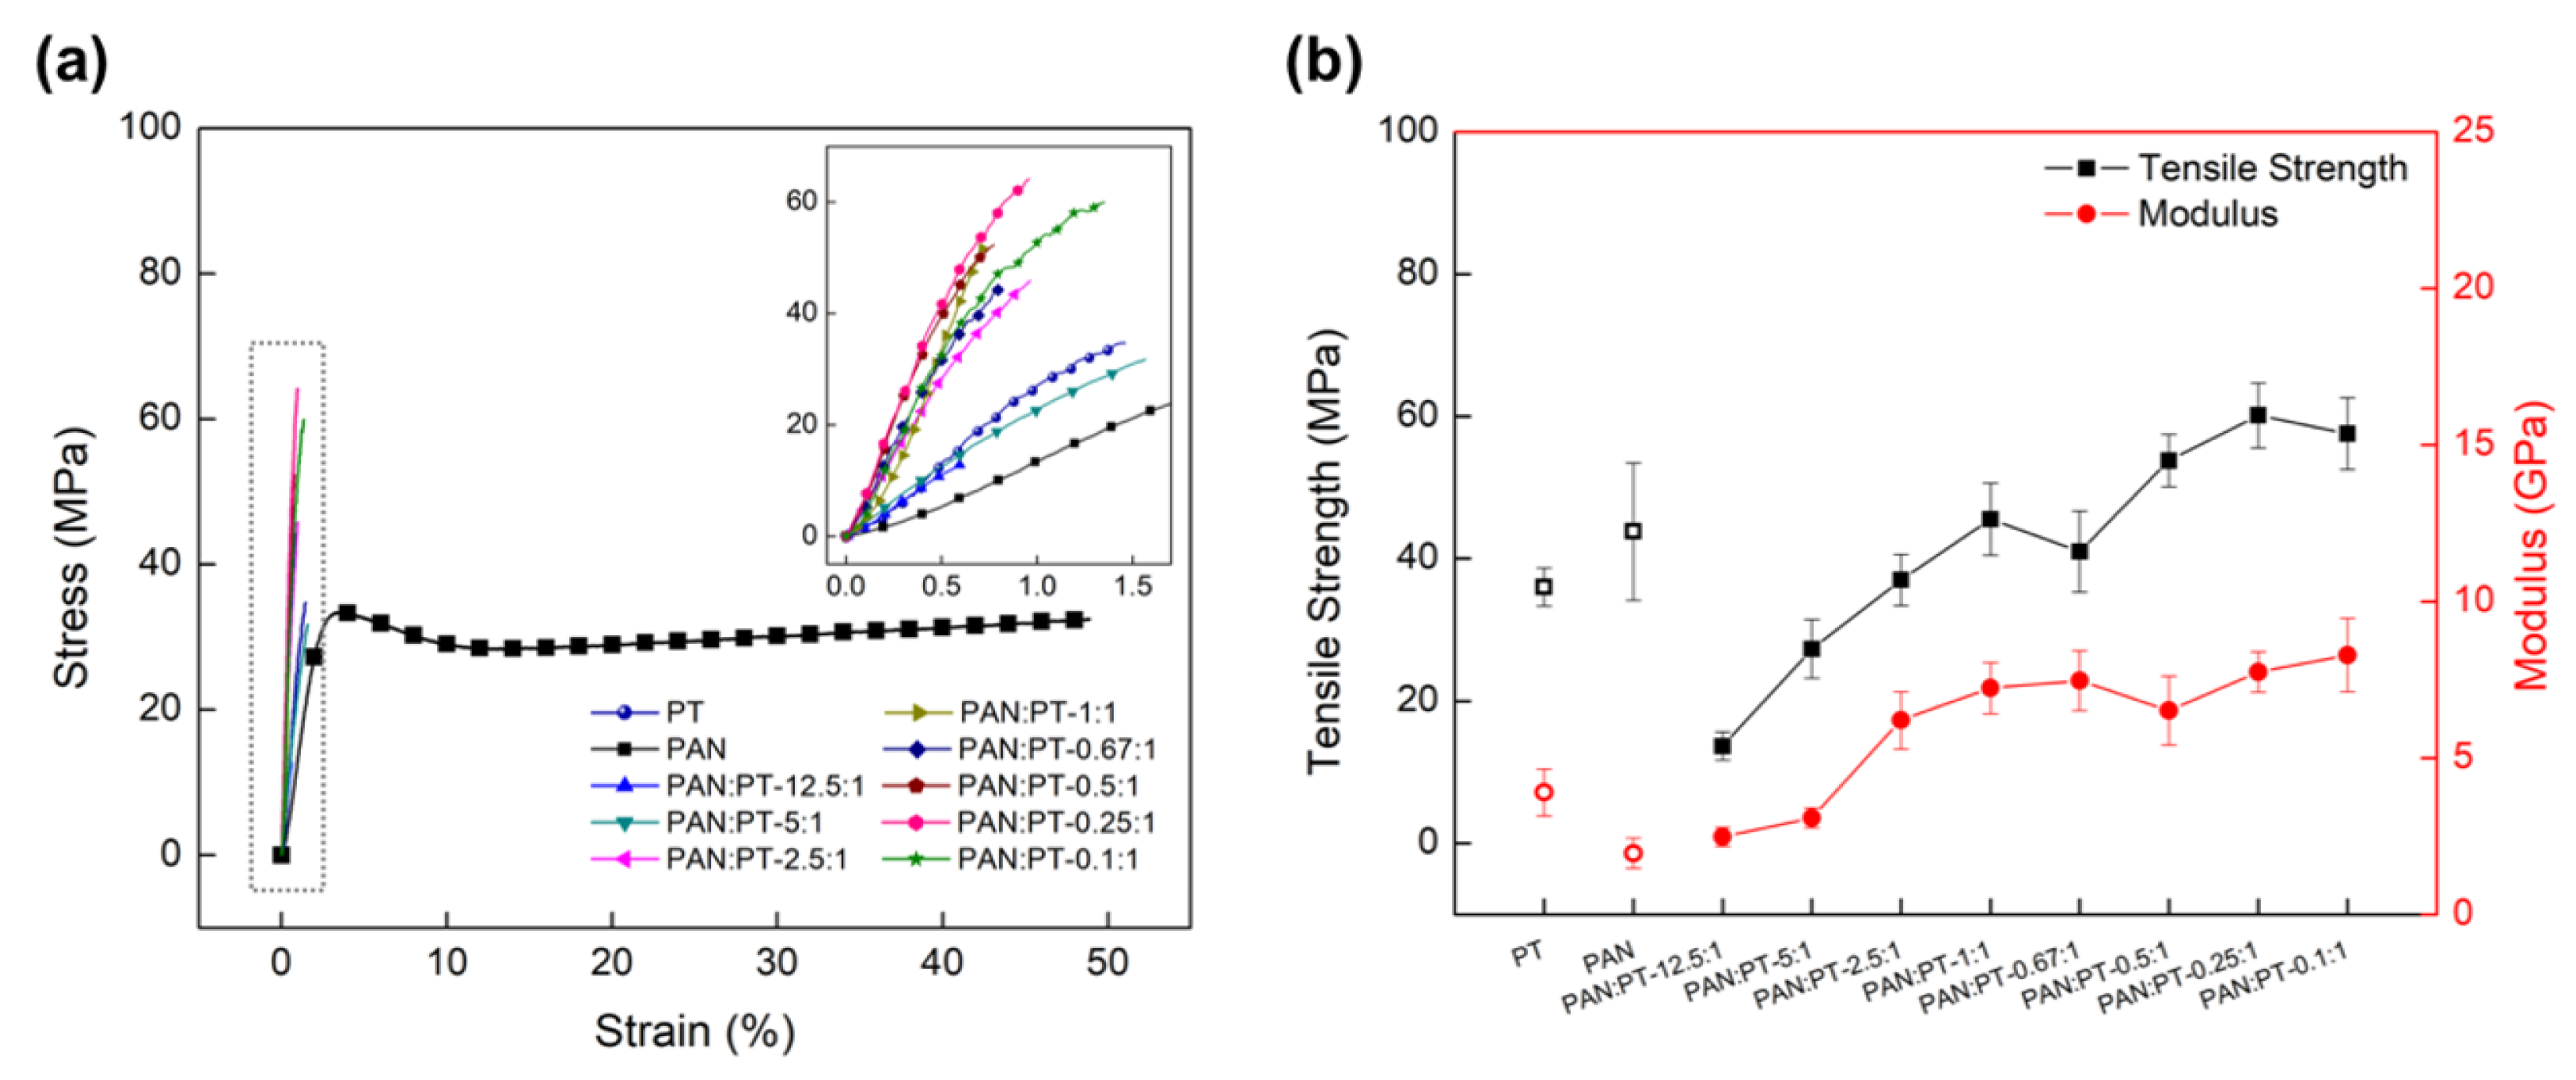
The tensile properties of hybrid BPs with different PAN weight concentrations were evaluated through quasi-static tensile tests and compared with the neat PAN film and PT buckypaper. Representative engineering stress-strain (S-S) curves are shown in Figure 9a, as well as average values for tensile strength and modulus (sample size = 5) in Figure 9b. The neat PAN film shows standard viscoelastic behavior typical of an isotropic polymeric film under tension, exhibiting initial elastic region, yielding, strain hardening, and ultimate fracture. A large elongation-to-break tensile strain (50%) was observed. In contrast, the BP and hybrid BPs experienced brittle fracture with elongation-to-break ranging from 0.7 to 1.6%, similar to ceramic materials. The difference in tensile strain for all hybrid BPs compared with the neat PAN film, including PAN:PT-12.5:1 (92.6 wt%PAN), indicates that inclusion of SWNT greatly reduced the ductility of the composite film.
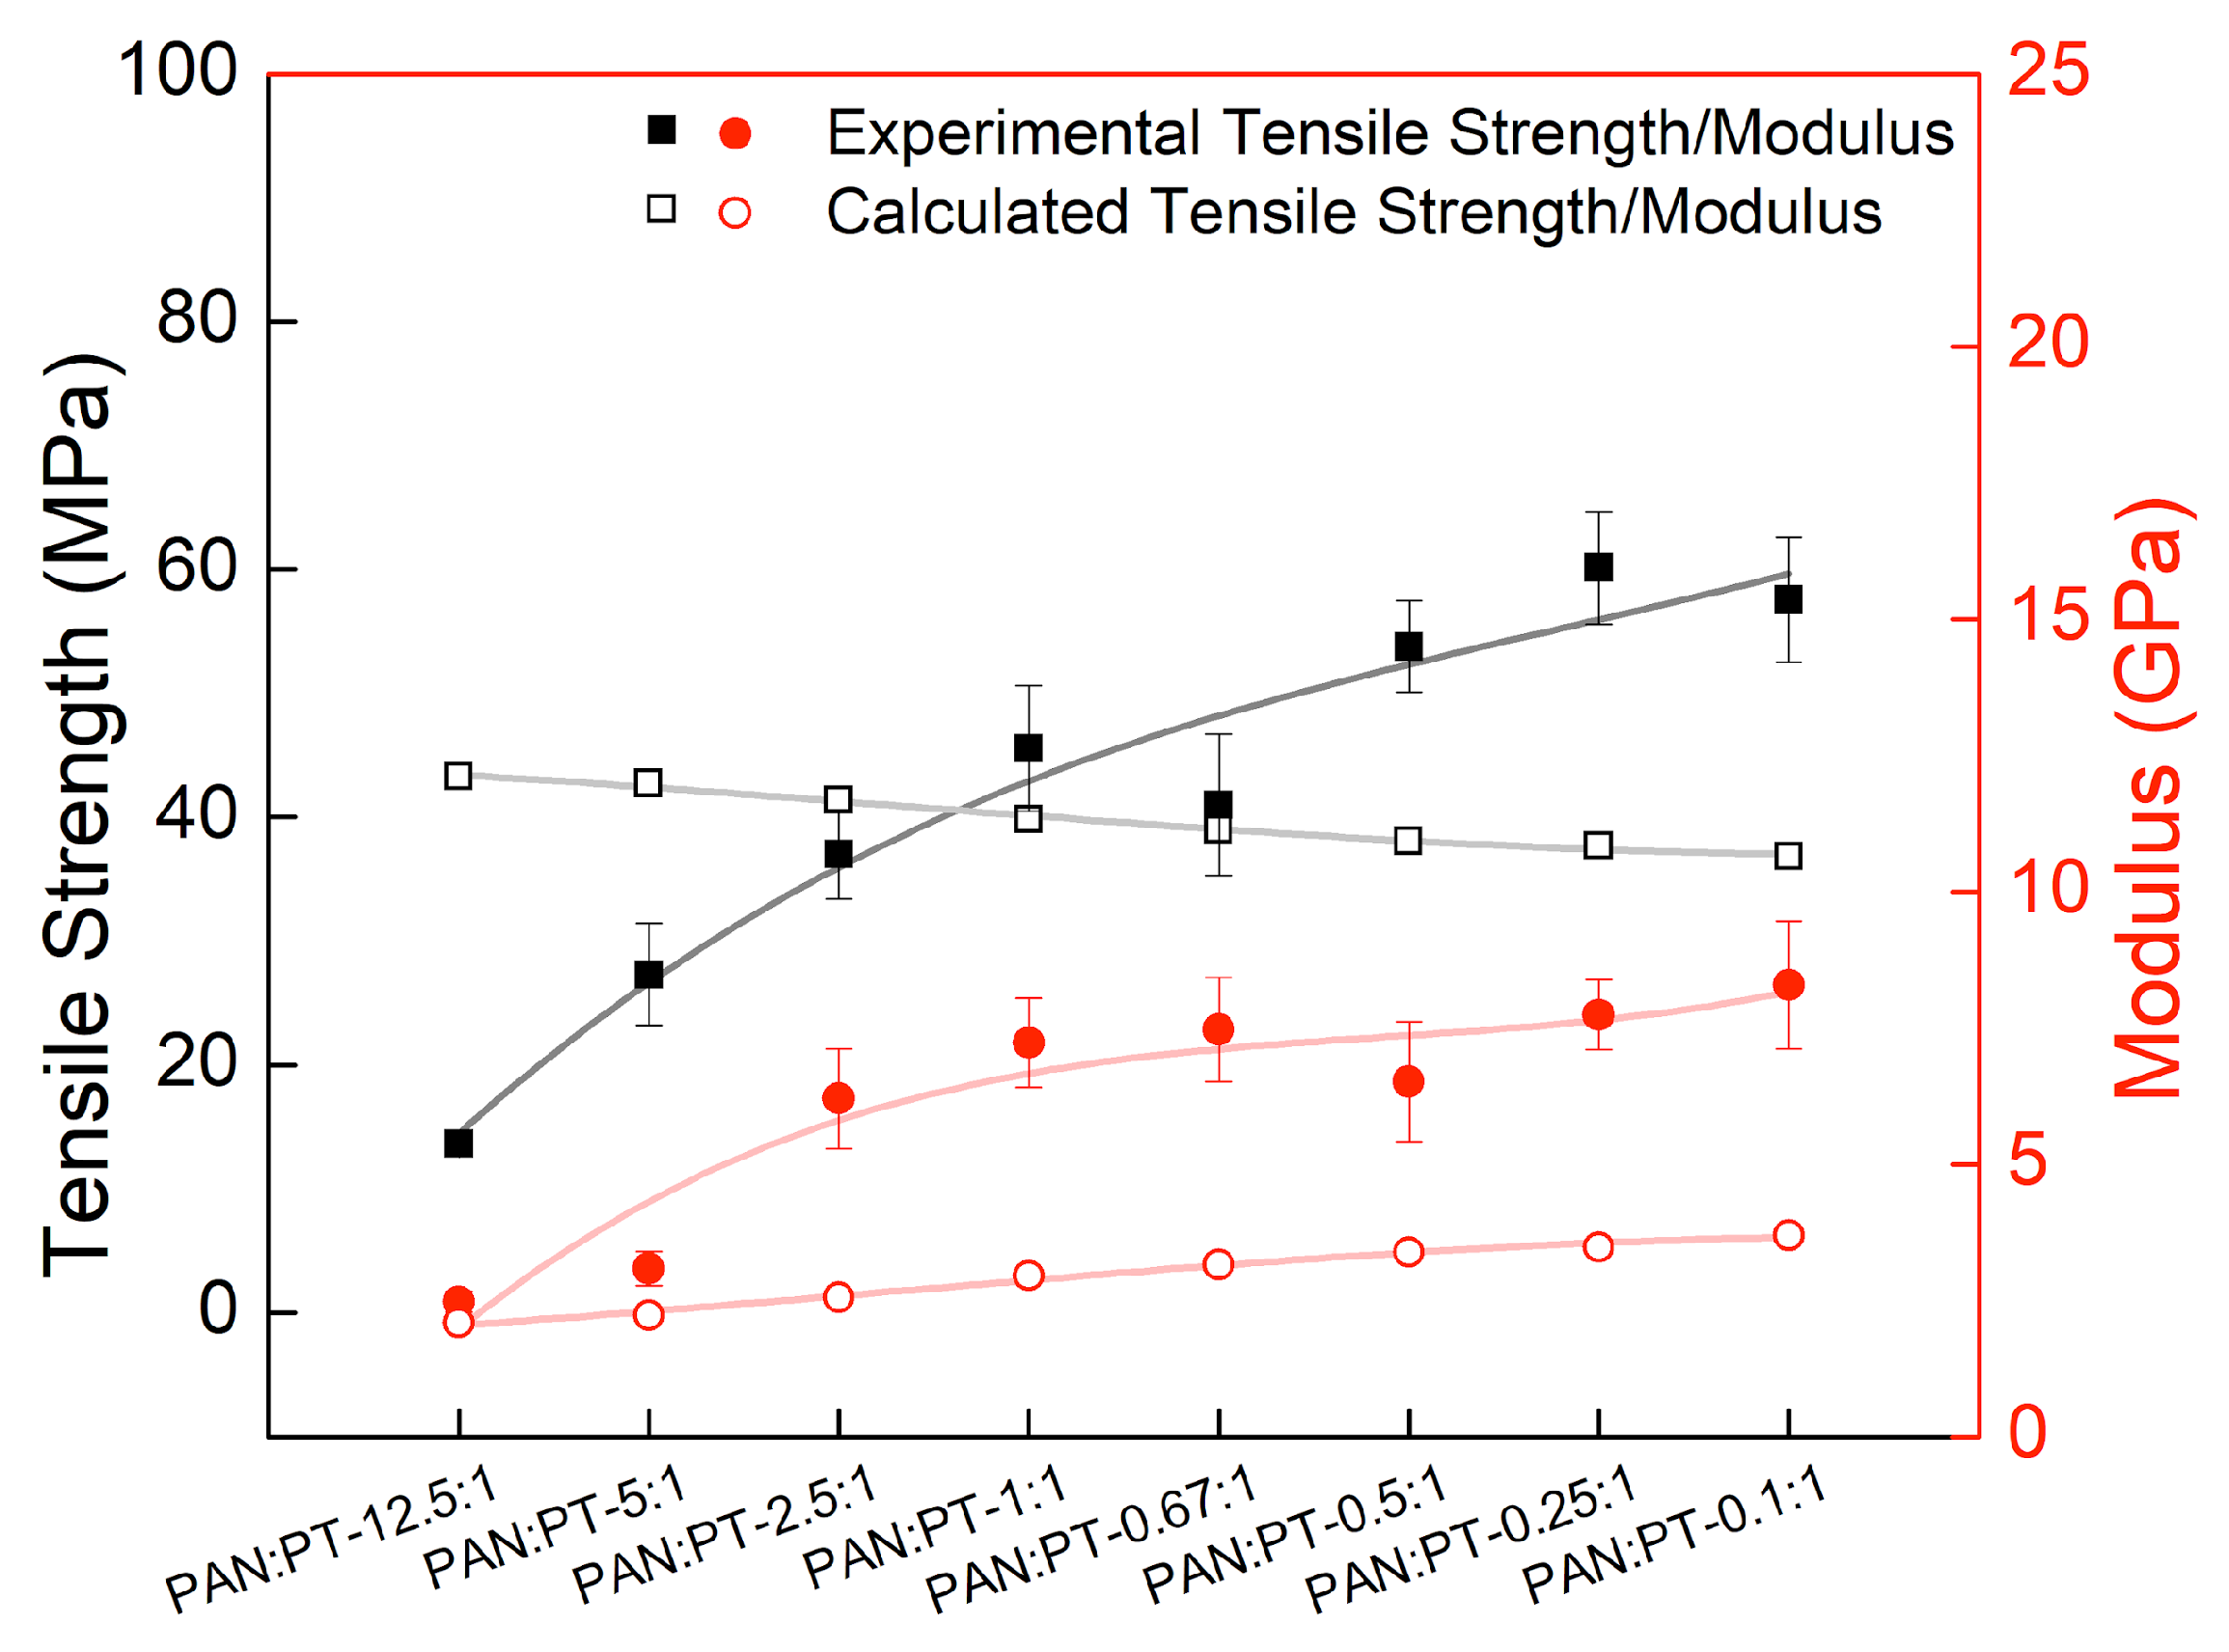
Based on the rule of mixtures (Equation (3)), the theoretical tensile strength and modulus values were calculated and compared with experimentally obtained values (Figure 10).
χ c = ν f · χ f + ( 1 ν f ) · χ m
Here, χ represents either tensile strength or modulus, with subscripts c, f and m denoting the composite, filler (SWNT) and matrix (PAN), respectively. The symbol ν f represents the volume fraction of the filler. Volume fractions were calculated using the mass loading ratios and densities of each constituent. The strength and modulus of the filler and matrix in Equation (3) are taken to be the experimentally measured values of the control PT BP and PAN films, respectively. It should be noted that the rule of mixtures as presented in Equation (3) has historically been used to obtain an approximation of the predicted material properties of a composite based on those of its constituents [32,33,34]. Due to its simplicity, it is expected that the rule of mixtures has limitations. However, it is still relevant to this work because it demonstrates the range of composite hPBP weight concentrations for which strength and modulus exceed both this simple prediction and the measured values for the neat PT BP and PAN films. In general, values of strength are related to the defects within the material. In the case of higher tensile strength for polymeric samples, as the chains are able to align beyond the yield point, a less defective structure may form, and this combined with chain alignment contribute to the final strength properties measured. In this work, from the tensile property comparison, it is observed that for the hPBPs with PAN:PT ratios higher than 1:1, the experimentally measured tensile strengths are lower than the calculated values. However, when the PAN:PT ratios become less than 1:1 the opposite trend is observed, and the experimentally measured tensile strengths are higher than the calculated values. These results indicate that for the hPBPs with a decreasing PAN:PT ratio, the polymer along with the PT filler are able to form a less defective and possibly aligned final morphology during plastic deformation. This may be related to a more uniform structure formation of the initial PRL region due to blending of the components. It is also observed that PRL region effectively dominates the mechanical performance in the hPBP. Therefore, as the PAN concentration is reduced and retention enters Stage Three (Figure 5a) the PAN-SWNT interaction in the PRL is maximized (i.e., fully blended), leading to exceptional performance.
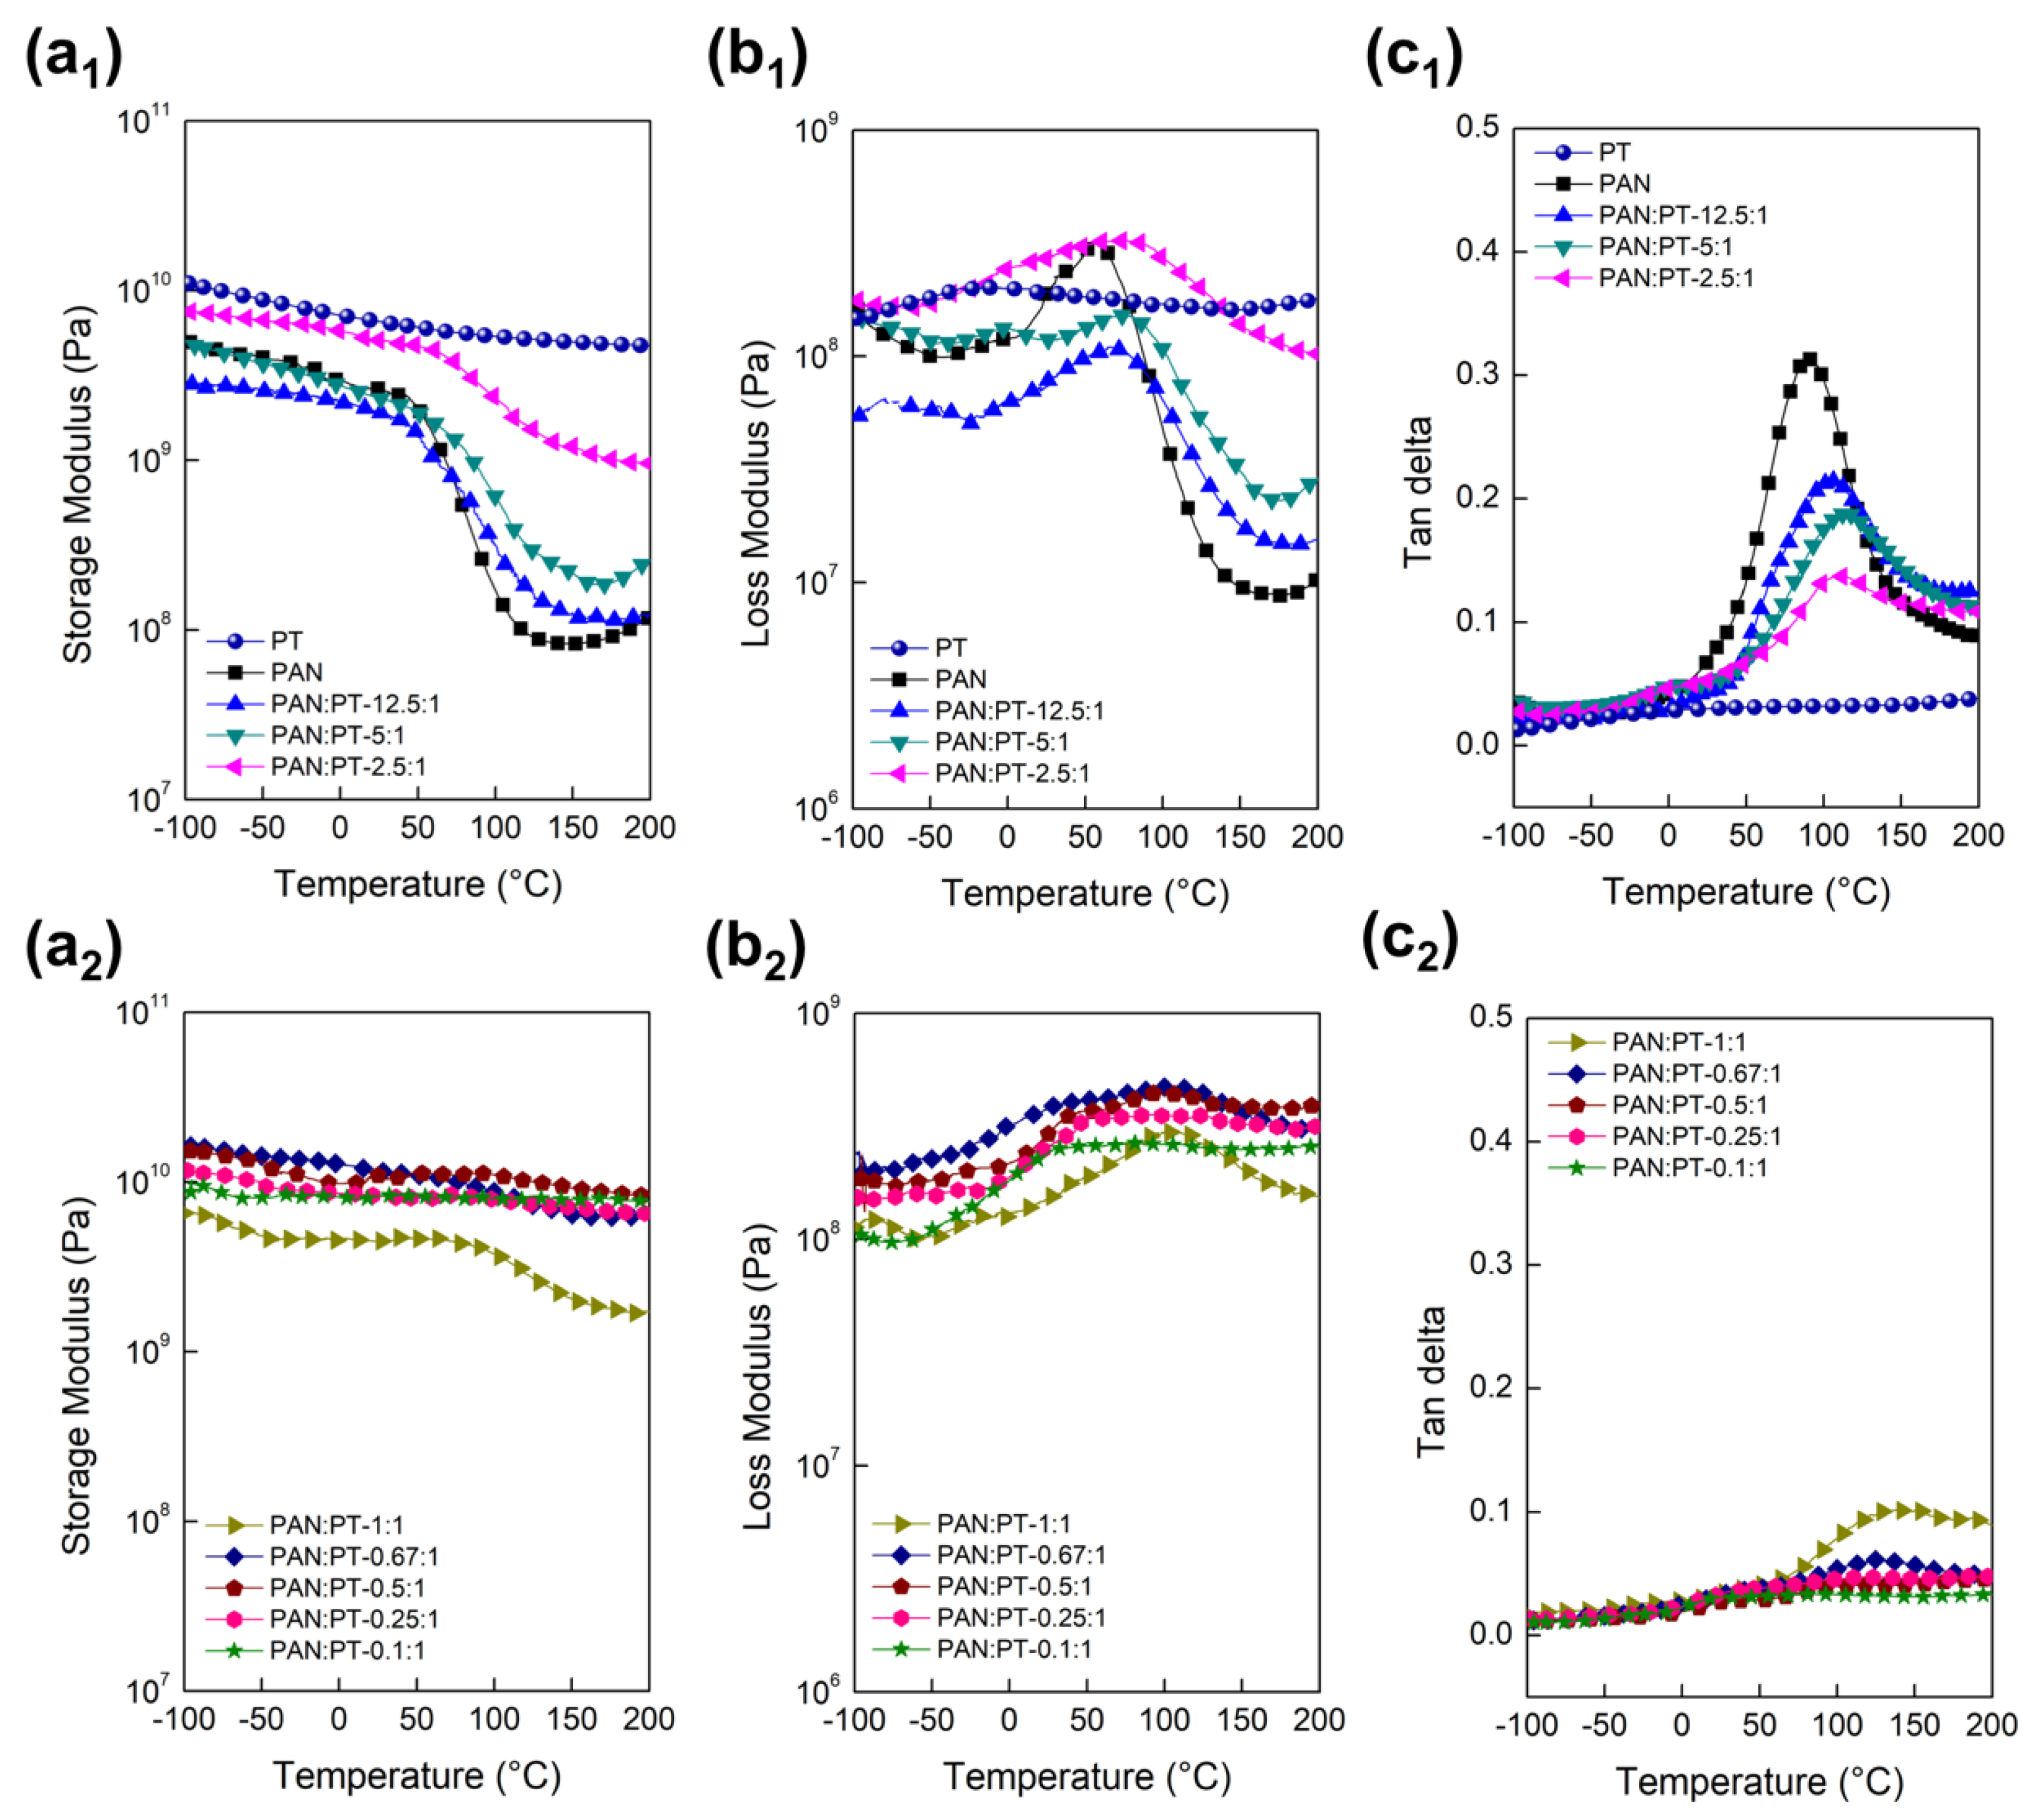
The viscoelastic behavior of hPBPs was studied by performing dynamic mechanical analyses (DMA) via temperature sweeping. The viscoelastic properties (elastic/storage modulus ( E ), loss modulus ( E ), and damping parameter (tan δ ) were plotted against temperature, to represent the thermo-mechanical elastic property, energy dissipation, and damping trends (Figure 11).
Consistent with static tensile test results, the hPBPs with higher PAN content exhibit lower storage moduli than the neat BP, however, the opposite trend is observed for hPBPs with lower PAN contents for temperatures before the glass-to-rubbery transition. When crossing over the glass transition temperature, increased loading on the SWNTs enables the PAN to sustain its stiffness at higher temperatures even above glass transition. This is especially true for hPBPs with lower PAN:PT ratios of 0.67:1, 0.5:1, 0.25:1, and 0.1:1, corresponding to PAN weight concentrations of 35.59%, 24.09%, 19.87%, and 9.64%. For example, for PAN:PT-0.25:1 hPBP, at a temperature of 150 °C, its storage modulus (7.06 GPa) is 85 times higher than the storage modulus of neat PAN film (83 MPa) at the same temperature. As previously suggested, during the liquid solvent phase separation process, the SWNT bundles and polymer chains in the PRL regions form blended regions. The increased storage modulus may be attributed to the uniform dispersion of SWNT in the PRL coupled with enhanced interaction between PAN and SWNT during phase separation.
The hPBPs treated after the liquid solvent phase separation process with varying PAN weight concentrations also showed different glass transition temperatures (Tg) observed by DMA. The glass transition temperature of a polymer reflects the polymer’s chain mobilities. Below Tg, the polymer chains are ‘frozen’ leading to glassy behavior; above Tg, the polymer chains show some mobility. As shown from the peak temperature of the tan δ or energy dissipation curves (Figure 11(c1,c2)), an Tg upshift is observed with decreasing input PAN weight concentration from pure PAN to PAN:PT-0.67:1, indicating strong hindrance of the polymer chain mobility due to the SWNT. Concurrently, there is a significant drop in the tan δ magnitude, signaling less energy loss during cyclic loadings. With a further decrease in PAN content from PAN:PT-0.5:1 to 0.1:1, the tan δ peak disappears, suggesting even stronger molecular interactions between PAN and SWNT. This is consistent with the strong PAN-SWNT interaction behavior observed in Stage Three of retention (Figure 5a), as well as the trend in tensile strength (Figure 10). 
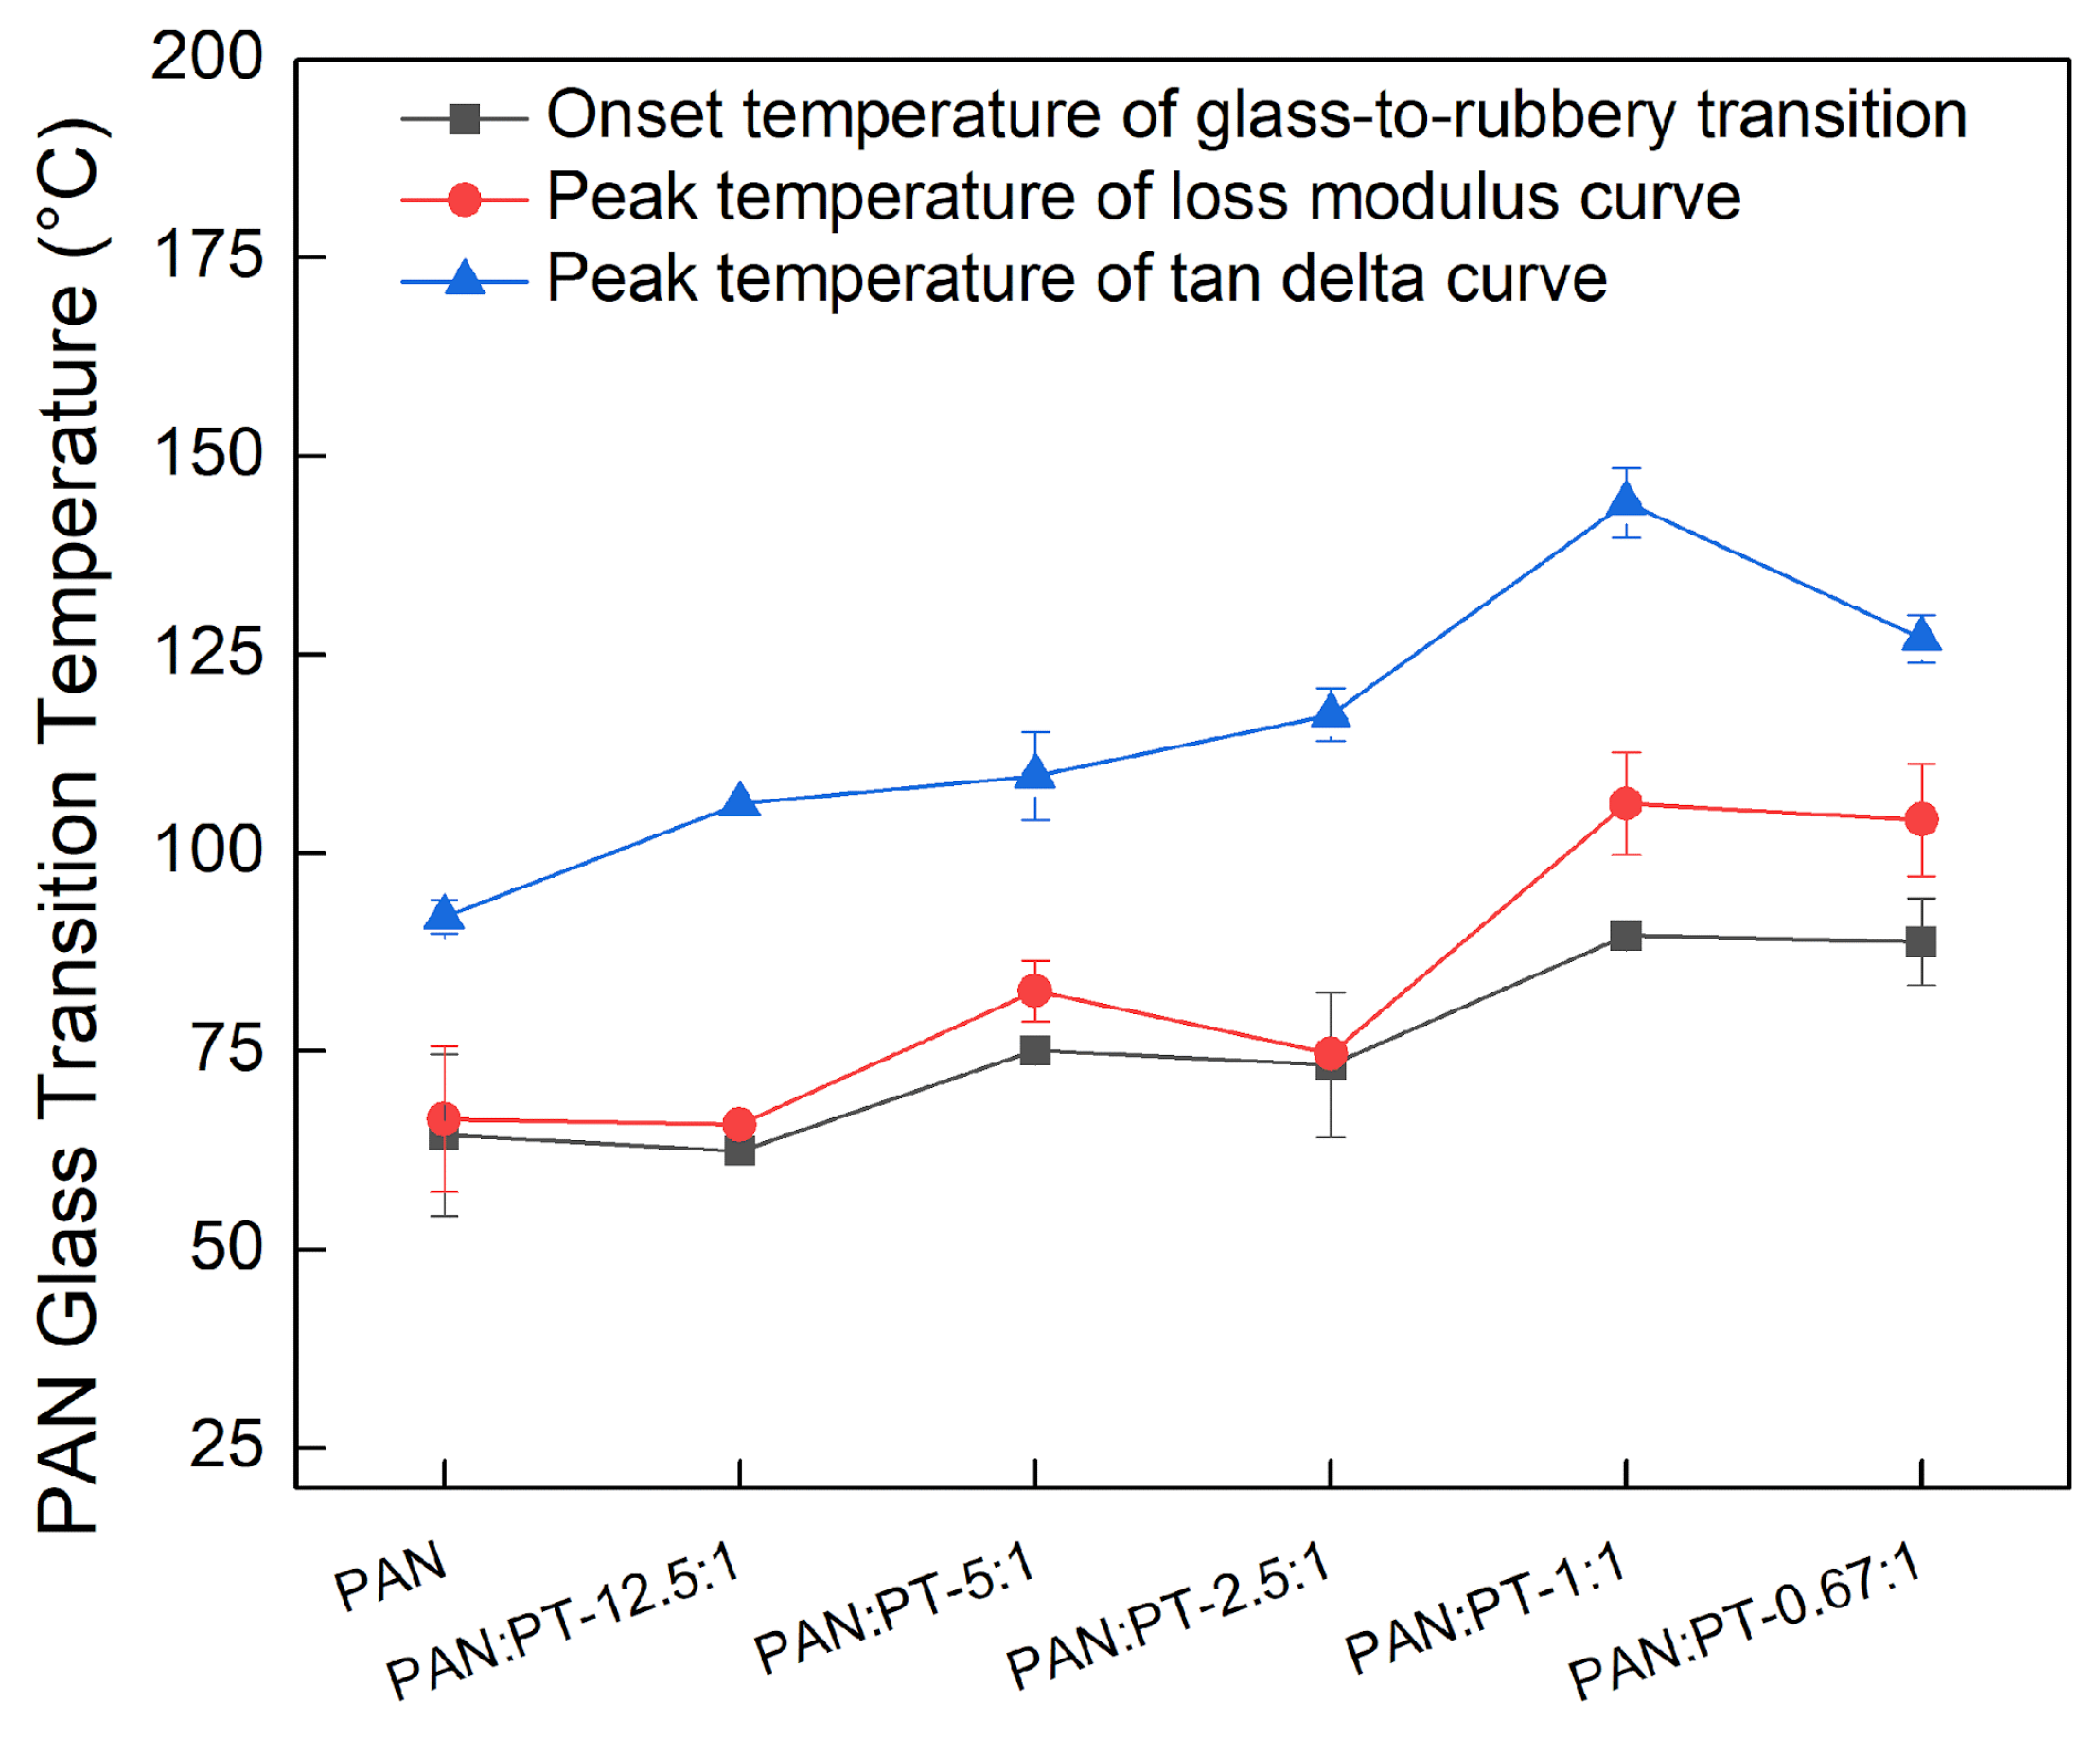
Figure 12 summarizes the trend of glass transition temperature measured based on different determination criteria (i.e., onset temperature observed on storage modulus curve) peak temperature on loss modulus curve, and peak temperature on tan δ curve. The maximum upshift for observable Tg is 52 °C.
As mentioned, the PAN:PT ratio for the complete disappearance of the tan δ peak coincides perfectly with the ratio in Stage Three on the PAN retention curve (Figure 5a), further indicating that no excessive bulk PAN was found in the hPBPs. The hPBPs made under those ratios contain PAN chains fully blended and interacting with the SWNT. The PAN:PT ratio of 0.25:1 may be the optimal ratio to form composites with only highly interacting PAN-SWNT blend. Combined with micromechanical analyses from the tensile test results, the increase in glass transition temperature provides further support that the reinforcement mechanism for the hPBPs is attributed to the enhanced PAN-SWNT interaction developed during liquid-solid phase separation. This unique interaction is due to the formation of a PAN-SWNT blended phase.

4. Conclusions

This work provides complete characterization of PAN/SWNT composite films (hPBPs) formed by a unique solvent-based phase separation process. It is this process that enables the formation of PAN/SWNT morphologies that are indicative of ’blending’ between a polymer and nano-filler. The blended region, or PRL as it is referred to in this work exhibits uniform dispersion and morphology as well as mechanical and electrical performance on par with theoretical predictions. The optimal ratio of PAN:SWNT was determined by looking at the retention of polymer post filtration as well as the mechanical and electrical properties of the resulting film. This ratio was found to be 0.25:1, as it results in near complete retention of PAN and tensile strength and modulus values of 60 MPa and 7.7 GPa, respectively. Thermal characterization demonstrates that PAN and SWNT in the PRL are highly interactive and PAN is confined at the interphase. PAN cyclization reactions are shifted by ∼5° due to this confinement as compared to the native polymer. Dynamic mechanical characterization also supports evidence of this confinement, where no tan δ peak is observed when blending dominates the hPBP structure (i.e., 0.25:1). Overall, this work provides insight into property possibilities when components within the polymer composite are fully interacting. This processing approach also shows promise as a means to form blended structures for several polymer-nanofiller pairs.

Author Contributions

Conceptualization, H.L. and M.L.M.; methodology, H.L. and C.M.D.; formal analysis, H.L. and C.M.D.; investigation, H.L. and C.M.D.; resources, M.L.M.; data curation, H.L. and C.M.D.; writing—original draft preparation, H.L. and C.M.D.; writing—review and editing, H.L., C.M.D. and M.L.M.; supervision, M.L.M.; project administration, M.L.M.; funding acquisition, M.L.M. All authors have read and agreed to the published version of the manuscript.

Funding

The authors would like to acknowledge the funding support from the Air Force Office of Scientific Research (AFOSR) for this work (Award No.: FA9550-18-1-0008).

Institutional Review Board Statement

Not applicable.

Informed Consent Statement

Not applicable.

Data Availability Statement

The data presented in this study are available on request from the corresponding author.

Conflicts of Interest

The authors declare no conflict of interest.

References

  1. Liu, J.; Rinzler, A.; Dai, H.; Hafner, J.; Bradley, R.; Boul, P.; Lu, A.; Iverson, T.; Shelimov, K.; Huffman, C.; et al. Fullerene Pipes. Sci. Am. Assoc. Adv. Sci. 1998, 280, 1253–1256. [Google Scholar] [CrossRef] [PubMed]
  2. Whitby, R.L.D.; Fukuda, T.; Maekawa, T.; James, S.L.; Mikhalovsky, S.V. Geometric control and tuneable pore size distribution of buckypaper and buckydiscs. Carbon 2008, 46, 949–956. [Google Scholar] [CrossRef]
  3. Wang, Z.; Liang, Z.; Wang, B.; Zhang, C.; Kramer, L. Processing and property investigation of single-walled carbon nanotube (SWNT) buckypaper/epoxy resin matrix nanocomposites. Compos. Part Appl. Sci. Manuf. 2004, 35, 1225–1232. [Google Scholar] [CrossRef]
  4. Wang, D.; Song, P.; Liu, C.; Wu, W.; Fan, S. Highly oriented carbon nanotube papers made of aligned carbon nanotubes. Nanotechnology 2008, 19, 075609. [Google Scholar] [CrossRef] [PubMed]
  5. Zhang, J.; Jiang, D.; Peng, H.X.; Qin, F. Enhanced mechanical and electrical properties of carbon nanotube buckypaper by in situ cross-linking. Carbon 2013, 63, 125–132. [Google Scholar] [CrossRef]
  6. Frizzell, C.J.; in het Panhuis, M.; Coutinho, D.H.; Balkus, K.J.; Minett, A.I.; Blau, W.J.; Coleman, J.N. Reinforcement of macroscopic carbon nanotube structures by polymer intercalation: The role of polymer molecular weight and chain conformation. Phys. Rev. Condens. Matter Mater. Phys. 2005, 72, 245420. [Google Scholar] [CrossRef] [Green Version]
  7. Dez-Pascual, A.M.; Gascn, D. Carbon Nanotube Buckypaper Reinforced Acrylonitrile–Butadiene–Styrene Composites for Electronic Applications. ACS Appl. Mater. Interfaces 2013, 5, 12107–12119. [Google Scholar] [CrossRef] [Green Version]
  8. Wu, Q.; Zhu, W.; Zhang, C.; Liang, Z.; Wang, B. Study of fire retardant behavior of carbon nanotube membranes and carbon nanofiber paper in carbon fiber reinforced epoxy composites. Carbon 2010, 48, 1799–1806. [Google Scholar] [CrossRef]
  9. Díez-Pascual, A.M.; Guan, J.; Simard, B.; Gómez-Fatou, M.A. Poly(phenylene sulphide) and poly(ether ether ketone) composites reinforced with single-walled carbon nanotube buckypaper: II–Mechanical properties, electrical and thermal conductivity. Compos. Part A Appl. Sci. Manuf. 2012, 43, 1007–1015. [Google Scholar] [CrossRef]
  10. Manson, J.A.; Sperling, L.H. Polymer Blends and Composites, 1st ed.; Springer Science+Business Media, LLC: New York, NY, USA, 1976; p. 52. [Google Scholar]
  11. Che, J.; Chen, P.; Chan-Park, M.B. High-strength carbon nanotube buckypaper composites as applied to free-standing electrodes for supercapacitors. J. Mater. Chem. Mater. Energy Sustain. 2013, 1, 4057. [Google Scholar] [CrossRef]
  12. Monthioux, M.; Smith, B.W.; Burteaux, B.; Claye, A.; Fischer, J.E.; Luzzi, D.E. Sensitivity of single-wall carbon nanotubes to chemical processing: An electron microscopy investigation. Carbon 2001, 39, 1251–1272. [Google Scholar] [CrossRef]
  13. Dimiev, A.; Kosynkin, D.V.; Price, B.K.; Sinitskii, A.; Higginbotham, A.L.; Tour, J.M.; Lomeda, J.R. Longitudinal unzipping of carbon nanotubes to form graphene nanoribbons. Nature 2009, 458, 872–876. [Google Scholar] [CrossRef] [Green Version]
  14. Hirsch, A. Functionalization of Single-Walled Carbon Nanotubes. Angew. Chem. (Int. Ed.) 2002, 41, 1853–1859. [Google Scholar] [CrossRef]
  15. Premkumar, T.; Mezzenga, R.; Geckeler, K.E. Nanotube Dispersion: Carbon Nanotubes in the Liquid Phase: Addressing the Issue of Dispersion (Small 9/2012). Small 2012, 8, 1298. [Google Scholar] [CrossRef]
  16. Shvartzman-Cohen, R.; Levi-Kalisman, Y.; Nativ-Roth, E.; Yerushalmi-Rozen, R. Generic Approach for Dispersing Single-Walled Carbon Nanotubes: The Strength of a Weak Interaction. Langmuir 2004, 20, 6085–6088. [Google Scholar] [CrossRef]
  17. Meng, J.; Zhang, Y.; Song, K.; Minus, M.L. Forming Crystalline Polymer-Nano Interphase Structures for High-Modulus and High-Tensile/Strength Composite Fibers. Macromol. Mater. Eng. 2014, 299, 144–153. [Google Scholar] [CrossRef]
  18. Meng, J.; Zhang, Y.; Cranford, S.W.; Minus, M.L. Nanotube Dispersion and Polymer Conformational Confinement in a Nanocomposite Fiber: A Joint Computational Experimental Study. J. Phys. Chem. 2014, 118, 9476–9485. [Google Scholar] [CrossRef]
  19. Zhang, Y.; Song, K.; Meng, J.; Minus, M.L. Tailoring Polyacrylonitrile Interfacial Morphological Structure by Crystallization in the Presence of Single-Wall Carbon Nanotubes. ACS Appl. Mater. Interfaces 2013, 5, 807–814. [Google Scholar] [CrossRef]
  20. Li, H.; Minus, M.L. On the formation of potential polymer-nanotube blends by liquid-solid phase separation. Polymer 2017, 131, 179–192. [Google Scholar] [CrossRef]
  21. Green, M.J.; Behabtu, N.; Pasquali, M.; Adams, W.W. Nanotubes as polymers. Polymer 2009, 50, 4979–4997. [Google Scholar] [CrossRef] [Green Version]
  22. Haggenmueller, R.; Gommans, H.H.; Rinzler, A.G.; Fischer, J.E.; Winey, K.I. Aligned single-wall carbon nanotubes in composites by melt processing methods. Chem. Phys. Lett. 2000, 330, 219–225. [Google Scholar] [CrossRef]
  23. Ramasubramaniam, R.; Chen, J.; Liu, H. Homogeneous carbon nanotube/polymer composites for electrical applications. Appl. Phys. Lett. 2003, 83, 2928–2930. [Google Scholar] [CrossRef]
  24. Du, F.; Scogna, R.C.; Zhou, W.; Brand, S.; Fischer, J.E.; Winey, K.I. Nanotube Networks in Polymer Nanocomposites: Rheology and Electrical Conductivity. Macromolecules 2004, 37, 9048–9055. [Google Scholar] [CrossRef]
  25. Gojny, F.H.; Wichmann, M.H.G.; Fiedler, B.; Kinloch, I.A.; Bauhofer, W.; Windle, A.H.; Schulte, K. Evaluation and identification of electrical and thermal conduction mechanisms in carbon nanotube/epoxy composites. Polymer 2006, 47, 2036–2045. [Google Scholar] [CrossRef]
  26. Pham, G.T.; Park, Y.B.; Wang, S.; Liang, Z.; Wang, B.; Zhang, C.; Funchess, P.; Kramer, L. Mechanical and electrical properties of polycarbonate nanotube buckypaper composite sheets. Nanotechnology 2008, 19, 325705. [Google Scholar] [CrossRef]
  27. Sandler, J.K.W.; Kirk, J.E.; Kinloch, I.A.; Shaffer, M.S.P.; Windle, A.H. Ultra-low electrical percolation threshold in carbon-nanotube-epoxy composites. Polymer 2003, 44, 5893–5899. [Google Scholar] [CrossRef]
  28. NanoIntegris. 2021. Available online: http://nanointegris.com/our-products/hipco-small-diameter-swcnts/ (accessed on 21 June 2021).
  29. Stauffer, D. Introduction to Percolation Theory, 2nd ed.; Taylor & Francis: London, UK; Washington, DC, USA, 1992. [Google Scholar]
  30. Li, Y.; Yu, Y.; Liu, Y.; Lu, C. Interphase Development in Polyacrylonitrile/SWNT Nanocomposite and Its Effect on Cyclization and Carbonization for Tuning Carbon Structures. ACS Appl. Nano Mater. 2018, 1, 3105–3113. [Google Scholar] [CrossRef]
  31. Liu, Y.; Chae, H.G.; Kumar, S. Gel-spun carbon nanotubes/poly acrylonitrile composite fibers. Part II: Stabilization reaction kinetics and effect of gas environment. Carbon 2011, 49, 4477–4486. [Google Scholar] [CrossRef]
  32. Kearns, J.C.; Shambaugh, R.L. Polypropylene fibers reinforced with carbon nanotubes. J. Appl. Polym. Sci. 2002, 86, 2079–2084. [Google Scholar] [CrossRef]
  33. Naito, K.; Yang, J.M.; Kagawa, Y. Tensile properties of high strength polyacrylonitrile (PAN)-based and high modulus pitch-based hybrid carbon fibers-reinforced epoxy matrix composite. J. Mater. Sci. 2011, 47, 2743–2751. [Google Scholar] [CrossRef]
  34. Ruan, S.; Gao, P.; Yu, T.X. Ultra-strong gel-spun UHMWPE fibers reinforced using multiwalled carbon nanotubes. Polymer 2006, 47, 1604–1611. [Google Scholar] [CrossRef]
Figure 1. Wide-angle X-ray (WAXD) integrated curves for hPBPs at various PAN/PT weight concentrations. WAXD curves for the control PAN film and SWNT BP are also included.
Jcs 06 00122 g001
Figure 2. WAXD patterns for the hPBPs at various PT-SWNT/PAN weight concentrations. WAXD patterns for the control PAN film and SWNT BP are also included. (a) PAN film, (b) SWNT-BP, (c) PAN:PT-12.5:1, (d) PAN:PT-5:1, (e) PAN:PT-2.5:1, (f) PAN:PT-1:1, (g) PAN:PT-0.67:1, (h) PAN:PT-0.5:1, (i) PAN:PT-0.25:1, and (j) PAN:PT-0.1:1.
Jcs 06 00122 g002
Figure 3. Scanning electron micrographs showing the cross-sections of neat PAN, SWNT-BP, and hPBP films. (a) PAN film, (b) SWNT-BP, (c) PAN:PT-12.5:1, (d) PAN:PT-5:1, (e) PAN:PT-2.5:1, (f) PAN:PT-1:1, (g) PAN:PT-0.67:1, (h) PAN:PT-0.5:1, (i) PAN:PT-0.25:1, and (j) PAN:PT-0.1:1. Magnified images of the PRL and CRL regions are also included.
Jcs 06 00122 g003
Figure 4. Scanning electron micrographs of the cross sections of (a) 0.25:1 paste film and (b) buckypaper fabricated from SWNT.
Jcs 06 00122 g004
Figure 5. (a) PAN weight fraction and retention curves for the hPBPs. The asterisk denotes the ideal loading ratio v*. (b) Electron micrographs of the 0.25:1 hPBP showing resolved PRL and CRL regions with distinct SWNT distributions.
Jcs 06 00122 g005
Figure 6. SEM images (without any metallic coating) of freeze-dried paste from the PRL for a 1:1 PAN:SWNT sample showing (a1,b1) SWNT/PAN networks, as well as (a2,b2) magnified images of these regions. The arrows point out the well-covered SWNT bundles.
Jcs 06 00122 g006
Figure 7. Electrical conductivities for the PAN cast film, SWNT-PT buckypaper, and hPBPs at different PAN:SWNT ratios. Properties are measured from both sides of all samples. The asterisk denotes the ideal loading ratio v*.
Jcs 06 00122 g007
Figure 8. (a) Differential Scanning Calorimtery (DSC) curves for PAN powder, PAN fiber, a hPBP single (PRL) and two-layered films showing the exotherm associated with PAN cyclization. The absence of an exotherm indicates that no PAN is present. The inset magnifies the exothermic peak for the hPBP single (PRL) and two-layered films. (b1) A comparison of PAN powder/pellets, fibers, and hPBP showing a shift in the exotherm as the PAN chains become more confined due to material morphology. (b2) A comparison of hPBPs with decreasing PAN:SWNT ratios, where PAN confinement becomes more pronounced due to the removal of excess ’non-interacting/blended’ PAN. (b3) A comparison of the two-layered and single-layer hPBP showing an exotherm shift due to even more confinement as the isolated blended region (PRL) is studied. (b4) Buckypaper and SWNT powder (PT) showing no exotherm as no PAN is present.
Jcs 06 00122 g008
Figure 9. Tensile test results of PAN film, PT BP, and PANPT hPBPs with varying PAN weight concentrations, (a) representative engineering stress-strain (S-S) curves and (b) average values of tensile strength and modulus.
Jcs 06 00122 g009
Figure 10. Tensile property comparison of experimental measured and theoretical calculated values based on rule-of-mixtures.
Jcs 06 00122 g010
Figure 11. (a1–2) Storage modulus, (b1–2) loss modulus, and (c1–2) δ of PT BP, PAN films, and hPBPs with different PAN:PT ratios as a function temperature at 1 Hz. For clarity, data is split onto two plots for each measured property.
Jcs 06 00122 g011
Figure 12. Glass transition temperatures measured from tan δ curves. Three specimens were tested to obtain the average, except for PAN:PT-12.5:1 due to limited samples.
Jcs 06 00122 g012
Table 1. Electrical conductivities for BP and composite BP samples from the literature. Test types are as follows: a four-point probe b two-terminal AC impedance spectroscopy c two-point probe d dielectrix spectroscopy.
PolymerFillerCNT wt%Conductivity S/mRef.
P-SWNT100 2 × 10 4 a[26]
HiPco-SWNT100 5.1 × 10 4 [23]
PMMASWNT1.3–6.60.118–11.5 a[22]
PSHiPco-SWNT76.89 a[23]
PCHiPco-SWNT7 4.81 × 10 2 a[23]
BPA-EpoxyCVD-MWNT12 b[27]
PMMASWNT2 1 × 10 3 c[24]
EpoxySWNT0.1 2.5 × 10 4 d[25]
PCP-SWNT40–60 9 × 10 3 a[26]
Publisher’s Note: MDPI stays neutral with regard to jurisdictional claims in published maps and institutional affiliations.

