
Regulation of TREM1-Mediated Inflammation in Hepatocellular Carcinoma Cells


Department of Translational Research, College of Osteopathic Medicine of the Pacific, Western University of Health Sciences, Pomona, CA 91766, USA
*
Author to whom correspondence should be addressed.
Reports 2021, 4(2), 17; https://0-doi-org.brum.beds.ac.uk/10.3390/reports4020017
Submission received: 28 March 2021
/
Revised: 26 May 2021
/
Accepted: 1 June 2021
/
Published: 9 June 2021
(This article belongs to the Special Issue Case Reports in Oncology)
Abstract
:Hepatocellular carcinoma (HCC), accounting for more than 90% of cases of primary liver cancer, is the third most common cause of cancer-related death worldwide. Chronic inflammation precedes the development of cirrhosis and HCC. TREM (triggering receptor expressed on myeloid cell)-1 is an inflammatory marker and amplifier of inflammation that signals through PI3K and ERK1/2 to activate transcription factors, resulting in increased secretion of pro-inflammatory cytokines, causing chronic inflammation and predisposing the liver to carcinogenesis. Thus, targeting TREM-1 in HCC might be a potential therapeutic target. A low level of vitamin D has been associated with chronic inflammation and poor prognosis in HCC. Thus, we evaluated the effect of vitamin D on TREM-1 expression in the HCC cell line. Additionally, the effects of high mobility group box-1, lipopolysaccharide, and transcription factor PU.1 on the expression of TREM-1 in normal liver cells and HCC cells have been investigated in the presence and absence of vitamin D. The results showed increased expression of TREM-1 in HCC cells and with IL-6, TNF-α, LPS, and rHMGB-1 and decreased expression with calcitriol. Calcitriol also attenuated the effect of IL-6, TNF-α, LPS, and rHMGB-1 on TREM-1. Calcitriol treatment attenuated the proliferation, migration, and invasion of HCC cells. These results (in vitro) provide molecular and biochemical evidence that calcitriol significantly attenuates the expression of mediators of inflammation, and thus might be used therapeutically together with conventional treatment to delay the progression of HCC. Additionally, the negative regulation of TREM-1 by PU.1 suggests PU.1 as a potential therapeutic target.
1. Introduction
Liver cancer is the sixth most common cancer diagnosis and the third most common cause of cancer-related death worldwide [1]. Hepatocellular carcinoma (HCC) accounts for more than 85% of primary liver cancer and is a major public health problem [2]. The incidence of HCC is increasing around the world including the United States [3]. Chronic inflammation in the liver changes the microenvironment and plays a crucial role in the pathogenesis of HCC. The main triggering factors are exposure to infections and toxic agents, including hepatitis B virus (HBV) and hepatitis C virus (HCV) [1], infection accounting for nearly 75% of the HCC; alcoholic liver injury, primary sclerosing cholangitis, and non-alcoholic steatohepatitis (NASH) disrupting the normal architecture and regenerative mechanism, resulting in fibrosis, cirrhosis, and the development of HCC [4,5,6]. Chronic inflammation in the liver results in the induction of a high rate of cell turnover and a highly oxidative microenvironment leading to increase DNA damage, mutation, and carcinogenesis [7]. The death of hepatocytes during chronic inflammation, chronic hepatitis, or cirrhosis is followed by the secretion of pro-inflammatory cytokines by resident (Kupffer) cells and recruited inflammatory cells. High mobility group box-1 (HMGB-1) released from necrotic cells or dying hepatocytes mediate the activation of surface receptors such as triggering receptors expressed on myeloid cell (TREM)-1 and toll-like receptors (TLRs) activating the downstream signaling pathways and secretion of pro-inflammatory cytokines [8]. These pro-inflammatory cytokines in general induce an inflammatory response that is initially beneficial to the liver and compensates for the loss of hepatocytes. However, deregulation between innate and adaptive immunity due to chronic inflammation results in the loss of hepatocyte and regenerative process. This leads to the over secretion of pro-inflammatory cytokines involving signaling pathways and transcription factors mediating excessive tissue remodeling, loss of tissue architecture, apoptosis, and necrosis, thereby increasing the risk of carcinogenesis and development of HCC [9,10]. Cirrhosis is an irreversible end-stage disease and precedes HCC. The five-year survival of HCC is 10% [11,12], and the one-year survival rate is less than 50% [13]. The only curative treatment for HCC is liver resection or transplant depending on the stage of the disease, but this is associated with the reactivation and recurrence of HCC post-surgery. The five-year survival rate post-transplant is only 30–40% [14], and there is no improvement in the overall survival rate despite the advanced therapeutic strategies [15]. Thus, there is a need to understand the inflammatory pathophysiology in-depth to investigate the noble therapeutic targets.
TREM-1 is a transmembrane glycoprotein belonging to the immunoglobulin superfamily and family related to the natural killer cell receptor, expressed on monocytes, neutrophils, macrophages, and fibroblasts [16,17]. TREM-1 is a mediator of inflammation and its role in the pathogenesis and progression of HCC has been discussed [9,18,19,20,21]. TREM-1 activation results in increased secretion of tumor necrosis factor (TNF)-α, granulocyte-macrophage colony-stimulating factor (GM-CSF), monocyte chemoattractant protein (MCP)-1, interleukin (IL)-1β, IL-6, IL-8, and IL-12 from monocytes, neutrophils, and macrophages, and this indicates the role of TREM-1 in inflammation [16,22]. Contrary to TREM-1, TREM-2 is a negative regulator of inflammation [23,24]. TREM-2 expressed on macrophages, dendritic cells, and microglial cells is a cell surface receptor protein belonging to the immunoglobulin and lectin-like superfamily. TREM-2 suppresses inflammation in the hepatic, lung, and bone-marrow-derived macrophages, osteoclasts, and dendritic cells. The protective role of TREM-2 in HCC as a tumor suppressor and an anti-inflammatory agent has been documented [25,26,27]. TREM-1 and TREM-2 signals through common ligand cytosolic adaptor DAP-12 for downstream signaling [28,29]. TLR signaling is amplified by TREM-1 in macrophage/monocyte and neutrophils but suppressed by TREM-2 in macrophage and dendritic cells [30].
Vitamin D deficiency is associated with HCC, and vitamin D being an anti-inflammatory agent may play a potential role in slowing down the inflammation and progression of HCC [31]. Since there is a high prevalence of hypovitaminosis D in the adult US population and studies have stressed increasing the intake of vitamin D [32], there is a need to investigate the role of vitamin D in regulating the mediators of inflammation, particularly TREM-1, to attenuate inflammation in HCC. TREM-1 is an amplifier of inflammation [33] and plays a role in the pathogenesis of the development of HCC. Suppression or inhibition of TREM-1 activity may serve as a tool to attenuate inflammation. Vitamin D is a well-known anti-inflammatory agent and has been used to suppress inflammation [34]. Hence, vitamin D may be used to suppress TREM-1 activity. To our knowledge, no study has reported the effects of vitamin D in regulating TREM-1 expression. In this study, we have investigated the effect of calcitriol on TREM-1 and TREM-2 in epithelial cells transformed with SV40 large T antigen (THLE-2) and HCC cell line (HepG2) cells with the hypothesis that calcitriol attenuates TREM-1 expression. Additionally, we have investigated the regulatory effect of the transcription factor PU.1 on TREM-1.
2. Results
2.1. Increased Expression of Mediators of Inflammation in Hep G-2 Cells
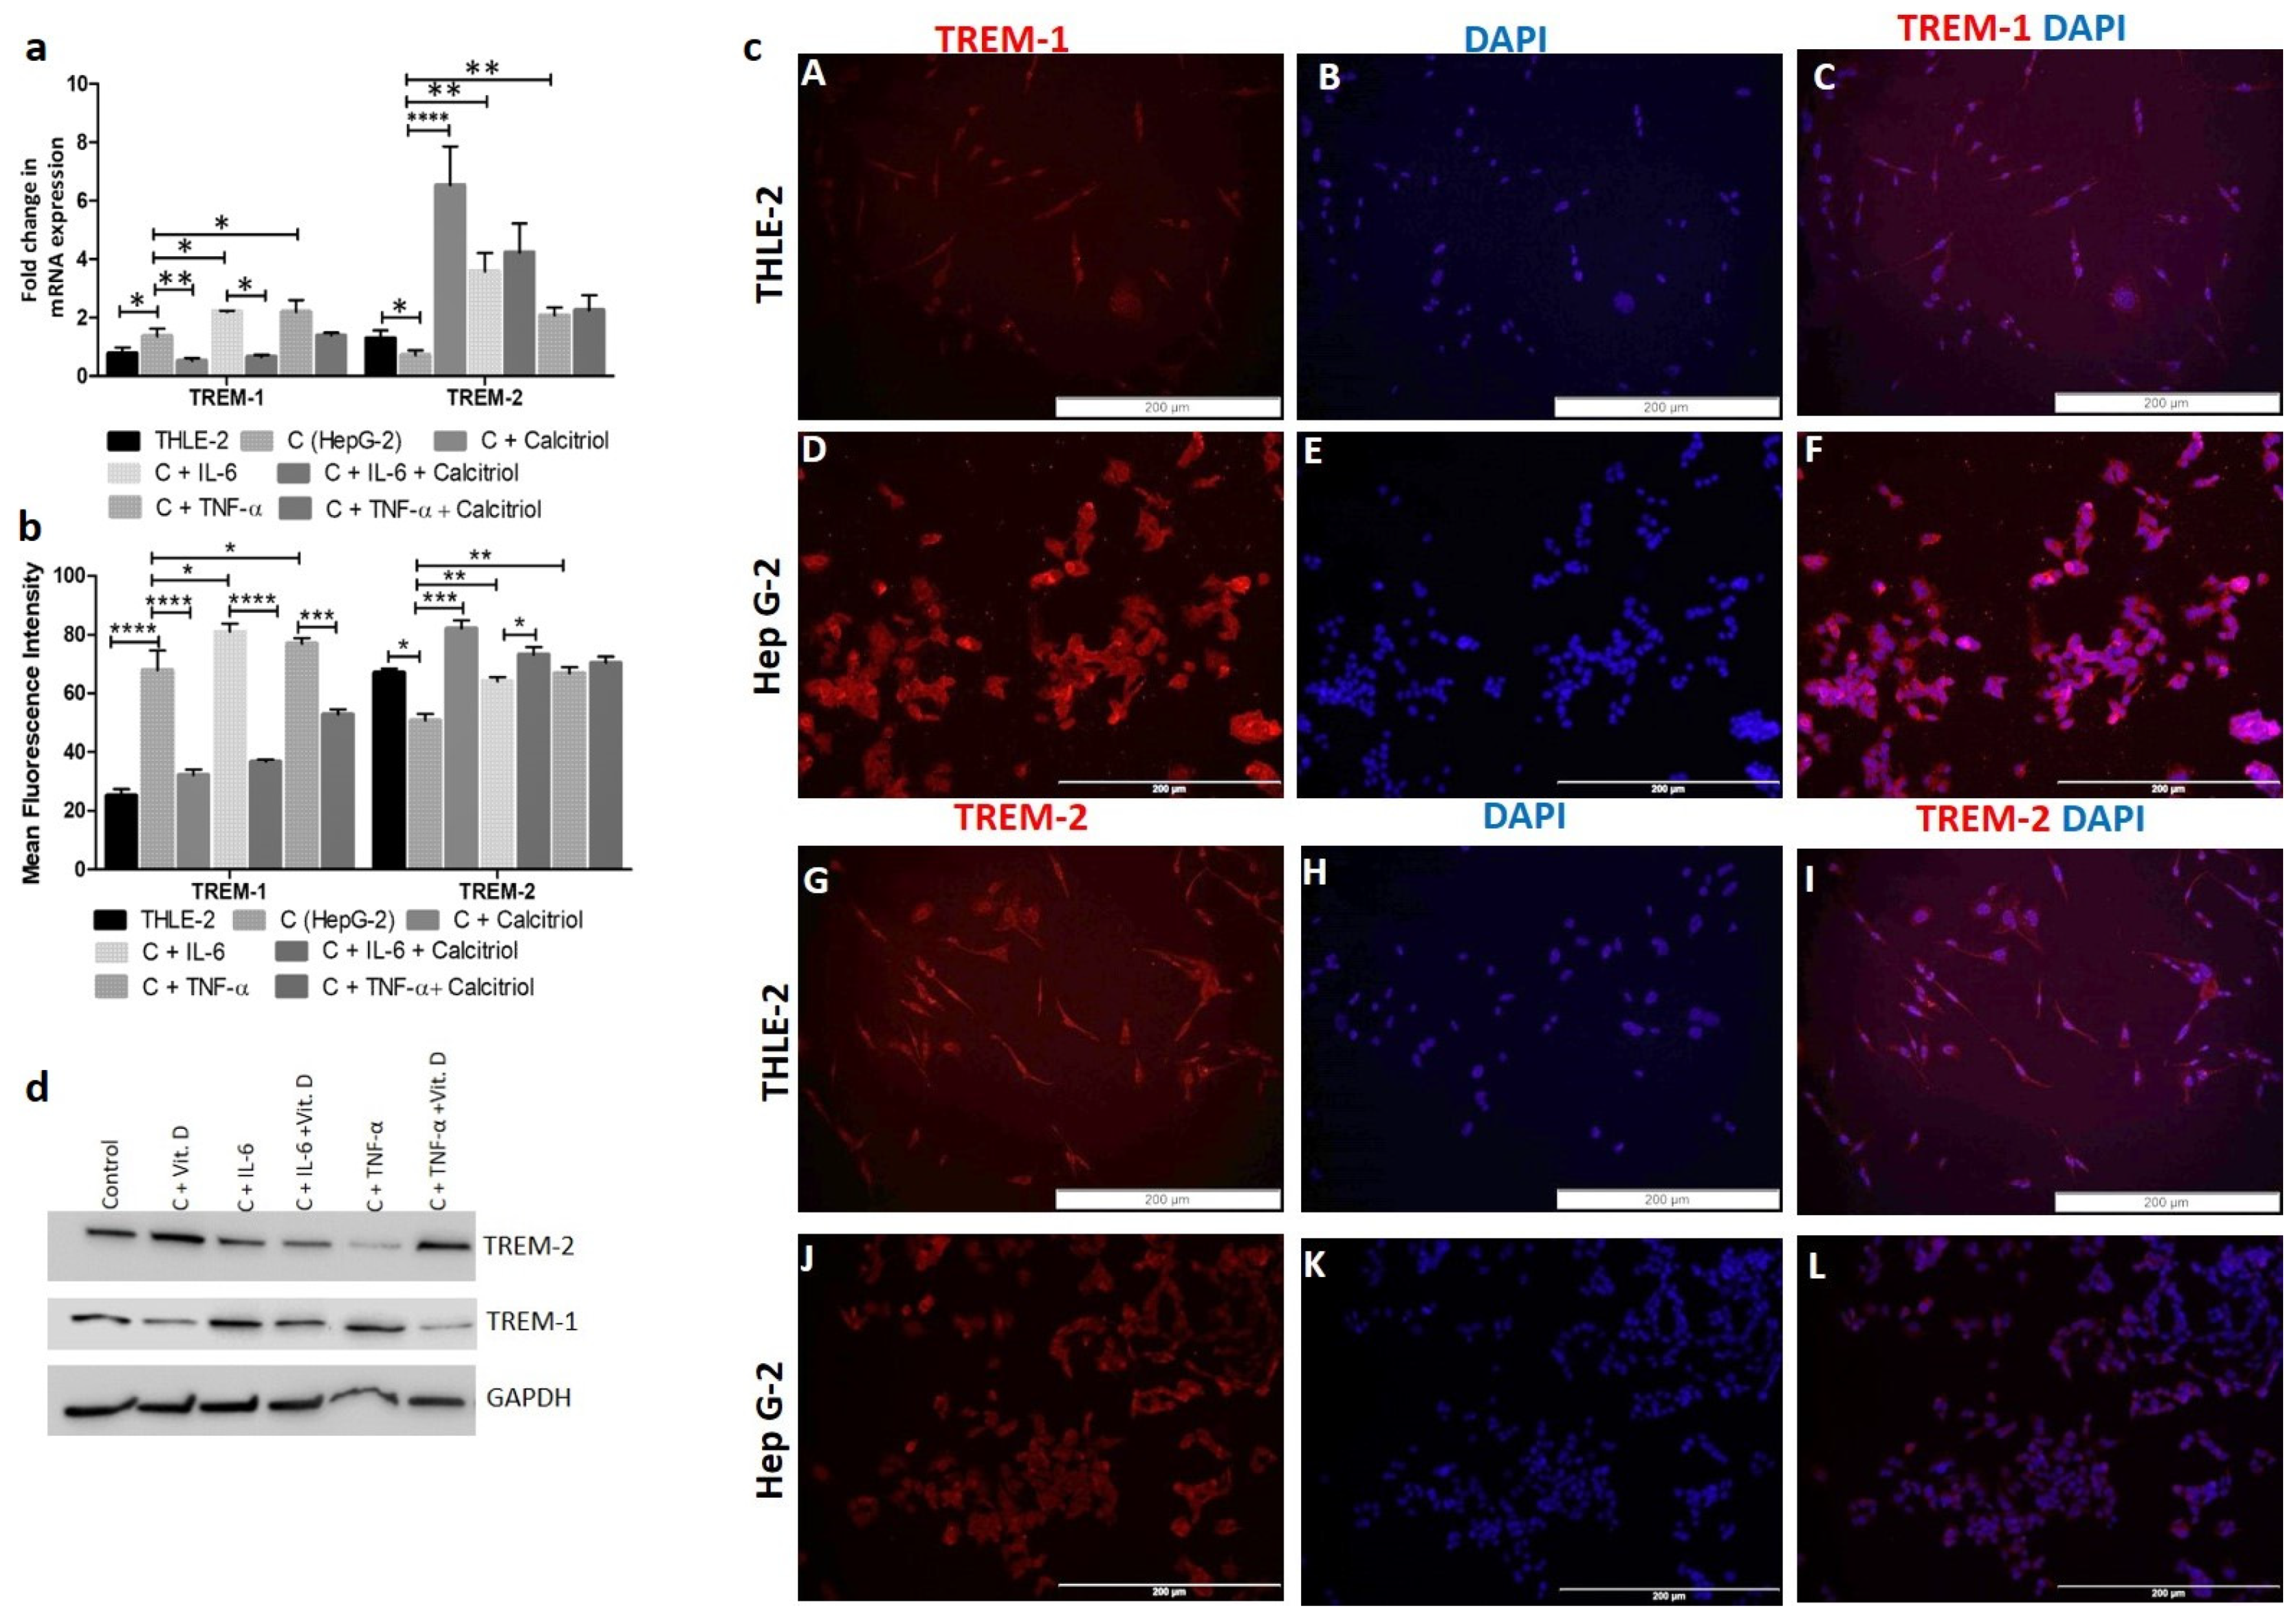
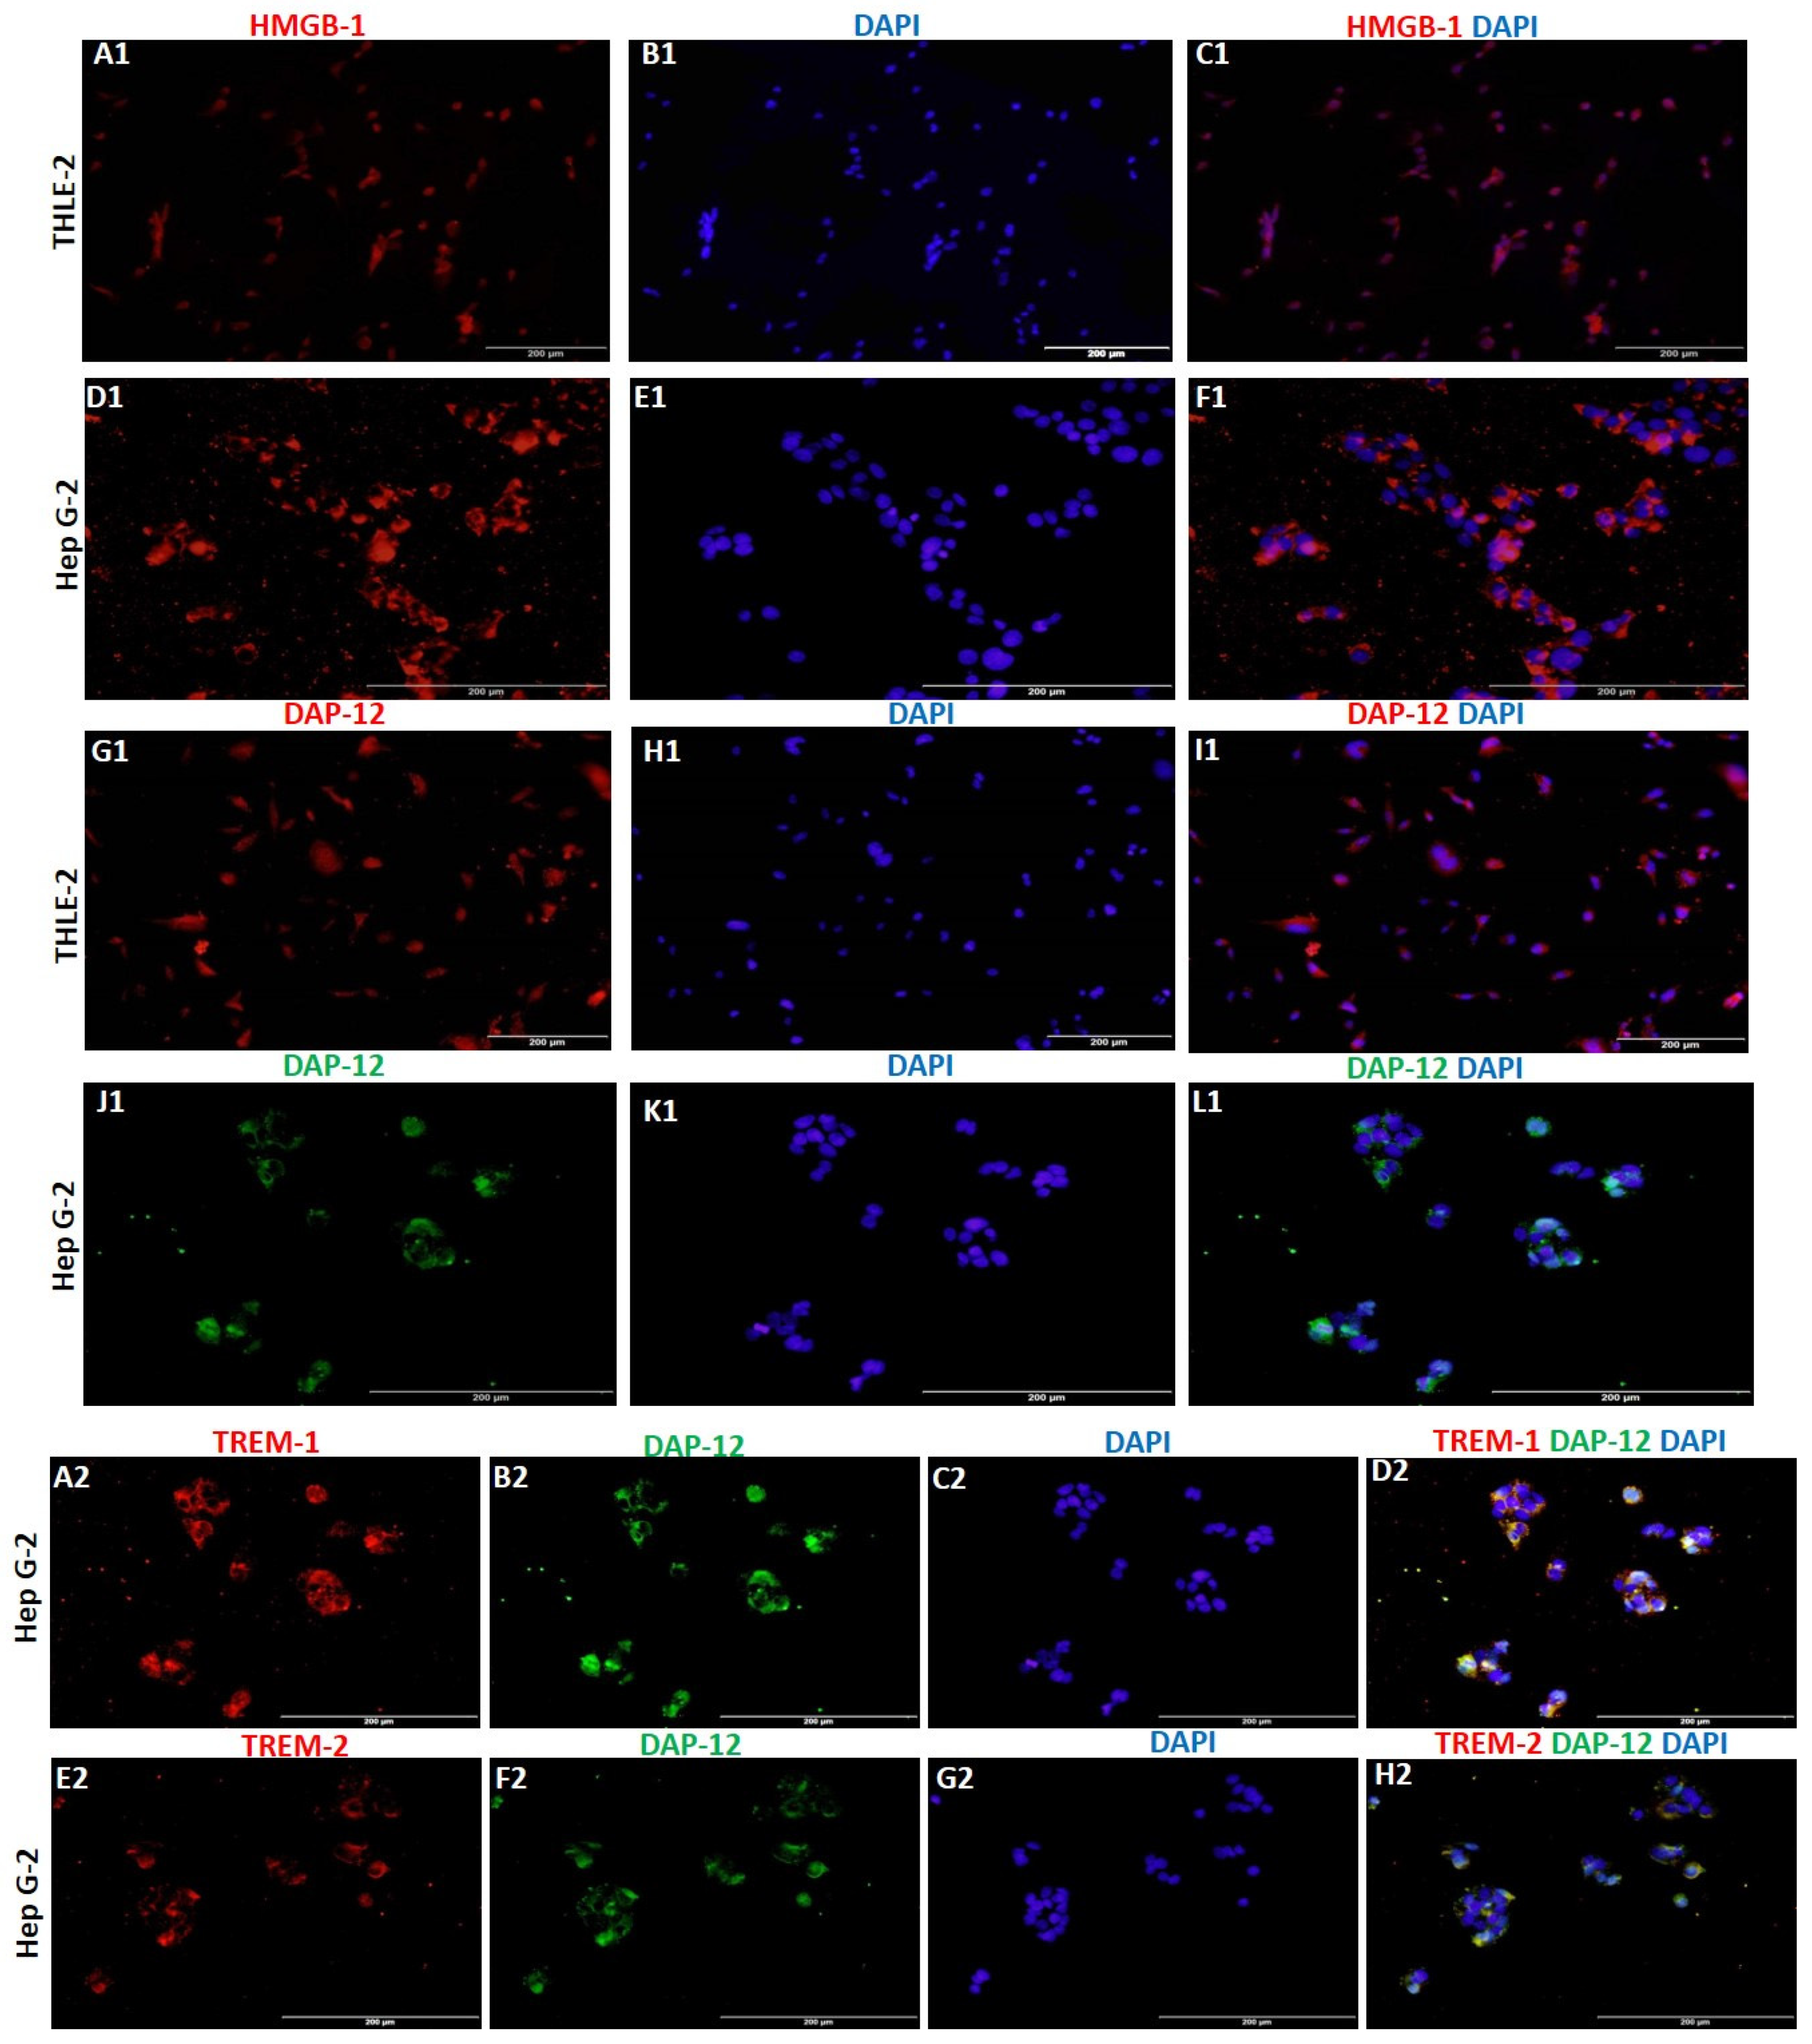
RT-PCR and immunofluorescence (IF) studies showed significantly increased expression of TREM-1 in HepG2 cells compared to THLE-2 cells (Figure 1, panels a, b, and c). The gene and protein expression of TREM-2 was higher in THLE-2 cells compared to HepG2 cells (Figure 1, panels a, b, and c). The protein expression of IL-6 and TNF-α (Supplementary Figure S1) was higher in HepG-2 cells compared to THLE-2 cells. IF also showed increased expression of HMGB-1 and DAP-12 (Figure 2) in HepG2 cells compared to THLE-2 cells. IF studies showed membranous and cytoplasmic expression of TREM-1 and TREM-2. More specifically, cytoplasmic more than nuclear expression for IL-6 and TNF-α (Supplementary Figure S1), and cytoplasmic as well as nuclear expression of HMGB-1 and DAP-12 (Figure 2). Increased immunoreactivity for TREM-1, IL-6, TNF-α, and HMGB-1 in HCC cells (HepG-2) compared to normal cells (THLE-2) suggests the presence of inflammation. Further, colocalization of TREM-1 and TREM-2 with DAP-12 on IF studies (Figure 2) suggests that DAP-12 is the common ligand for TREM-1 and TREM-2.
2.2. IL-6 and TNF-α Increase While Calcitriol Decreases TREM-1 Expression in HepG-2 Cells
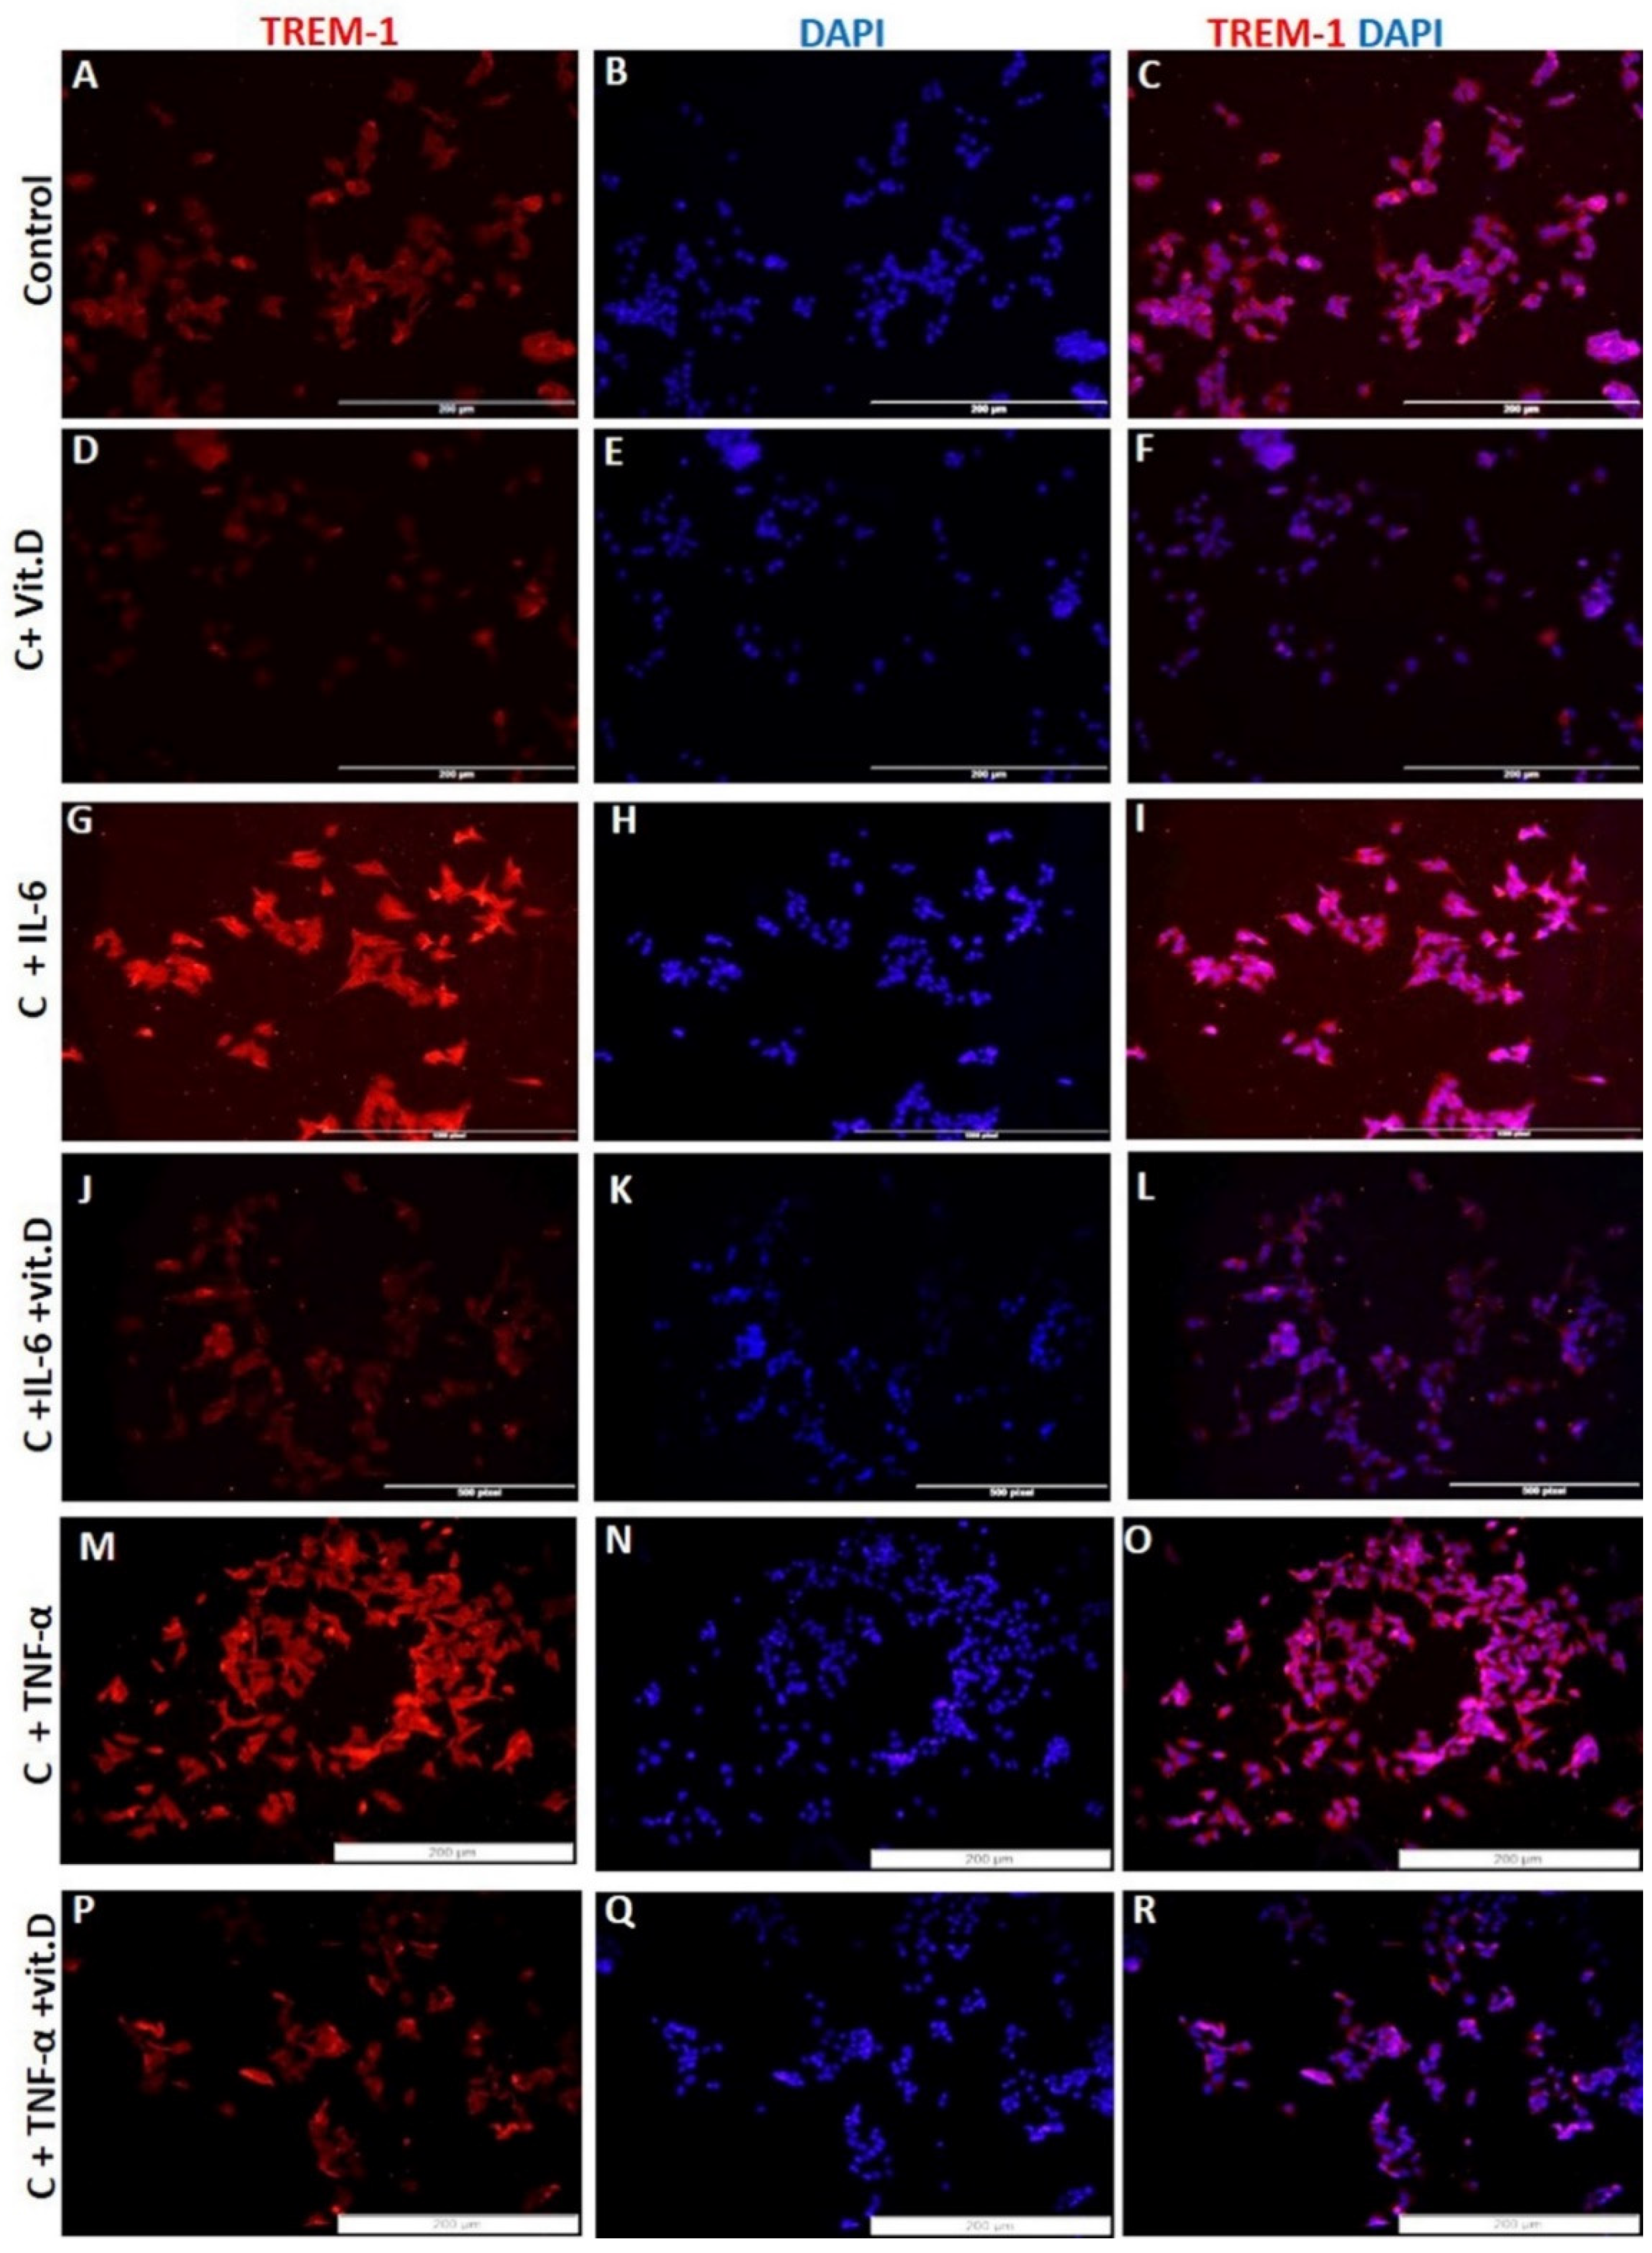
RT-PCR studies showed significantly increased (p < 0.05) TREM-1 mRNA expression in HepG-2 cells treated with IL-6 and TNF-α and significantly decreased expression with calcitriol (Figure 1a). The effects of IL-6, TNF-α, and calcitriol on TREM-1 and TREM-2 expression were similar on Western blot analysis (Figure 1d). It was also noted that calcitriol attenuated the effect of IL-6 and TNF-α on TREM-1 expression. These findings were supported by IF for protein expression and increased TREM-1 immunoreactivity with IL-6 and TNF-α and decreased immunoreactivity with calcitriol (Figure 3). Further, decreased expression of TREM-1 with calcitriol, even in the presence of IL-6 and TNF-α, supports the effective role of vitamin D in attenuating the inflammation in HepG2 cells (Figure 3). There was an increased mRNA expression of TREM-2 with IL-6, TNF-α, and vitamin D (Figure 1a). However, upregulation of TREM-2 mRNA expression was more with calcitriol than with IL-6 and TNF-α. Calcitriol suppresses the effect of IL-6 and TNF-α on TREM-1 expression, while it had an additive effect on TREM-2 expression in HepG-2 cells. These findings suggest that vitamin D downregulates TREM-1 expression as well as the effect of pro-inflammatory cytokines in HepG-2 cells. Since calcitriol showed an attenuated effect on the gene and protein expression of TREM-1 even in the presence of IL-6 and TNF-α, we sought to investigate the receptors and enzymes involved in vitamin D activity and metabolism. Immunostaining of HepG2 and THLE2 cells showing immunopositivity for vitamin D receptor (VDR), Cyp24A1, and Cyp27B1 (Supplementary Figure S2) suggests the presence of VDR, Cyp24A1, and Cyp27B1 in both THLE-2 and HepG2 cell lines. The increased immunoreactivity for VDR, Cyp24A1 and Cyp27B1 in HepG2 cells compared to THLE-2 cells suggests their increased activity in HepG2 cells.
2.3. Recombinant (r)HMGB-1 Increases Expression of TREM-1 in HepG2 Cells
HMGB-1 secreted from necrotic cells binds to TREM-1 and activates TREM-1. This results in the activation of downstream signaling pathways and transcription factors leading to increased secretion of pro-inflammatory cytokines. IF studies revealed increased expression of HMGB-1 in HepG2 cells compared to THLE-2 cells (Figure 2), so we investigated the effect of recombinant (r) HMGB-1 (H4652, Sigma Aldrich) on TREM-1 gene expression. RT-PCR studies showed a significantly increased mRNA expression of TREM-1 (Figure 4a), IL-6 (Figure 4b), and TNF-α (Figure 4c) with rHMGB-1. These findings were supported by the increased expression of TREM-1, IL-6, and TNF-α (Figure 4 panels D, J, and P) in HepG2 cells treated with rHMGB-1. These findings suggest that HMGB-1 activates the mediators of inflammation and factors associated with HCC pathology.
2.4. Vitamin D Downregulates NF-κB Expression in HepG-2 Cells
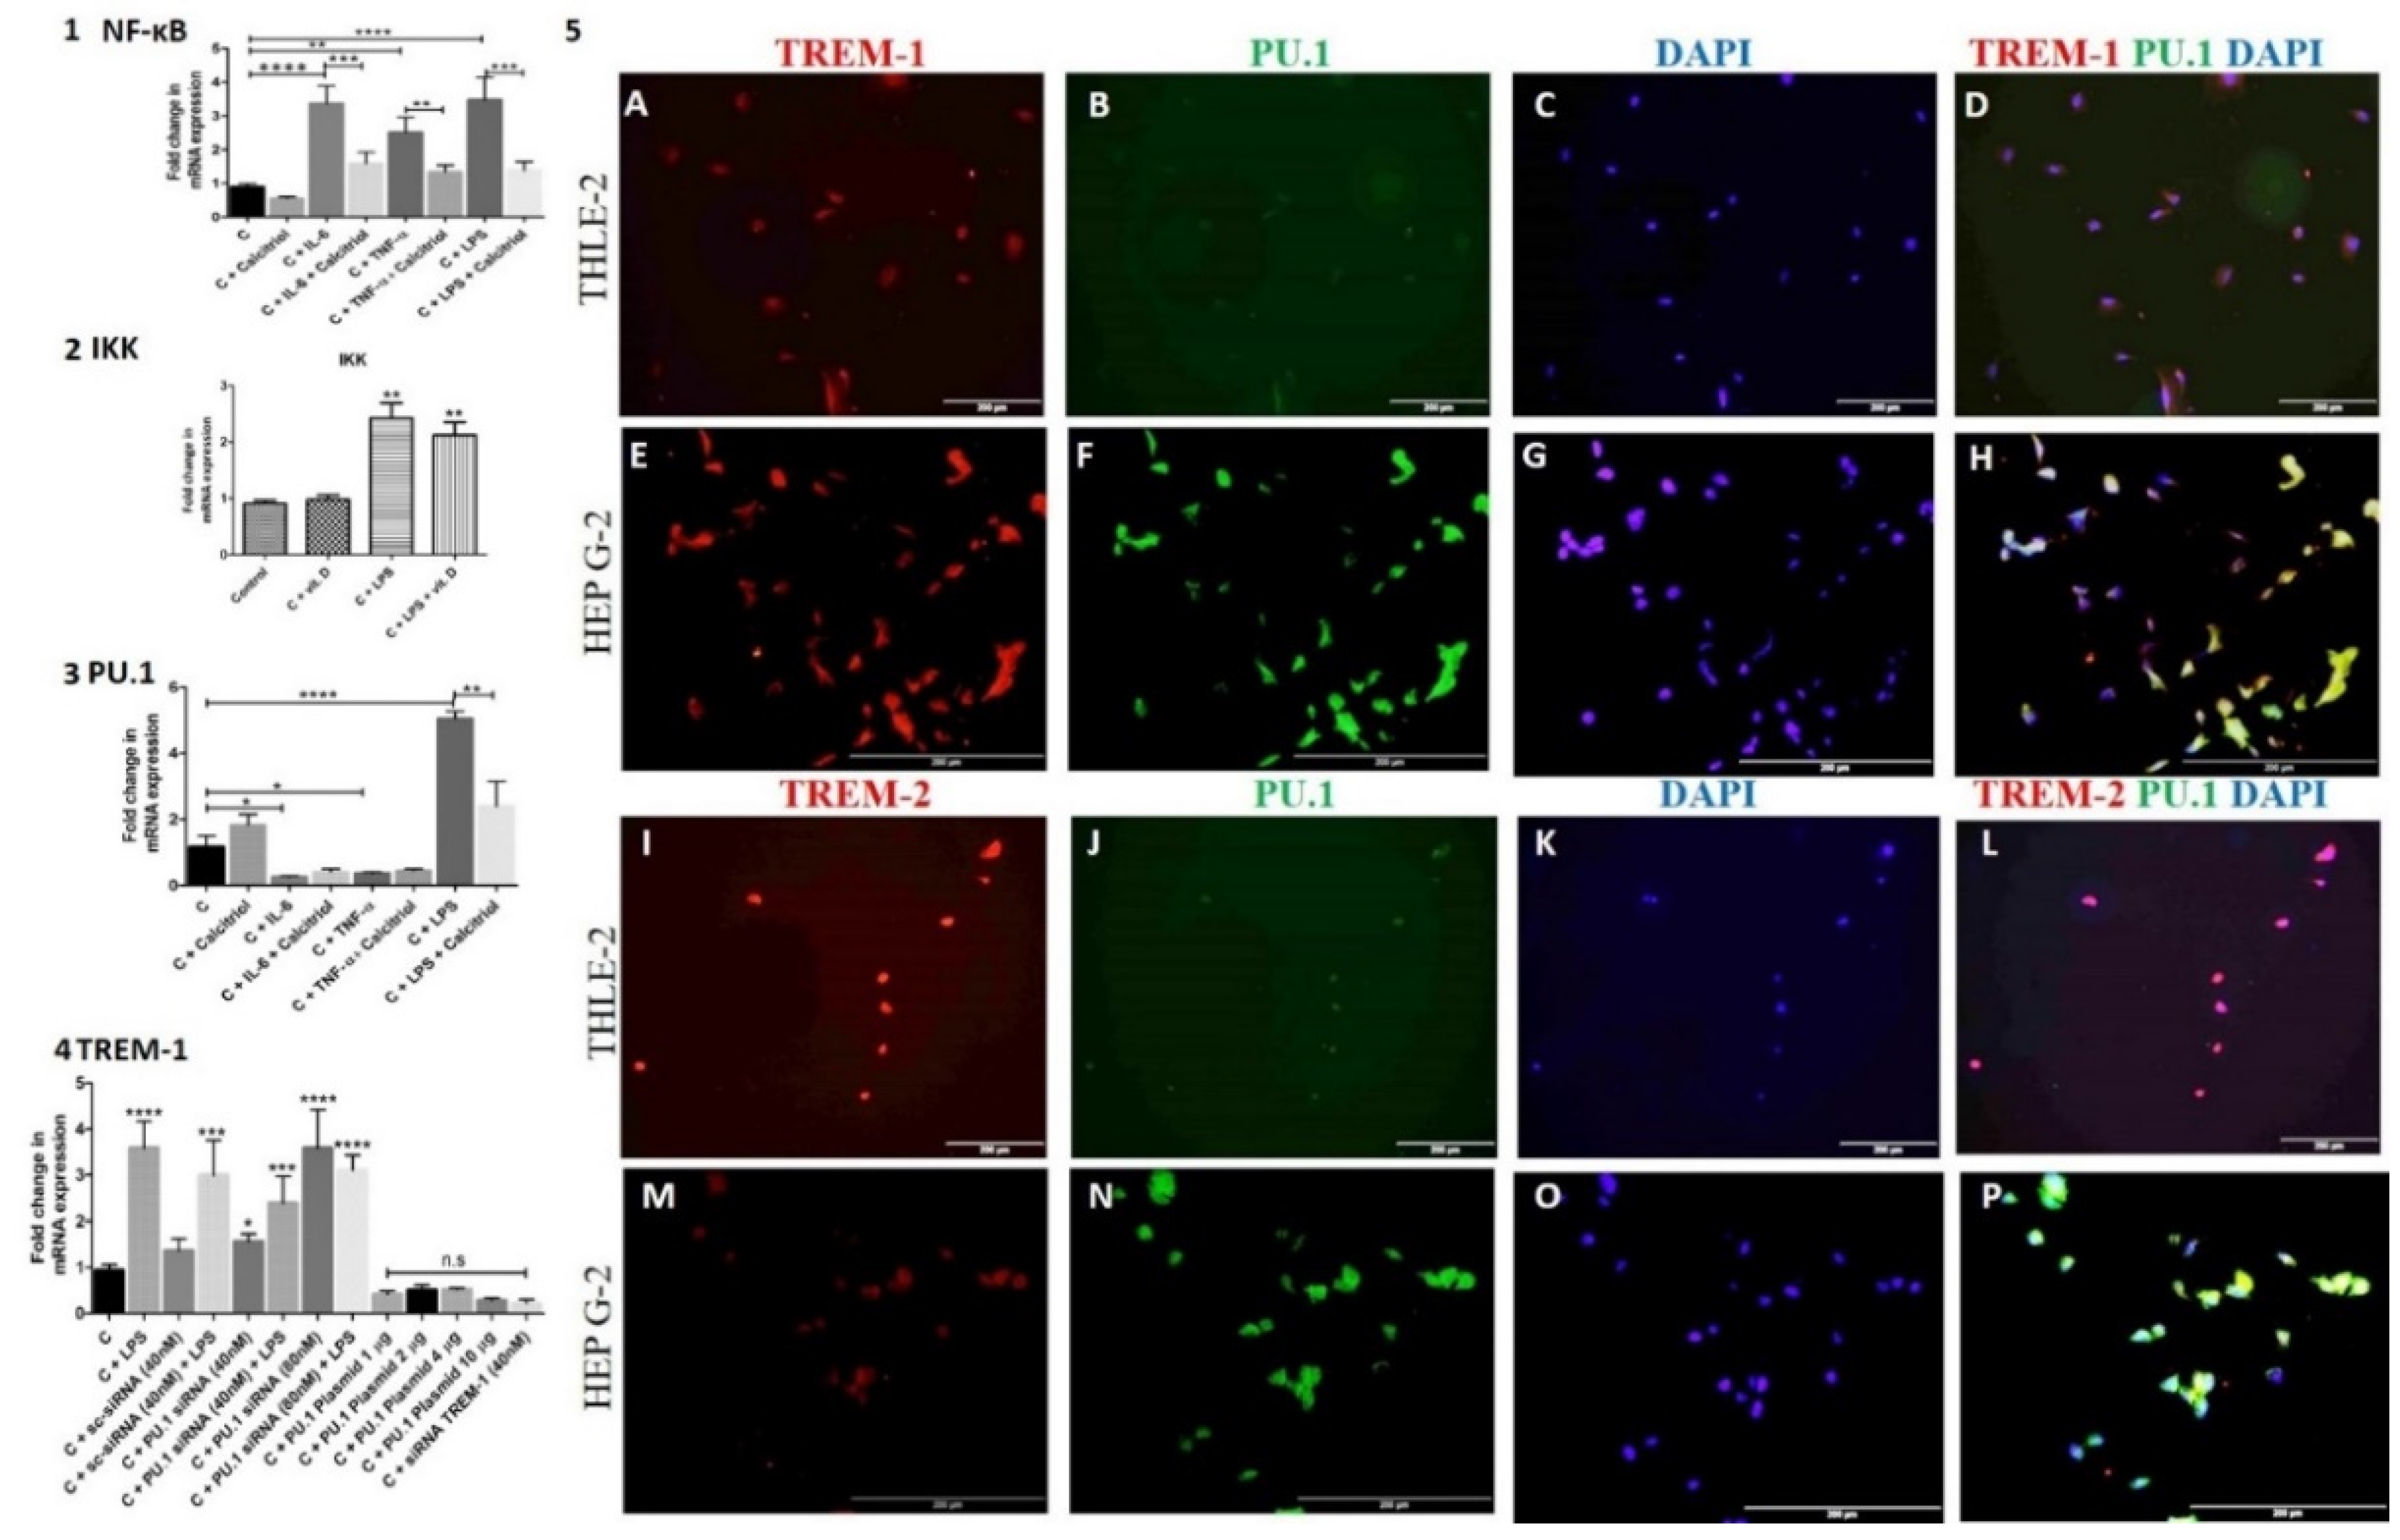
NF-κB is a downstream signaling transcription factor in the HMGB-1 pathway and regulates TREM-1 expression, so we investigated the effect of calcitriol, IL-6, TNF-α, and LPS on the expression of NF-κB. RT-PCR analysis of the HepG-2 cells treated with calcitriol, IL-6, TNF-α, and LPS showed downregulated mRNA expression of NF-κB with calcitriol and an upregulated mRNA expression of NF-κB with IL-6, TNF-α, and LPS (Figure 5 panel 1). The results also revealed an immunomodulating effect of calcitriol on the effect of IL-6, TNF-α, and LPS and decreased effects of IL-6, TNF-α, and LPS on the mRNA expression of NF-κB (Figure 5 panel 1). Increased expression with LPS and decreased expression of IκB Kinase (IKK) with calcitriol further suggest the immunomodulatory effect of calcitriol (Figure 5 panel 2).
2.5. PU.1 Regulates the Expression of TREM-1 in HepG2 Cells
To elucidate the transcription factors (TF) regulating the expression of TREM-1 other than NK-κB, we investigated the role ofPU.1. PU.1 is a transcription factor binding to the promoter region of the TREM-1 gene and regulates the expression of TREM-1. RT-PCR and IF studies revealed the presence of PU.1 in HepG2 cells (Figure 5 panel 5). Immunopositivity for PU.1 in HepG-2 and THLE-2 cells showed the nuclear expression of PU.1 (Figure 5 panels 5B, F, J, and N). It was also noted that PU.1 expression was more in HepG2 cells compared to THLE-2 cells and co-localizes with TREM-1 (Figure 5 panels 5D, H, L, and P) in THLE-2 and Hep G-2 cells. RT-PCR studies showed that calcitriol and LPS increase while IL-6 and TNF-α attenuate PU.1 mRNA expression in HepG-2 cells (Figure 5 panel 3). These results indicate the inhibitory effect of IL-6 and TNF-α and the stimulatory effect of vitamin D and LPS on PU.1. Further, to investigate the effect of PU.1 on TREM-1 expression, we treated the cells with PU.1 siRNA to suppress its expression and plasmid to overexpress it. The titration with 40 nM and 80 nM of PU.1 siRNA showed a higher inhibitory effect on PU.1 at 80 nM. Increased expression of TREM-1 with siRNA PU.1, more at 80 nM, suggests a negative correlation between TREM-1 and PU.1 (Figure 5 panel 4). To further, test this hypothesis, HepG2 cells were treated with PU.1 plasmid. Transfection of HepG-2 cells with PU.1 plasmid enhances the PU.1 mRNA expression and decreased TREM-1 mRNA expression. These results confirmed the hypothesis that PU.1 negatively correlates with TREM-1 expression. Titration of the plasmid cDNA at a concentration of 1, 2, 4, and 10 μg showed a maximum effect of PU.1 plasmid at 10 μg and this was reflected by decreased TREM-1 mRNA expression (Figure 5 panel 4). Suppression of TREM-1 expression was confirmed by TREM-1 siRNA. These results suggest that suppression of PU.1 results in the upregulation and overexpression of PU.1 which downregulates TREM-1 mRNA expression.
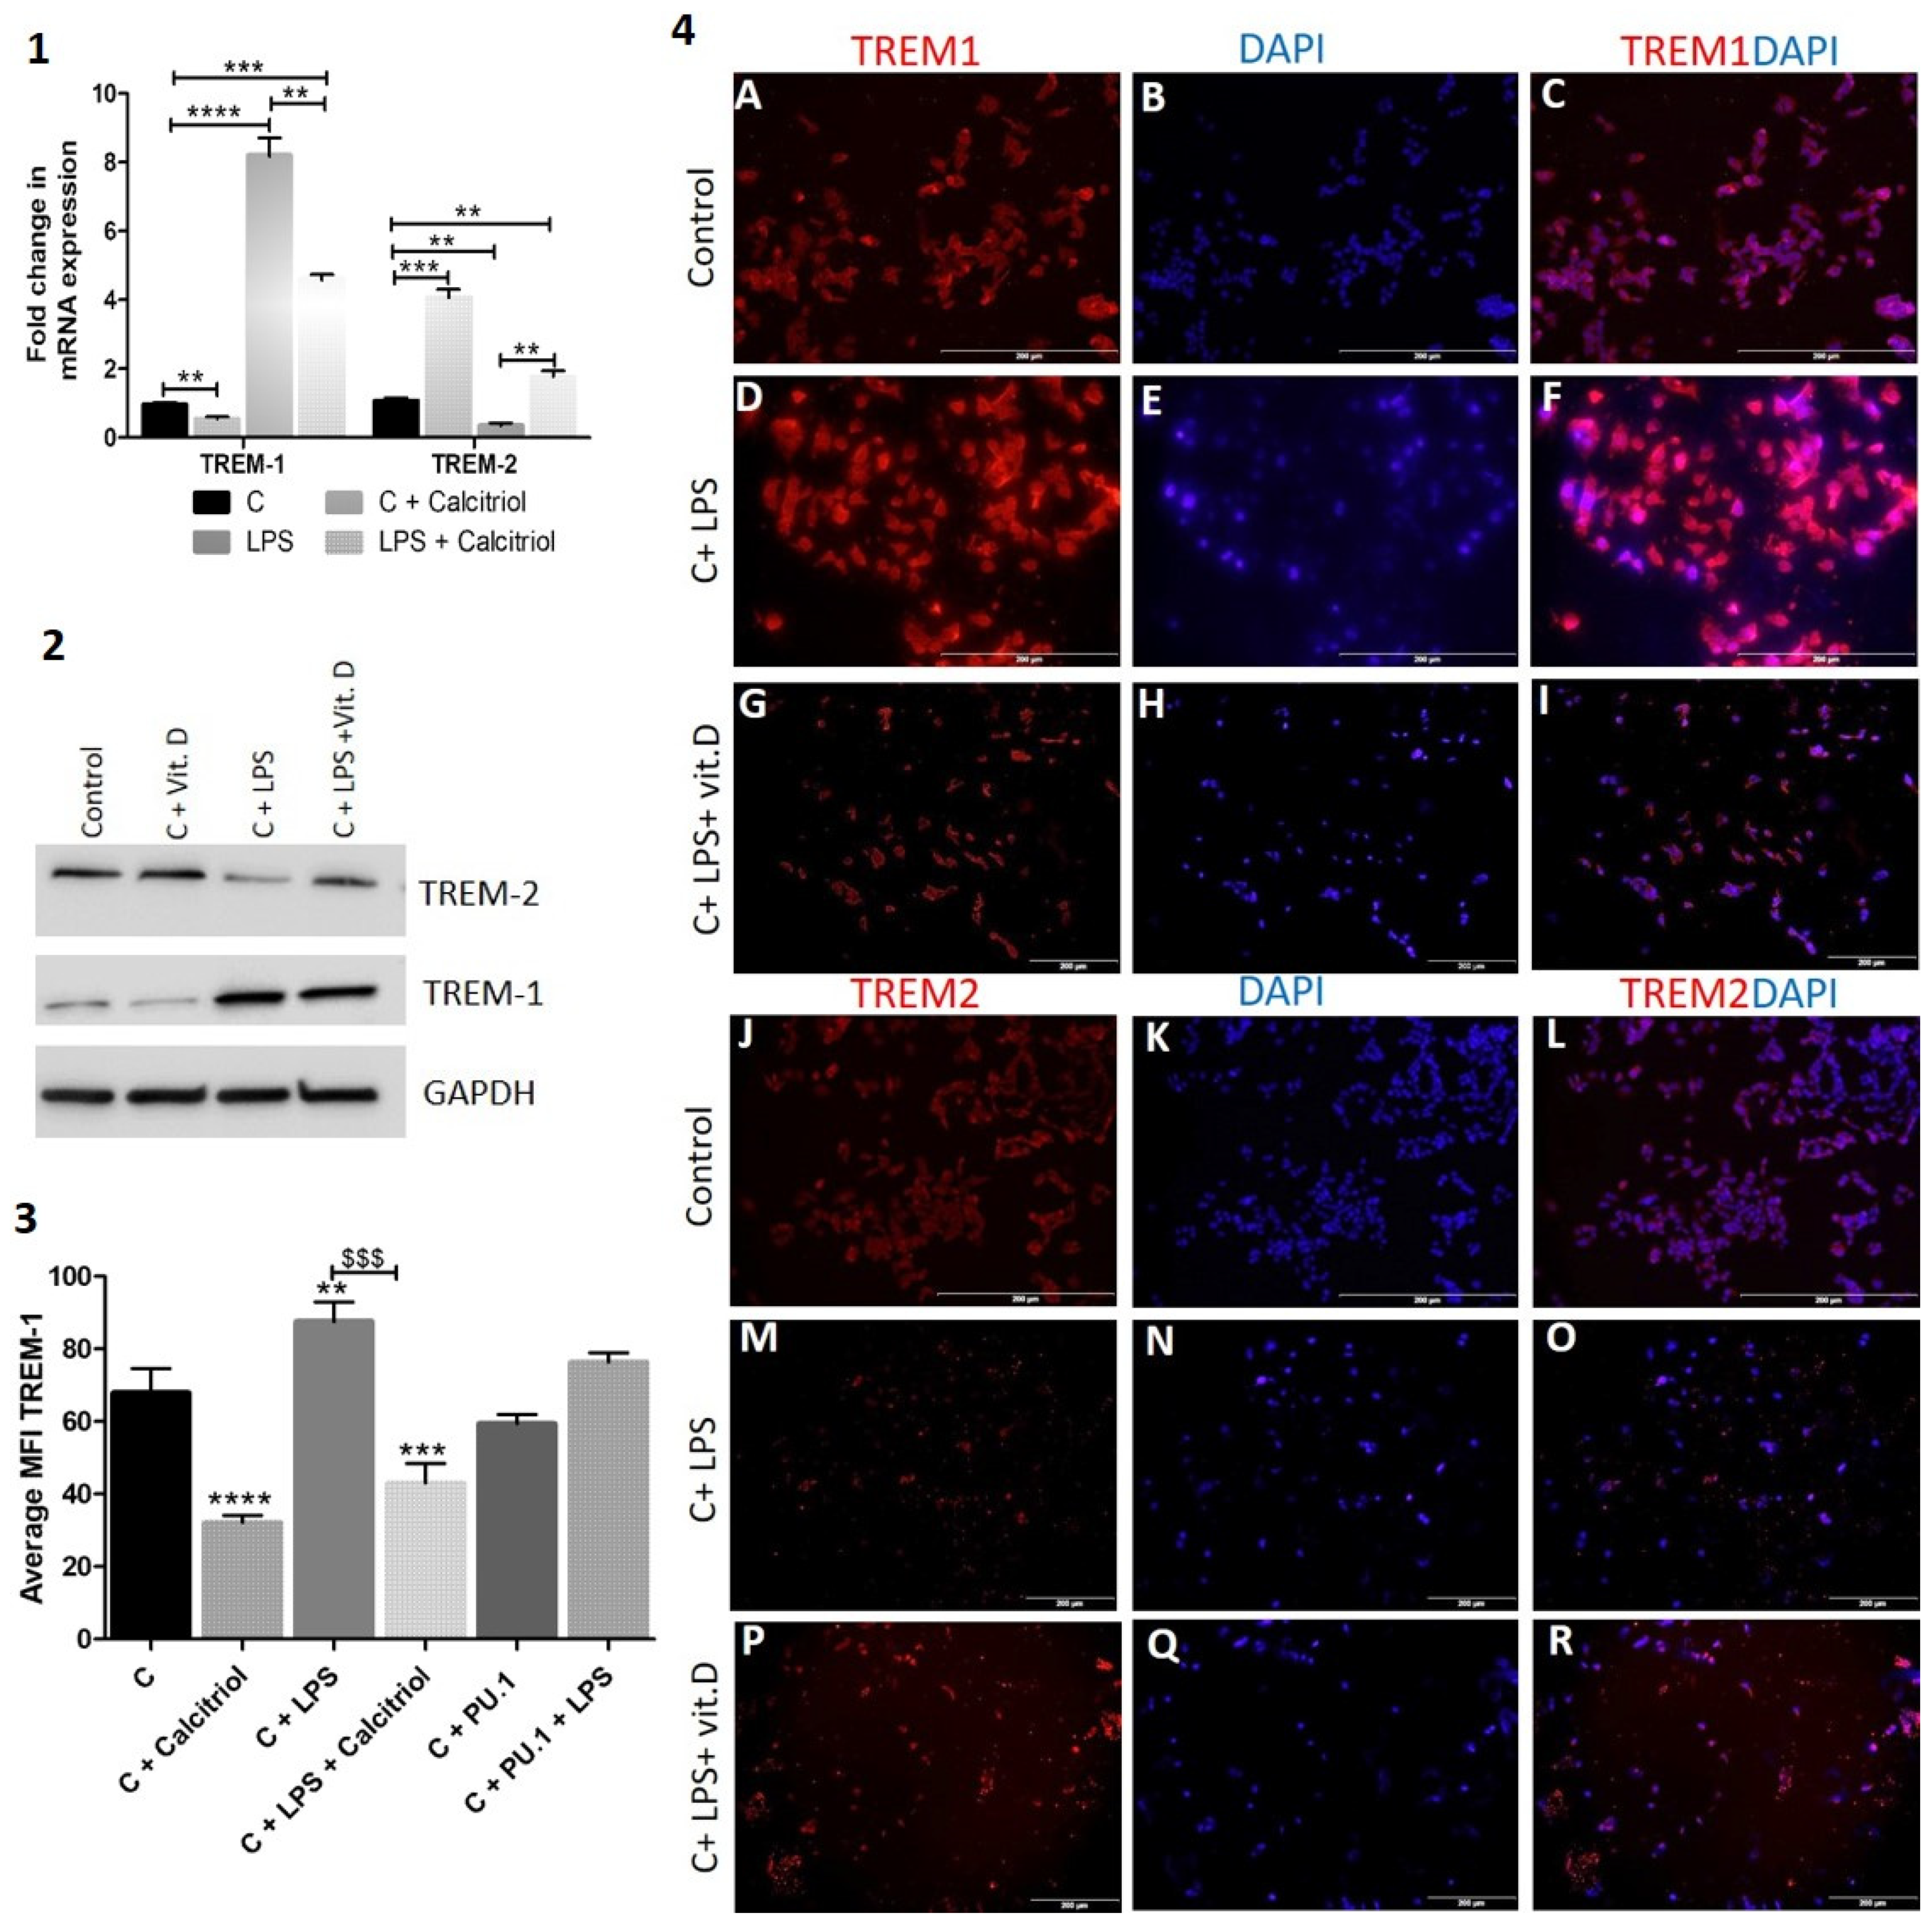
Lipopolysaccharide (LPS) increases the expression of TREM-1 in HepG2 cells: Lipopolysaccharides (LPS) and endotoxins, are large molecules found in the outer membrane of gram-negative bacteria. LPS or LPS/TLR4 complex interaction with TREM-1 activates TREM-1 and induces inflammatory signaling resulting in chronic inflammation. To investigate the effect of LPS on TREM-1 in HepG2 cells, we treated the cells with LPS and checked the expression of TREM-1. RT-PCR studies revealed significantly increased TREM-1 and decreased TREM-2 mRNA expression with LPS and significantly increased TREM-2 and decreased TREM-1 mRNA expression with calcitriol (Figure 6 panel 1). Similar results were revealed with Western blot (Figure 6 panel 2). It was also observed that calcitriol attenuates the effect of LPS on TREM-1 and TREM-2 expression. These findings were further validated with immunofluorescence studies and mean fluorescence intensity analysis (Figure 6 panel 3) of the HepG2 cells stained for TREM-1 and TREM-2 (Figure 6 panel 4). The results showed increased TREM-1 expression with LPS and attenuation of the effect of LPS with calcitriol. It was also observed that the effect of PU.1 decreased with LPS (Figure 6 panel 2).
2.6. IL-6 and TNF-α Increase While Calcitriol Decreased Proliferation, Migration, and Invasion of HepG-2 Cells
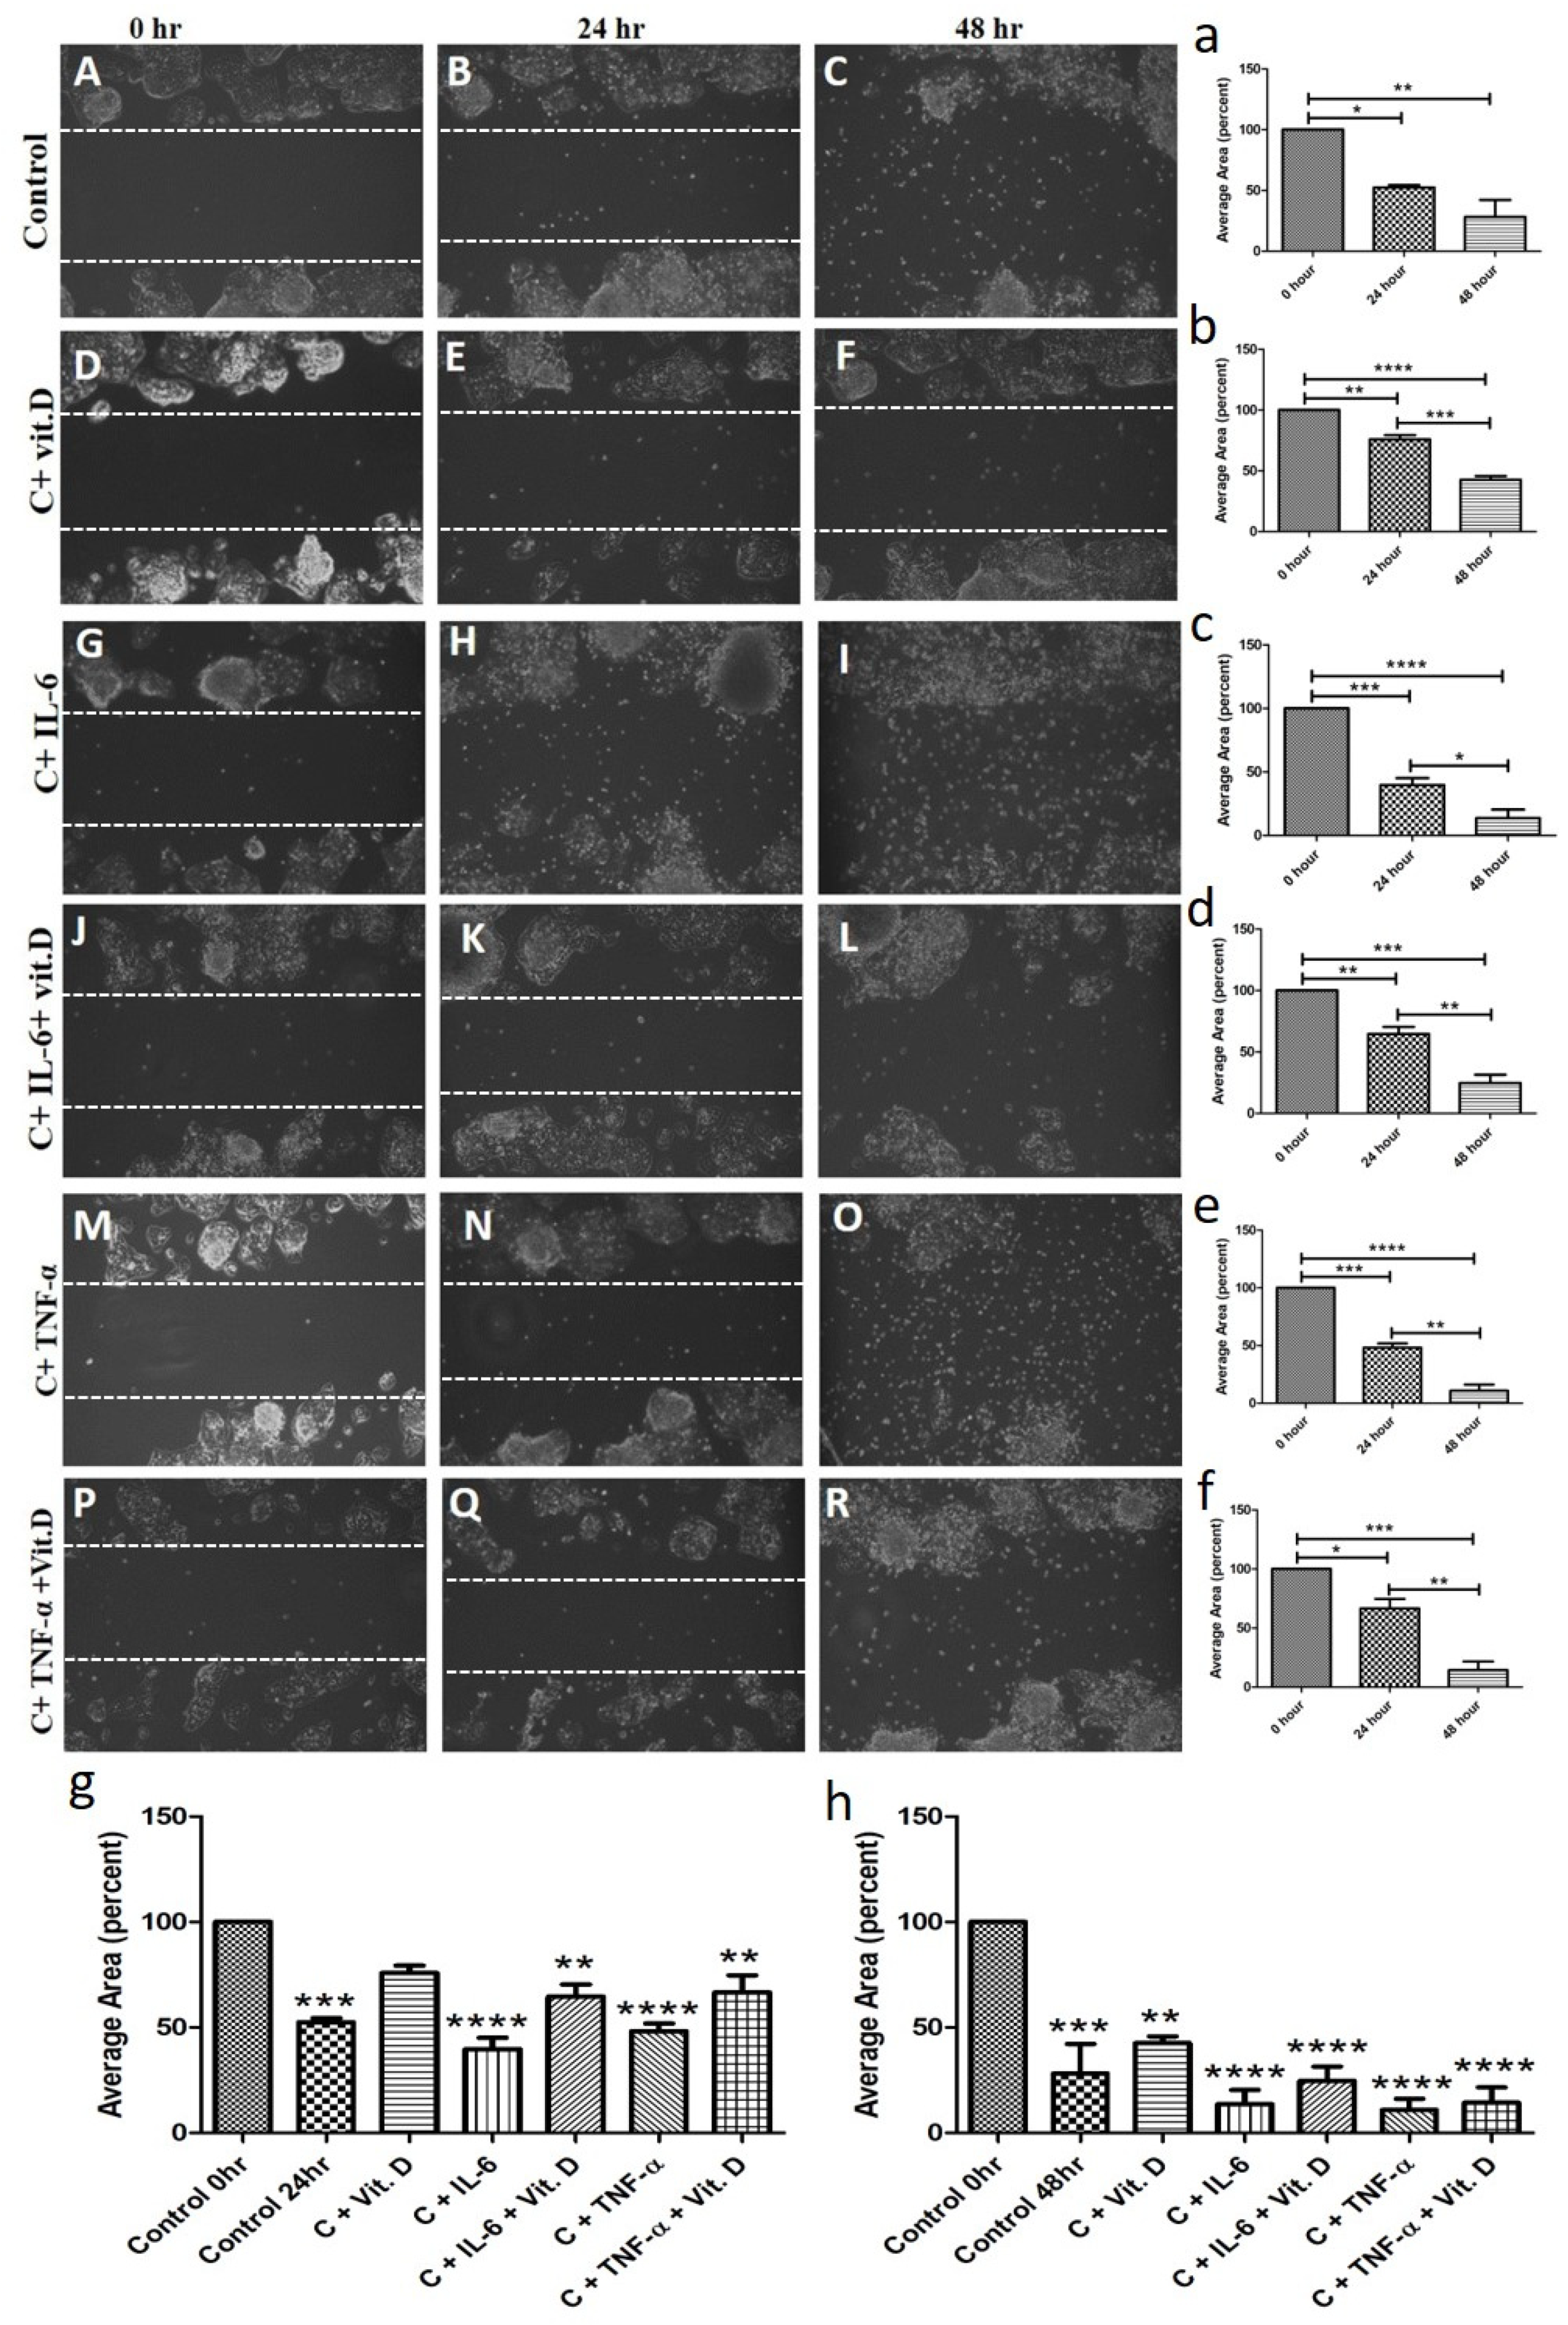
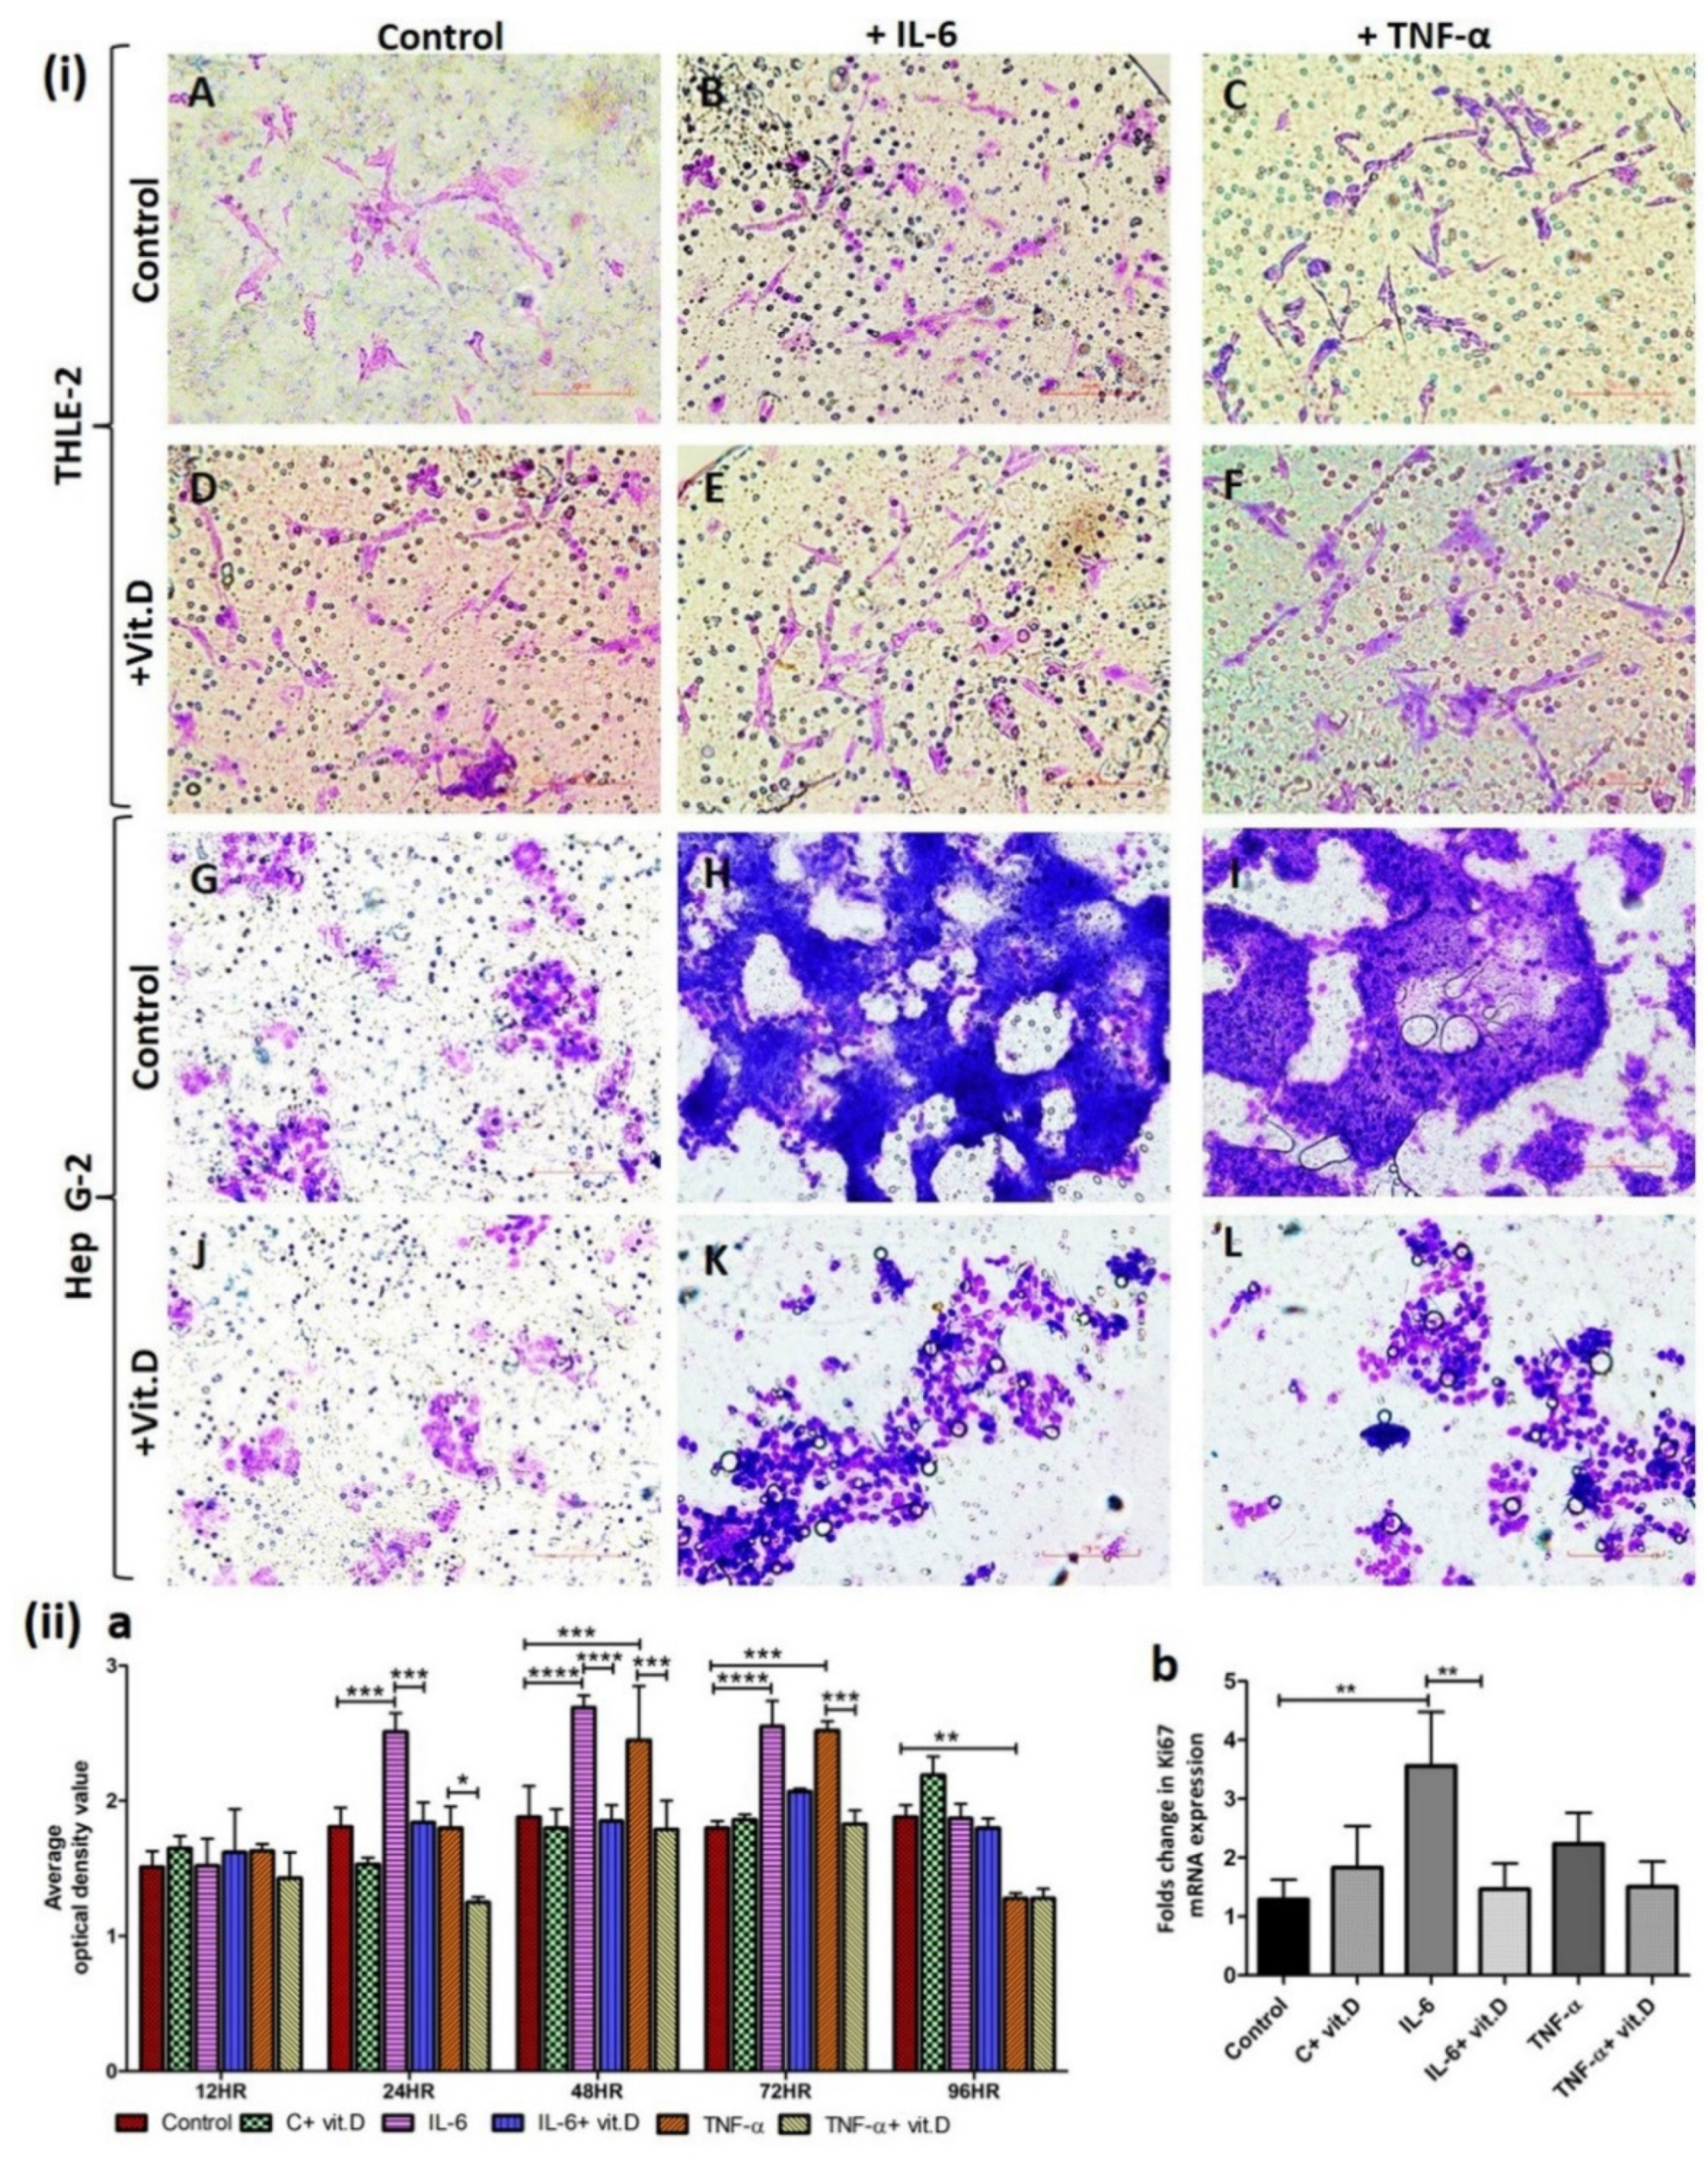
IL-6 and TNF-α play a crucial role in the pathogenesis of carcinoma and vitamin D plays an immunomodulatory role, so we investigated the effect on proliferation, migration, and invasion of HepG2 cells. The scratch test for the migration assay of HepG-2 cells with and without treatment at 0, 24, and 48 h showed that calcitriol decreases (Figure 7 panels E and F) while IL-6 (Figure 7 panels H and I) and TNF-α (Figure 7 panels N and O) increase the migration of HepG-2 cells compared to control (Figure 7 panel B and C). It was also observed that HepG-2 cell migration is less with calcitriol even in the presence of IL-6 and TNF-α compared to treatment with IL-6 (Figure 7 panels H and I vs. Figure 7 panels K and L) and TNF-α (Figure 7 panels N and O vs. Figure 7 panels Q and R) alone. Trans-well invasion assay of HepG-2 and THLE-2 cells shows that IL-6 and TNF-α increase the invasion of HepG-2 cells (Figure 8(i) panels H and I) and decrease the invasion of THLE-2 cells (Figure 8(i) panels B and C) while calcitriol increase invasion of THLE-2 cells (Figure 8(i) panel D) and decrease invasion of HepG-2 cells (Figure 8(i) panel J). Additionally, it was also found that calcitriol decreases the effect of IL-6 and TNF-α on the migration of HepG-2 (Figure 8(i) panels K and L) and THLE-2 cells (Figure 8(i) panels E and F). To analyze the effect of calcitriol, IL-6, and TNF-α on the proliferation of HepG2 cells, CCK-8 proliferation assay (Figure 8(ii) panel a) and RT-PCR for Ki-67 mRNA expression (Figure 8(ii) panel b) was performed with and without treatment. CCK8 assay revealed significantly increased proliferation with IL-6 at 24, 48, and 72 h. and with TNF-α at 48 and 72 h. whereas a decrease in proliferation with calcitriol. These results were supported by increased Ki67 mRNA with IL-6 and TNF-α and decreased mRNA expression with calcitriol after 24 h of treatment (Figure 8(ii) panel b).
2.7. Calcitriol Attenuates TREM-1 Expression in SNU387 HCC Cell Line
The findings in HepG-2 and THLE-2 cells were supported by the increased expression of TREM-1 in another cell line, SNU387, and decreased expression with calcitriol, even in the presence of LPS (Figure 9 panel 1). Additionally, LPS increases and calcitriol decrease TREM-1 and IKK mRNA expression (Figure 9 panels 2 and 3) and proliferation (Figure 9 panel 4) of SNU387 cells.
3. Discussion
Increased expression of TREM-1, IL-6, and TNF-α in HepG-2 cells compared to THLE-2 cells (Figure 1) suggests the presence of inflammation and association with HCC [32]. Increased TREM-1 expression associates with lung and hepatocellular carcinoma [9,18,20,21,35]. TREM-2 is an anti-inflammatory mediator and negatively regulates the immune response and inflammation. A decreased expression of TREM-2 in HepG-2 cells and increased expression in THLE-2 cells in this study indicate a higher level of inflammation and paucity of anti-inflammatory mechanisms in HepG2 cells [23,28]. Chronic inflammation-mediated by IL-6 and TNF-α plays a crucial role in the pathogenesis of HCC development. IL-6 upregulates the expression of hepatitis B virus X-protein (HBx) and high levels of IL-6 have been reported in liver cirrhosis patients. Engagement of IL-6 with its receptor (IL-6R) in hepatocyte results in increased inflammatory activity and activation of the JAK-STAT pathway, ERK pathway, p38MAPK pathway, and PI3K pathway [36,37,38]. IL-6 induces the expression of mitogenic and pro-neoangiogenic and hepatocyte growth factors and decreases the HCC cell apoptosis. Further, the role of IL-6 in stimulating hepatic DNA synthesis, natural killer cell dysfunction, enhancing tumor development, and progression by escape mechanism from the immune response of the body has been discussed [37]. Studies have suggested IL-6 as a tumor marker and prognostic factor for HCC [7,37,39]. TNF-α plays an important role in liver disease and higher levels of TNF-α mediate hepatic inflammation, fibrosis, cirrhosis, and tissue damage in the liver, and induce pro-malignant chemokines, metalloproteinases, angiogenic mediators, and cell adhesion molecules, resulting in the pro-carcinogenic microenvironment [40]. TNF-α expression and secretion is regulated at the transcriptional level via AP-1, PU.1, and NF-κB, as well as at the post-transcriptional level [10,41,42,43,44]. This study revealed the increased expression of inflammatory mediators TREM-1, IL-6, and TNF-α and that vitamin D is an anti-inflammatory and immunomodulatory agent. We investigated the effects of calcitriol on TREM-1 expression and other mediators of inflammation in this study [45].
A decreased expression of TREM-1, IL-6, and TNF-α with calcitriol (Figure 1 and Figure 3) in this study suggests the immunomodulatory effect of calcitriol. Further, it was also revealed that calcitriol decreases the effect of IL-6 and TNF-α on TREM-1. These results are consistent with previous studies delineating the effect of vitamin D on mediators of inflammation. Vitamin D decreases the production of TNF-α and can improve the deleterious effect of pro-inflammatory cytokines in liver disease [45]. A reduction in the level of IL-6 with vitamin D supplementation in chronic HCV infection [46] and a reduction in levels of TNF-α and IL-6 in monocyte with vitamin D [47] support the findings of our study. The immunopositivity of VDR, Cyp24A1, and Cyp27B1 (Supplementary Figure S2) in HepG2 and THLE2 cells suggests the presence of receptors and the enzymes involved in vitamin D action and metabolism [48,49]. It has been reported that vitamin D enhances the expression of VDR, Cyp24A1, and Cyp27B1 in HCC [50]. The decreased expression of VDR in hepatocytes in HCV infection suggests the diminished protective role of vitamin D [51]. Reduced expression of VDR may indicate the severity and consequence of underlying liver disease. Thus, an increased amount of vitamin D may alleviate the effects of mediators of inflammation, which ultimately might delay the progression of the disease. Attenuation of TREM-1, IL-6, and TNF-α expression in HepG2 cells and suppression of the effect of IL-6 and TNF-α on TREM-1 expression by calcitriol in our study suggest that vitamin D supplementation might be used to suppress ongoing inflammation and progression of HCC. This hypothesis is supported by an increased expression of TREM-2, an anti-inflammatory mediator, with calcitriol in HepG2 cells. Increased expression of TREM-1 and TREM-2 and attenuation of the effect of IL-6 and TNF-α on TREM-1 in THLE-2 cells with calcitriol suggest that, in normal conditions, calcitriol upregulates the immune response by enhancing the expression of TREM-1 and increasing production of pro-inflammatory cytokines to initiate the immune response against inflammation. These results also suggest that calcitriol suppresses the inflammation in a diseased state and increases the production of pro-inflammatory cytokines in a non-diseased state.
HMGB-1, a TREM-1 ligand and secreted from apoptotic and necrotic cells, activates the pro-inflammatory pathways, and its association with the TREM-1 receptor on hepatocyte results in activation of pro-inflammatory pathways [8,9]. Increased immunopositivity of HMGB-1 in HepG2 cells compared to THLE2 cells indicates the increased expression of HMGB-1 in HCCls and since HMGB-1 activates the expression of TREM-1, we investigated the effect of rHMGB-1 on the TREM-1 expression. Increased TREM-1, IL-6, and TNF-α mRNA expression (Figure 4) in rHMGB-1 treated cells support the notion that HMGB-1 activates TREM-1 and the mediators of inflammation. HMGB-1 binding to the receptor for the advanced glycation end product (RAGE) results in the activation of nuclear factor-kappa B (NF-κB) leading to increased production of pro-inflammatory cytokines, including TNF-α, IL-6, IL-1β, and IL-1α [8]. Increased immunoreactivity for TREM-1, IL-6, and TNF-α (Figure 4) on IF in rHMGB-1 treated cells compared to untreated cells further supported the results of RT-PCR and the notion that HMGB-1 enhances the mediators of inflammation. Increased HMGB-1 signals through NF-κB and increases the secretion of IL-6 and TNF-α which in turn activates TREM-1 [8]. NF-κB is involved in inflammation and carcinogenesis and regulates inflammation, cell proliferation, differentiation and apoptosis, innate and adaptive immunity [52,53], and serves as a downstream signal transduction molecule for TREM-1 [54]. Increased mRNA expression of NF-κB with IL-6 and TNF-α in HepG2 cells (Figure 5) indicates the downstream signaling for HMGB-1 and the results of increased TREM-1 expression with IL-6, TNF-α, and rHMGB-1 adds to the fact that these mediators upregulate TREM-1. However, decreased expression of NF-κB, IL-6, and TNF-α with calcitriol, as well as attenuation of the effect of IL-6, TNF-α, and rHMGB-1 on TREM-1 and NF-κB (Figure 1 and Figure 5) expression is suggestive of the immunomodulatory role of vitamin D.
The downstream transcription factors involved in the activation of the TREM-1 gene are AP-1, PU.1, and NF-κB [54]. PU.1, a member of the Ets domain transcriptional factor family with abundant expression in B cells and macrophages, is involved in protein-protein interaction. Activation of PU.1 by LPS in monocytes and RAW cells [54] and the role of PU.1 in macrophage maturation [55] and inflammation by regulating COX-2 gene expression [56] have been reported. We found co-localization of TREM-1 and TREM-2 with PU.1 in THLE-2 and Hep G-2 cells (Figure 5) and thus evaluated the effect of PU.1 on TREM-1. RT-PCR studies for PU.1 expression in HepG-2 cells showed that calcitriol increases PU.1 expression while the pro-inflammatory cytokines IL-6 and TNF-α decrease the PU.1 expression (Figure 5). It was observed that treatment of HepG-2 cells with PU.1 siRNA decreases PU.1 expression and increases TREM-1 expression while the treatment of HepG-2 cells with PU.1 plasmid increases PU.1 expression and decreases TREM-1 expression (Figure 5). These results suggest that overexpression of PU.1 has an inhibitory effect on TREM-1 expression and decreased PU.1 expression increases TREM-1 expression. These results are per previous studies reporting the molecular mechanism of PU.1 regulating TREM-1. PU.1 and NF-κB bind to the promoter region of the TREM-1 gene upon LPS stimulation and activation of TREM-1 involves the binding of NF-κB and AP-1 earlier than PU.1. Activation of NF-κB induces TREM-1 expression while PU.1 has a negative regulatory role on TREM-1 expression. Further, PU.1 silencing enhances the expression of TREM-1 while PU.1 overexpression attenuates TREM-1 expression in macrophages [54]. Similar results with PU.1 siRNA and plasmid in HepG2 cells on TREM-1 expression indicate that PU.1 regulated TREM-1 expression and might be a therapeutic target. LPS is involved in the activation of NF-κB, which in turn regulates TREM-1 expression at the transcriptional level [54]. Thus, to analyze the effect of LPS on TREM-1 in HepG2 cells, we treated the cells with LPS. RT-PCR and IF studies revealed significantly increased TREM-1 and significantly decreased TREM-2 expression with LPS. The attenuation of this effect with calcitriol suggests the immunomodulatory properties of vitamin D.
TREM-1 plays a role in the invasiveness of cancer [35] and its role in the invasion of HCC has been discussed [21]. TREM-1 significantly (p < 0.05) promotes proliferation and invasion and inhibits the apoptosis of the HCC cells. High TREM-1 is correlated with poorer survival and increased recurrence of HCC and is a prognostic factor for HCC [20]. IL-6 affects cell proliferation, survival, differentiation, migration, invasion, and proliferation [57]. The enhanced and uncontrolled proliferation of the hepatocyte results in the development of HCC. Increased TREM-1 expression in HepG2 cells compared to THLE2 cells indicate that TREM-1 might increase proliferation, migration, and invasion of hepatocellular carcinoma. The results of this study suggest that calcitriol attenuates TREM-1 expression. Thus, we evaluated the effect of calcitriol on HepG2 cell proliferation, migration, and invasion. The scratch test, invasion assay, CCK-8 proliferation assay, and mRNA expression of Ki67 showed that calcitriol decreased the migration, invasion, and proliferation (Figure 7 and Figure 8) of HepG2 cells. Further, attenuation of the effect of IL-6 and TNF-α on proliferation, migration, and invasion with calcitriol suggests the inhibitory effect of vitamin D on pro-inflammatory cytokines IL-6 and TNF-α. The suppressive effect of vitamin D on IL-6 secretion and function has been reported [58]. Since the suppression of IL-6 results in growth inhibition of breast [59] and prostate cancer [60], calcitriol might be used therapeutically in suppressing HCC growth and delaying the progression of various stages of HCC. This notion is supported by the fact that the proliferation of hepatoma cell lines including HepG2 cells can be inhibited by vitamin D [49,61]. Overall, the findings of this study suggest that proinflammatory mediators increase the expression of TREM-1 and calcitriol attenuates TREM-1 expression in HCC cells, even in the presence of IL-6 and TNF-α.
4. Material and Methods
4.1. Cell Culture and Treatment Protocol
HCC cell line (Hep G-2) and epithelial cells transformed with SV40 large T antigen (THLE-2) were purchased from ATCC (Manassas, VA, USA). Hep G-2 cells were cultured in Eagle’s Minimum Essential Medium with L-Glutamine (EMEM from ATCC) medium with 10% fetal bovine serum and 1% penicillin-streptomycin and THLE-2 cells were cultured in Bronchial Epithelial Cell Medium (BEpiCM from ATCC) medium with 10% fetal bovine serum, 1% BEpiCGS growth factor, and 1% penicillin-streptomycin at 37 °C in a 5% CO2, 95% air environment humidified incubators. HepG-2 and THLE-2 cells were grown in a T25 flask to 80–90% confluence. Approximately 50,000 cells were seeded in each chamber of the chamber slide for immunofluorescence (IF) studies, and around 250,000–300,000 cells in each well of a 6-well plate for RT-PCR studies and scratch test. The cells were grown till 70–80% confluence and were kept in a serum-free medium for 2 h before treatments. The cells were treated with recombinant human IL-6 (10 ng/mL), TNF-α (10 ng/mL) (Peprotech, NJ, USA), and calcitriol (10 nM) (Vitamin D3, D1530, Sigma Aldrich, St. Louis, MO, USA) for 24 h. The doses of each reagent were calculated based on dose titration studies.
4.2. Immunofluorescence
IF studies were done for the expression of the protein of interest as per the standard protocol in our laboratory. Briefly, cells in chamber slides were fixed with 4% formalin for 15 min, washed, and incubated with 0.1% triton for 10 min. Blocking with 5% fetal bovine serum in PBS for a half-hour was followed by incubation overnight at 4 °C with primary antibodies, including goat anti-TREM-1(sc-19309), rabbit anti-TREM-2 (sc-48764), goat anti-HMGB-1 (sc-26351), rabbit anti-DAP-12 (sc-20783), rabbit anti-VDR (sc-9164), rabbit anti-Cyp24A1 (sc-32166), goat anti-Cyp27B1(sc-67261), and rabbit anti-PU.1 (sc-352) in 1:50 dilution from Santa Cruz Biotechnologies (Dallas, TX, USA), rabbit anti-IL-6 (ab6672) in 1:200 dilution, and mouse anti-TNF-α (ab1793) in 1:200 dilution from Abcam, Cambridge, MA, USA. Cells were washed with PBS three times for five minutes each, followed by incubation with corresponding Alexa Fluor 594 (red) and Alexa Fluor 488 (green) secondary antibodies (Life Technologies, Grand Island, NY, USA) in 1:1000 dilution for 30 min. After 3 washes with PBS, cells were counterstained with DAPI (4, 6-diamidino-2-phenylindole) to stain the nucleus and mounted with a mounting medium. Stained cells were scanned with an Olympus inverted fluorescent microscope (Olympus BX51). Mean fluorescence intensity (MFI) was calculated by Image-J software using 10 cells in each image with 3 images for each protein (n = 3).
4.3. RNA Isolation, cDNA Synthesis, and Real-Time PCR
Total RNA was extracted using Trizol reagent (Sigma, St Louis, MO, USA) following manufacturer’s instructions, and RNA yield was measured using Nanodrop 2000. The cDNA was prepared using an oligo (dT) primer and Improm II reverse transcription kit (Promega, Madison, WI, USA) following the manufacturer’s instructions. Real-time PCR (RT-qPCR) was performed in triplicate using SYBR Green using the CFX96 RT-PCR system (BioRad Laboratories, Hercules, CA, USA). The primers (Table 1) were obtained from Integrated DNA Technologies (Coralville, IA, USA). The PCR cycling conditions were 5 min at 95 °C for initial denaturation, 40 cycles of 30 s each at 95 °C (denaturation), 30 s at 55–60 °C (according to the primer annealing temperatures), and 30 s at 72 °C (extension) followed by melting curve analysis. Folds change in mRNA expression relative to controls was analyzed using 2−^^ct after normalization with GAPDH. Each experiment was repeated for three biological replicates (n = 3).
4.4. Small Interfering RNA (siRNA) Transfection Assay
PU.1 siRNA (sc-36330) transfection in HepG-2 cells was done according to the manufacturer’s instructions (Santa Cruz Biotechnologies. Dallas, TX, USA) in a 6-well plate using Lipofectamine 2000, Plus reagent, and Opti-MEM medium (Gibco). Then, 4 μL (40 nM) of siRNA, 14.4 μL of Lipofectamine, and 6 μL of Plus Reagent were used for transfection. Transfection assay was done for 48 h, repeated three times. LPS treatment of the transfected cells was performed for 24 h. The mRNA was extracted from the transfected cells and subjected to RT-PCR studies for PU.1 and TREM-1expression. The experiment was repeated three times.
4.5. Plasmid cDNA Transfection Assay
PU.1 plasmid (LZRS PU.1 WT #34835 from Addgene, Watertown, Massachusetts, USA) transfection was carried out in Hep G-2 cells according to manufactures protocol. Briefly, the plasmid was propagated with LB Agar (L24030-500, RPI Corp. Mount Prospect, IL, and the USA). Plasmid cDNA was prepared by using the QIAprep Spin Miniprep Kit (Quigen #27106) following the manufacturer’s protocol and quantitated by Nanodrop (Thermo Scientific, Rockford, IL, USA). Titration studies were undertaken using 1, 2, 4, and 10 μg cDNA. The maximum effect was found with 10 μg and hence was used for further studies. Transfection of PU.1 plasmid cDNA was done with the same protocol as in the case of siRNA transfection. The mRNA was extracted from the transfected cells and mRNA expression studies were performed for PU.1 and TREM-1 by RT-PCR. The experiment was repeated three times.
4.6. Migration, Invasion, and Proliferation Assay
Trans-well chamber inserts (Corning Inc. Corning, NY, USA) with 8-μm size were used for the migration and invasion assay. Hep G-2 and THLE-2 cells in a concentration of 5 × 10⁴/mL in respective serum-free medium were inoculated on the upper chamber of the transwell. Serum-free medium with (IL-6, TNF-α, calcitriol) and without treatment was added to the lower compartment. Cells were incubated in a humidified incubator (5%CO2, 37 °C) for 24 h. Migrated cells through the permeable membrane were fixed with 100% methanol and stained with Hem-diff stain. Cells in 10 fields (20×) were scanned (n = 3).
A scratch test for cell migration was performed with cytokine IL-6 (10 ng/mL), TNF-α (10 ng/mL), and calcitriol (10 nM), and without treatment to check the effect on the migration of HepG-2 and THLE-2 cells in the presence and absence of IL-6, TNF- α, and calcitriol. Cells were grown till 80% confluence and the well was divided into 8 parts by scratching a vertical line in the middle and three equidistance horizontal lines. Each chamber was scanned at the 6 intersection fields along with the marked lines at 0, 6, 24, 48, and 72 h. Each experiment was done in three biological replicates (n = 3).
Proliferation assays to determine the effect of IL-6, TNF-α, and calcitriol on the proliferation of HepG-2 were done using cell counting kit-8 (CCK-8, DJ689 Dojindo). About 1500 HepG-2 cells were seeded in the wells of 96 well plates in 100 μL of serum-free media. Cells were incubated for 12, 24, 48, 72, and 96 h with and without treatments. Then, 10 μL of CCK-8 was added and incubated for 4 h in dark (5%CO2, 37 °C) and then OD values were calculated using the EnSpire 2300 Multilabel Reader (Perkin Elmer) at 450 nm. The experiment was repeated three times (n = 3).
Statistical analysis: All data are presented as mean ± SD from three independent experiments. Data were analyzed by Graph Pad Prism using One-Way ANOVA with Tukey’s multiple comparisons and a Student’s t-test between two groups. The Tukey test was used while comparing multiple means and Bonferroni’s post-hoc test was used for small comparisons. A p-value of < 0.05 was considered significant (* p < 0.05, ** p < 0.01, *** p < 0.001 and **** p < 0.0001).
5. Conclusions
Suppression of TREM-1, IL-6, and TNF-α expression and attenuation of the effect of IL-6, TNF-α, and LPS on TREM-1 suggests the therapeutic effect of calcitriol and the results suggest that supplementation of vitamin D will be beneficial in HCC to attenuate inflammation and delay the disease progression. The increased TREM-1 expression in HCC cells suggests the estimation of the TREM-1 level as a biomarker of inflammation and disease progression, which might be used to intervene at an earlier time point. A high TREM-1 level is associated with poor overall survival and decreased rate of relapse-free survival, and thus may serve as a prognostic factor for postoperative HCC recurrence. Further, the results of this study suggest PU.1 as an additional therapeutic target in HCC. Taken together, the results of this study suggest that vitamin D can be used as an adjunct with the conventional treatment for various stages of liver diseases and that TREM-1 levels might serve as a biomarker and prognostic factor in HCC.
Supplementary Materials
The following are available online at https://0-www-mdpi-com.brum.beds.ac.uk/article/10.3390/reports4020017/s1.
Author Contributions
V.R. conducted the experiments, analyzed and interpreted the results; D.K.A. supplied the cells and reagents; V.R. and D.K.A. wrote, edited, and finalized the manuscript. All authors have read and agreed to the published version of the manuscript.
Funding
This work was supported by research grant RO1 HL073349 to DK Agrawal from the National Heart, Lung and Blood Institute, National Institutes of Health, USA. The content of this article is solely the responsibility of the authors and does not necessarily represent the official views of the National Institutes of Health.
Institutional Review Board Statement
Not applicable. This study was conducted on cell lines commercially available from ATCC (Virginia, USA).
Informed Consent Statement
Not Applicable.
Data Availability Statement
All data has been provided with the manuscript.
Acknowledgments
As the corresponding author, I declare that this manuscript is original; that the article does not infringe upon any copyright or other proprietary rights of any third party; that neither the text nor the data have been reported or published previously. All the authors have no conflict of interest and have read the journal’s authorship statement. We thank William J. Hunter 3rd, a board-certified pathologist, for reviewing the stained slides and their results for this study. The data included in this study is a part of the thesis of the Master of Science degree defended by Vikrant Rai at the Department of Clinical and Translational Research, Creighton University School of Medicine, Omaha, NE, USA.
Conflicts of Interest
The authors declare no conflict of interest.
References
- Greten, T.F.; Duffy, A.G.; Korangy, F. Hepatocellular carcinoma from an immunologic perspective. Clin. Cancer Res. 2013, 19, 6678–6685. [Google Scholar] [CrossRef] [Green Version]
- Liu, Y.; Fuchs, J.; Li, C.; Lin, J. IL-6, a risk factor for hepatocellular carcinoma: FLLL32 inhibits IL-6-Induced STAT3 phosphorylation in human hepatocellular cancer cells. Cell Cycle 2010, 9, 3423–3427. [Google Scholar] [CrossRef] [PubMed]
- Parkin, D.M.; Bray, F.; Ferlay, J.; Pisani, P. Global Cancer Statistics, 2002. CA Cancer J. Clin. 2005, 55, 74–108. [Google Scholar] [CrossRef] [PubMed]
- Bartosch, B. Hepatitis B and C viruses and hepatocellular carcinoma. Viruses 2010, 2, 1504–1509. [Google Scholar] [CrossRef]
- Johnson, C.; Han, Y.; Hughart, N.; McCarra, J.; Alpini, G.; Meng, F. Interleukin-6 and its receptor, key players in hepatobiliary inflammation and cancer. Transl. Gastrointest. Cancer 2012, 1, 58–70. [Google Scholar]
- Baffy, G.; Brunt, E.M.; Caldwell, S.H. Hepatocellular carcinoma in non-alcoholic fatty liver disease: An emerging menace. J. Hepatol. 2012, 56, 1384–1391. [Google Scholar] [CrossRef] [Green Version]
- Jang, J.W.; Oh, B.S.; Kwon, J.H.; You, C.R.; Chung, K.W.; Kay, C.S.; Jung, H.S. Serum interleukin-6 and C-reactive protein as a prognostic indicator in hepatocellular carcinoma. Cytokine 2012, 60, 686–693. [Google Scholar] [CrossRef]
- Yamada, S.; Maruyama, I. HMGB1, a novel inflammatory cytokine. Clin. Chim. Acta 2007, 375, 36–42. [Google Scholar] [CrossRef] [PubMed]
- Wu, J.; Li, J.; Salcedo, R.; Mivechi, N.F.; Trinchieri, G.; Horuzsko, A. The Proinflammatory Myeloid Cell Receptor TREM-1 Controls Kupffer Cell Activation and Development of Hepatocellular Carcinoma. Cancer Res. 2012, 72, 3977–3986. [Google Scholar] [CrossRef] [PubMed] [Green Version]
- Teixeira, A.; Mendes-Junior, C.; Marano, L.; Deghaide, N.; Secaf, M.; Elias-Junior, J.; Muglia, V.; Donadi, E.; Martinelli, A. Alleles and genotypes of polymorphisms of IL-18, TNF-α and IFN-γ are associated with a higher risk and severity of hepatocellular carcinoma (HCC) in Brazil. Hum. Immunol. 2013, 74, 1024–1102. [Google Scholar] [CrossRef]
- Miller, B.A.; Chu, K.C.; Hankey, B.F.; Ries, L.A.G. Cancer incidence and mortality patterns among specific Asian and Pacific Islander populations in the U.S. Cancer Causes Control. 2007, 19, 227–256. [Google Scholar] [CrossRef] [PubMed] [Green Version]
- El-Serag, H.B. Hepatocellular carcinoma. N. Engl. J. Med. 2011, 365, 1118–1127. [Google Scholar] [CrossRef]
- Altekruse, S.F.; McGlynn, K.A.; Reichman, M.E. Hepatocellular Carcinoma Incidence, Mortality, and Survival Trends in the United States From 1975 to 2005. J. Clin. Oncol. 2009, 27, 1485–1491. [Google Scholar] [CrossRef] [Green Version]
- Chiang, K.-C.; Persons, K.S.; Istfan, N.W.; Holick, M.F.; Chen, T.C. Fish oil enhances the antiproliferative effect of 1alpha,25-dihydroxyvitamin D3 on liver cancer cells. Anticancer. Res. 2009, 29, 3591–3596. [Google Scholar]
- Del Pozo, A.C.; Lopez, P. Management of Hepatocellular Carcinoma. Clin. Liver Dis. 2007, 11, 305–321. [Google Scholar] [CrossRef]
- Bouchon, A.; Dietrich, J.; Colonna, M. Cutting Edge: Inflammatory responses can be triggered by TREM-1, a novel receptor expressed on neutrophils and monocytes. J. Immunol. 2000, 164, 4991–4995. [Google Scholar] [CrossRef]
- Sharif, O.; Knapp, S. From expression to signaling: Roles of TREM-1 and TREM-2 in innate immunity and bacterial infection. Immunobiology 2008, 213, 701–713. [Google Scholar] [CrossRef] [PubMed]
- Sun, H.; Feng, J.; Tang, L. Function of TREM1 and TREM2 in Liver-Related Diseases. Cells 2020, 9, 2626. [Google Scholar] [CrossRef] [PubMed]
- Ramanathan, B.; Minton, J.; Ross, C.R.; Blecha, F. Characterization of bovine cDNA encoding triggering receptor expressed on myeloid cells 1 (TREM-1). Veter. Immunol. Immunopathol. 2004, 102, 85–89. [Google Scholar] [CrossRef] [PubMed]
- Duan, M.; Wang, Z.-C.; Wang, X.-Y.; Shi, J.-Y.; Yang, L.-X.; Ding, Z.-B.; Gao, Q.; Zhou, J.; Fan, J. TREM-1, an Inflammatory Modulator, is Expressed in Hepatocellular Carcinoma Cells and Significantly Promotes Tumor Progression. Ann. Surg. Oncol. 2014, 22, 3121–3129. [Google Scholar] [CrossRef]
- Liao, R.; Sun, T.-W.; Yi, Y.; Wu, H.; Li, Y.-W.; Wang, J.-X.; Zhou, J.; Shi, Y.-H.; Cheng, Y.-F.; Qiu, S.-J.; et al. Expression of TREM-1 in hepatic stellate cells and prognostic value in hepatitis B-related hepatocellular carcinoma. Cancer Sci. 2012, 103, 984–992. [Google Scholar] [CrossRef]
- Schenk, M.; Bouchon, A.; Seibold, F.; Mueller, C. TREM-1–expressing intestinal macrophages crucially amplify chronic inflammation in experimental colitis and inflammatory bowel diseases. J. Clin. Investig. 2007, 117, 3097–3106. [Google Scholar] [CrossRef] [Green Version]
- Turnbull, I.R.; Gilfillan, S.; Cella, M.; Aoshi, T.; Miller, M.; Piccio, L.; Hernandez, M.; Colonna, M. Cutting Edge: TREM-2 Attenuates Macrophage Activation. J. Immunol. 2006, 177, 3520–3524. [Google Scholar] [CrossRef]
- Gao, X.; Dong, Y.; Liu, Z.; Niu, B. Silencing of triggering receptor expressed on myeloid cells-2 enhances the inflammatory responses of alveolar macrophages to lipopolysaccharide. Mol. Med. Rep. 2013, 7, 921–926. [Google Scholar] [CrossRef] [Green Version]
- Tang, W.; Lv, B.; Yang, B.; Chen, Y.; Yuan, F.; Ma, L.; Chen, S.; Zhang, S.; Xia, J. TREM2 acts as a tumor suppressor in hepatocellular carcinoma by targeting the PI3K/Akt/β-catenin pathway. Oncogenesis 2019, 8, 1–14. [Google Scholar] [CrossRef] [PubMed] [Green Version]
- Cubero, F.J. Keeping the liver fit with TREM2 during hepatic carcinogenesis. Gut 2020. [Google Scholar] [CrossRef] [PubMed]
- Esparza-Baquer, A.; Labiano, I.; Sharif, O.; Agirre-Lizaso, A.; Oakley, F.; Rodrigues, P.M.; Zhuravleva, E.; O’Rourke, C.J.; Hijona, E.; Jimenez-Agüero, R.; et al. TREM-2 defends the liver against hepatocellular carcinoma through multifactorial protective mechanisms. Gut 2020. [Google Scholar] [CrossRef]
- Chen, Q.; Zhang, K.; Jin, Y.; Zhu, T.; Cheng, B.; Shu, Q.; Fang, X. Triggering receptor expressed on Myeloid Cells-2 protects against polymicrobial sepsis by enhancing bacterial clearance. Am. J. Respir. Crit. Care Med. 2013, 188, 201–212. [Google Scholar] [CrossRef] [PubMed]
- Barrow, A.D.; Astoul, E.; Floto, A.; Brooke, G.; Relou, I.A.M.; Jennings, N.S.; Smith, K.; Ouwehand, W.; Farndale, R.W.; Alexander, D.R.; et al. Cutting Edge: TREM-Like Transcript-1, a platelet immunoreceptor tyrosine-based inhibition motif encoding costimulatory immunoreceptor that enhances, rather than inhibits, calcium signaling via SHP-2. J. Immunol. 2004, 172, 5838–5842. [Google Scholar] [CrossRef]
- Sun, M.; Zhu, M.; Chen, K.; Nie, X.; Deng, Q.; Hazlett, L.D.; Wu, Y.; Li, M.; Wu, M.; Huang, X. TREM-2 Promotes Host Resistance AgainstPseudomonas aeruginosaInfection by Suppressing Corneal Inflammation via a PI3K/Akt Signaling Pathway. Investig. Opthalmology Vis. Sci. 2013, 54, 3451–3462. [Google Scholar] [CrossRef] [PubMed] [Green Version]
- Wu, D.-B.; Wang, M.-L.; Chen, E.-Q.; Tang, H. New insights into the role of vitamin D in hepatocellular carcinoma. Expert Rev. Gastroenterol. Hepatol. 2017, 12, 287–294. [Google Scholar] [CrossRef] [PubMed]
- ZZadshir, A.; Tareen, N.; Pan, D.; Norris, K.C.; Martins, D. The prevalence of hypovitaminosis D among US adults: Data from the NHANES III. Ethn. Dis. 2005, 15, S5. [Google Scholar]
- Bouchon, A.; Facchetti, F.; Weigand, M.A.; Colonna, M. TREM-1 amplifies inflammation and is a crucial mediator of septic shock. Nat. Cell Biol. 2001, 410, 1103–1107. [Google Scholar] [CrossRef]
- Gupta, G.K.; Agrawal, T.; Del Core, M.G.; Hunter, W.J.; Agrawal, D.K. Decreased expression of vitamin d receptors in neointimal lesions following coronary artery angioplasty in atherosclerotic swine. PLoS ONE 2012, 7, e42789. [Google Scholar] [CrossRef] [PubMed]
- Ho, C.-C.; Liao, W.-Y.; Wang, C.-Y.; Lu, Y.-H.; Huang, H.-Y.; Chen, H.-Y.; Chan, W.-K.; Chen, H.-W.; Yang, P.-C. TREM-1 Expression in tumor-associated macrophages and clinical outcome in lung cancer. Am. J. Respir. Crit. Care Med. 2008, 177, 763–770. [Google Scholar] [CrossRef] [PubMed]
- Jones, S.A.; Scheller, J.; Rose-John, S. Therapeutic strategies for the clinical blockade of IL-6/gp130 signaling. J. Clin. Investig. 2011, 121, 3375–3383. [Google Scholar] [CrossRef] [Green Version]
- Porta, C.; DE Amici, M.; Quaglini, S.; Paglino, C.; Tagliani, F.; Boncimino, A.; Moratti, R.; Corazza, G.R. Circulating interleukin-6 as a tumor marker for hepatocellular carcinoma. Ann. Oncol. 2008, 19, 353–358. [Google Scholar] [CrossRef] [PubMed]
- Rose-John, S. IL-6 Trans-Signaling via the Soluble IL-6 Receptor: Importance for the Pro-Inflammatory Activities of IL-6. Int. J. Biol. Sci. 2012, 8, 1237–1247. [Google Scholar] [CrossRef]
- Hsia, C.-Y.; Huo, T.-I.; Chiang, S.-Y.; Lu, M.-F.; Sun, C.-L.; Wu, J.-C.; Lee, P.-C.; Chi, C.-W.; Lui, W.-Y.; Lee, S.-D. Evaluation of interleukin-6, interleukin-10 and human hepatocyte growth factor as tumor markers for hepatocellular carcinoma. Eur. J. Surg. Oncol. 2007, 33, 208–212. [Google Scholar] [CrossRef]
- Cheng, K.; Zhao, Y.-J.; Liu, L.; Wan, J.-J. Tumor Necrosis Factor-α 238 G/A Polymorphism and Risk of Hepatocellular Carcinoma: Evidence from a Meta-analysis. Asian Pac. J. Cancer Prev. 2013, 14, 3275–3279. [Google Scholar] [CrossRef]
- Akkız, H.; Bayram, S.; Bekar, A.; Ozdil, B.; Akgöllü, E.; Sümbül, A.T.; Demiryurek, H.; Doran, F. G-308A TNF-α polymorphism is associated with an increased risk of hepatocellular carcinoma in the Turkish population: Case-control study. Cancer Epidemiol. 2009, 33, 261–264. [Google Scholar] [CrossRef]
- Abraham, L.J.; Kroeger, K.M. Impact of the -308 TNF promoter polymorphism on the transcriptional regulation of the TNF gene: Relevance to disease. J. Leukoc. Biol. 1999, 66, 562–566. [Google Scholar] [CrossRef] [PubMed]
- Yang, Y.; Luo, C.; Feng, R.; Bi, S. The TNF-α, IL-1B and IL-10 polymorphisms and risk for hepatocellular carcinoma: A meta-analysis. J. Cancer Res. Clin. Oncol. 2010, 137, 947–952. [Google Scholar] [CrossRef] [PubMed]
- Talaat, R.M.; Esmail, A.A.; Elwakil, R.; Gurgis, A.A.; Nasr, M.I. Tumor necrosis factor-alpha -308G/A polymorphism and risk of hepatocellular carcinoma in hepatitis C virus-infected patients. Chin. J. Cancer 2013, 31, 29–35. [Google Scholar] [CrossRef] [Green Version]
- Trépo, E.; Ouziel, R.; Pradat, P.; Momozawa, Y.; Quertinmont, E.; Gervy, C.; Gustot, T.; Degré, D.; Vercruysse, V.; Deltenre, P.; et al. Marked 25-hydroxyvitamin D deficiency is associated with poor prognosis in patients with alcoholic liver disease. J. Hepatol. 2013, 59, 344–350. [Google Scholar] [CrossRef] [PubMed]
- Sabry, D.; Al-Ghussein, M.; Elkazaz, A.; Eldemery, A.; Shaker, M.; Hamdy, G.; Abul-Fotouh, A.; Motawi, T. Effect of vitamin D therapy on interleukin-6, visfatin, and hyaluronic acid levels in chronic hepatitis C Egyptian patients. Ther. Clin. Risk Manag. 2015, 11, 279–288. [Google Scholar] [CrossRef] [PubMed] [Green Version]
- Zhang, Y.; Leung, D.Y.M.; Richers, B.N.; Liu, Y.; Remigio, L.K.; Riches, D.W.; Goleva, E. Vitamin D Inhibits Monocyte/Macrophage Proinflammatory Cytokine Production by Targeting MAPK Phosphatase-1. J. Immunol. 2012, 188, 2127–2135. [Google Scholar] [CrossRef] [Green Version]
- Petta, S.; Cammà, C.; Scazzone, C.; Tripodo, C.; Di Marco, V.; Bono, A.; Cabibi, D.; Licata, G.; Porcasi, R.; Marchesini, G.; et al. Low vitamin D serum level is related to severe fibrosis and low responsiveness to interferon-based therapy in genotype 1 chronic hepatitis C. Hepatology 2009, 51, 1158–1167. [Google Scholar] [CrossRef]
- Luo, W.-J.; Chen, J.-Y.; Xu, W.; Zhao, F.; Chen, Y.-M.; Shen, X.-F. Effects of vitamin D analogue EB1089 on proliferation and apoptosis of hepatic carcinoma cells. (Zhonghua yu fang yi xue za zhi). Chin. J. Prev. Med. 2004, 38, 415–418. [Google Scholar]
- Horvath, E.; Lakatos, P.; Balla, B.; Kósa, J.P.; Tóbiás, B.; Jozilan, H.; Borka, K.; Horváth, H.C.; Kovalszky, I.; Szalay, F. Marked increase of CYP24A1 mRNA level in hepatocellular carcinoma cell lines following vitamin D administration. Anticancer Res. 2012, 32, 4791–4796. [Google Scholar]
- Barchetta, I.; Carotti, S.; Labbadia, G.; Gentilucci, U.V.; Muda, A.O.; Angelico, F.; Silecchia, G.; Leonetti, F.; Fraioli, A.; Picardi, A.; et al. Liver vitamin D receptor, CYP2R1, and CYP27A1 expression: Relationship with liver histology and vitamin D3 levels in patients with nonalcoholic steatohepatitis or hepatitis C virus. Hepatology 2012, 56, 2180–2187. [Google Scholar] [CrossRef] [PubMed]
- Ding, J.; Huang, S.; Wang, Y.; Tian, Q.; Zha, R.; Shi, H.; Wang, Q.; Ge, C.; Chen, T.; Zhao, Y.; et al. Genome-wide screening reveals that miR-195 targets the TNF-α/NF-κB pathway by down-regulating IκB kinase alpha and TAB3 in hepatocellular carcinoma. Hepatology 2013, 58, 654–666. [Google Scholar] [CrossRef]
- Ben-Neriah, Y.; Karin, M. Inflammation meets cancer, with NF-κB as the matchmaker. Nat. Immunol. 2011, 12, 715–723. [Google Scholar] [CrossRef] [PubMed]
- Zeng, H.; Ornatowska, M.; Joo, M.S.; Sadikot, R.T. TREM-1 expression in macrophages is regulated at transcriptional level by NF-κB and PU.1. Eur. J. Immunol. 2007, 37, 2300–2308. [Google Scholar] [CrossRef] [PubMed]
- Kim, J.; Feldman, R.A. Activated Fes Protein Tyrosine Kinase Induces Terminal Macrophage Differentiation of Myeloid Progenitors (U937 Cells) and Activation of the Transcription Factor PU.1. Mol. Cell. Biol. 2002, 22, 1903–1918. [Google Scholar] [CrossRef] [PubMed] [Green Version]
- Joo, M.; Park, G.Y.; Wright, J.G.; Blackwell, T.S.; Atchison, M.L.; Christman, J.W. Transcriptional regulation of the cyclooxygenase-2 gene in macrophages by PU.1. J. Biol. Chem. 2004, 279, 6658–6665. [Google Scholar] [CrossRef] [PubMed] [Green Version]
- Taniguchi, K.; Karin, M. IL-6 and related cytokines as the critical lynchpins between inflammation and cancer. Semin. Immunol. 2014, 26, 54–74. [Google Scholar] [CrossRef]
- Rostkowska-Nadolska, B.; Sliupkas-Dyrda, E.; Potyka, J.; Kusmierz, D.; Fraczek, M.; Kręcicki, T.; Kubik, P.; Zatonski, M.; Latocha, M. Vitamin D derivatives: Calcitriol and tacalcitol inhibits interleukin-6 and interleukin-8 expression in human nasal polyp fibroblast cultures. Adv. Med. Sci. 2010, 55, 86–92. [Google Scholar] [CrossRef]
- Jiang, X.-P.; Yang, D.C.; Elliott, R.L.; Head, J.F. Down-regulation of expression of interleukin-6 and its receptor results in growth inhibition of MCF-7 breast cancer cells. Anticancer Res. 2011, 31, 2899–2906. [Google Scholar]
- Nonn, L.; Peng, L.; Feldman, D.; Peehl, D.M. Inhibition of p38 by Vitamin D reduces interleukin-6 production in normal prostate cells via mitogen-activated protein kinase phosphatase 5: Implications for prostate cancer prevention by Vitamin D. Cancer Res. 2006, 66, 4516–4524. [Google Scholar] [CrossRef] [Green Version]
- Akhter, J.; Lu, Y.; Finlay, I.; Pourgholami, M.H.; Morris, D.L. 1α,25-Dihydroxyvitamin D3 and its analogues, EB1089 and CB1093, profoundly inhibit the in vitro proliferation of the human hepatoblastoma cell line HepG2. ANZ J. Surg. 2001, 71, 414–417. [Google Scholar] [CrossRef] [PubMed]
Figure 1.
RT-PCR and immunofluorescence for TREM-1, IL-6, and TNFα and effect of calcitriol in Hep G2 cells. (a) RT-PCR analysis for expression of TREM-1 and TREM-2 Hep G-2 cells and the effect of calcitriol on the expression of TREM-1 and TREM-2 and the effect of IL-6 and TNFα on TREM-1 and TREM-2 expression; (b) mean fluorescence intensity (MFI) of TREM-1 and TREM-2 in Hep G2 and THLE2 cells; (c) immunofluorescence for TREM-1 (panels A and D) and TREM-2 (panels G and J) in Hep G2 and TLHE2 cells, (d) Western blot of TREM-1 and TREM-2 in HepG-2 cells without and with the treatment of IL-6, and TNF-α Interleukin (IL), tumor necrosis factor-alpha (TNFα), triggering receptor expressed on myeloid cells (TREM), normal liver epithelial cells (THLE-2), liver cancer cells (Hep G2). All data have been expressed as mean ± SD (n = 3). * p < 0.05 (* p < 0.05, ** p < 0.01, *** p < 0.001 and **** p < 0.0001).

Figure 2.
Immunofluorescence for HMGB-1, DAP-12, and colocalization of TREM-1 and TREM-2 with DAP-12. HMGB-1 panels (A1,D1), DAP-12 panels (G1,J1,B2,F2), DAPI panels (B1,E1,H1,K1,C2,G2), merged images panels (C1,F1,I1,L1), TREM-1 panel (A2), TREM-2 panel (E2), colocalization of DAP-12 with TREM-1 panel (D2) and TREM-2 panel (H2). High mobility group box protein-1 (HMGB-1), triggering receptor expressed on myeloid cells (TREM), 12 kDa transmembrane protein (DAP-12).

Figure 3.
Immunofluorescence for TREM-1 and the effect of calcitriol, IL-6, and TNF-α on TREM-1. TREM-1 panels (A,D,G,J,M,P), DAPI panels (B,E,H,K,N,Q), and merged images panels (C,F,I,L,O,R). Interleukin (IL), tumor necrosis factor-alpha (TNFα), triggering receptor expressed on myeloid cells (TREM), vitamin D/calcitriol (vit. D).

Figure 4.
RT-PCR and immunofluorescence for the effect of rHMGB-1 on TREM-1, IL-6, and TNFα. RT-PCR for the effect of recombinant high mobility group box protein (rHMGB1) on triggering receptor expressed on myeloid cells-1 (TREM-1; panel (a)), interleukin-6 (IL-6; panel (b)), and tumor necrosis factor-alpha (TNFα; panel (c)) in Hep G2 and THLE2 cells. Immunofluorescence for TREM-1 panels (A,D), IL-6 panel (G,J), and TNF-α panels (M,P), DAPI panels (B,E,H,K,N,Q), and merged images panels (C,F,I,L,O,R) in Hep G2 cells. All data have been expressed as mean ± SD (n = 3). * p < 0.05 (* < 0.05, ** < 0.01, and **** < 0.0001).

Figure 5.
RT-PCR for the effect of calcitriol, IL-6, and TNF-α on NF-κB and PU.1, the effect of PU.1 on TREM-1 expression, and immunofluorescence for colocalization of TREM-1 and TREM-2 with PU.1. RT-PCR for nuclear factor kappa beta NF-κB; (panel 1), IκB Kinase (panel 2), PU.1 (panel 3), and effect of PU.1 siRNA and plasmid on triggering receptor expressed on myeloid cells- 1 TREM-1; (panel 4). Immunofluorescence (panel 5) for colocalization of PU.1 with TREM-1 (panel A, B, D, E, F, and H) and TREM-2 (panels I, J, L, M, N, and P) in THLE2 and Hep G2 cells. All data have been expressed as mean ± SD (n = 3). * p < 0.05 (* < 0.05, ** < 0.01, *** < 0.001 and **** < 0.0001). All images were scanned with a scale bar of 200 µm.

Figure 6.
RT-PCR, immunofluorescence, and western blot for the effect of LPS and calcitriol on TREM-1 and TREM-2. RT-PCR for triggering receptor expressed on myeloid cells (TREM)-1 and -2 (panel 1); western blot (panel 2) mean fluorescence intensity for TREM-1 (panel 3); immunofluorescence for TREM-1 (panels 4A,D,G), TREM-2 (panels 4J,M,P), DAPI (panels 4B,E,H,K,N,Q), and merged images (panels 4C,F,I,L,O,R). All data have been expressed as mean ± SD (n = 3). * p < 0.05 (* < 0.05, ** < 0.01, *** < 0.001 and **** < 0.0001). * compared to control Hep G2 cells, $ comparison between LPS vs. LPS + calcitriol ($$$ p < 0.001).

Figure 7.
Scratch test for the effect of calcitriol, interleukin (IL)-6, and tumor necrosis factor (TNF)-α on the migration of Hep G2 cells at 0 h panels (A,D,G,J,M,P), 24 h panels (B,E,H,K,N,Q), and 48 h panels (C,F,I,L,O,R). All images were scanned at 20×. * p < 0.05, ** p < 0.01, *** p < 0.001 and **** p < 0.0001. panels (a–f) represent the average percent wound area without cells, panel (g,h) represent the average percent wound area without cells at 24 and 48 h respectively. C-control, IL-interleukin, Vit.D- vitamin D, TNFα- tumor necrosis factor-alpha, hr—hour.

Figure 8.
Invasion and proliferation assay: Trans-well invasion assay panel (i) in THLE-2 and Hep G2 cells showing migrated cells in control (panels A and G) and cells treated with interleukin (IL)-6 (panel B and K), tumor necrosis factor (TNF)-α (panel C and I), calcitriol (panels D and J), IL-6 + calcitriol (panels E and K), TNF-α + calcitriol (panels F and L). CCK-8 proliferation assay of Hep G2 cells panel (ii) (a) and RT-PCR for Ki67 panel (ii) (b). All data have been expressed as mean ± SD (n = 3). * p < 0.05 (* < 0.05, ** < 0.01, *** < 0.001 and **** < 0.0001). All images were scanned at 200 µm.

Figure 9.
TREM-1 expression in SNU387 and effect of LPS and calcitriol on TREM-1, NF-κB, and IKK mRNA expression and proliferation. (Panel 1) Immunofluorescence for TREM-1 and IKK in SNU387 cells. TREM-1 and IKK expression (Red-Alexa Fluor 594) and DAPI (Blue). RT-PCR for TREM-1 (panel 2), and IKK (panel 3). MTT assay for the proliferation of SNU387 cells (panel 4). DAPI- 4′,6-diamidino-2-phenylindole, LPS- lipopolysaccharides, TREM1- triggering receptor expressed on myeloid cells 1, IKK- IκB kinase. * p < 0.05 (* < 0.05, ** < 0.01, and *** < 0.001).


Table 1.
Nucleotide sequence for the primers used in RT-PCR. TREM: triggering receptor expressed on myeloid cells, IL: interleukin, TNF- α: tumor necrosis factor-alpha, NF-κB: nuclear factor kappa beta, GAPDH: Glyceraldehyde 3-phosphate dehydrogenase.
Table 1.
Nucleotide sequence for the primers used in RT-PCR. TREM: triggering receptor expressed on myeloid cells, IL: interleukin, TNF- α: tumor necrosis factor-alpha, NF-κB: nuclear factor kappa beta, GAPDH: Glyceraldehyde 3-phosphate dehydrogenase.
| Gene | Forward Primer | Reverse Primer |
|---|---|---|
| TREM-1 | 5′-AGT TAC AGC CCA AAA CAT GC-3′ | 5′-CAG CCC CCA CAA GAG AAT TA-3′ |
| TREM-2 | 5′-ACA GAA GCC AGG GAC ACA TC-3′ | 5′-CCT CCC ATC ATC TTC CTT CA-3′ |
| IL-6 | 5′-AAA TTC GGT ACA TCC TCG ACG GCA-3′ | 5′-CAG TGC CTC TTT GCT GCT TTC ACA-3′ |
| TNF-α | 5′ACC CTC AAC CTC TTC TGG CTC AAA-3′ | 5′-AAT CCC AGG TTT CGA AGT GGT GGT-3′ |
| NF-κB | 5′-GAC TAC GAC CTG AAT GCT GTG-3′ | 5′-GTC AAA GAT GGG ATG AGG AAG G-3′ |
| IKK | 5′-ATG AAT GCC TCT CGA CTT AGC-3′ | 5′-CCA CCA GTT CTT CAC TCT TCT T-3′ |
| PU.1 | 5′-AAG GGC AAC CGC AAG AA-3′ | 5′-GGT AGG TGA GCT TCT TCT TCA C-3′ |
| Ki-67 | 5′-CTT TGG GTG CGA CTT GAC G-3′ | 5′-GTC GAC CCC GCT CCT TTT-3′ |
| GAPDH | 5′-GGT GAA GGT CGG AGT CAA CGG ATT TGG TCG-3′ | 5′-GGA TCT CGC TCC TGG AAG ATG GTG ATG GG-3′ |
Publisher’s Note: MDPI stays neutral with regard to jurisdictional claims in published maps and institutional affiliations. |
© 2021 by the authors. Licensee MDPI, Basel, Switzerland. This article is an open access article distributed under the terms and conditions of the Creative Commons Attribution (CC BY) license (https://creativecommons.org/licenses/by/4.0/).
Share and Cite
MDPI and ACS Style
Rai, V.; Agrawal, D.K. Regulation of TREM1-Mediated Inflammation in Hepatocellular Carcinoma Cells. Reports 2021, 4, 17. https://0-doi-org.brum.beds.ac.uk/10.3390/reports4020017
AMA Style
Rai V, Agrawal DK. Regulation of TREM1-Mediated Inflammation in Hepatocellular Carcinoma Cells. Reports. 2021; 4(2):17. https://0-doi-org.brum.beds.ac.uk/10.3390/reports4020017
Chicago/Turabian StyleRai, Vikrant, and Devendra K. Agrawal. 2021. "Regulation of TREM1-Mediated Inflammation in Hepatocellular Carcinoma Cells" Reports 4, no. 2: 17. https://0-doi-org.brum.beds.ac.uk/10.3390/reports4020017