Article

Electrochemical Biosensor Based on Laser-Induced Graphene for COVID-19 Diagnosing: Rapid and Low-Cost Detection of SARS-CoV-2 Biomarker Antibodies

by
Marcely Echeverria Oliveira
1,
Bruno Vasconcellos Lopes
1,
Jéssica Helisa Hautrive Rossato
2,
Guilherme Kurz Maron
1,3,
Betty Braga Gallo
1,
Andrei Borges La Rosa
1,
Raphael Dorneles Caldeira Balboni
1,
Mariliana Luiza Ferreira Alves
3,
Marcos Roberto Alves Ferreira
3,
Luciano da Silva Pinto
3,
Fabricio Rochedo Conceição
3,
Evandro Piva
4,
Claudio Martin Pereira de Pereira
5,
Marcia Tsuyama Escote
2 and
Neftali Lenin Villarreal Carreño
1,*
1
Graduate Program in Materials Science and Engineering, Technology Development Center, Federal University of Pelotas (UFPel), Rua Gomes Carneiro 1, Pelotas 96010-00, RS, Brazil
2
Center for Engineering Modeling and Applied Social Science, Federal University of ABC (UFABC), Santo André 09210-580, SP, Brazil
3
Postgraduate Program in Biotechnology, Technology Development Center, Federal University of Pelotas, Av. Eliseu Maciel, Capão do Leão 96010-900, RS, Brazil
4
Department of Restorative Dentistry, School of Dentistry, Federal University of Pelotas, Rua Gonçalves Chaves 457, Pelotas 96015-560, RS, Brazil
5
Center of Chemical, Pharmaceutical and Food Sciences, Lipidomic and Bio-Organic Laboratory, Bioforensic Research Group, Federal University of Pelotas, Eliseu Maciel Av., s/n, Pelotas 96900-010, RS, Brazill
*
Author to whom correspondence should be addressed.
Submission received: 26 November 2021 / Revised: 14 January 2022 / Accepted: 9 February 2022 / Published: 1 March 2022
(This article belongs to the Special Issue Surfaces on Emerging Chemical Sensing Applications)

Abstract

:
The severe acute respiratory syndrome originated by the new coronavirus (SARS-CoV-2) that emerged in late 2019, known to be a highly transmissible and pathogenic disease, has caused the COVID-19 global pandemic outbreak. Thus, diagnostic devices that help epidemiological public safety measures to reduce undetected cases and isolation of infected patients, in addition to significantly help to control the population’s immune response to vaccine, are required. To address the negative issues of clinical research, we developed a Diagnostic on a Chip platform based on a disposable electrochemical biosensor containing laser-induced graphene and a protein (SARS-CoV-2 specific antigen) for the detection of SARS-CoV-2 antibodies. The biosensors were produced via direct laser writing using a CO2 infrared laser cutting machine on commercial polyimide sheets. The presence of specific antibodies reacting with the protein and the K3[Fe(CN)6] redox indicator produced characteristic and concentration-dependent electrochemical signals, with mean current values of 9.6757 and 8.1812 µA for reactive and non-reactive samples, respectively, proving the effectiveness of testing in clinical samples of serum from patients. Thus, the platform is being expanded to be measured in a portable microcontrolled potentiostat to be applied as a fast and reliable monitoring and mapping tool, aiming to assess the vaccinal immune response of the population.

Graphical Abstract

1. Introduction

Severe Acute Respiratory Syndrome originated by the new coronavirus (SARS-CoV-2), which emerged at the end of 2019, is widely known as a highly contagious and pathogenic disease, causing a global pandemic outbreak and threatening the public health in more than 200 countries [1,2,3]. To date, it has caused millions of deaths and cost the economy billions of dollars, although the estimated number of cases does not reflect its real magnitude [4,5]. COVID-19 is the third large-scale pandemic caused by coronaviruses in recent decades, after Severe Acute Respiratory Syndrome (SARS) in 2003 and Middle East Respiratory Syndrome (MERS) in 2012. In terms of magnitude, SARS-CoV-2 exhibits more alarming numbers. The two previous coronaviruses caused about 10,000 cumulative cases, (8098 for SARS-CoV and 2583 for MERS-CoV), with a mortality rate of 10% and 34.4%, respectively, much lower values when compared to the current 281,808,270 cases with a mortality rate of approximately 2% for SARS-CoV-2 [6,7,8,9].
In the current scenario, few drugs are available and the vaccination process is still ongoing in several countries. Thus, reliable diagnostic devices emerge as an important tool for mass diagnosis, aiding epidemiological public safety in reducing undetected cases, and performing a crucial role in suitable decision making for the isolation of infected patients. Furthermore, these devices could significantly assist the control of the population’s vaccinal immune response [10]. Currently, serological assays based on the Enzyme-Linked Immunosorbent Assay (ELISA) method [11] with optical detection (colorimetry/fluorescence) for the determination of immunoglobulins (IgG, IgM or IgA)—produced in response to SARS-CoV-2 during the initial period of illness (day 4 and beyond for IgM and day 7 and beyond for IgG) [12,13]—have been successfully used as a complement to the quantitative reverse transcription polymerase chain reaction (qRT-PCR) method for detection of viral RNA, considered the gold standard method for COVID-19 diagnosis—especially after the second week of infection [3,12]. However, such tests require trained personnel and a laboratory environment, whereas commercially available rapid tests have low sensitivity. Thus, the lack of test supplies, high cost and sampling errors have limited their practical application [14,15,16].
In an attempt to overcome these restrictions, several point-of-care (POC) devices have been developed, offering rapid and decentralized clinical diagnosis of SARS-CoV-2 through Diagnostic on Chip (DoC) platforms, such as electrochemical and optical detection devices [17]. These biosensors are able to combine, in a single step, sample preparation, reaction and detection on a miniaturized chip, requiring small sample volumes, with high sensitivity, low detection limit and fast analysis [13,18,19]. Furthermore, these devices allow the assay to be performed at the site (or close to the patient) and detect pathological agents employing a biomimetic or biologically derived recognition element during a (bio)chemical reaction. This tool can significantly assist in the assessment of the immune response to natural infection and population vaccination, which are all relevant data for public health policy planning [4]. In the case of electrochemical biosensors, the binding event is converted into a proportional measurable electrical signal generated during the reaction of the electrochemically active compounds, differently from optical devices, which depends on changes in the optical properties of the substances (absorption, refractive index, fluorescence, phosphorescence, reflectivity and wavelength). Thus, the electrochemical mechanism offers an excellent ability to discriminate small changes during the recognition event on the surface of the system, significantly reducing the cost (of the requirement of multiple antibodies present in other tests) and the time (of the labeling procedures), while in some cases, optical sensing devices require specific light coupled to the sensing platform, which limits its application as a POC device. Moreover, as the target analytes of biofluids are normally present in a matrix of substances, the overlapping of spectral lines limits the identification of substances, making necessary the use active of dyes as markers [3,14,18,19].
Regarding the commonly applied materials for electrical transduction elements of biosensors, some have outstanding application potential, e.g., nanostructured materials based on two-dimensional carbon (2D) [20]. Nanostructured materials based on 2D carbon presents high surface area, low density, good electrical conductivity and high electronic mobility. These characteristics allow a good conversion of the biological into a proportional electrical signal related to the concentration of the target analyte, resulting in an accurate detection of the material of interest [21]. Among the carbon-based materials, graphene (G) and its oxygenated derivatives, including graphene oxide (GO) and reduced graphene oxide (rGO), have become subject of study due to their exceptional inherent properties. The presence of oxygenated functional groups makes the GO strongly hydrophilic, facilitating chemical functionalization and aiding their interaction with recognition elements. Several modifications are reported, including the combination of these materials with organic polymers, biomolecules and various types of inorganic nanoparticles, ranting specificity and selectivity, aiding their interaction with the target analyte, resulting in an accurate detection. [21,22]. The production of graphene-based materials takes place through various techniques, such as chemical vapor deposition (CVD), mechanical exfoliation, and more recently, laser-induced graphene (LIG), a technique developed by Lin et al. (2014) [23]. In this process, polymeric polyimide (PI) sheets are irradiated with a CO2 laser, which causes a modification in the substrate surface, increasing the CC/CO ratio due to high temperatures (>2500 °C), breaking the C–O, C=O and N–C bonds. These atoms tend to rearrange with adjacent carbon atoms, resulting in the conversion of sp3 carbon atoms to sp2. Then, this process allows to produce graphene with remained oxygen components, which improve its hydrophilicity and provide active sites for the functionalization and tuning of electrochemical biosensors [24]. Moreover, this method has several advantages, since it is fast, low cost, simple and does not require additional processes, allowing it to be adapted for manufacturing on an industrial scale and permitting the creation of flexible electrodes with desirable designs [23,25].
In this context, this work describes the use of a DoC platform based on a disposable electrochemical biosensor that consists on a three-electrode system (reference, working and auxiliary electrodes) of laser-induced graphene. On the working electrode, a specific antigen for SARS-CoV-2 was deposited, which allowed the detection of anti-SARS-CoV-2 immunoglobulins (represented by IgG and IgM) through an electrochemical response generated by the reactions during the application of a differential pulse voltammetry (DPV) technique. In general, such results are faster than the tests currently approved by the Food and Drug Administration (FDA, USA) and the National Health Surveillance Agency (ANVISA, Brazil). Thus, assays were performed with clinical samples (blood serum from patients infected and not infected with SARS-CoV-2). In order to validate the potential of this approach, the results were compared both with the ELISA method developed by UFPel (under patent deposit registration number BR1020210020105) and the qRT-PCR method. Furthermore, our portable potentiostat device coupled to the three-electrode disposable electrochemical biosensor exhibited an excellent detection adaptability for COVID-19 POC tests, in a quick and easy-to-handle manner, offering an opportunity to expand access to rapid and effective diagnosis for the population.

2. Experimental Section

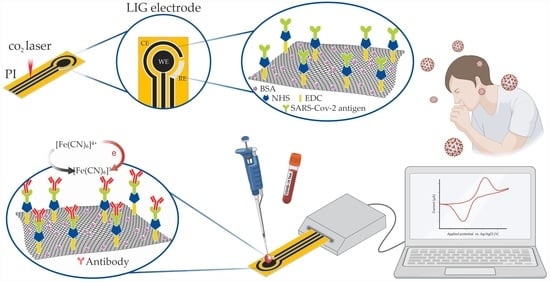
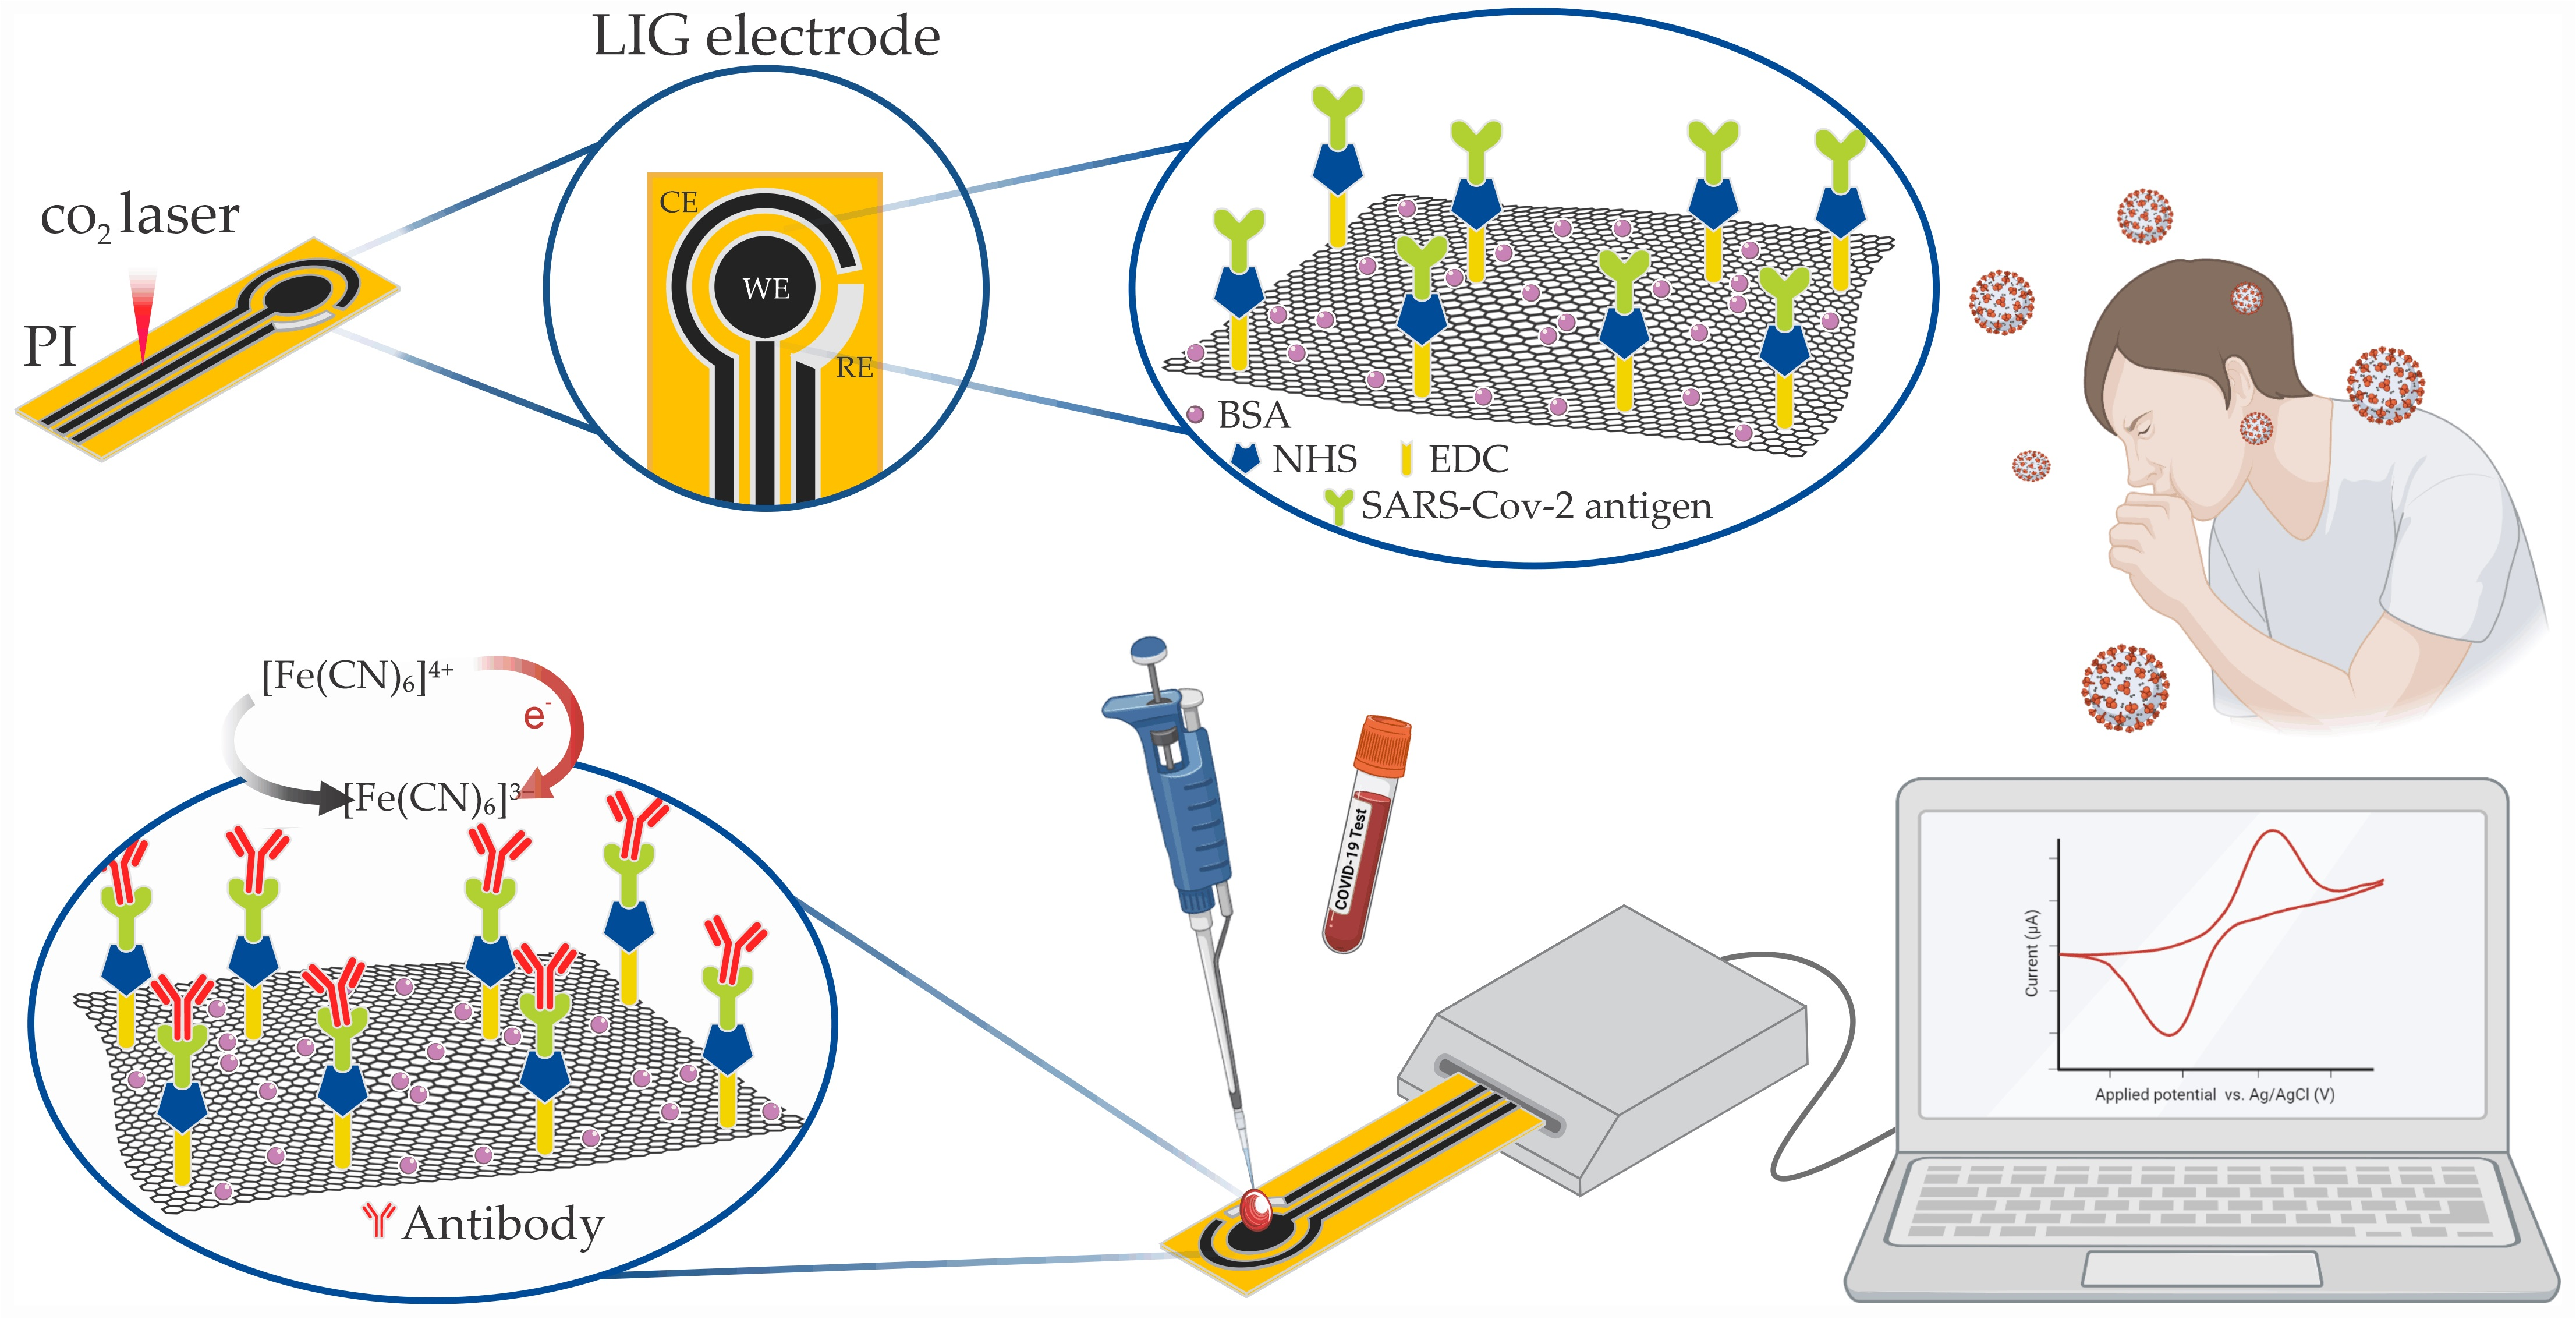
2.1. Biosensor Preparation

2.1.1. Electrode Fabrication

The LIG electrodes were produced by direct laser writing process using a CO2 laser engraving machine (Visutec Router Laser VS3020) on PI sheets (Kapton, Dupont) previously fixed on transparent polyester substrates. The biosensors were fabricated in a three-electrode configuration under ambient conditions, as illustrated in Figure 1. The working electrode was engraved with an active area of 7.07 mm2, while the counter and reference electrodes were obtained with active areas of 15.60 mm2 and the 6 mm2, respectively. The CO2 laser power, scanning and the distance between the laser beam and the PI substrates were fixed at 3.9 W, 100 mm·s−1 and 51 mm, respectively. Kapton polyimide tape was applied to isolate the electrodes from the electrolyte. After the DLW process, the reference electrode was covered with a thin layer of Ag/AgCl ink (ALS Co., Tokyo, Japan).

2.1.2. Biofunctionalization of the Working Electrode

The biofunctionalization of the working electrode was performed to obtain an immunoelectrode. In this procedure, first, 5.0 µL of a solution containing 0.5 mmol of N-Hydroxysuccinimide (NHS)(Sigma-Aldrich, St. Louis, EUA) and 0.25 mmol of 1ethyl-3-[3-dimethylaminopropyl] carbodiimide (EDC) (Sigma-Aldrich, St. Louis, EUA) dissolved in a 1× Phosphate-Buffered Saline solution (1× PBS, 0.1 mol·L−1 at pH 7.4) was dropped on the electrode surface and left resting for 5 h at a temperature of 4 °C. Afterwards, 5.0 μL of a solution containing the chimeric antigen (QCOV-8) containing part of S protein and part of N protein, specific for anti-SARS-CoV-2 (concentration varying from 20 to 400 μg·mL−1) dissolved in a 1× PBS solution was drop-casted on the electrode, followed by 12 h drying at a temperature of 4 °C. The QCOV-8 antigen was custom-designed and developed by the research group from the Biotechnology Department of the Federal University of Pelotas (UFPel), under patent registration number BR1020210020105, assigned and stored at 4 °C in a 1× PBS solution, 0.1 mol·L−1 in pH 7.4. Finally, the electrode was washed with the buffer solution to remove unreacted bioactive species and 5.0 μL of bovine serum albumin (BSA) (Sigma-Aldrich, St. Louis, EUA) with a concentration of 100 μg·mL−1 in 1× PBS solution was dropped on the surface of the immunoelectrode to block available functional groups. After 4 h at a temperature of 4 °C, the immunoelectrode was washed with the buffer solution. An illustration of the biosensor fabrication is presented in Figure 1.

2.2. Detection of SARS-CoV-2 Antibodies in Human Serums

Fifteen clinical samples of blood serum (seven reactive and eight non-reactive) were obtained from the Biotechnology Department of the Federal University of Pelotas (UFPel) and approved by the National Research Ethics Commission (CONEP) IRB n° 242/63 with opinion number 4.043.628. All serum samples were clinically confirmed with the QCOV-8 protein by an ELISA test kit, with 98% specificity, to access the IgA, IgM and IgG antibodies and by RT-PCR tests.

2.3. Characterization

2.3.1. Morphological and Structural Characterizations

The morphological characteristics of LIG was examined by a field emission scanning electron microscopy (FESEM JMS-6701F, JEOL). Raman Spectroscopy was performed using a T64000 Horiba Jobin-Yvon triple Raman spectrometer. The excitation laser used was the Verdi G5 Laser (Coherent Inc., Santa Clara, California, USA) operating at 532 nm (green) with a power of 2 mW on a 50× objective.

2.3.2. Electrochemical Characterizations

To evaluate the functionalization process of the immunoelectrode, the biosensor was electrochemically characterized to quantify the electric current flow in the presence of a redox pair of potassium ferricyanide (K3[Fe (CN)6]) (Sigma-Aldrich, St. Louis, EUA) at a concentration of 5 mmol·L−1. The intrinsic electrochemical behavior of the immunoelectrode was evaluated by DPV in potential range between −0.2 and 0.3 V, at a scan rate of 6 mV·s−1 and a pulse of 0.19 V.
The immunoelectrodes were also electrochemically characterized to measure the electrical current flow of the biosensor in (K3[Fe (CN)6]) dissolved in PBS 1 0.1 mol·L−1 (pH 7.4) in the presence and absence of specific antibodies for SARS-CoV-2. For this, 100 μL of a solution containing 90% of 5.0 mmol·L−1 K3[Fe (CN)6] probe solution and 10% of human blood serum was used. The intrinsic electrochemical behavior of the electrode was evaluated by DPV in the potential range from −0.2 to 0.3 V, at scan rate of 6 mV·s−1 and a pulse of 0.19 V. All electrochemical experiments were performed in a Metrohm AUTOLAB—PGSTAT 302N potentiostat/galvanostat, at room temperature (25 °C).

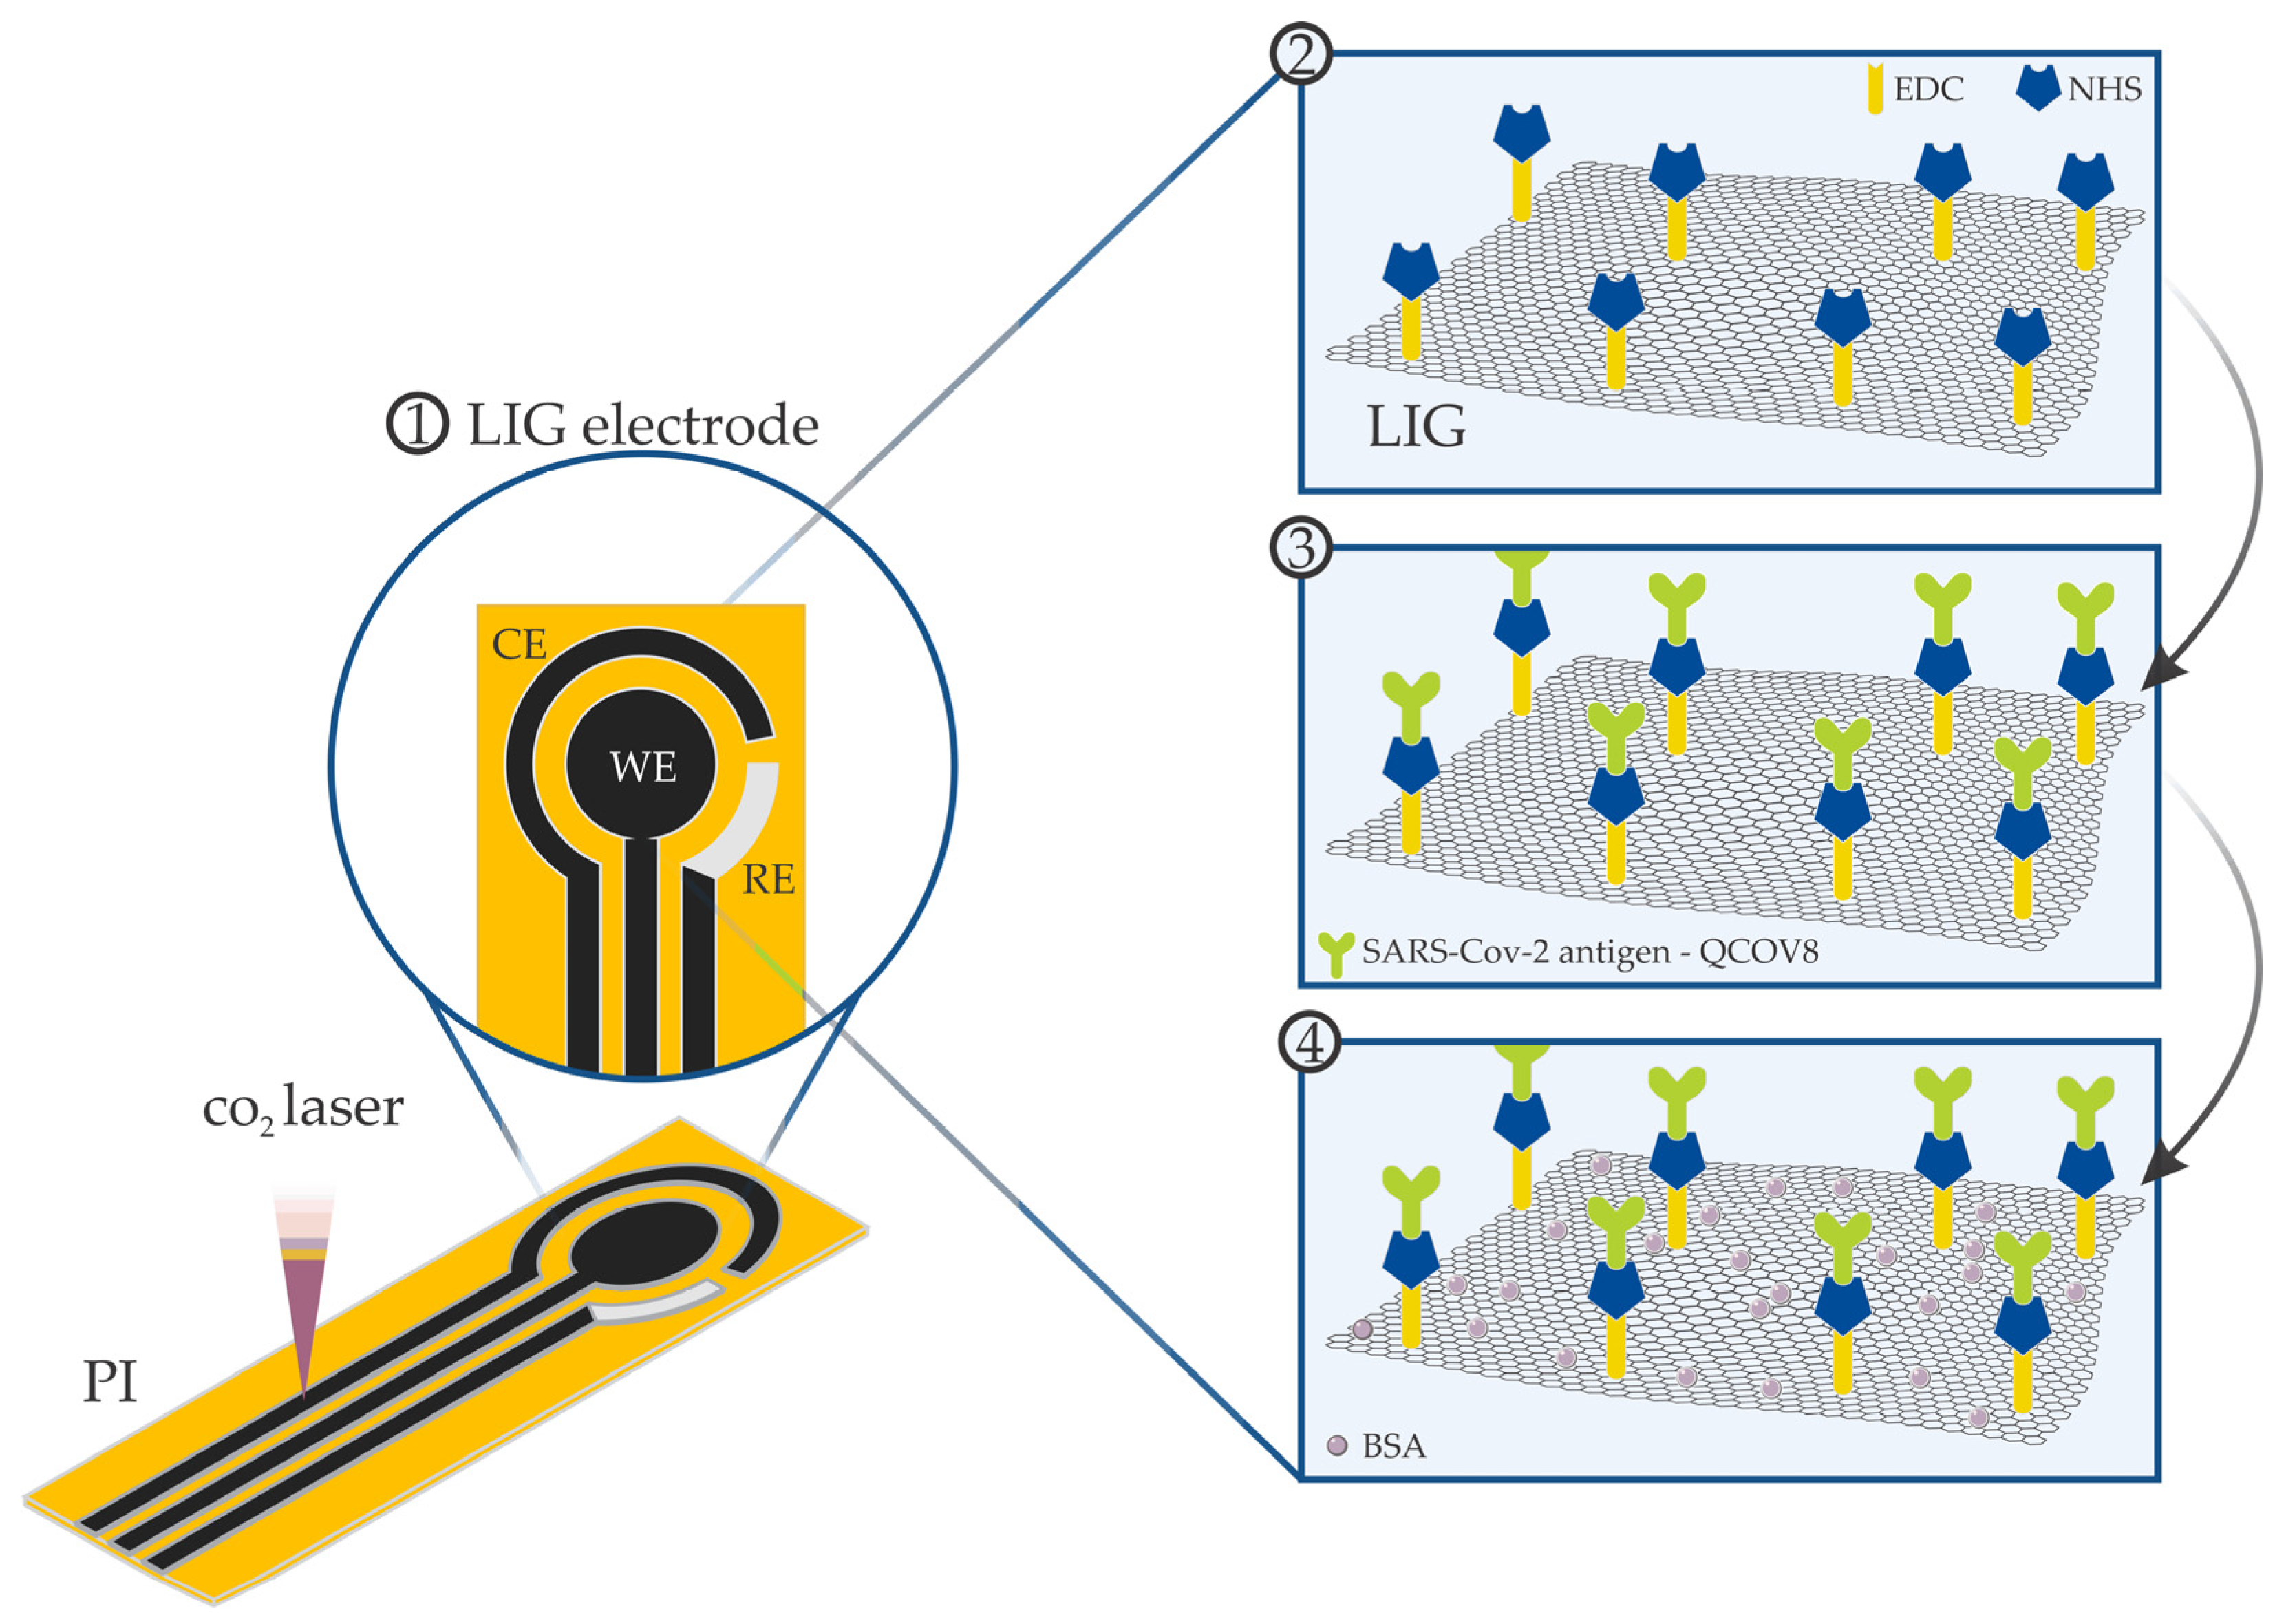
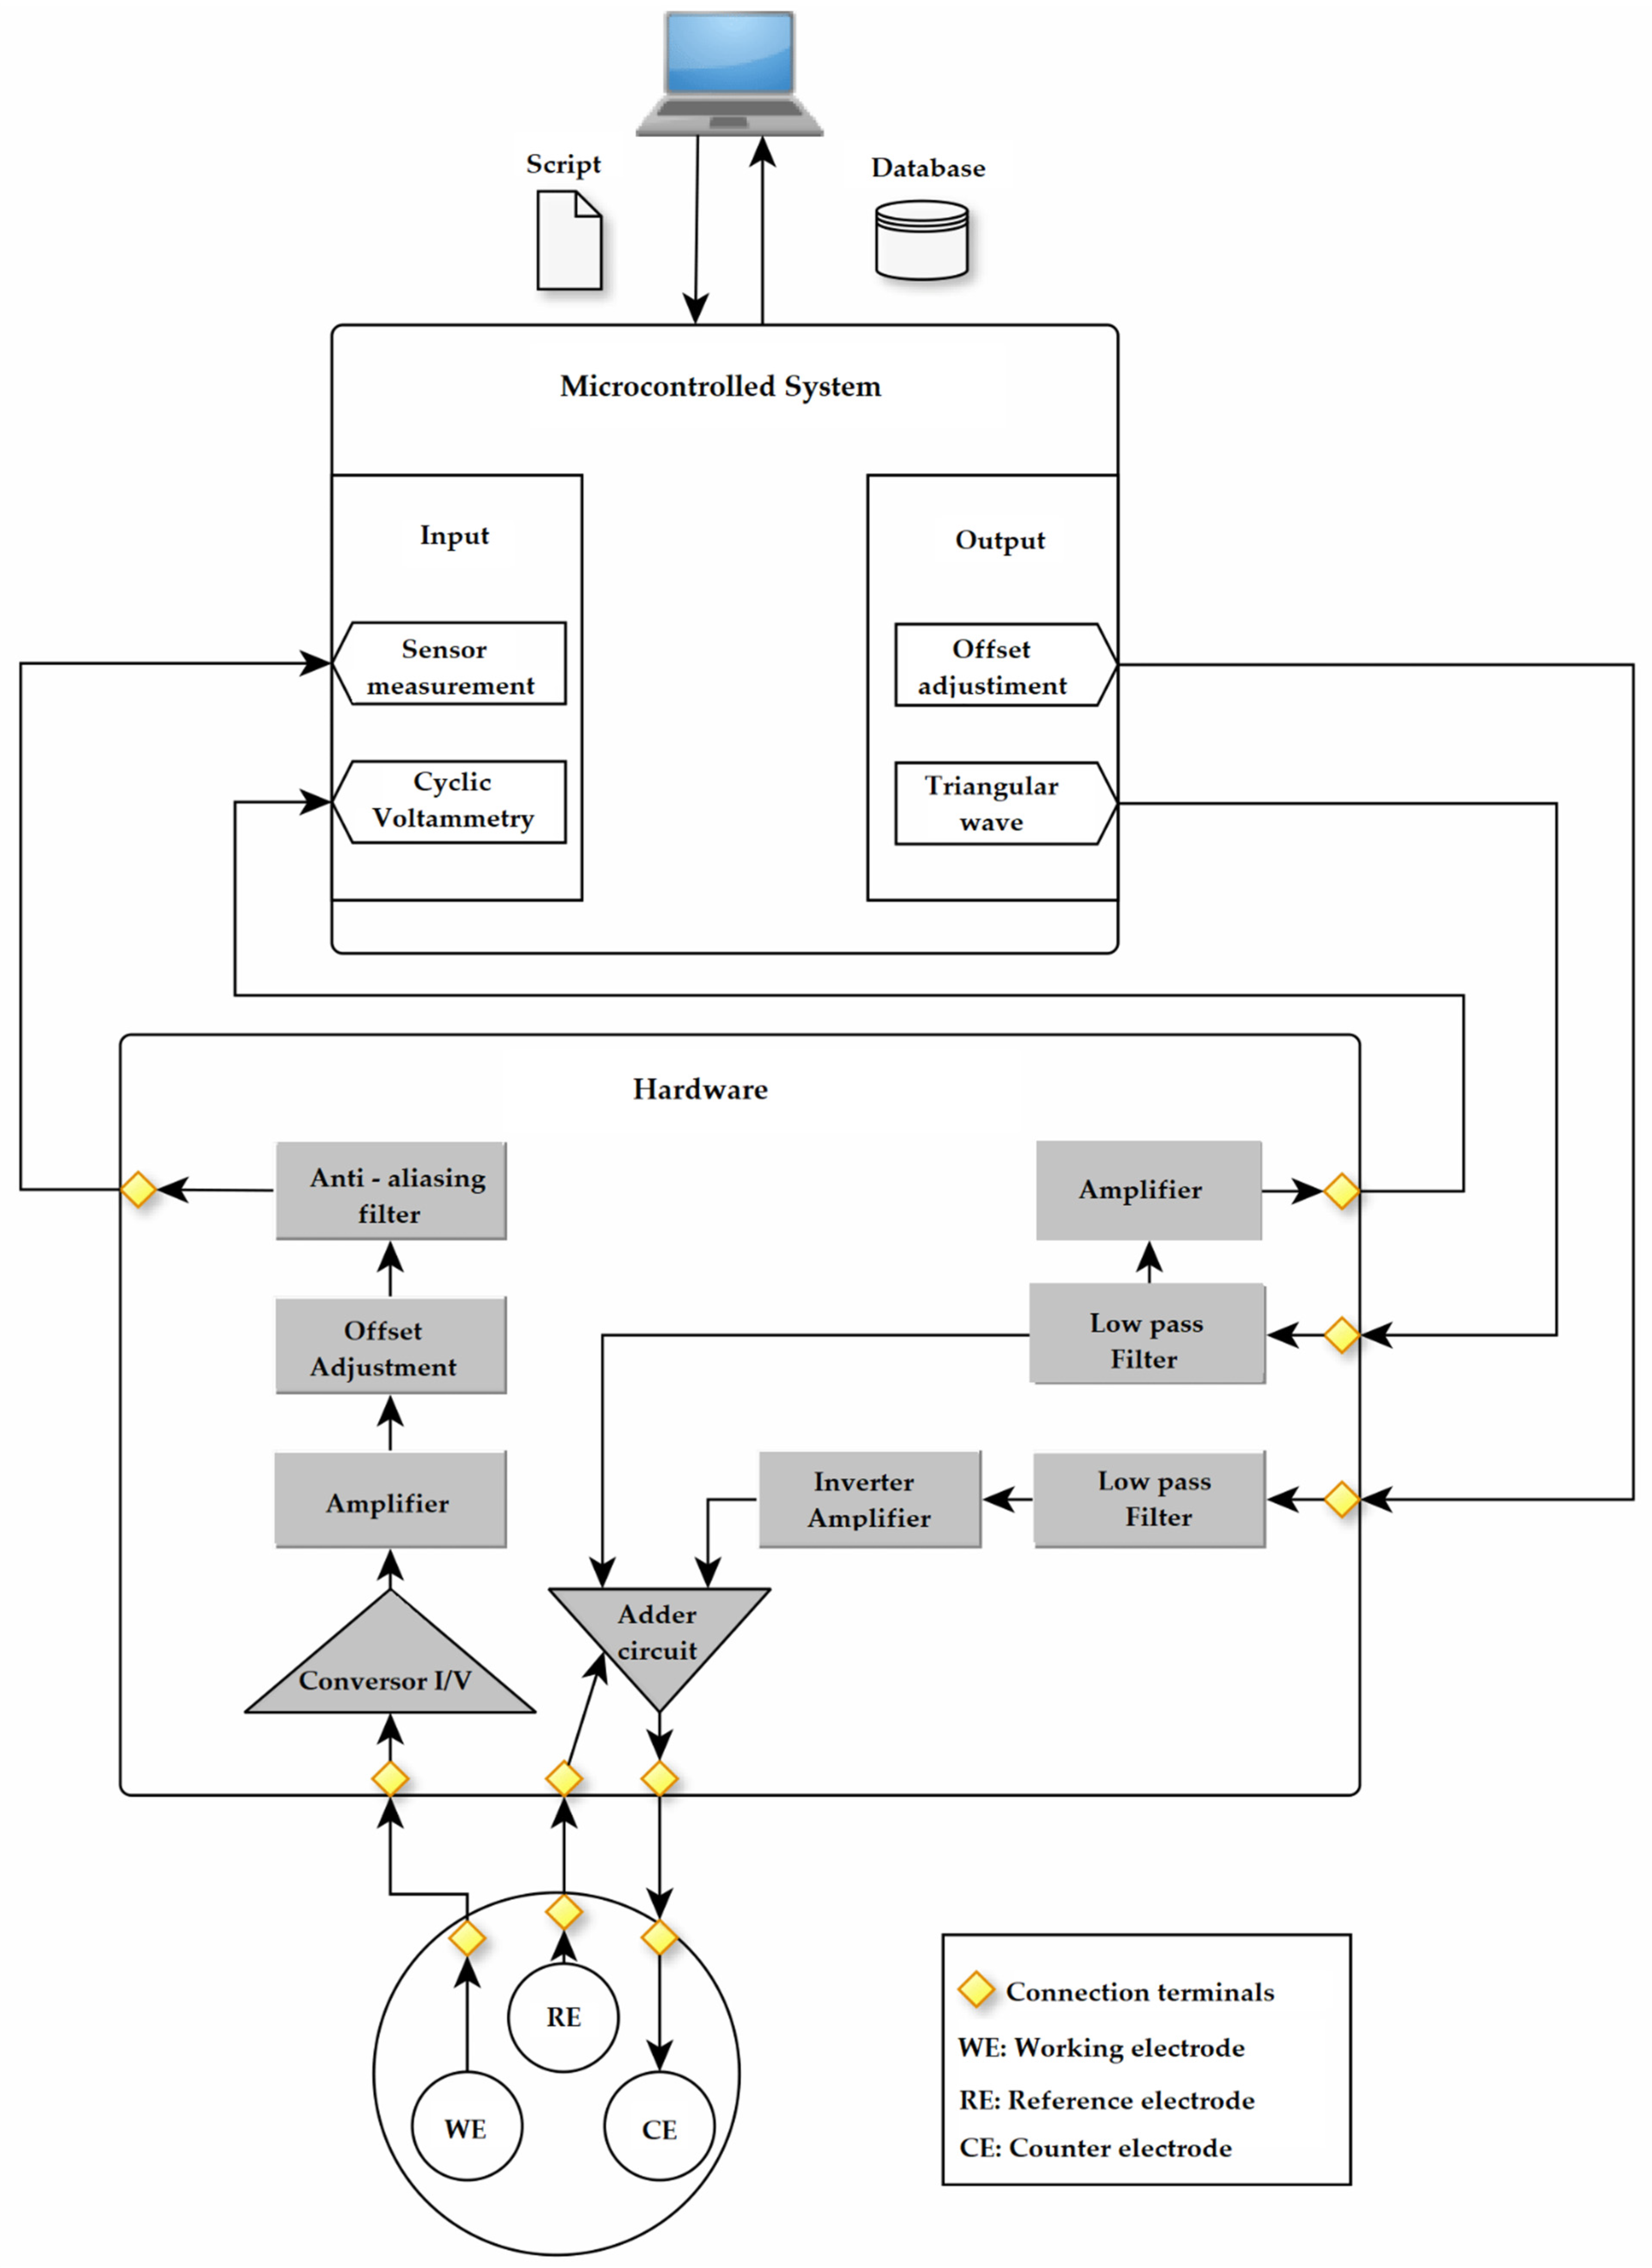
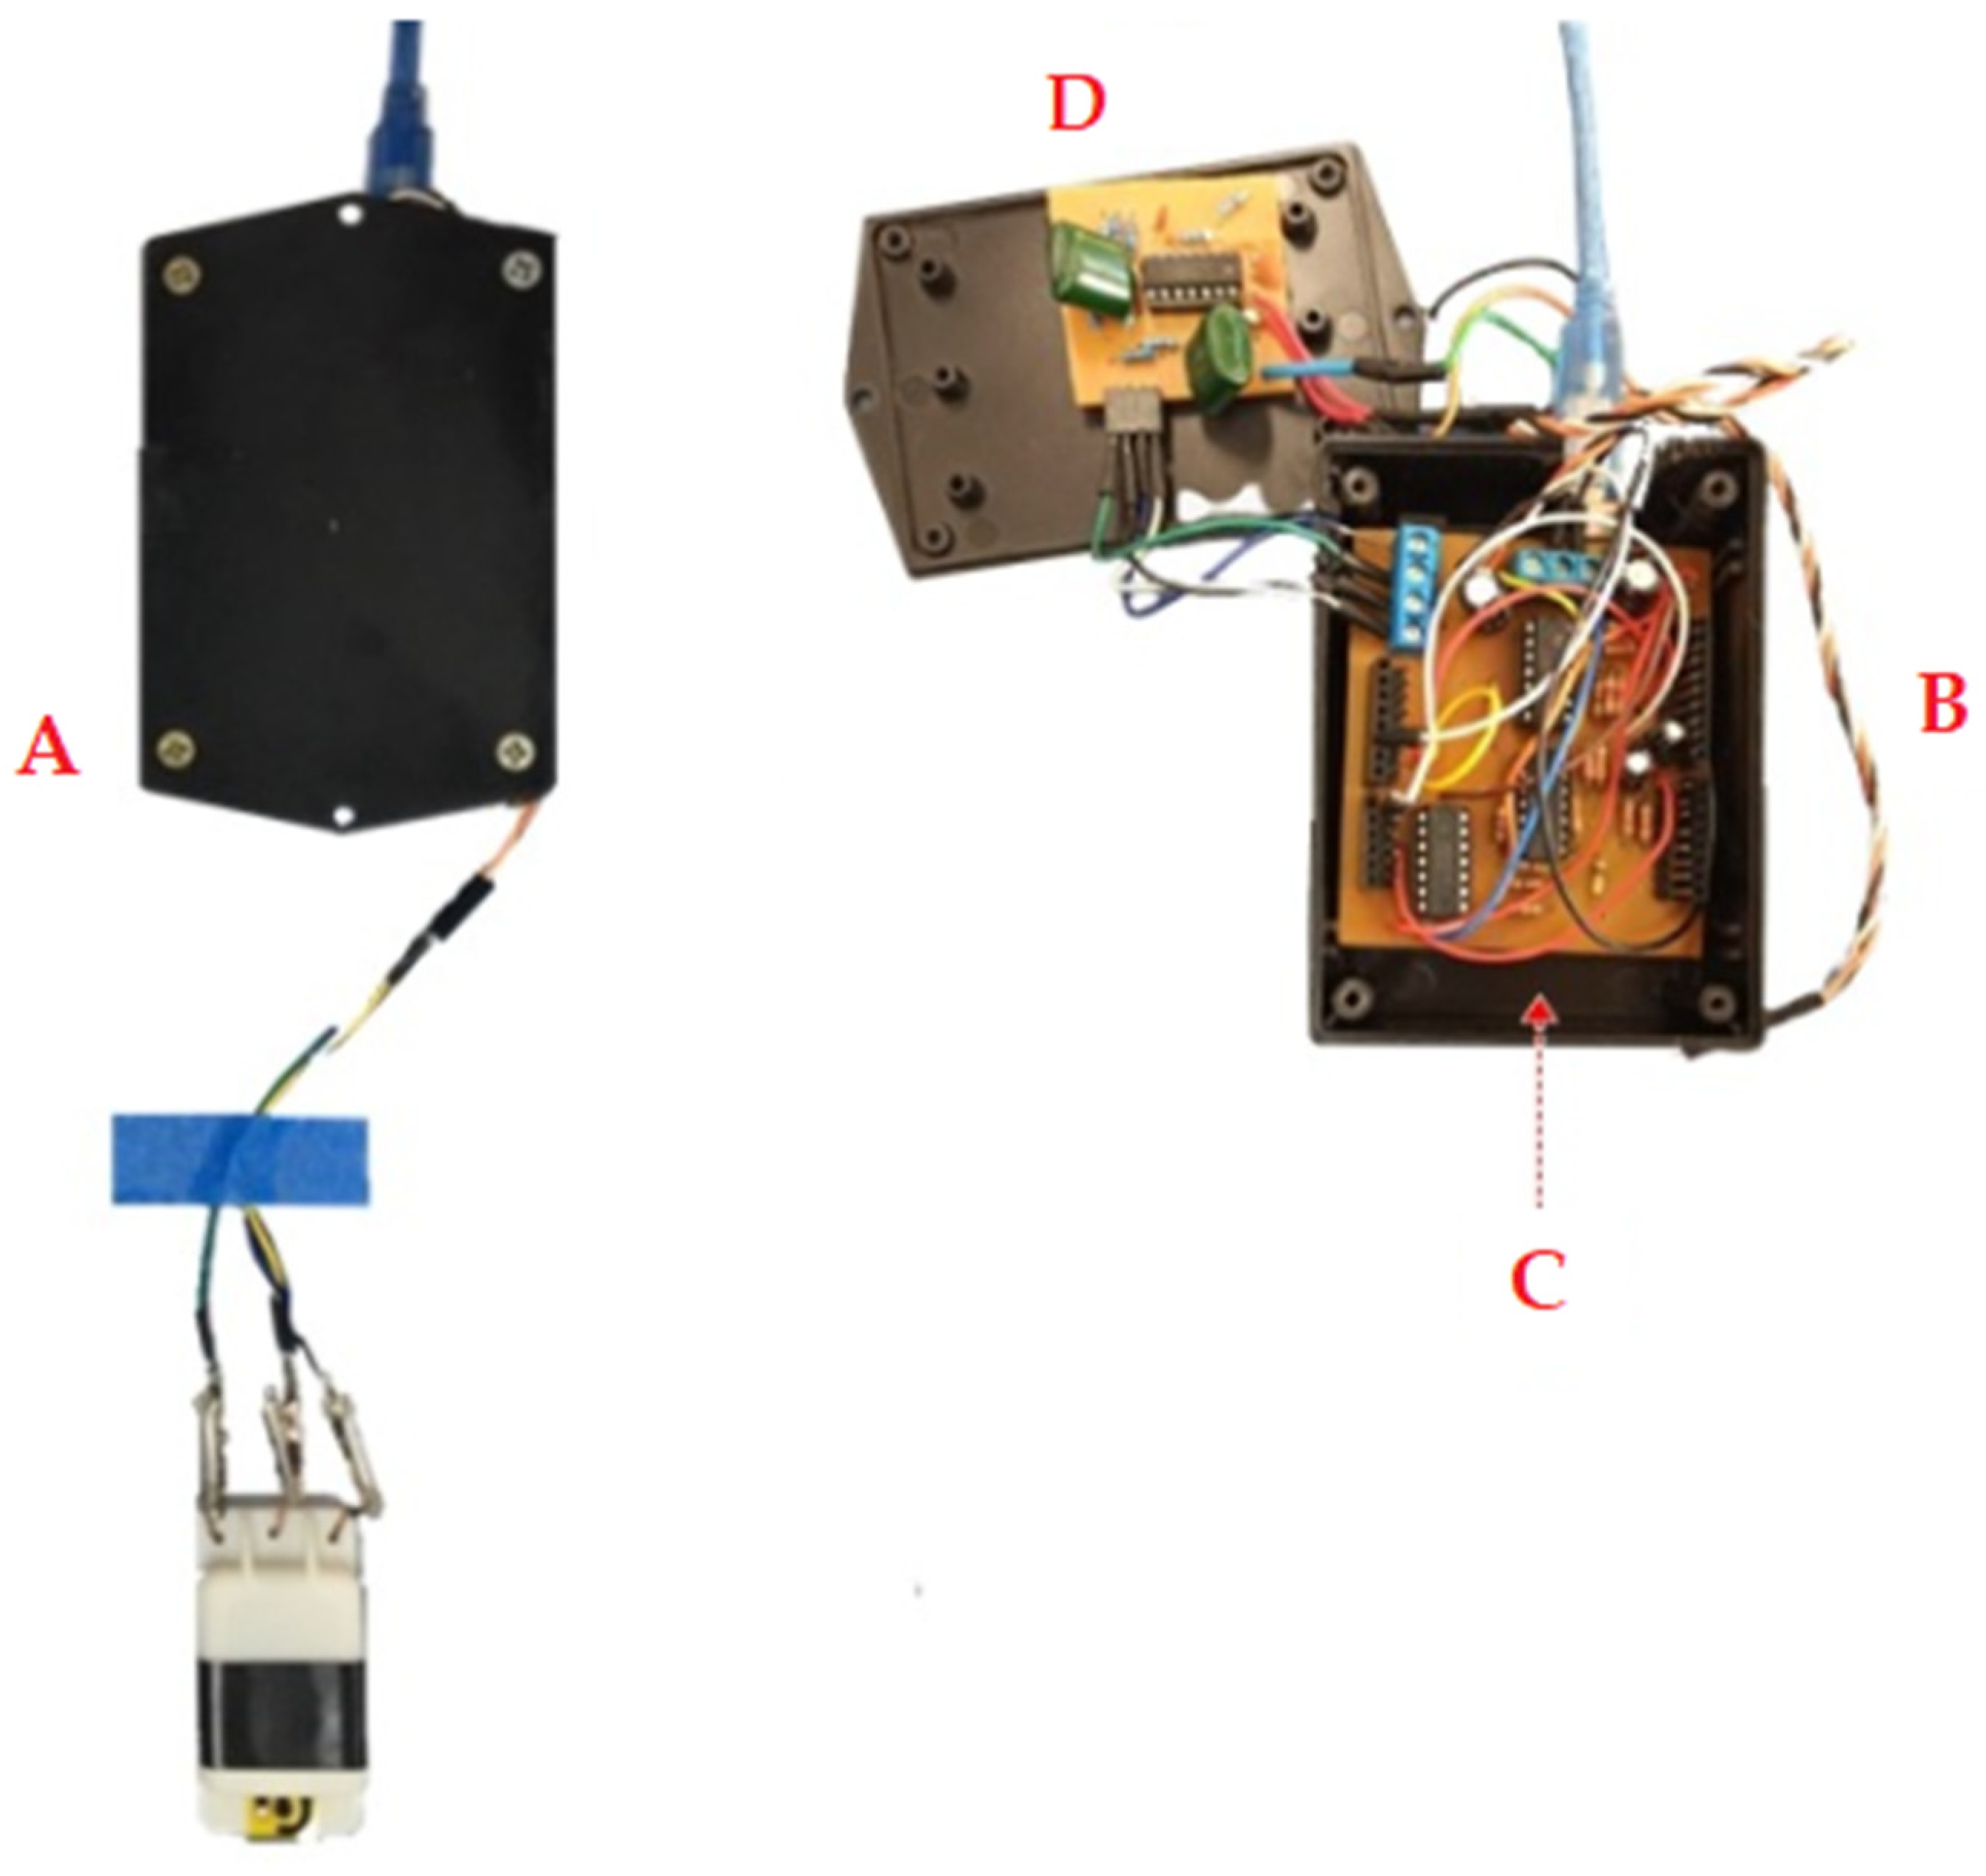
2.4. Fabrication of Portable Microcontrolled Potentiostat for SARS-CoV-2 Antibodies Diagnosing

A small and portable microcontrolled platform able to sweep the desired potentials and electrochemically characterize the biosensors in the presence and absence of SARS-CoV-2 biomarker antibodies was fabricated, with an estimated analysis processing time of 3 min. The developed portable potentiostat performs cyclic voltammetry measurements and is composed of two main platforms: a micro-controlled platform and an engineered hardware connected to a computer, as shown in Figure 2. The potentiostat is responsible for exciting the biosensor between counter electrode (CE) and reference electrode (RE). Then, the device transforms the electrical current that flows through the working electrode (WE) into a measurable voltage, which is registered for data processing. The computer is responsible for processing the data, transforming it into useful information for understanding the phenomenon involved in the analysis through the MATLAB R2016b software. From the voltage measured by the potentiostat, the current of the biosensor is obtained through a mathematical equation that represents the inverse modeling of the hardware. Figure 2 shows a detailed schematic representation of the microcontrolled system.
The microcontrolled platform is composed by an Arduino UNO, which is mainly responsible for generating the excitation signals and performing data acquisition, both controlled by an ATmega328 microcontroller. The microcontroller can provide positive voltage values from 0 to 5 V, with a resolution of 8 bits. Based on this, the digital output was set to range from 2.1 V to 3.3 V, with a reference to the center value of 2.5 V, resulting in a cyclic voltammetry from −0.4 V to 0.8 V, with a scan rate of 0.05 V·s−1 for two cycles, in a triangular wave form. On a second digital output, a 2.5 V center voltage was fixed to provide a reference to the hardware platform and to compensate the offset of the cyclic voltammetry. The microcontroller also performs the data acquisition related to biosensor measurements. The Arduino UNO platform has six analogical inputs, where two are used to acquire information from the biosensor measurement system. The microcontrolled platform has A/D converters with 10-bit resolution. One gate performs the data acquisition from the representative signal of the sensor excitation, while the second gate obtain a representative voltage of the biosensor in response to the analyte, composed of an average of ten measurements performed consecutively by the microcontroller. For the portable potentiostat fabrication, first, a similar circuit was assembled on a protoboard for functionality verification. Then, the hardware was designed in the Proteus 8 software built in shield shape from Arduino development kit for easier assembly and compaction, as shown in Figure 3.
The hardware platform is responsible for adjusting the signals generated by the micro-controlled platform to excite the sensor with the cyclic voltammetry signal. Furthermore, it is responsible for converting the current response of the biosensor into voltage, which is suitable for acquisition by the microcontrolled platform. The signals originated from the microcontrolled platform (triangular wave and offset) have a digital nature. The D/A (Digital–Analog) conversion is performed by a first-order passive low-pass filter, with cut-off frequency of 1.54 Hz. The offset signal goes through an inversion process, converting its value from 2.5 to −2.5 V. Afterwards, the triangular wave signals from 2.1 to 3.3 V and the offset signal from −2.5 V are added, generating a cyclic voltammetry, being a triangular wave from −0.4 to 0.8 V, with a scan rate of 0.05 V·s−1, with two cycles. This cyclic voltammetry measurement is applied in the sensor, generating a stimulation in the auxiliary electrode. At the same time, the reference electrode is responsible to provide feedback designed to compensate the existence of possible current leakage [26].
In the presence of analyte on the surface of the biosensor, the cyclic voltammetry measurement starts and a current related to the sensor and analyte reactions flows through the working electrode. This current is applied as an input to an amplifier circuit, in which the current is converted into a voltage response. Subsequently, the voltage goes through an amplification process to act in the appropriate range for the analog input of the microcontroller. Before the acquisition is performed, an anti-aliasing filter is applied to avoid overlapping errors in the signal’s frequency spectrum [27]. Then, the signal is made available as an input to the microcontrolled platform responsible for data acquisition. Finally, the result data is exported to a computer for data processing and graph plotting.

3. Results and Discussion

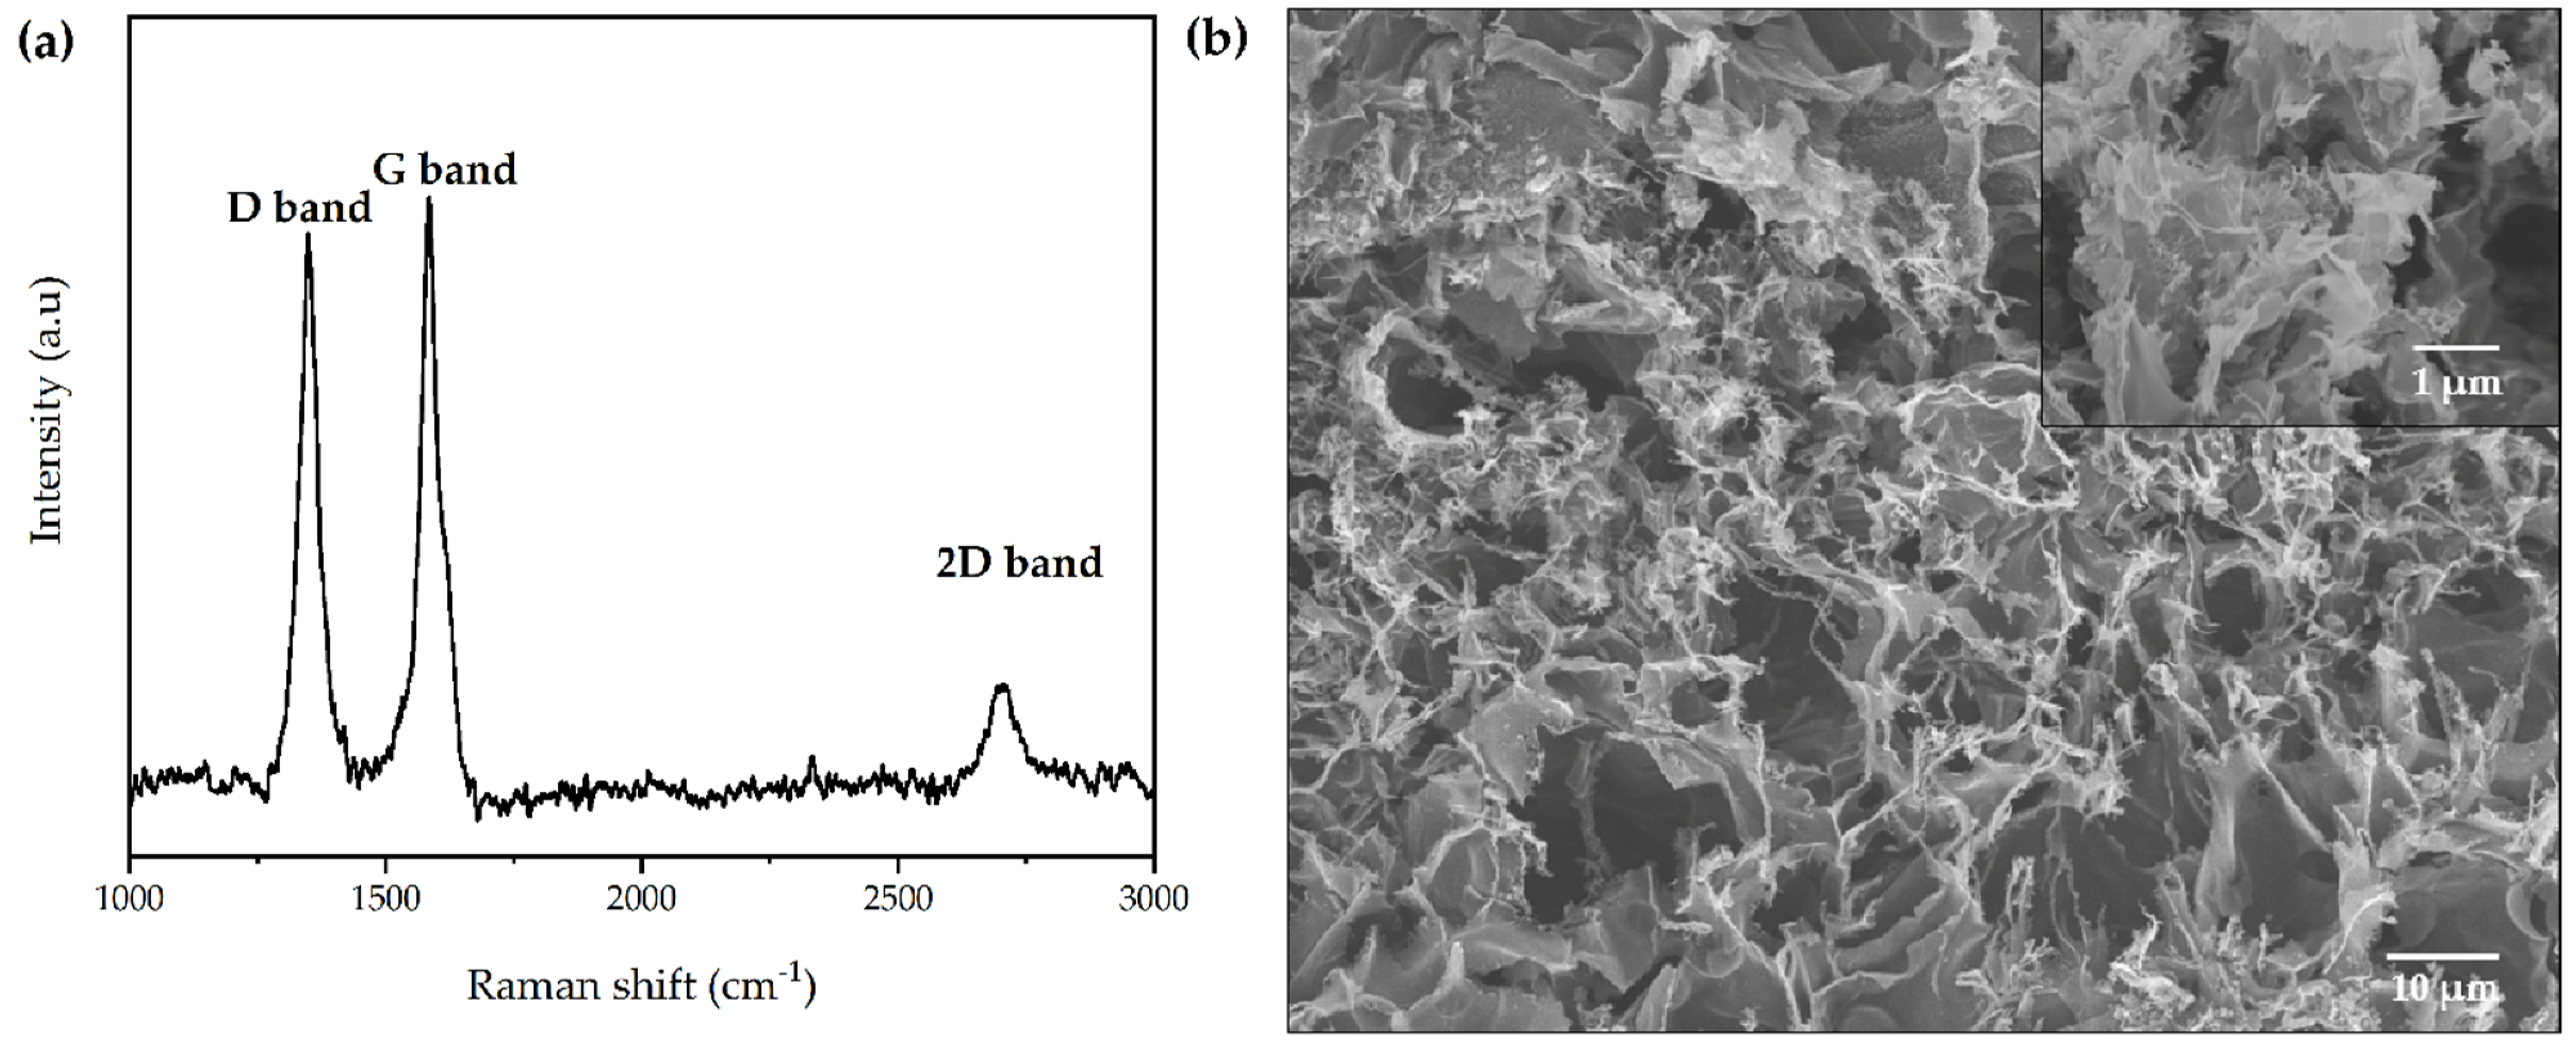
3.1. Structural and Morphological Results

Raman spectroscopy was performed to study the structural characteristics of LIG produced from PI sheets, and the results are shown in Figure 4a. The two typical bands of carbon-based structures can be observed at 1349 cm−1 and 1583 cm−1, which are attributed to the D band and G band, respectively. The D band is related to the structural defects or disorder (sp2 breathing mode) and numerous graphene edges originated during laser irradiation, while the G band refers to the first order scattering vibration of sp2 carbon from graphitic structures [23,28]. In addition, a 2D band was noticed close to 2704 cm−1, which corresponds to a second order of the D band and is related to second-order zone-boundary phonons [29]. The presence of these bands suggests that the polymer was successfully converted into a carbonaceous material and is consistent with studies involving the formation of LIG previously reported [30]. Furthermore, the relative intensity of D and G bands (ID/IG ratio) express the degree of graphitization and defect concentration of the material [31]. The ID/IG ratio was calculated considering the area under each peak and was found to be 0.88 for LIG. Moreover, the I2D/IG ratio was also calculated, resulting in a value of 0.18, suggesting the formation of a multilayered graphene structure [32].
The morphology of the LIG was examined via FESEM, as shown in Figure 4b. The image exhibits a highly interconnected porous structure comprising numerous three-dimensional graphene nanosheets, which results in more accessible surface area for electrochemical reactions, becoming an ideal platform for the development of electrochemical biosensors.

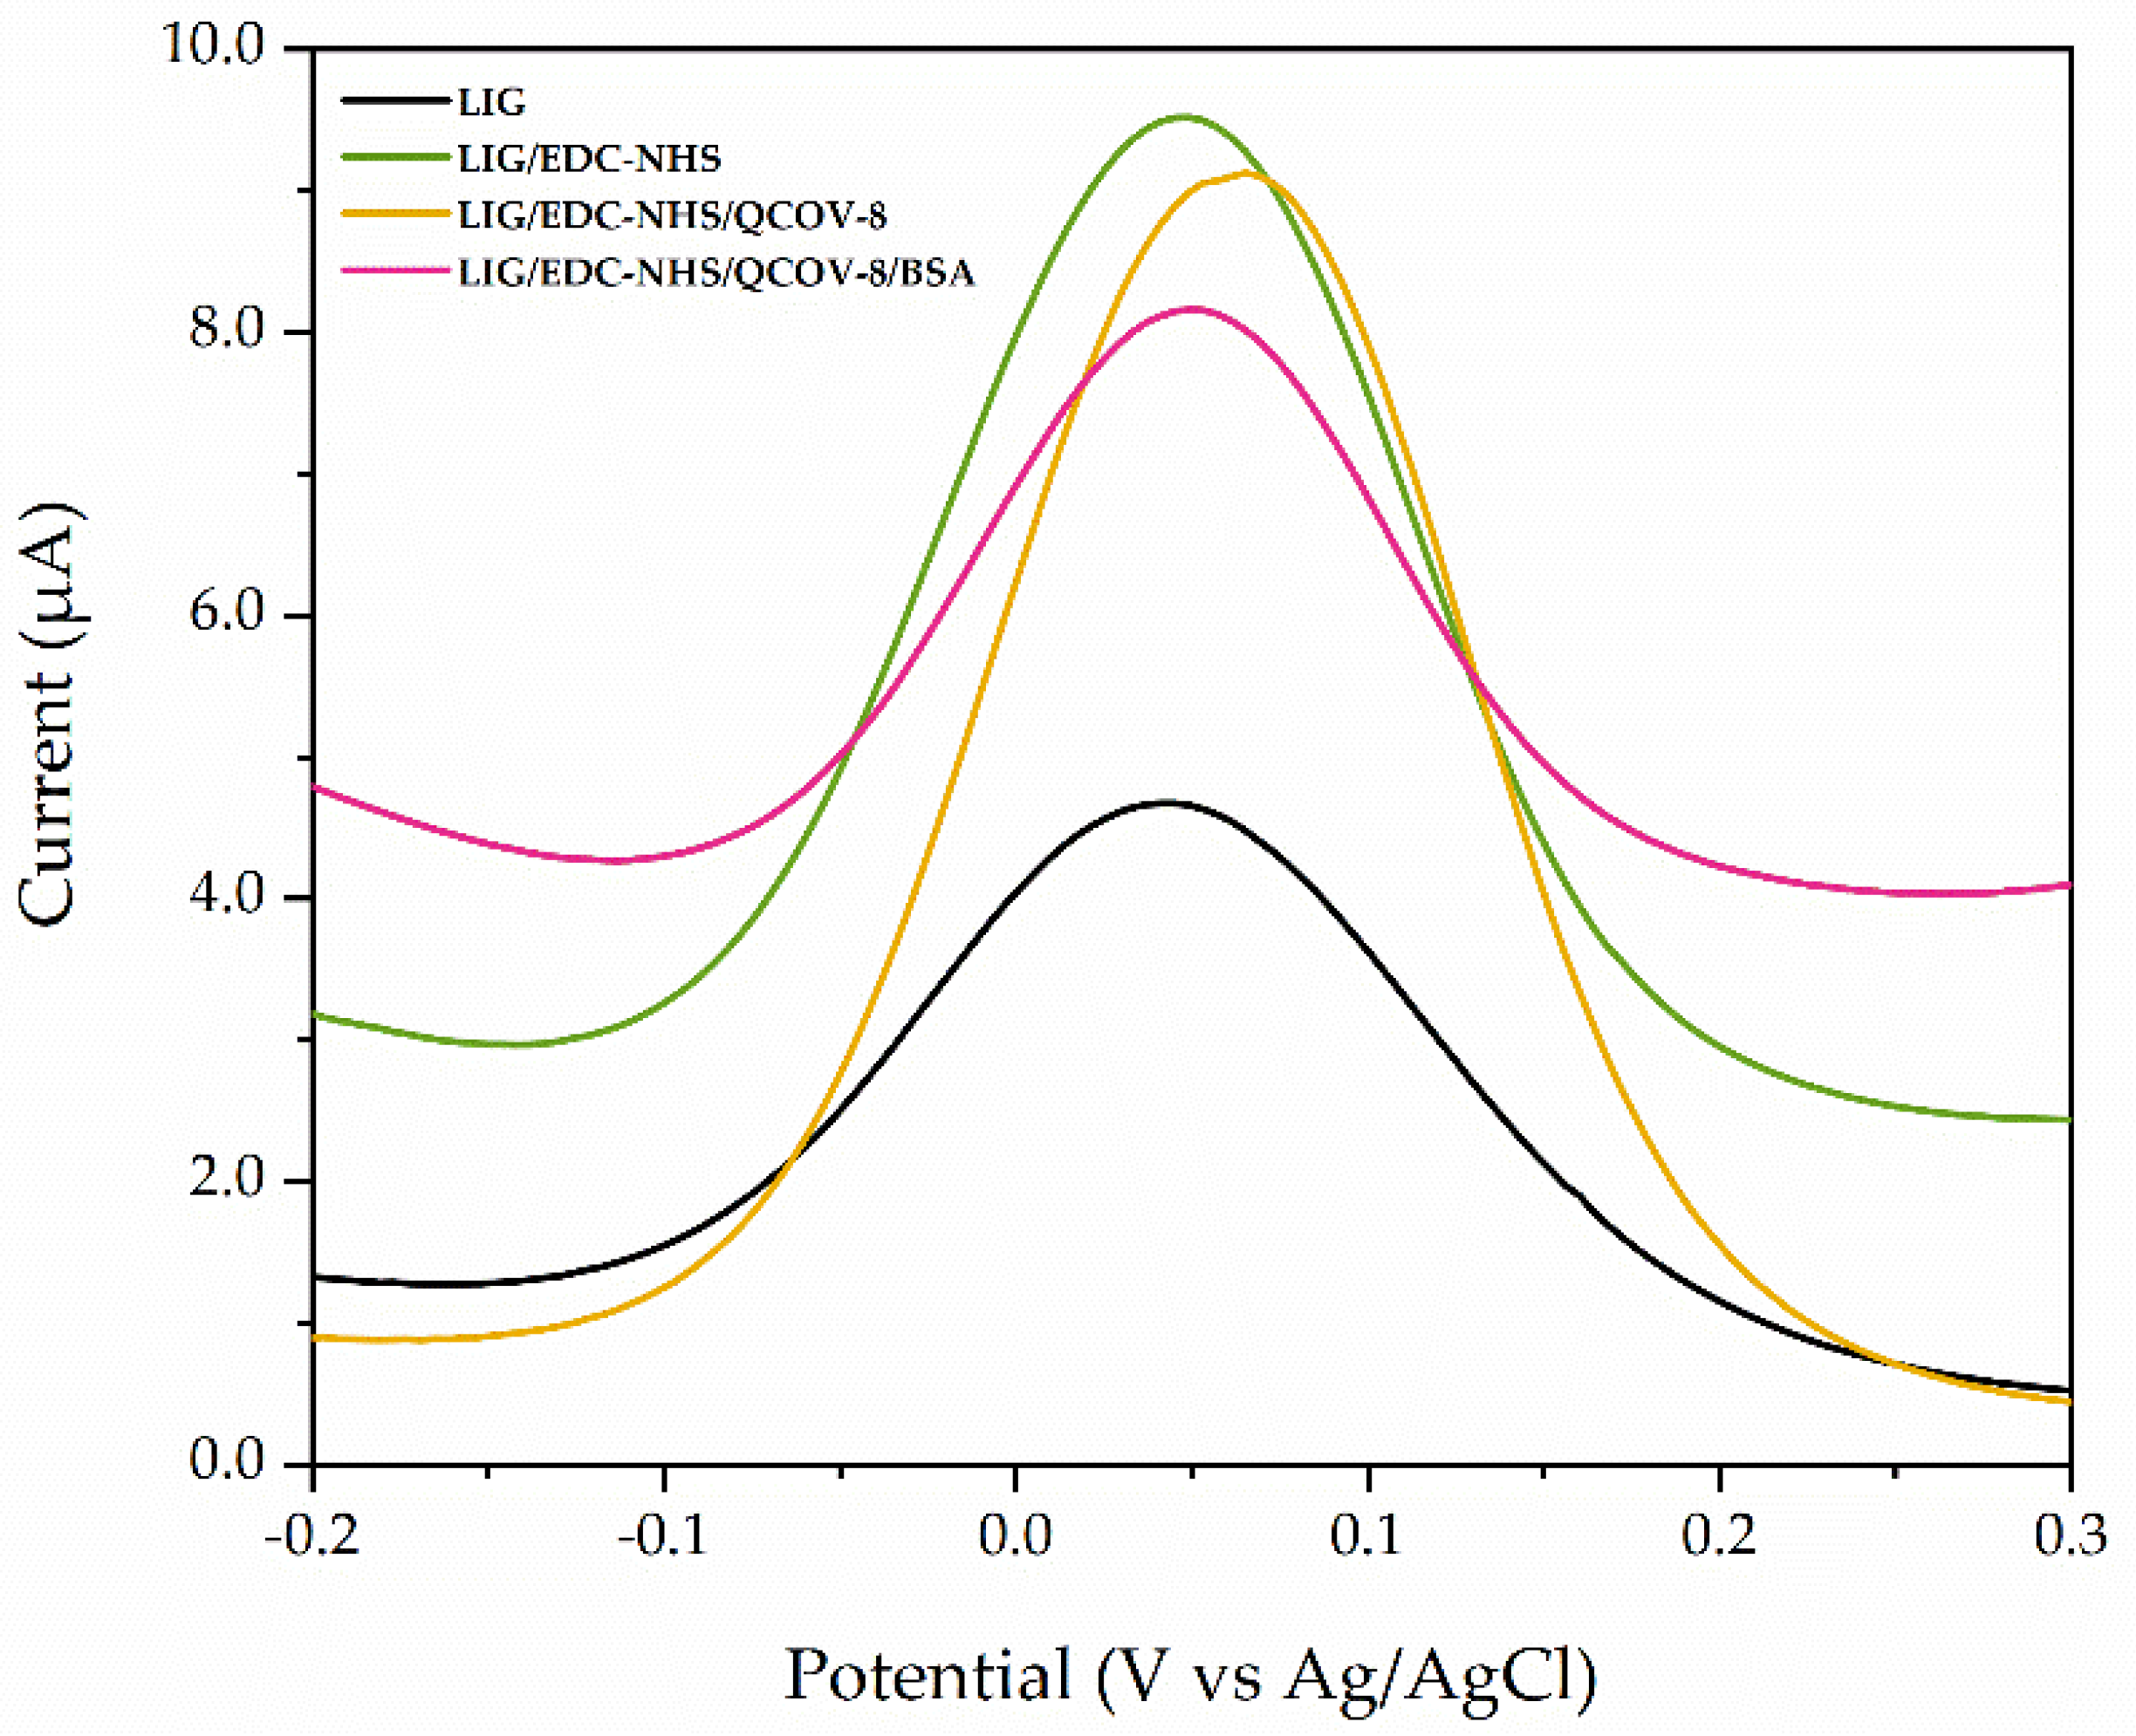
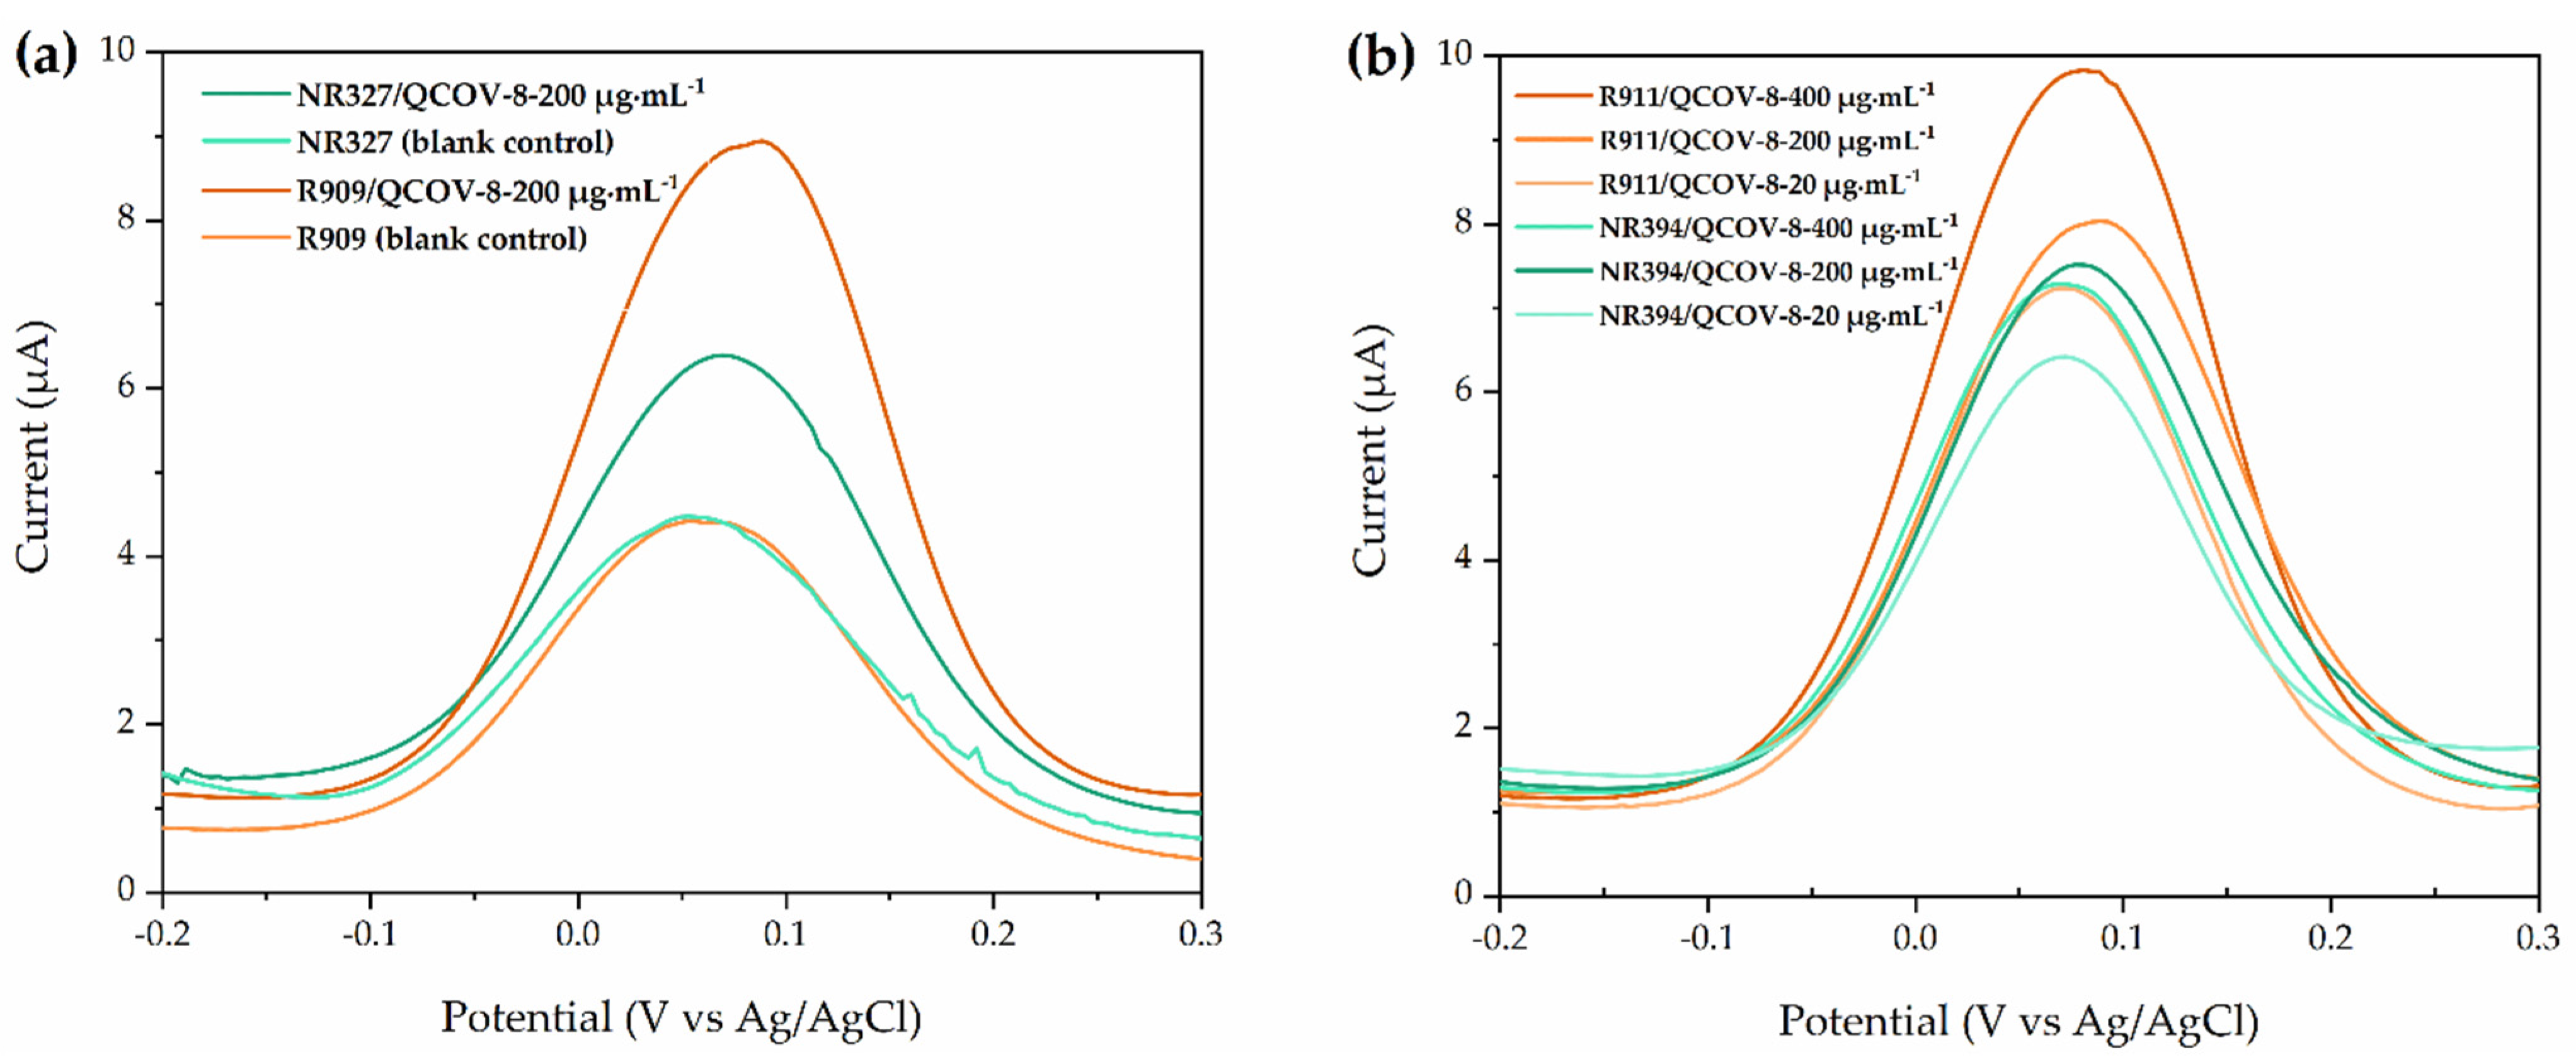
3.2. Electrochemical Results

Firstly, DPV was performed to electrochemically characterize the electrode after each step of functionalization, and the results are shown in Figure 5. It is observed that the current increases and, subsequently, decreases as the sequence of functionalization process is carried out. The LIG electrode has a large charge diffusion due to its numerous ionic transport channels, as well as a high active surface area, which provides a good interaction with the electrolyte, resulting in good electrochemical response [23,33,34]. The use of EDC and NHS aims to assist the process of coupling chemical bonds between enzymes and functional groups of LIG through the immobilization of biomolecules with covalent bonds, optimizing the sensor sensitivity and increasing of the oxidation current. These compounds activate the carboxyl groups (–COOH) by direct reaction with primary amines (–NH2) through the formation of amide bonds that enhances the covalent conjugation between the SARS-CoV-2 specific protein and the LIG substrate, which promotes a decrease in current due to the interaction between antigen and coupling reagent [5,35,36]. However, some active sites remain avaliable, which can reduce the stability of the immunosensor during the analyte determination, making it necessary to use a blocking reagent. The use of BSA converted the available connections to nonspecific sites, thus descreasing the current and providing stabilization [5]. This process increases the specificity and stability of the immunoelectrode, similarly to that described by Yakho et al. (2020) and Torrente-Rodrigues et al. (2020), who reported the use of coupling and blocking agents to fabricate electrochemical biosensors [14,36].
Then, DPV was performed to detect the presence of COVID-19 antibodies in clinical samples of human blood serum and the results are shown in Figure 6a. The DPV curves of both non-reactive and reactive blood serum for COVID-19 antibodies show an oxidation peak around 0.08 V. However, it can be clearly seen that the current generated during oxidation is greater for the reactive samples (Table 1), due to the presence of aromatic amino acids from anti-SARS-CoV-2 antibodies reacting with the K3[Fe(CN)6] redox pair, which are organometallic iron compounds commonly used as a mediator to oxidize amino acids with aromatic groups located in the three-dimensional structure of antibodies. Thus, this can cause a disturbance in the system, with charge transfer occurring at the time of the interaction in which an antigen-antibody complex is formed, which is typically maintained by hydrogen bonds and forces hydrophobic electrodynamics [37,38,39]. Similarly, Torrente-Rodríguez et al. (2020) described the fabrication of a graphene-based immunosensor for identification of COVID-19 antibodies through DPV measurements, displaying a similar behavior, with higher current peaks for samples containing SARS-CoV-2 antibodies [31]. This behavior may be correlated to the adsorption and interaction of amine and hydroxyl functional groups of glycoproteins with NHS-activated hydroxyl/hydrogen/hydrogen groups on the electrode surface. These results agree with the electrochemical mechanism presented by Hashemi et al. (2021), which reported the detection of ultrasensitive viral glycoprotein NanoSystem for accurate screening of SARS-CoV-2 antibodies in biological/non-biological media. In this work, the detection mechanism occurs by activation of hydrogen bonding at physiological pH using NHS, which provides more reactive hydroxyl functional groups, resulting in higher electrostatic interaction between the hydroxyl and amine from the glycoproteins with the ones from the antigen previously deposited on the electrode surface [16].
The electrochemical properties of biosensors are directly dependent of numerous factors. Among them, one of the most important is the amount of biological recognition element anchored on the surface of the electrodes, since at a given potential it will promote the interaction with the target analyte, generating an increase or decrease in the current. Layqah and Eissa (2019) developed a biosensor to detect MERS-CoV using antibody solutions varying from 0.5 to 60 µg·mL−1; Torrente-Rodríguez et al. (2020) fabricated LIG-based sensors to identify COVID-19 antibodies adding 250 µg·mL−1 of specific antigen [35,40]. Then, to further investigate the response of the COVID-19 immunosensors under different concentrations of specific antigen, DPV measurements in electrodes containing 10 µL of 20, 200 and 400 µg·mL−1 of antigen solutions in reactive and non-reactive clinical samples were performed, and Figure 6b shows the results. It is noticeable that the increase in the antigen concentration significantly enhances the DPV peaks intensity for reactive clinical samples, while maintaining similar response for non-reactive samples. Moreover, it can be observed that for the lower concentrations of antigen, there is no significant difference in the DPV curves between reactive and non-reactive clinical samples. Thus, samples produced with 10 µL of 400 µg·mL−1 of specific antigen for SARS-CoV-2 were selected for further electrochemical tests.
After selection of the best parameters to fabricate the SARS-CoV-2 immunosensors, different reactive and non-reactive clinical samples of human blood serum for COVID-19 were tested. All samples were previously tested by ELISA and qRT-PCR, as described in Table 1. Figure 7a shows that all reactive samples exhibited higher current peaks than non-reactive blood serum, which is directly related to the existence of antigen reactivity with the SARS-CoV-2 antibodies present in the clinical samples. Although the reactivity of the ELISA test with electrochemical immunosensors did not show a linear relation with the increase in the current peak, these results suggest that the electrochemical immunosensor is able to differentiate the reactive from non-reactive clinical samples. Furthermore, a good reproducibility was obtained for tests performed in triplicate, as shown in Figure 7b, especially for the reactive clinical samples. Figure 7c displays the mean values of current for tests performed in reactive and non-reactive clinical samples, reaching 9.53 µA (standard deviation of 0.32) and 7.96 µA (standard deviation of 0.84), respectively.
Reactive and non-reactive clinical samples were also analyzed to evaluate the effectiveness of the developed portable potentiostat platform for detecting COVID-19 antibodies in response to SARS-CoV-2 infection. The results were obtained after CV analyses (according to Section 2.4). Figure 8a,b shows the results in terms of current detection for each tested sample. These results showed that non-reactive analyte had a lower current response when compared to reactive analytes, which is in good agreement with the previous results observed for tests performed in the commercial potentiostat.
As can be observed in the descriptive analyses shown in Figure 7c and Figure 8b, the maximum value of the confidence interval of the non-reactive group is smaller than the minimum value of the confidence interval of the reagent group, indicating evident differences in the sampled data. To confirm the statistical differences between reactive and non-reactive samples, Student’s t-test analysis was performed, evaluating the p-value. For a Student’s t-test with a 95% confidence interval, the p-values obtained were 0.0004 and 0.002 for the commercial potentiostat and the portable potentiostat, respectively. In both cases, the p value is lower than the significance level (0.05), which confirms the statistical divergence between the analyzed groups, i.e., the sample populations of reactive and non-reactive have different peak averages, confirming that or device is capable of electrochemically detect SARS-CoV-2 antibodies in real blood serum samples [41,42].

4. Conclusions

To meet the demand for effective diagnostic tools for detection of COVID-19 antibodies, we have developed a laser induced graphene-based platform coupled to a portable microcontrolled potentiostat to electrochemically detect anti-SARS-CoV-2 antibodies in clinical samples of blood serum. The device exhibited a fast identification in blood serum biofluids of patients reactive and non-reactive for anti-SARS-CoV-2 antibodies, has an estimated analysis processing time of 3 min, with good reproducibility, becoming a promising diagnosis tool for accurate monitoring of SARS-CoV-2 infection. Moreover, the biosensor is simple and no pretreatment of sample is required, showing high potential for implementation in POC devices for patient screening, as well as for use in telemedicine service and remote monitoring, making it possible to notify the competent bodies, contributing to the epidemiological mapping and planning of public health policies. More studies are being developed and this platform is being expanded to be applied in the monitoring and mapping of the population’s vaccination level. This will provide a greater understanding in the studies as it may consider Brazil’s genetic, socioeconomic and environmental aspects. These information will enable a greater performance assessment of the tests and also the optimization to directly detect the SARS-CoV-2 virus, presenting new possibilities for the diagnosis of COVID-19.

5. Patents

The methodology developed in this work is related to the patent filed under the number BR 10 2021 009120.

Author Contributions

Conceptualization, N.L.V.C., M.E.O., B.V.L., L.d.S.P. and F.R.C.; Data curation, N.L.V.C., M.E.O., B.V.L., G.K.M., B.B.G., A.B.L.R. and R.D.C.B.; Formal analysis, M.E.O., B.V.L., J.H.H.R., G.K.M. and R.D.C.B.; Funding acquisition, N.L.V.C., L.d.S.P., F.R.C., E.P. and M.T.E.; Investigation, M.E.O., B.V.L., J.H.H.R. and M.L.F.A.; Methodology, N.L.V.C., M.E.O., B.V.L., B.B.G., A.B.L.R., M.L.F.A. and M.R.A.F.; Project administration, N.L.V.C., L.d.S.P., F.R.C., C.M.P.d.P. and M.T.E.; Resources, N.L.V.C., L.d.S.P., F.R.C., C.M.P.d.P. and M.T.E.; Software, B.B.G. and A.B.L.R.; Supervision, N.L.V.C., L.d.S.P., F.R.C., E.P., C.M.P.d.P. and M.T.E.; Validation, M.E.O., B.V.L., M.L.F.A. and M.R.A.F.; Visualization, M.E.O., B.V.L., G.K.M. and R.D.C.B.; Writing—original draft preparation, M.E.O., B.V.L., G.K.M. and R.D.C.B.; Writing—review and editing, G.K.M., J.H.H.R. and R.D.C.B. All authors have read and agreed to the published version of the manuscript.

Funding

This research was funded by CNPq (process number PCI/302214/2021-6), Coordenaçāo de Aperfeiçoamento de Pessoal de Nível Superio—Brasil (CAPES)—Finance Code 001, CAPES-PrInt (SWE, process number 88887.310585/2018-00), CAPES-PrInt (SWE, process number 88887.370699/2019-00), FAPERGS 06/2020—Ciência e Tecnologia no Combate à COVID-19 (process number 20/2551-0000260-8), Forensic National Institute of Science and Technology (grant number 465450/2014-8) and UFABC EDITAL 73/2020 (process number 23006.002353/2020-41).

Institutional Review Board Statement

The study was conducted according to the guidelines of the Declaration of Helsinki and approved by the Institutional Review Board of National Research Ethics Commission ((CONEP) (protocol code IRB n° 242/63 with opinion number 4,043,628 and date of approval on 24 May 2020).

Informed Consent Statement

Not applicable.

Data Availability Statement

Not applicable.

Acknowledgments

The authors are grateful to the Multiuser Central Facilities (UFABC) for the experimental support.

Conflicts of Interest

The authors declare no conflict of interest. The funders had no role in the design of the study; in the collection, analyses, or interpretation of data; in the writing of the manuscript, or in the decision to publish the results.

References

  1. World Health Organization (WHO). Global Research on Coronavirus Disease (COVID-19). Available online: https://www.who.int/emergencies/diseases/novel-coronavirus-2019/global-research-on-novel-coronavirus-2019-ncov (accessed on 20 February 2021).
  2. Hallal, P.C. Worldwide differences in COVID-19-related mortality. Cienc Saude Coletiva 2020, 1, 2403–2410. [Google Scholar] [CrossRef] [PubMed]
  3. Singh, B.; Datta, B.; Ashish, A.; Dutta, G. A comprehensive review on current COVID-19 detection methods: From lab care to point of care diagnosis. Sens. Int. 2021, 2, 100119. [Google Scholar] [CrossRef] [PubMed]
  4. Hallal, P.C.; Barros, F.C.; Silveira, M.F.; Barros, A.J.D.; Dellagostin, O.A.; Pellanda, L.C.; Struchiner, C.J.; Burattini, M.N.; Hartwig, F.P.; Menezes, A.M.B.; et al. EPI COVID-19 protocol: Repeated serological surveys on SARS-CoV-2 antibodies in Brazil. Cienc Saude Coletiva 2020, 9, 3573–3578. [Google Scholar] [CrossRef]
  5. Ali, M.A.; Hu, C.; Jahan, S.; Yuan, B.; Saleh, M.S.; Ju, E.; Gao, S.-J.; Panat, R. Sensing of COVID-19 Antibodies in Seconds via Aerosol Jet Nanoprinted Reduced-Graphene-Oxide-Coated 3D Electrodes. Adv. Mater. 2021, 33, 2006647. [Google Scholar] [CrossRef] [PubMed]
  6. Qiu, G.; Gai, Z.; Tao, Y.; Schmitt, J.; Kullak-Ublick, G.A.; Wang, J. Dual-Functional Plasmonic Photothermal Biosensors for Highly Accurate Severe Acute Respiratory Syndrome Coronavirus 2 Detection. ACS Nano 2020, 14, 5268–5277. [Google Scholar] [CrossRef] [Green Version]
  7. World Health Organization (WHO). Coronavirus Disease (COVID-19) Pandemic. Available online: https://www.who.int/emergencies/diseases/novel-coron.avirus-2019 (accessed on 12 January 2022).
  8. Mahase, E. Coronavirus: COVID-19 has killed more people than SARS and MERS combined, despite lower case fatality rate. BMJ 2020, 368, 641. [Google Scholar] [CrossRef] [Green Version]
  9. World Health Organization (WHO). Middle East Respiratory Syndrome Coronavirus (MERS-CoV)—United Arab Emirates. Available online: https://www.who.int/emergencies/disease-outbreak-news/item/middle-east-respiratory-syndrome-coronavirus-(mers-cov)-united-arab-emirates (accessed on 12 January 2022).
  10. Iravani, S. Nano- and biosensors for the detection of SARS-CoV-2: Challenges and opportunities. Mater. Adv. 2020, 1, 3092–3103. [Google Scholar] [CrossRef]
  11. Traugott, M.; Aberle, S.W.; Aberle, J.H.; Griebler, H.; Karolyi, M.; Pawelka, E.; Puchhammer-Stöckl, E.; Zoufaly, A.; Weseslindtner, L. Performance of Severe Acute Respiratory Syndrome Coronavirus 2 Antibody Assays in Different Stages of Infection: Comparison of Commercial Enzyme-Linked Immunosorbent Assays and Rapid Tests. J. Infect. Dis. 2020, 222, 362–366. [Google Scholar] [CrossRef]
  12. Liu, X.; Wang, J.; Xu, X.; Liao, G.; Chen, Y.; Hu, C.H. Patterns of IgG and IgM antibody response in COVID-19 patients 2020. Emerg. Microbes Infect. 2020, 9, 1269–1274. [Google Scholar] [CrossRef]
  13. Lin, Q.; Wen, D.; Wu, J.; Liu, L.; Wu, W.; Fang, X.; Kong, J. Microfluidic Immunoassays for Sensitive and Simultaneous Detection of IgG/IgM/Antigen of SARS-CoV-2 within 15 min. Anal. Chem. 2020, 92, 9454–9458. [Google Scholar] [CrossRef]
  14. Yakoh, A.; Pimpitak, U.; Rengpipat, S.; Hirankarn, N.; Chailapakul, O.; Chaiyo, S. Paper-based electrochemical biosensor for diagnosing COVID-19: Detection of SARS-CoV-2 antibodies and antigen. Biosens. Bioeletronics 2021, 171, 112912. [Google Scholar] [CrossRef] [PubMed]
  15. Morales-Narváez, E.; Dincer, C. The impact of biosensing in a pandemic outbreak: COVID-19. Biosens. Bioelétron. 2020, 163, 112274. [Google Scholar] [CrossRef] [PubMed]
  16. Hashemi, S.A.; Behbahan, N.G.G.; Bahrani, S.; Mousavi, S.M.; Gholami, A.; Ramakrishna, S.; Firoozsani, M.; Moghadami, M.; Lankarani, K.B.; Omidifar, N. Ultra-sensitive viral glycoprotein detection NanoSystem toward accurate tracing SARS-CoV-2 in biological/non-biological media. Biosens. Bioelectron. 2021, 171, 112731. [Google Scholar] [CrossRef] [PubMed]
  17. Suleman, S.; Shukla, S.K.; Malhotra, N.; Bukkitgar, S.D.; Shetti, N.P.; Pilloton, R.; Narang, J.; Tan, Y.N.; Aminabhavi, T.M. Point of care detection of COVID-19: Advancement in biosensing and diagnostic methods. Chem. Eng. J. 2021, 414, 128759. [Google Scholar] [CrossRef]
  18. Sharma, A.; Mishra, R.P.; Goud, K.Y.; Mohamed, M.A.; Kummari, S.; Tiwari, S.; Li, Z.; Naravan, R.; Stanciu, L.A.; Marty, J.L. Optical Biosensors for Diagnostics of Infectious Viral Disease: A Recent Update. Diagnostics 2021, 11, 2083. [Google Scholar] [CrossRef]
  19. Zavyalova, E.; Ambartsumyan, O.; Zhdanov, G.; Gribanyov, D.; Gushchin, V.; Tkachuk, A.; Rudakova, E.; Nikiforova, M.; Kuznetsova, N.; Popova, L.; et al. SERS-Based Aptasensor for Rapid Quantitative Detection of SARS-CoV-2. Nanomaterials 2021, 11, 1394. [Google Scholar] [CrossRef]
  20. Tyagi, D.; Wang, H.; Huang, W.; HU, L.; Tang, Y.; Guo, Z.; Ouyang, Z.; Zhang, H. Recent Advances in Two-Dimensional Materials based Sensing Technology towards Health and Environmental Applications. Nanoescale 2020, 12, 3535–3559. [Google Scholar] [CrossRef]
  21. Krishinan, S.K.; Singh, E.; Singuh, P.; Meyyappan, M.; Nalwa, H.S. A review on graphene-based nanocomposites for electrochemical and fluorescent biosensors. RSC Adv. 2019, 9, 8778–8881. [Google Scholar] [CrossRef]
  22. Sainz-Urruela, C.; Vera-López, S.; San Andrés, M.P.; Díez-Pascual, A.M. Graphene-Based Sensors for the Detection of Bioactive Compounds: A Review. Int. J. Mol. Sci. 2021, 22, 3316. [Google Scholar] [CrossRef]
  23. Lin, J.; Peng, Z.; Liu, Y.; Ruiz-Zepeda, F.Y.E.R.; Samuel, E.L.G.; Yacaman, M.J.; Yakobson, B.I.; Tour, J.M. Laser-induced porous graphene films from commercial polymers. Nat Commun. 2014, 5, 5714. [Google Scholar] [CrossRef]
  24. Huang, L.; Su, J.; Song, Y.; Ye, R. Laser-Induced Graphene: En Route to Smart Sensing. Nano-Micro Lett. 2020, 12, 157. [Google Scholar] [CrossRef] [PubMed]
  25. Hawes, G.F.; Ylman, D.; Noremberg, B.S.; Pope, M.A. Supercapacitors Fabricated via Laser-Induced Carbonization of Biomass-Derived Poly (furfuryl alcohol)/Graphene Oxide Composites. ACS Appl. Nano Mater. 2019, 2, 6312–6324. [Google Scholar] [CrossRef]
  26. Segura, B.; Jimenez, F.N.; Giraldo, L.R. Prototipo de potenciostato con aplicaciones en procesos electroquímicos. Entre Cienc. E Ing. 2016, 10, 61–69. [Google Scholar]
  27. Lathi, B.P. Signals and Linear Systems, 2rd ed.; Bookman: Taibei, Taiwan, 2007. [Google Scholar]
  28. Song, W.; Zhu, J.; Gan, B.; Zhao, S.; Wang, H.; Li, C.; Wang, J. Flexible, Stretchable, and Transparent Planar Microsupercapacitors Based on 3D Porous Laser-Induced Graphene. Small 2017, 14, 1702249. [Google Scholar] [CrossRef]
  29. Wang, W.; Lu, L.; Xie, Y.; Mei, X.; Tang, Y.; Wu, W.; Liang, R. Tailoring the surface morphology and nanoparticle distribution of laser-induced graphene/CO3O4 for high-performance flexible microsupercapacitors. Appl. Surf. Sci. 2020, 504, 144487. [Google Scholar] [CrossRef]
  30. Chyan, Y.; Ye, R.; Li, Y.; Singh, S.P.; Arnusch, C.J.; Tour, J.M. Laser-Induced Graphene by Multiple Lasing: Toward Electronics on Cloth, Paper, and Food. CS Nano 2018, 12, 2176–2183. [Google Scholar] [CrossRef]
  31. Tesing, A.; Loguercio, L.F.; Noremberg, B.S.; Alano, J.H.; Silva, R.M.; Orlandi, M.O.; Marin, G.; Santos, J.F.L.; Carreño, N.L.V. Tunable graphene oxide inter-sheet distance to obtain graphene oxide–silver nanoparticle hybrids. New J. Chem. 2019, 43, 1285–1290. [Google Scholar] [CrossRef]
  32. Dosi, M.; Lau, I.; Zhuang, Y.; Simakov, D.S.A.; Fowler, M.W.; Pope, M.A. Ultrasensitive Electrochemical Methane Sensors Based on Solid Polymer Electrolyte-Infused Laser-Induced Graphene. ACS Appl. Mater. Interfaces 2019, 11, 6166–6173. [Google Scholar] [CrossRef]
  33. Yang, Y.; Song, Y.; Bo, X.; Min, J.; Pak, O.S.; Zhu, L.; Wang, M.; Tu, J.; Kogan, A.; Zhang, H.; et al. A laser-engraved wearable sensor for sensitive detection of uric acid and tyrosine in sweat. Nat. Biotechnol. 2020, 38, 217–224. [Google Scholar] [CrossRef] [PubMed] [Green Version]
  34. Torrent-Rodrigres, R.; Lukas, H.; Tu, J.; Min, J.; Yang, Y.; Xu, C.; Rossiter, H.R.; Gao, W. SARS-CoV-2 RapidPlex: A Graphene-Based Multiplexed Telemedicine Platform for Rapid and Low-Cost COVID-19 Diagnosis and Monitoring. Matter 2020, 3, 1981–1998. [Google Scholar] [CrossRef]
  35. Hermanson, G. Bioconjugate Techniques, 3rd ed.; Academic Press: Cambridge, MA, USA, 2013; pp. 259–273. [Google Scholar]
  36. Liu, E.Y.; Jung, S.; Weitz, D.A.; Yi, H.; Choi, C.-H. High-throughput double emulsion-based microfluidic production of hydrogel microspheres with tunable chemical functionalities toward biomolecular conjugation. Lab Chip 2018, 18, 323–334. [Google Scholar] [CrossRef] [PubMed]
  37. Faria, A.M.; Mazon, T. Early diagnosis of Zika infection using a ZnO nanostructures-based rapid electrochemical biosensor. Talanta 2019, 203, 153–160. [Google Scholar] [CrossRef] [PubMed]
  38. Martínez-Fleta, P.; Alfranca, A.; González-Álvaro, I.; Casasnovas, J.M.; Fernández-Soto, D.; Esteso, G.; Cáceres-Martell, Y.; Gardeta, S.; López-Sanz, C.; Prat, S.; et al. SARS-CoV-2 cysteine-like protease (Mpro) is immunogenic and can be detected in serum and saliva of COVID-19-seropositive individuals. J. Immunol. 2020, 205, 3130–3140. [Google Scholar] [CrossRef] [PubMed]
  39. Castro, A.C.H.; Alvesa, L.M.; Siquierolia, A.C.S.; Madurrob, J.M.; Brito-Madurroa, A.G. Label-free electrochemical immunosensor for detection of oncomarker CA125 in serum. Microchem. J. 2020, 155, 104746. [Google Scholar] [CrossRef]
  40. Layqah, L.A.; Eissa, S. An electrochemical immunosensor for the corona virus associated with the Middle East respiratory syndrome using an array of gold nanoparticle-modified carbon electrodes. Mikrochim. Acta 2019, 186, 224. [Google Scholar] [CrossRef] [Green Version]
  41. Beduk, T.; Beduk, B.; Filho, J.I.O.; Zihnioglu, F.; Cicek, C.; Sertoz, R.; Arda, B.; Goksel, T.; Turhan, K.; Salama, K.N.; et al. Rapid Point-of-Care COVID-19 Diagnosis with a Gold-Nanoarchitecture-Assisted Laser-Scribed Graphene Biosensor. Anal. Chem. 2021, 93, 8585–8594. [Google Scholar] [CrossRef]
  42. Salman, N.; Khan, M.W.; Lim, M.; Khan, A.; Kemp, A.H.; Noakes, C.J. Use of Multiple LowCost Carbon Dioxide Sensors to Measure Exhaled Breath Distribution with Face Mask Type and Wearing Behaviour. Sensors 2021, 21, 6204. [Google Scholar] [CrossRef]
Figure 1. Illustration of the LIG-based electrode fabrication using the direct laser writing process on PI sheets.
Surfaces 05 00012 g001
Figure 2. Block diagram of the proposed portable potentiostat developed to electrochemically characterize the biosensors in the presence and absence of SARS-CoV-2 biomarker antibodies.
Surfaces 05 00012 g002
Figure 3. Image of our developed portable potentiostat. (A) Bottom view of the biosensor connected to the portable potentiostat, (B) Portable potentiostat pre-filter anti-aliasing; (C) Microcontrolled Platform; (D) Anti-aliasing filter.
Surfaces 05 00012 g003
Figure 4. (a) Raman spectra and (b) FESEM of the surface microstructure of LIG produced from DLW process on PI sheets.
Surfaces 05 00012 g004
Figure 5. Differential pulse voltammograms in the presence of a K4[Fe (CN)6] redox pair evaluating the electrode functionalization steps.
Surfaces 05 00012 g005
Figure 6. DPV measurements in potassium ferricyanide probe (K3[Fe (CN)6]). (a) Tests in reactive and non-reactive clinical samples containing 10 µL of a 200 µg·mL−1 of antigen solution. (b) DPV measurements of immunosensors containing 10 µL of 100, 200 and 400 µg·mL−1 of antigen solution, where R represents reactive clinical samples and NR represents non-reactive clinical samples.
Surfaces 05 00012 g006
Figure 7. Analyses of reactive and non-reactive human blood serum sample for SARS-CoV-2 using the biosensor (a) immunosensor differential pulse voltammogram, in the potential range −0.2 and 0.3 V, with scan rate of 6 mV·s−1 to 0.19 V, for reactive and non-reactive clinical samples. (b) Triplicate analyses of clinical samples where the peak current was analyzed (Table 1). (c) Final mean analyzes of clinical samples in which the peak current d was analyzed (Table 1).
Surfaces 05 00012 g007
Figure 8. Cyclic voltammetry measurements of immunosensors for reactive and non-reactive clinical samples performed in the portable potentiostat. (a) Oxidation current values for R and NR samples and (b) final mean analyses of clinical specimens.
Surfaces 05 00012 g008
Table 1. Summary of all relevant data from reactive and non-reactive clinical samples of human blood serum for COVID-19 according to ELISA tests, qRT-PCR and our electrochemical biosensor.
Sample CodeConditionELISA-LIA Diagnosis (DO ¹/Results)qRT-PCR
Diagnosis
IP 2 (mA)
IgGIgMIgA
NR302pre-pandemic>0.3 (NR)>0.2 (NR)>0.2 (NR) 8.3390
NR303pre-pandemic>0.7 (NR)>0.5 (NR)>0.2 (NR)-7.6060
NR324pre-pandemic>0.2 (NR)>0.2 (NR)<0.1 (NR)-9.0160
NR 327pre-pandemic>1.0 (FP)<0.5 (NR)>1.0 (FP)-8.4171
NR 328pre-pandemic>2.0 (FP)<0.5 (NR)<0.1 (NR)-8.5651
NR 336pre-pandemic>1.0 (FP)<0.5 (NR)<0.1 (NR)-7.3086
NR 394pre-pandemic<0.1 (NR)<0.5 (NR)<0.1 (NR)-7.2891
R 106->2.4 (R)--positive9.4739
R 109->2.8 (R)--positive9.8447
R907B->2.9 (R)1.9 (R)>3.5 (R)Positive10.0650
R908B->2.0 (R)1.8 (R)>2.9 (R)Positive10.0300
R909->2.9 (R)>0.6 (FP)>1.4 (R)Positive9.2733
R 911->3.5 (R)>3.0 (R)>3.5 (R)positive9.8346
R 123->3.1 (R)--positive9.6368
R1039->3.5 (R)>1.7 (R)>2.9 (R)positive9.3750
FP: False positive; NR: non-reactive; R: reactive; 1 Optical density; 2 Peak current.
Publisher’s Note: MDPI stays neutral with regard to jurisdictional claims in published maps and institutional affiliations.

