1. Introduction
The sound that is produced in one room can propagate to adjacent rooms by several paths. The first common path is through the separating wall itself, but sound can take several indirect paths. For instance, sound can travel via slits or small holes in walls that occur during the construction phase, which has a considerable effect on the sound reduction of the separating wall [
1]. Other more complex paths are flanking paths which arise when different elements are connected such as the walls and the floor [
2]. However, the indirect construction paths are not considered in this article.
Another complexed path is via the ventilation duct when, for example, the duct goes from one room to another through a separating wall [
2,
3]. With this configuration, sound can propagate via the material of the ventilation duct and via the air inside. For pipes and smaller ventilation ducts, it is often sufficient to apply a sealant as a treatment between the tube and the wall for the pipe (or duct) to not affect the sound reduction of the separated wall [
4]. For bigger dimensions which mostly concern ventilation ducts, there is no easy solution to calculate the proper treatment. Larger ventilation ducts are mostly used in offices, schools and hospitals whereas smaller ducts are used in dwellings. There are some theories to calculate how much the ventilation duct will affect the sound reduction of the separated wall, which depends on if the sound breaks in or out from the duct [
5].
The purpose of this article is to model the sound reduction of a combined system with a separating wall and a ventilation duct through it. This study mainly covers how the surface area of ducts affects the sound reduction and not how the sound is spread via air diffusers. It is to some extent a summary of a master thesis [
6] (in Swedish) by the first author (a deeper understanding of the derivation and measurement setup can be seen in Ref. [
6]). This article investigates further the important modified or developed theories that can be used in practice with new modifications.
Alan Cummings, partly together with Jeremy Astley, has approached the problem regarding the sound transmission of ventilation ducts in many publications with a focus on rectangular ducts and specifically on how the low-frequency area is affected [
7,
8,
9,
10,
11,
12,
13,
14]. Cummings has also investigated circular and flat-oval ducts, but not to the same extent, together with Chang [
15,
16,
17,
18]. In one of Cummings’ latest articles [
19], the most popular equation to predict transmission loss (TL) is described when sound breaks into a ventilation duct, TL-breakin. A theory to predict TL-breakout (transmission loss when sound breaks out from a ventilation duct) is also presented for rectangular ducts according to Ref. [
8]. Cummings also describes how to predict TL-breakout for circular ducts in [
15,
16] together with Chang, in which the theory is very comprehensive and not investigated further. Istvan L. Ver has developed simple equations based on Ref. [
8] to calculate TL-breakout for rectangular ducts. Ver [
5] has also developed methods to calculate TL-breakin based on the principle of reciprocity and presents equations that describe breakout for a system for both rectangular and circular shapes. Furthermore, Ver presents a prediction scheme for TL-breakout for circular ducts based on Heck and Mueller [
20]. Douglas D. Reynold [
21] describes similar equations as Ver and Cummings for rectangular ducts with a few tweaks and a different shifting factor. Reynold presents different equations to describe TL-breakout for circular ducts. The last-mentioned theory is by Marshall Long [
22] that uses theories from Ver and Reynold with an equation to translate sound pressure to power in the source room. Other studies and articles have also investigated TL-breakout [
23,
24] but not with the same purpose as this study.
The presented theories above complement each other to model and calculate the sound reduction of a ventilation duct between different rooms by describing the different parameters. However, none of the mentioned theories compile the detailed model and validate it to measurement data. A simplified model is described by the authors of Ref. [
3] but it lacks some important parameters that the authors of refs. [
5,
21,
22] highlight. Another study presents a SEA model to determine the noise reduction of a duct between two rooms which is not investigated in this article [
25].
A short theoretical description is presented to describe the acoustic properties of ducts which depends on if the sound breaks in or out from the duct [
5]. The measurement setup is presented thereafter, followed by measurement results compared to existing, proposed and adapting theories. Treatments are also presented to prevent the ventilation ducts from affecting the sound reduction of the combined system.
2. Theory
The sound waves emitted from a sound source in a room with ventilation can propagate via the material of the duct to other connected rooms. The air inside the ventilation duct is also affected, which drives noise transferring to adjacent rooms. A simplified model is described in Ref. [
3], while this article presents models based on the theory in refs. [
5,
21,
22].
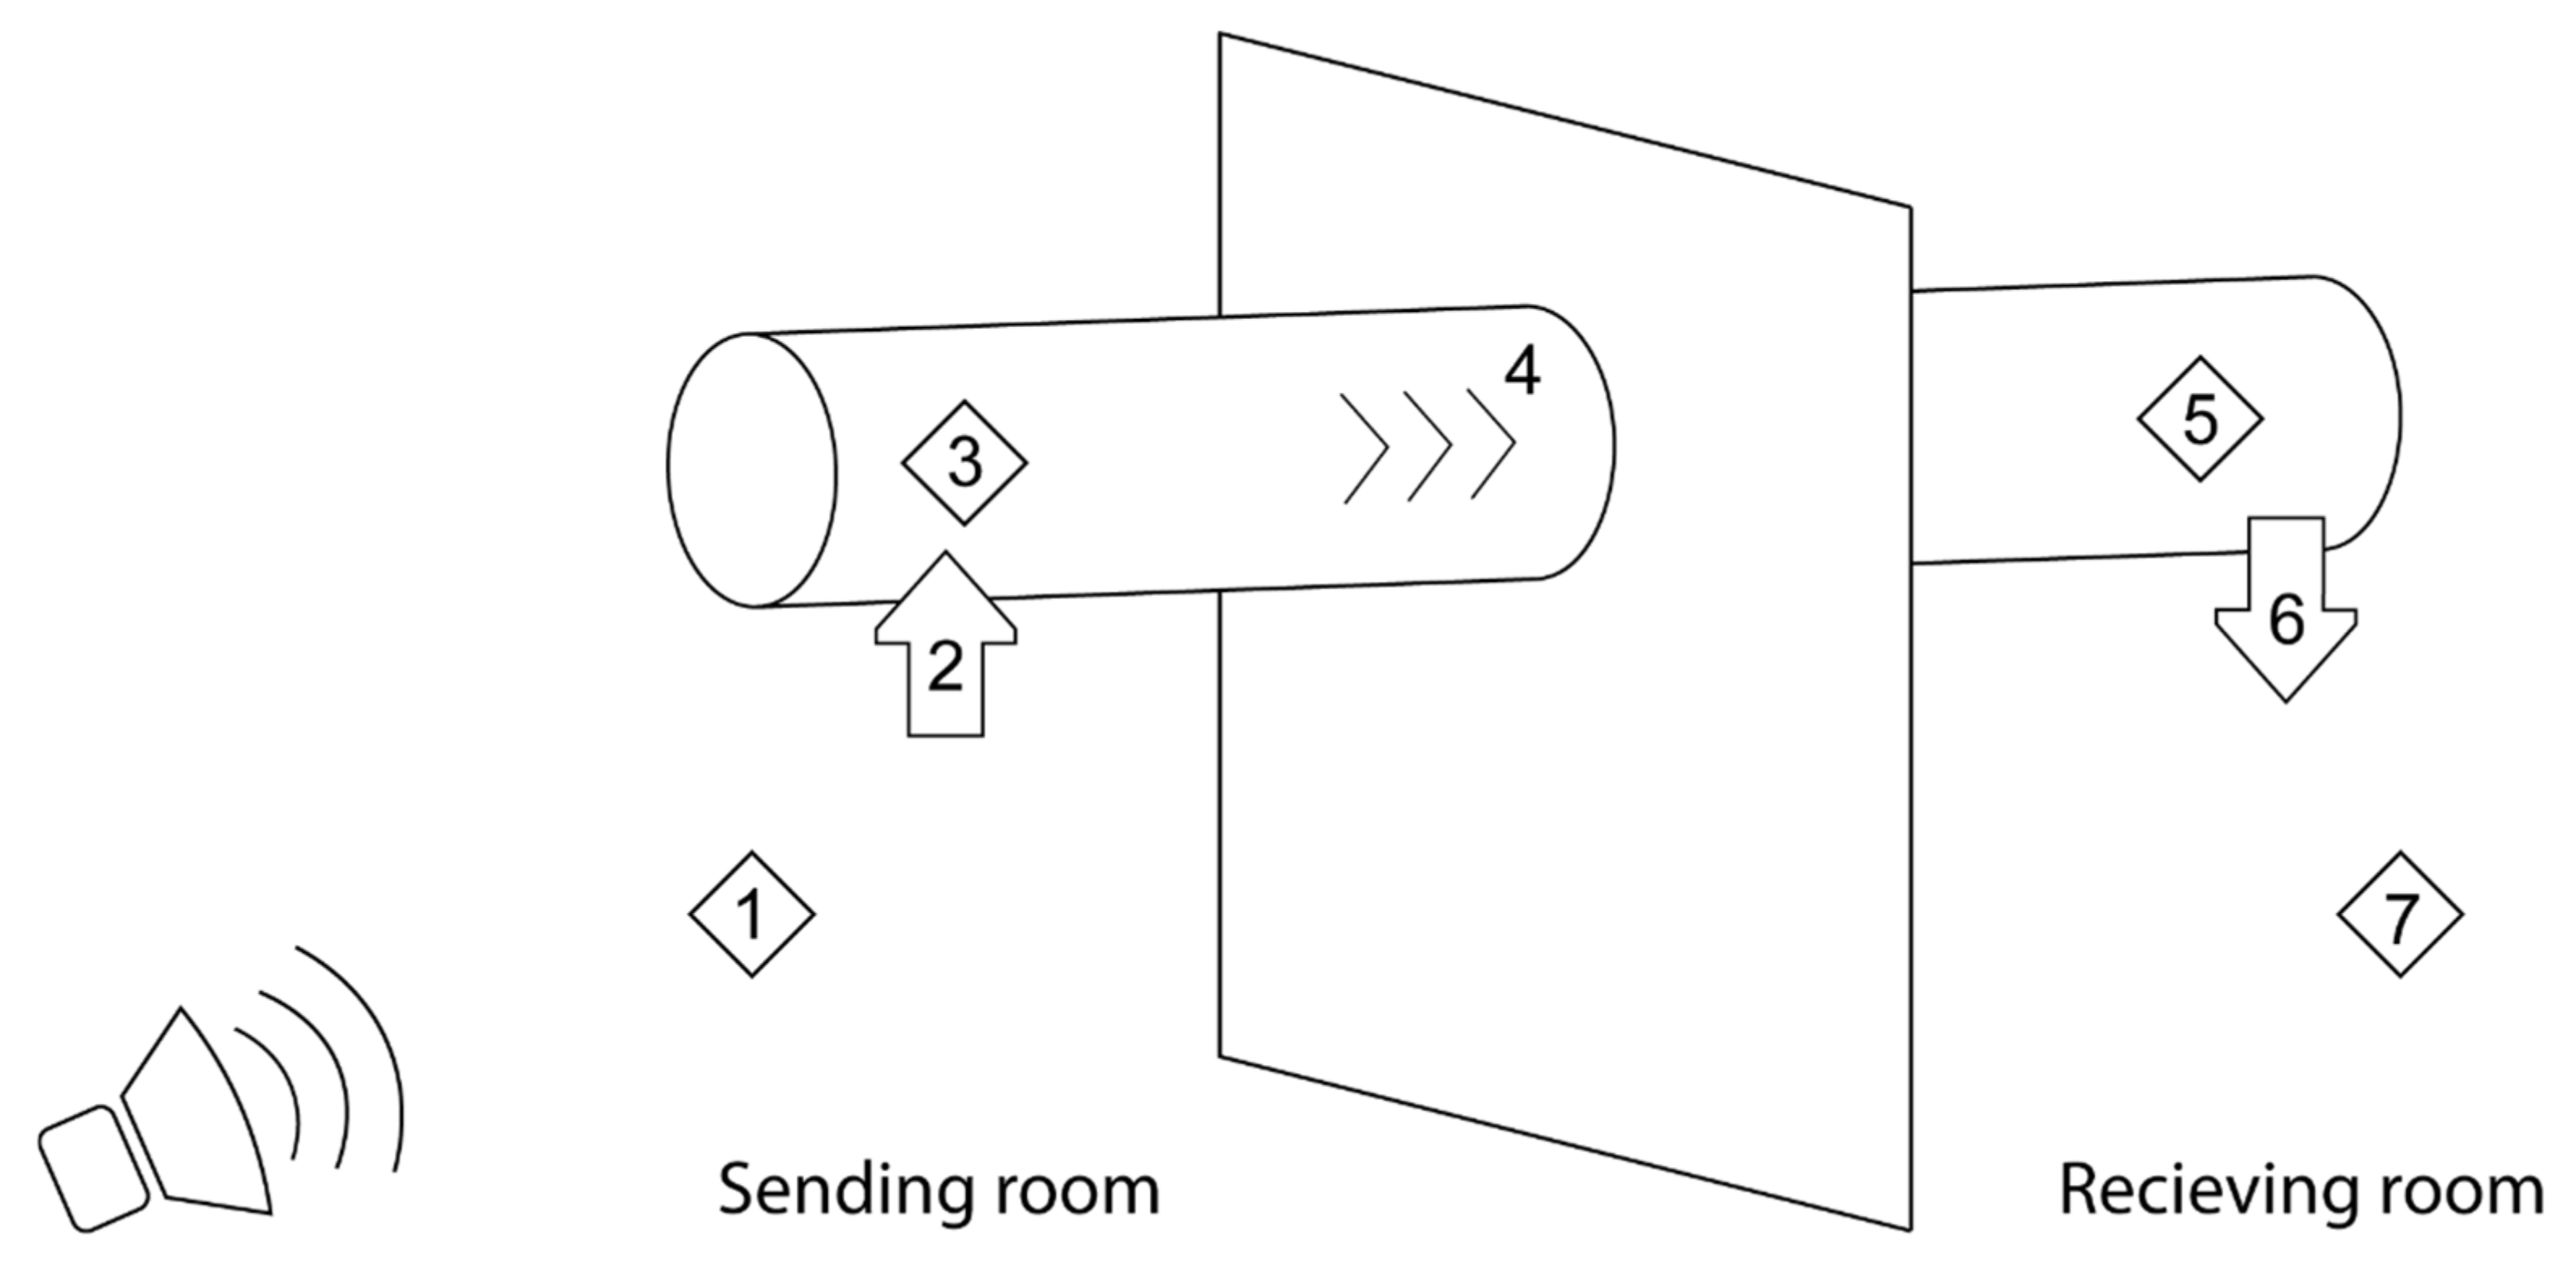
Sound propagating from a source in a room with a ventilation duct transmits into the duct, which is described as a breakin for a system. It is a relationship between the sound power in the source room (
Figure 1, element 1), the transmission loss when sound breaks into the ventilation duct (element 2, TL-breakin) and the sound power in the duct (element 3) [
21]. The opposite effect is described as a breakout for a system; the sound that propagates inside a ventilation duct transmits out to the surrounding environment. The term can be described as a relationship between the sound power inside the duct (element 5), the transmission loss when sound breaks out to the surrounding room (element 6, TL-breakout) and the sound power in that room (element 7) [
21]. The transmission loss when sound breaks in and breaks out from the ventilation duct is dependent on several factors including shape, mass and frequency. The sound attenuation inside the duct should be considered when describing a whole system (element 4) since the sound is, to some extent, absorbed inside the ventilation duct (mainly if there is an inner lining) and the air [
22]. Several studies have investigated this phenomenon for lined and unlined ducts [
26,
27,
28,
29,
30,
31,
32].
In practice, it is easier to use the sound pressure level instead of the generic sound power (elements 1 and 7) when describing a system. Previous studies [
5,
21,
22] describe equations to translate sound power into sound pressure in both the sending,
, and receiving room,
. To compare the existing theories with the proposed model against measurements, the sound pressure level in the receiving room is subtracted from the sound pressure level in the sending room. In addition, the absorption area also needs to be considered in the receiving room. The effects of breakin and breakout for a ventilation duct can now be described as a whole system with the sound reduction index,
, according to Equation (1) from Ref. [
6]:
is the absorption area in the receiving room and
is the surface area of the ventilation duct. The sound pressure in both rooms can be described as the earlier mentioned relationships according to Equations (2) and (3) [
6]:
is the transmission loss when sound is traveling from the sending room into the ventilation duct, earlier described as TL-breakin.
is the transmission loss when sound is traveling from the ventilation duct to the receiving room, earlier described as TL-breakout [
5].
is the transmission loss inside the ventilation duct for the room that the ventilation duct is situated in.
is the cross area and
is the surface area multiplied by a factor that is dependent on the shape of the duct and the theory applied [
5,
21,
22].
is a constant that describes the relationship between the sound source in the receiving room and the room’s properties known as the directivity factor.
equals 1, 2, 4 or 8 depending on if the room is considered a whole, half, quarter or eighth sphere space compared to the source. Then,
is the distance between the source and the receiver,
is the length of the line source (in this case, the ventilation duct) and
is the room constant [
21].
Four different theories are investigated against measurement data for each configuration. Most of the presented theories below cannot alone be used to describe the system in
Figure 1, they need to use some equations from each other. This is described briefly below and in more detail in Ref. [
6].
Cummings’ articles are primarily the foundation for the equations describing TL-breakout of rectangular ducts. For circular ducts, two different equations are used to describe TL-breakout: one from Heckl and Müller [
20] (presented in Ver [
5]) and one from Reynold [
21] (also presented in Long [
22]). Ver is presenting the equation for TL-breakin above the cutoff frequency based on reciprocity, which is used in Ver, Reynold and Long for both shapes. Cumming presents a different equation in reference [
19]. Ver also presents an equation for TL-breakin below the cutoff frequency that is used in the other theories as well [
5]. Ver, Reynold and Long present different equations to describe breakout for a system, the decisive difference is the shifting factor used in Reynold [
21]. The theory in Long [
22] is the only one that presents an equation for translating sound pressure to sound power in the source room which is used in all methods.
Ver’s theory (named Ver (1983)) is missing some equations to describe the model in
Figure 1 and therefore, some equations are used from Reynold [
21], Cummings [
8] and Long [
22]. For Reynold’s theory (named Reynold (1990)), some equations are used from [
5,
8,
22] to make the model in
Figure 1 complete. The theory presented in Long [
22] (named (Long 2006)) can be used directly from the book.
The last presented variant is named Cummings (2001). For the rectangular and circular ducts, TL-breakin is calculated according to Ref. [
19]. The other equations are based on the theory according to Ver [
5] with the earlier described additions.
The sound reduction index in Equation (1) is only for the ventilation duct which must be weighted with the sound reduction index of the wall. The surface area in one room is used for the ventilation duct and the area of the wall is used as the whole area of the wall minus the cross area of the ventilation duct according to Equation (4) from Ref. [
33].
3. Method
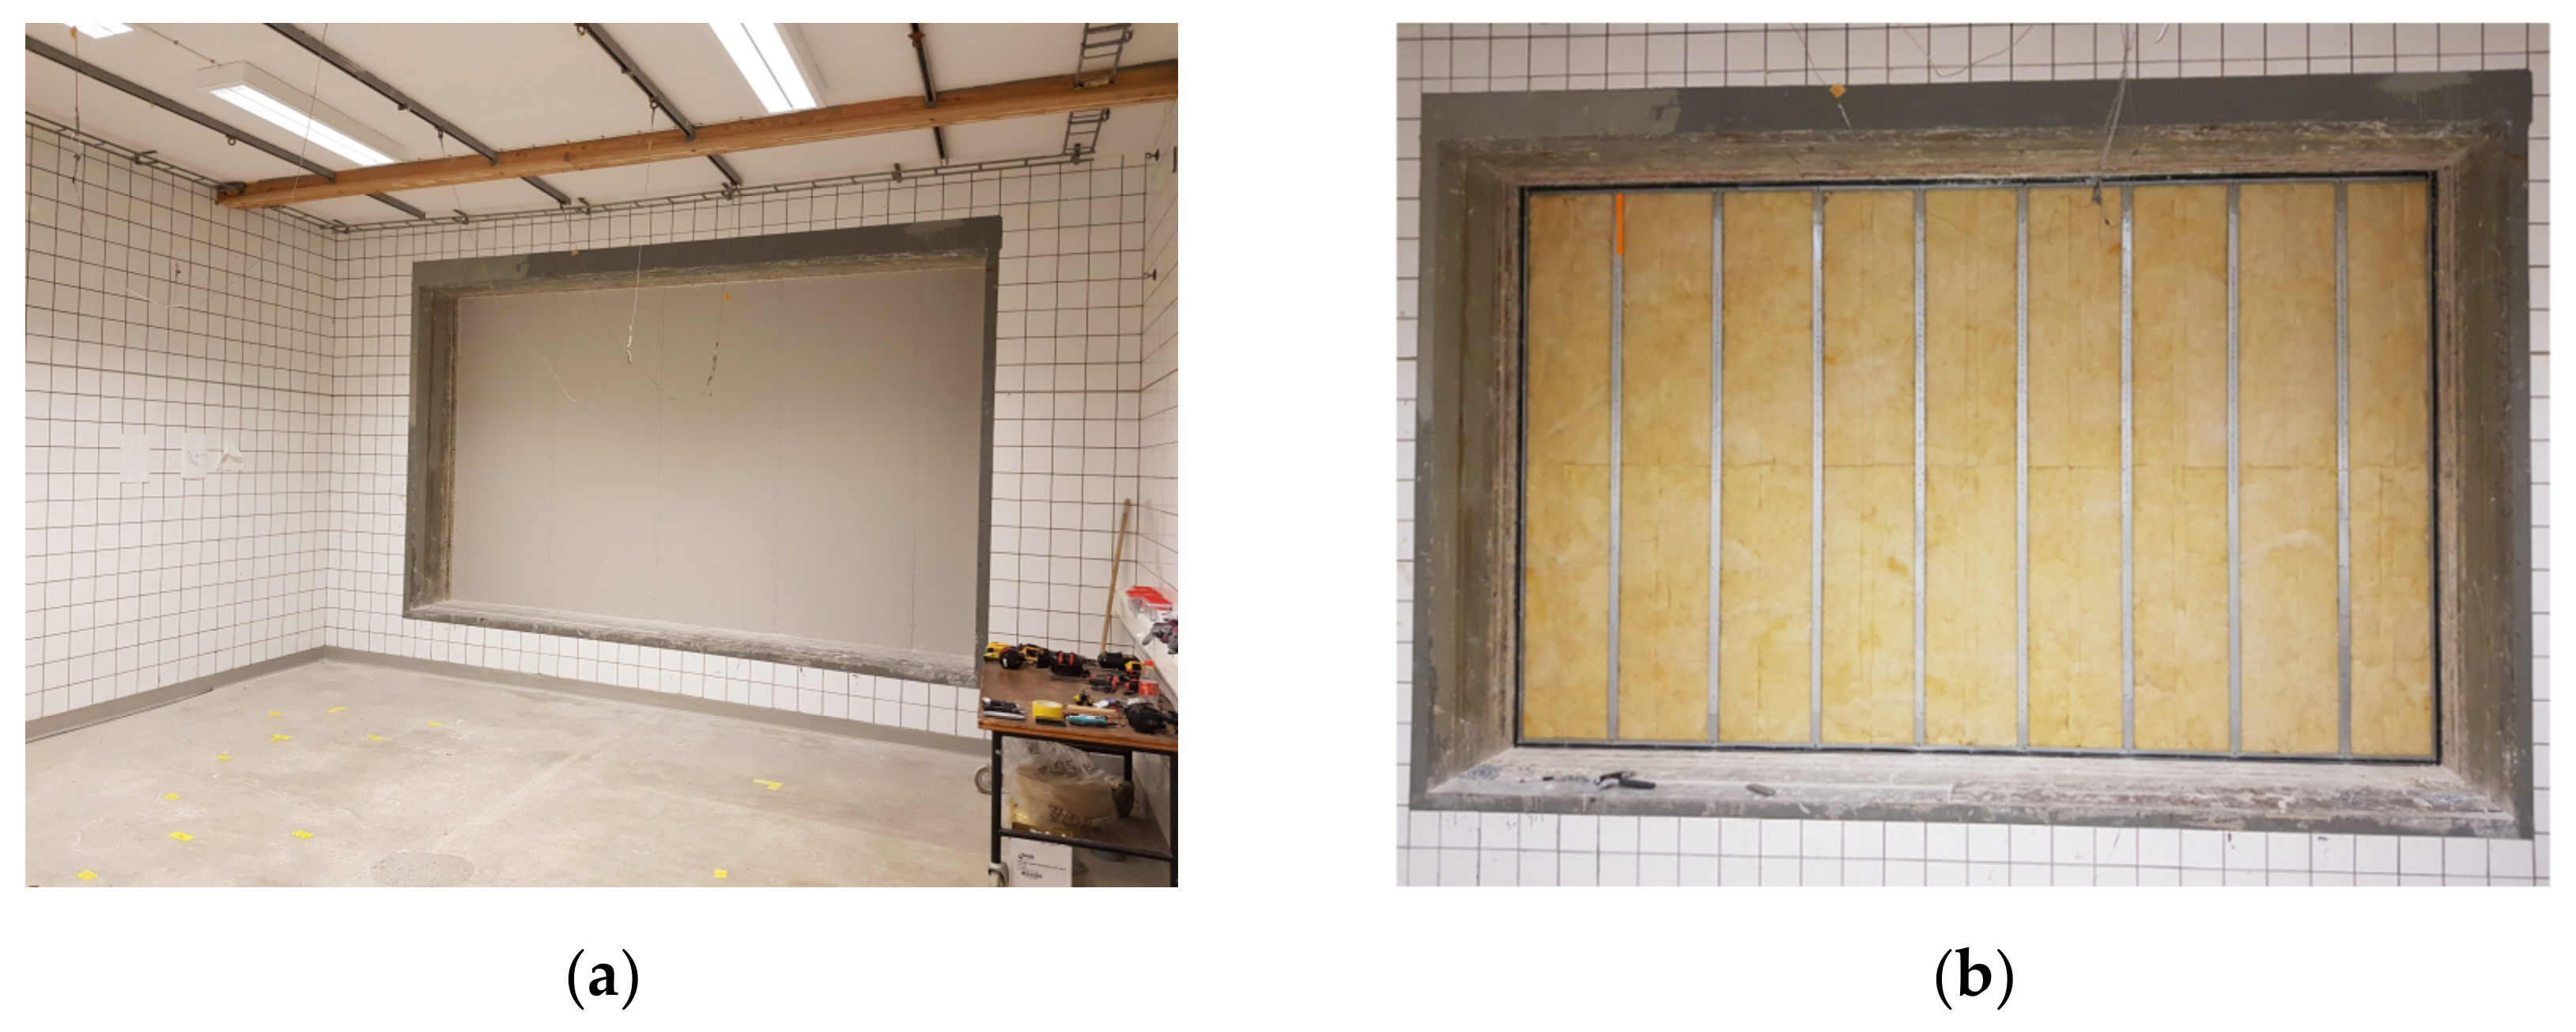
The experimental part was performed in the sound transmission lab at Lund University, LTH, Faculty of Engineering, Division of Acoustics. Two similar rooms were separated by a wall with a section where a 10 m
2 mock-up wall can be constructed (
Figure 2). Three different types of walls were tested during the experiment from Gyproc with the sound reduction indices (in field,
) 35, 44 and 52 dB. Lab measurements yield
of 35, 46 and 54 dB. The setups included the same steel frame, which is named Gyproc XR 95/95 (450 c/c). The differences between the walls were the number of gypsum boards and the presence of insulation in the wall or not. Sealant was applied around the edges on all sides of the test wall structures.
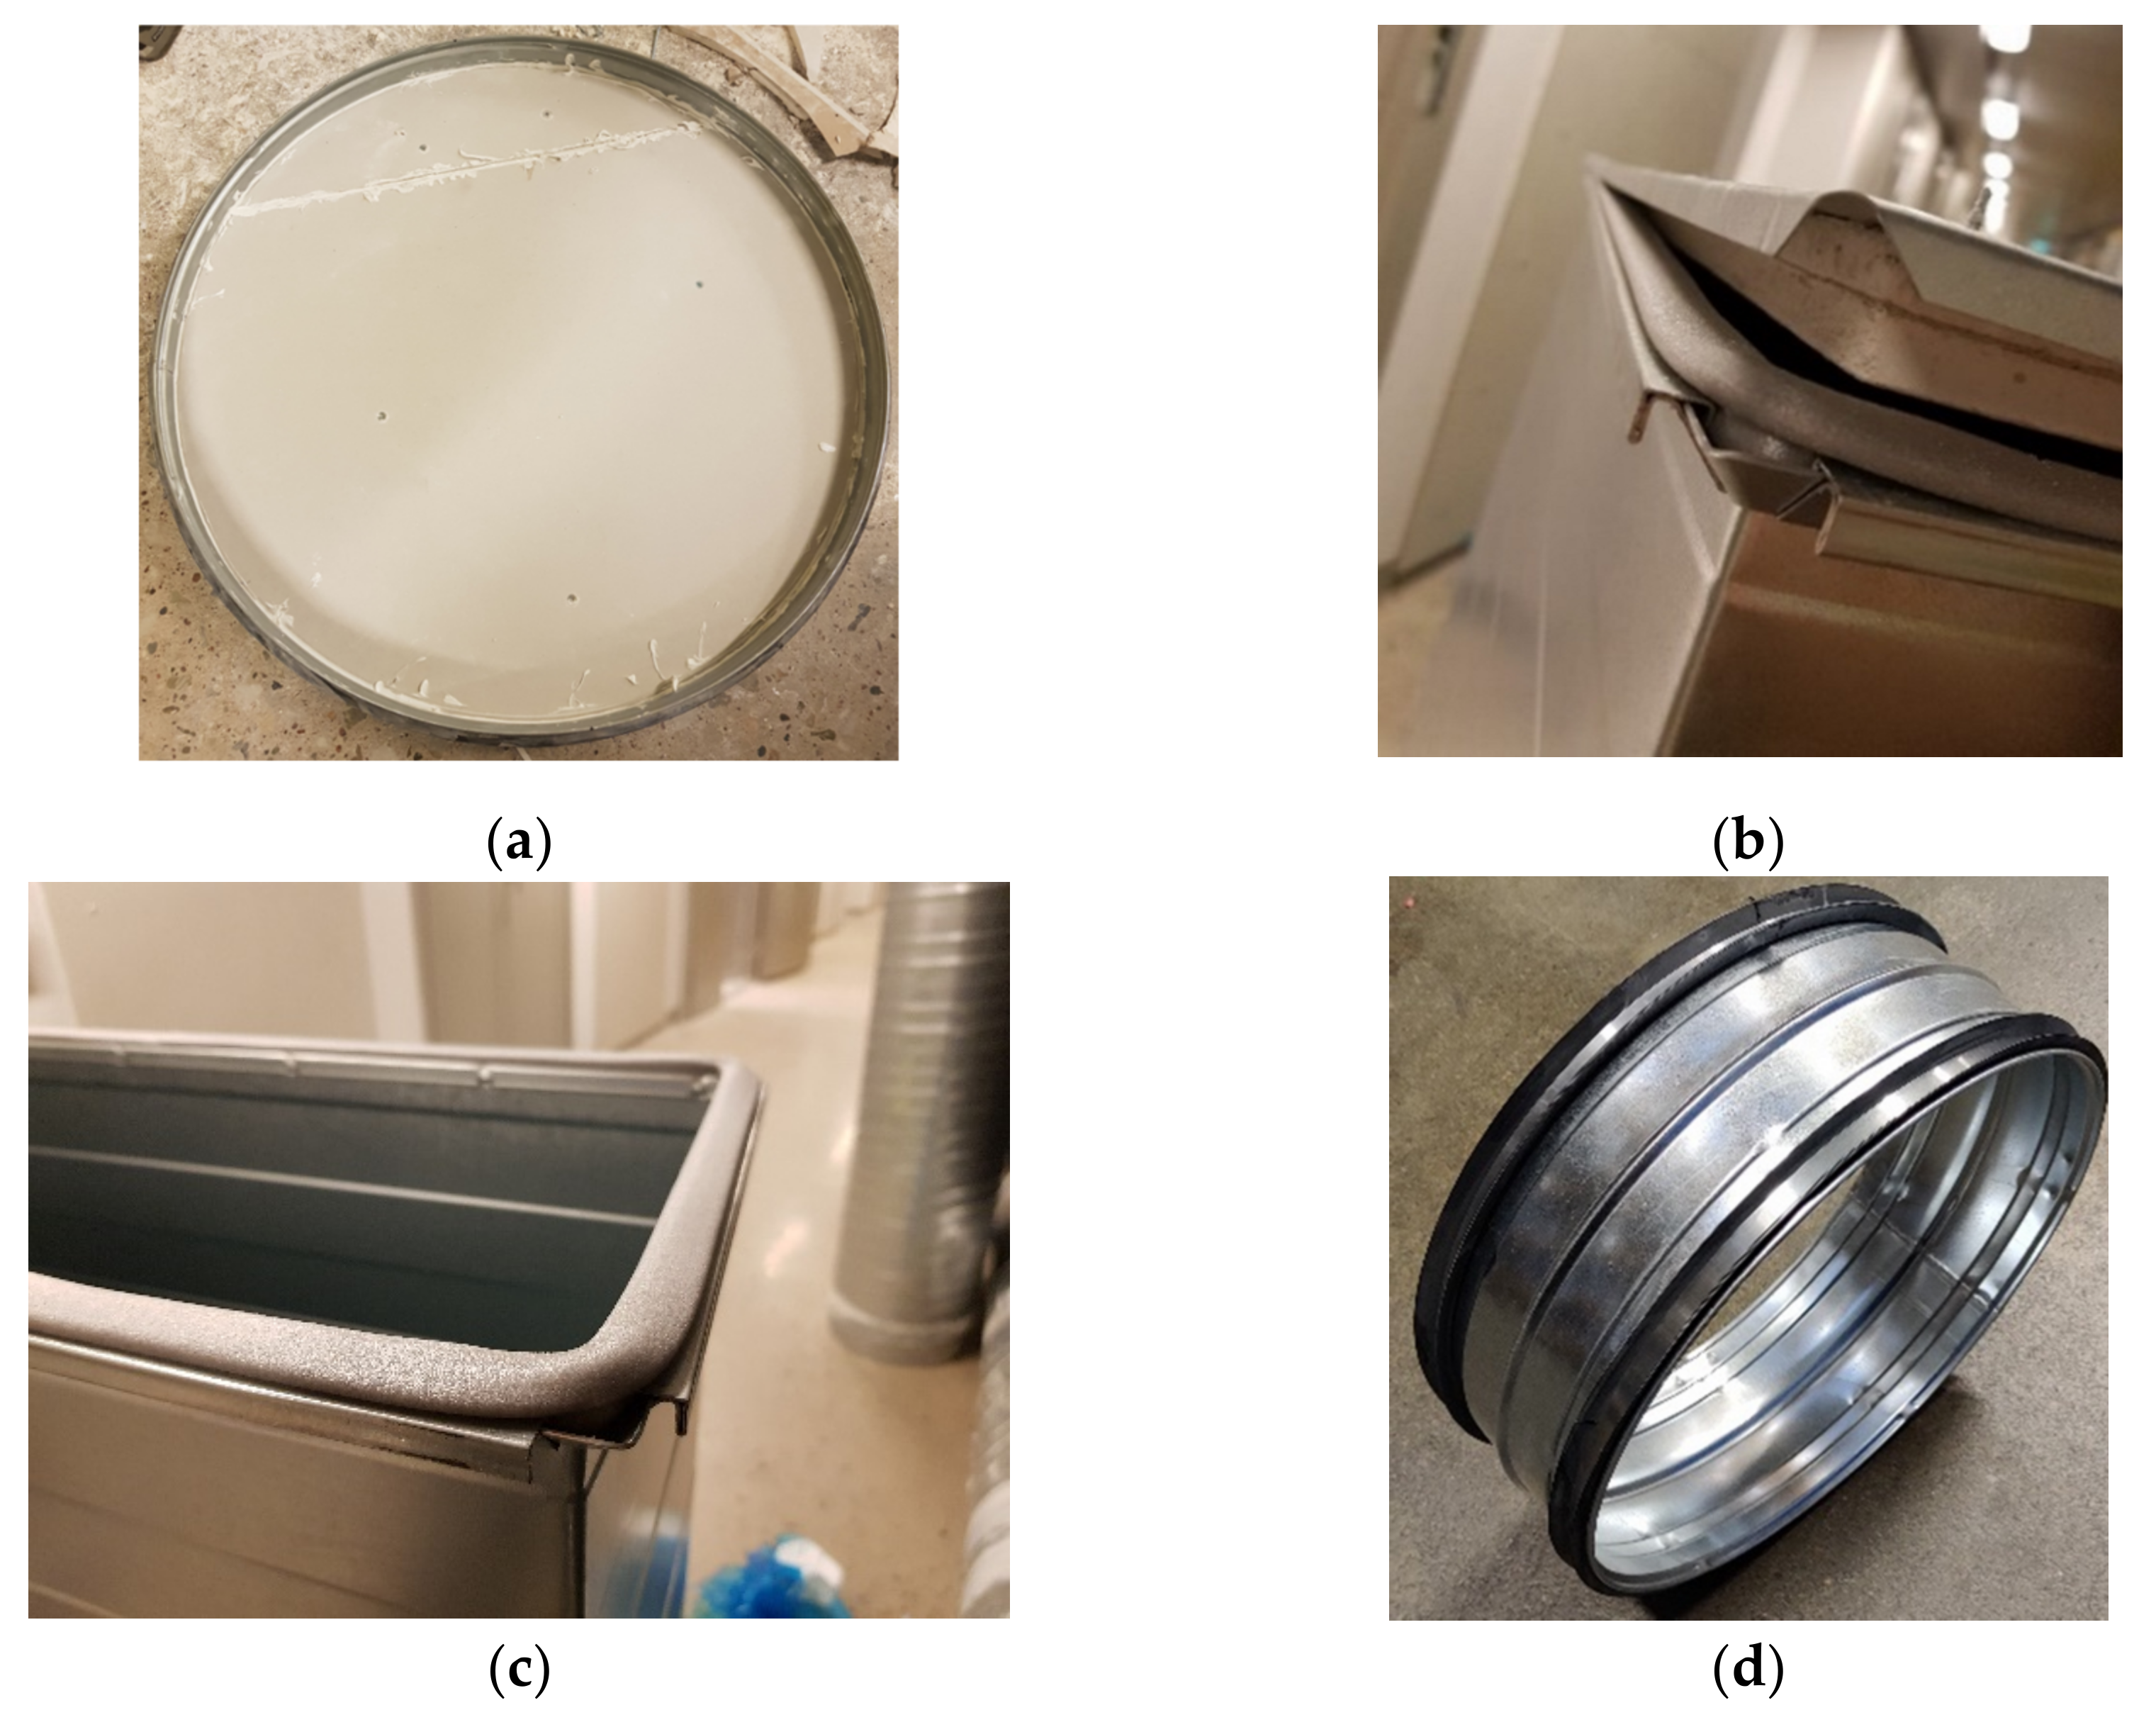
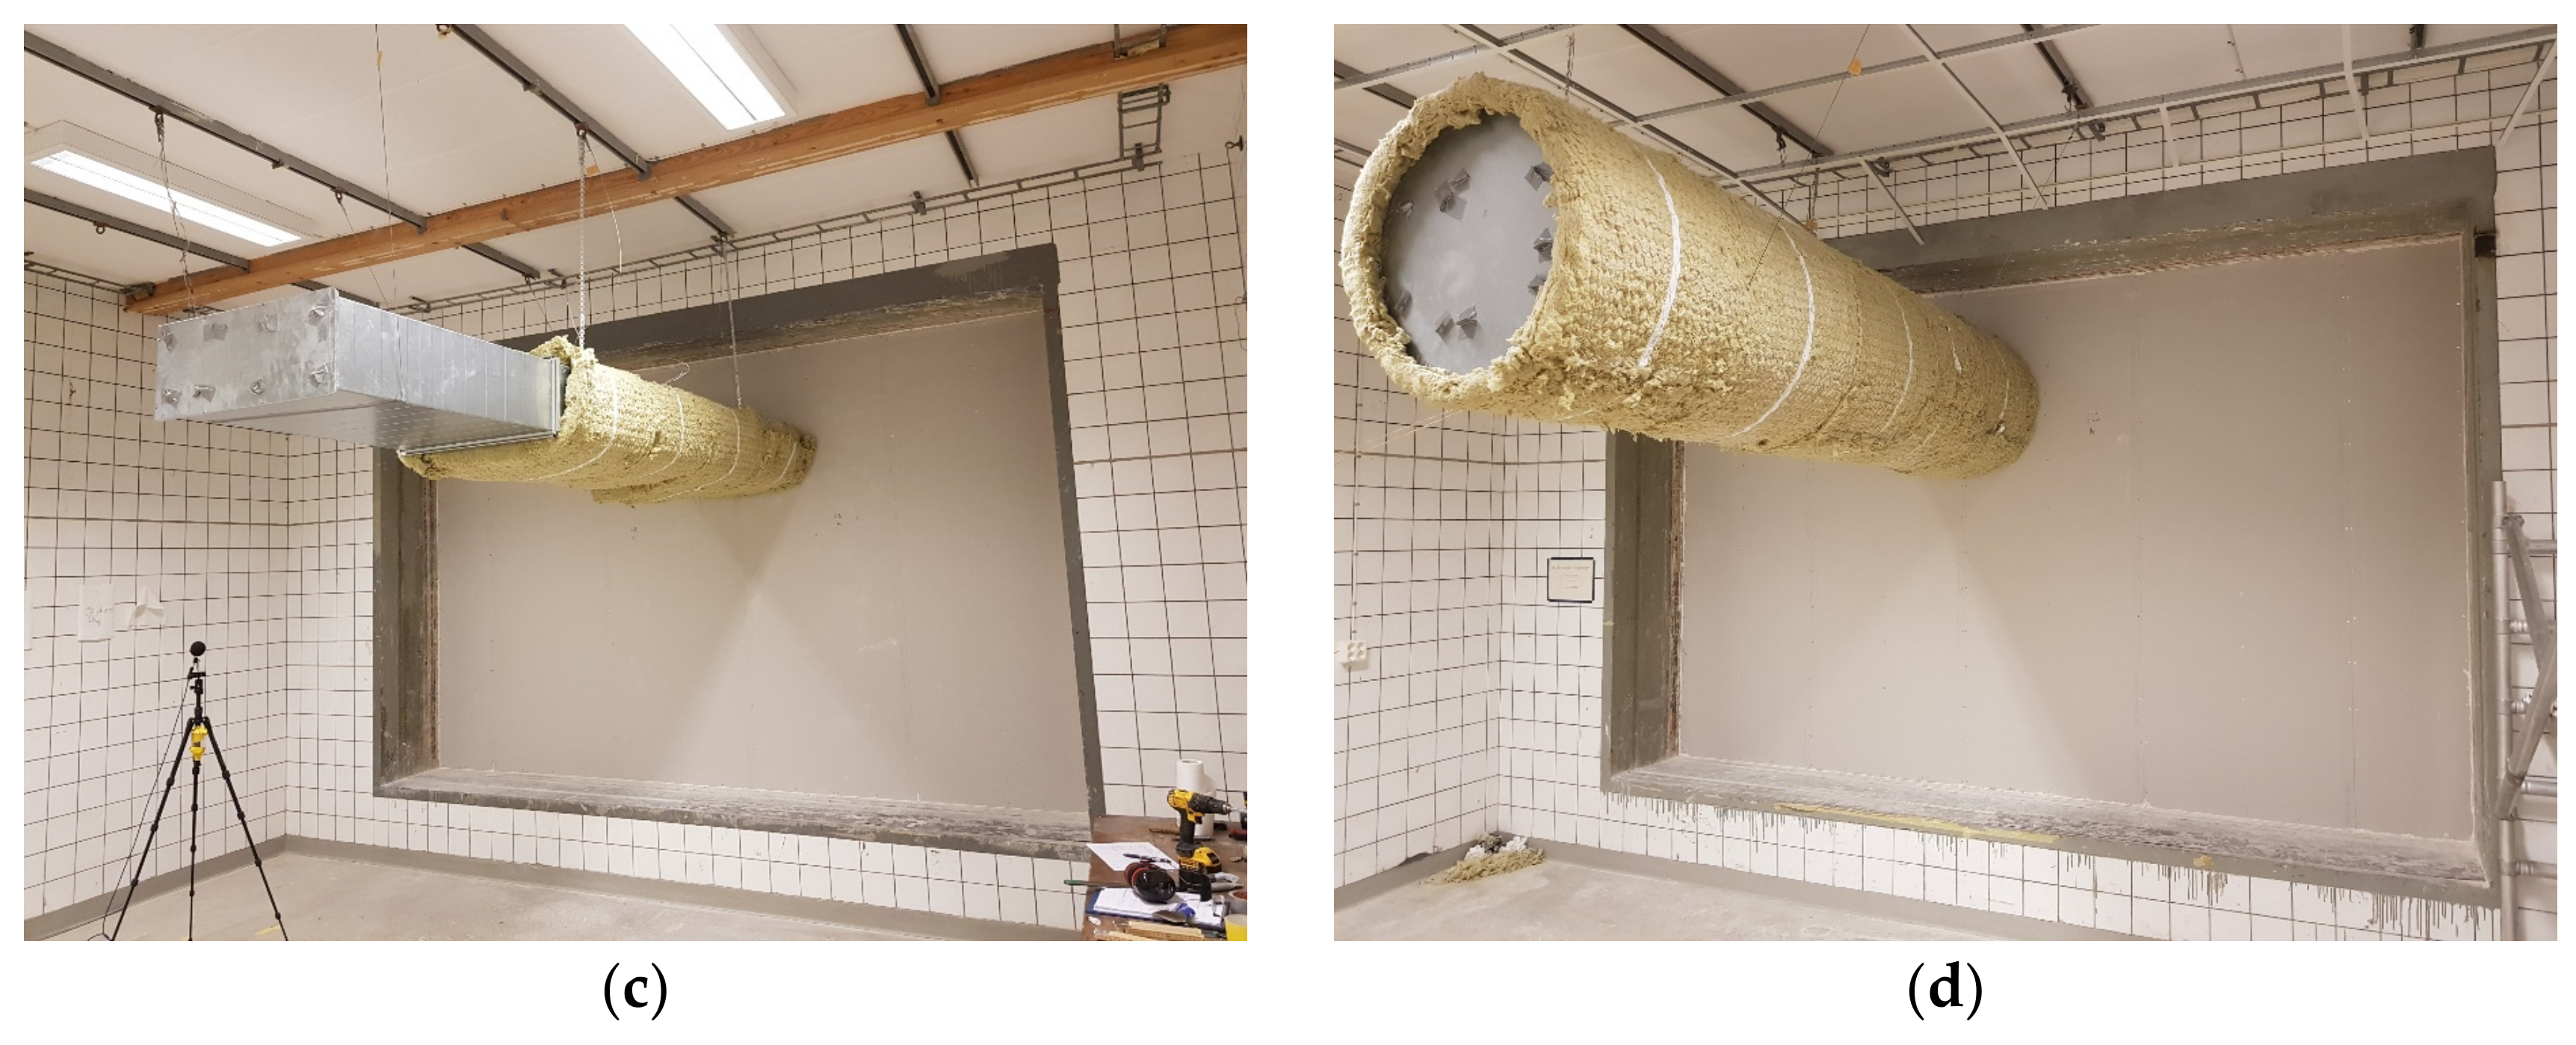
For the ventilation duct setup, two circular dimensions with diameters of 315 and 630 mm were used; they were from the Swedish manufacturer Lindab. In addition, a rectangular duct was tested with the dimension 700 × 250 mm, also from Lindab. The circular duct element components come in lengths of 3 m and the rectangular elements come in lengths of 1 m. To simulate the worst case for the circular duct, the 3-m-long duct was mounted in the wall so that it protruded 1.5 m on each side. Then, one other circular duct element was cut in half and connected on each side to the duct through the wall with a coupling connector with rubber lining from Lindab named NPU [
34] (
Figure 3d) making the whole section 3 m long in each room. With this setup, a homogenous ventilation duct went through the wall instead of mounting a coupling connecter in the middle. This has been previously described as a worse case since the sound can propagate via the material directly to the other room without going through a connector with rubber lining, which acts as a dampener [
6]. For the rectangular duct, five connections were required to obtain the same length where a different coupling connector was used, also with a soft foam lining (
Figure 3c). The circular ducts were instead using two connections each (
Figure 3d). To only measure the sound transmission between the rooms via the surface area, both ends were plugged with a metal plate with two gypsum boards on the inside of each plate together with sealant around the edges, see
Figure 3a,b. The metal plate also had rubber or foam lining on the outer surface making the connection airtight for both circular and rectangular ducts.
To quantify the impact of the ventilation ducts on the test walls, a measurement was made on the wall with no holes in it, see
Figure 2. This represented a reference value that can be used in Equation (4) to compare the experimental results with the theory. The duct was then mounted through the wall where several treatments were applied on the duct according to the cases below:
No treatment.
Applying sealant between the ventilation duct and the wall.
Case 2 + applying insulation in the wall around the ventilation duct.
Case 2 + wrapping the duct with 50 mm stone wool with a density of 100 kg/m3 from ISOVER.
The same as number 4 above but with 100 mm stone wool instead, same manufacturer and density.
The theory in
Section 5 was developed for case 2 to describe how different ventilation ducts affect the sound reduction of the separating wall without any heavy treatments.
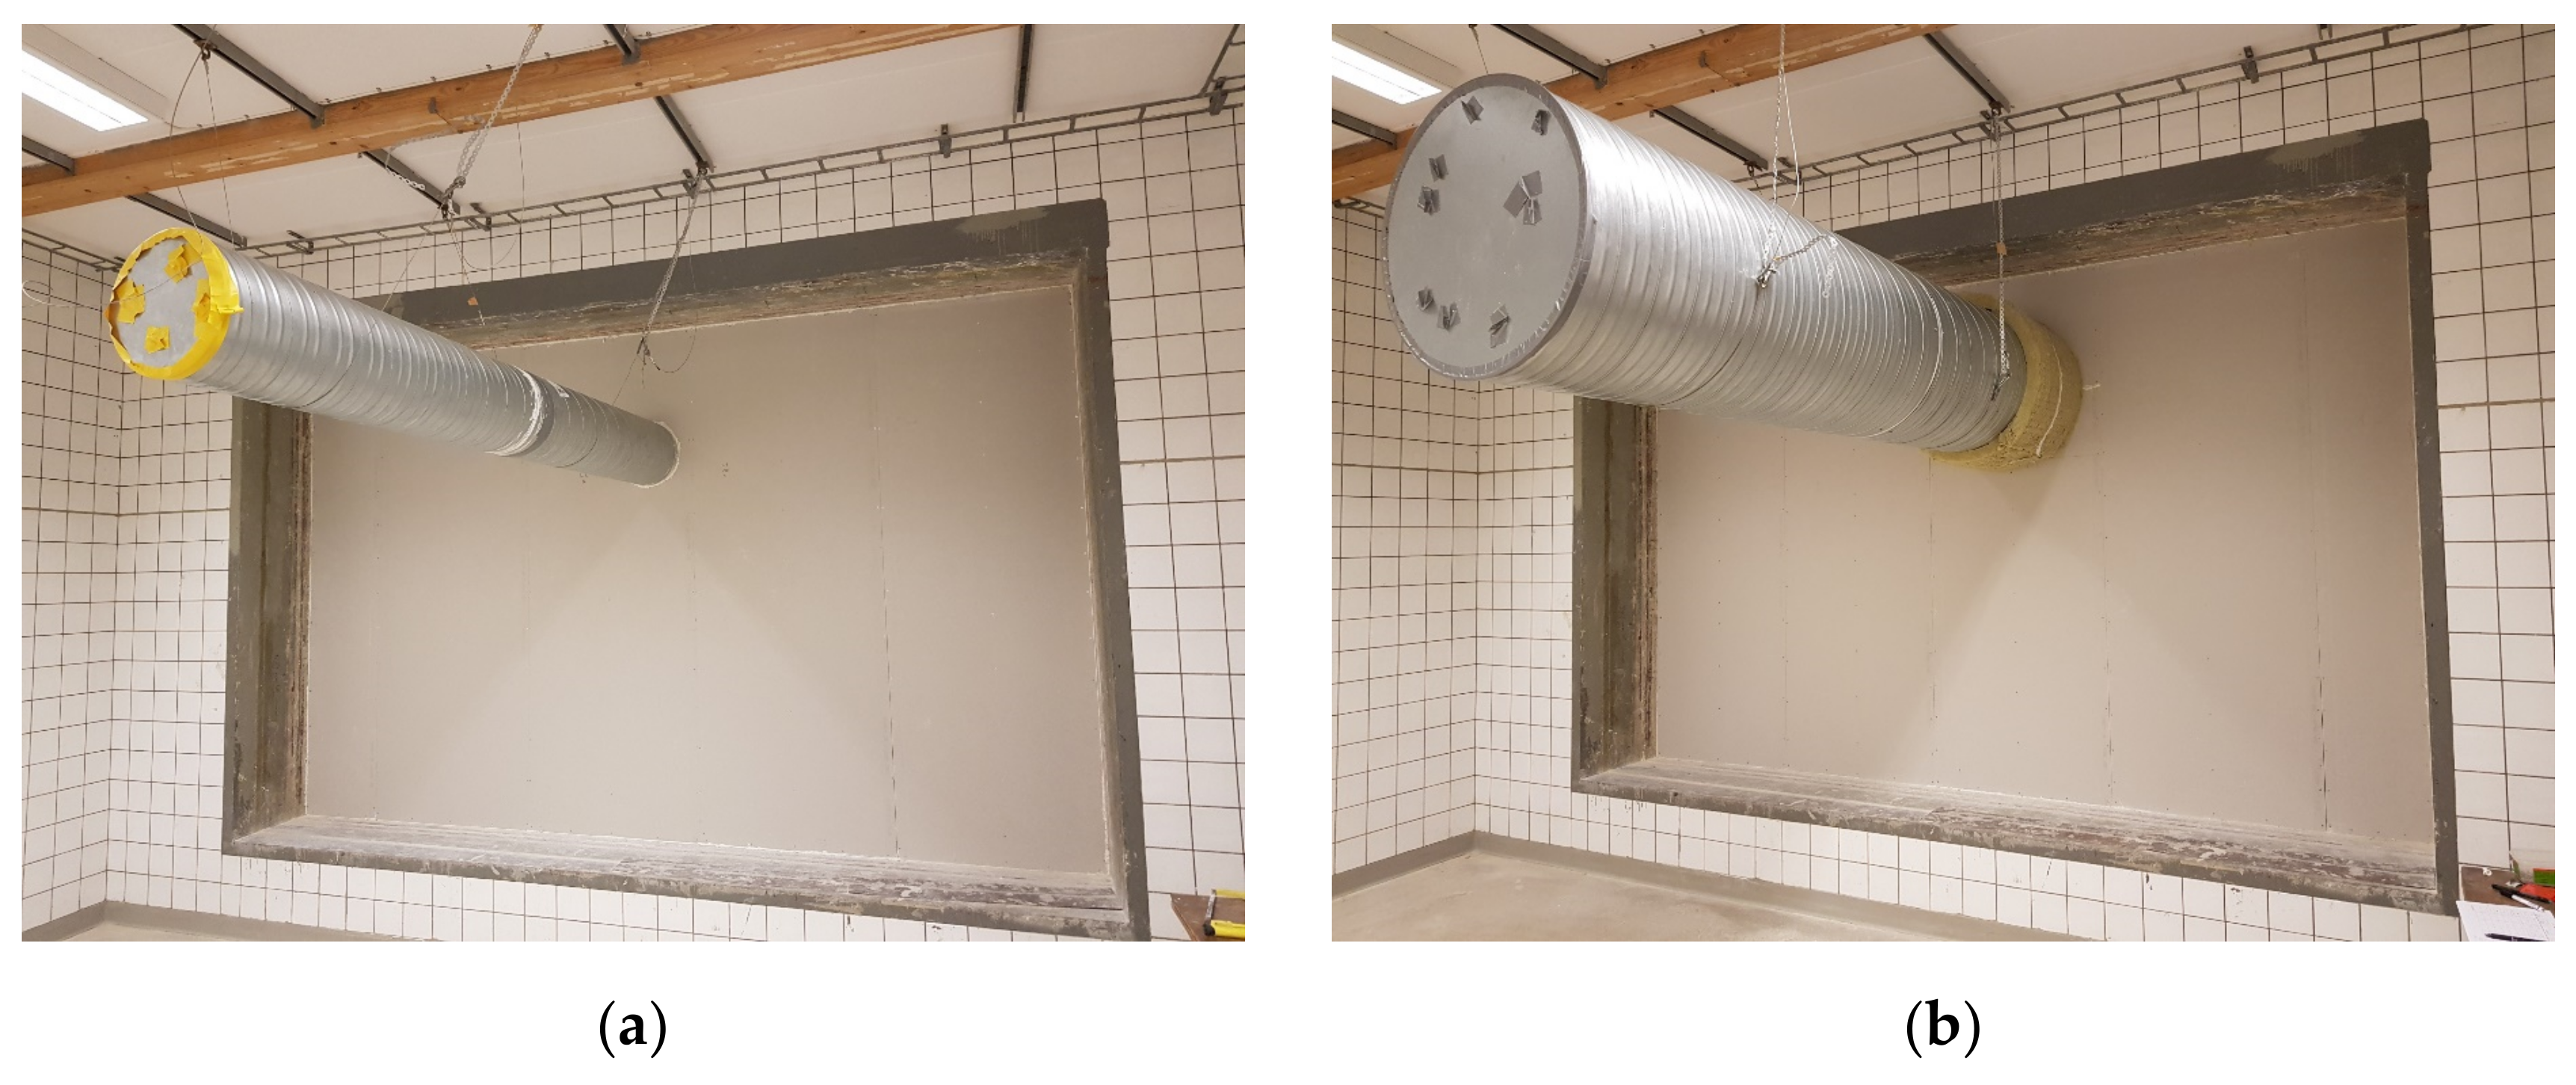
Pictures from the measurement setup are displayed in
Figure 4 where different treatments for different configurations are applied according to cases 1–5 presented before. For cases 4 and 5, a length of 600 mm on each side was added in stages for each measurement, starting closest to the wall. The reverberation time was measured for every new arrangement according to the standards ISO 10140-4 and ISO 3382-2 [
35,
36] for measuring reverberation time in the lab.
The sound pressure levels in each room were measured with five fixed positions according to the standard ISO 10140-2 [
37]. Two loudspeakers were used in the sending room to create a stable sound field and with this setup, the sound pressure level only needed to be measured one time (with five positions) in each room according to the standard ISO 10140-5 [
38]. Each loudspeaker was connected to an amplifier with constant level settings (Brüel & Kjær Type 2734) emitting pink noise.
4. Measurement Results
Three walls were measured together with three different ventilation ducts which adds up to nine combinations. One wall and three ventilation ducts are described as one sequence. The walls were initially measured for each sequence without the ducts. The initial measurement was used as a reference value. The ducts were mounted through the wall where different treatments, according to case 1–5, were applied. Case 2 was primarily used to compare current theories or to develop new theories for the sound reduction of ventilation ducts. Cases 3–5 were used to investigate which treatments are required for the ventilation duct to not reduce the sound reduction index of the separated wall compared to the reference wall. The treatment fulfilling this condition for each sequence is described as sufficient.
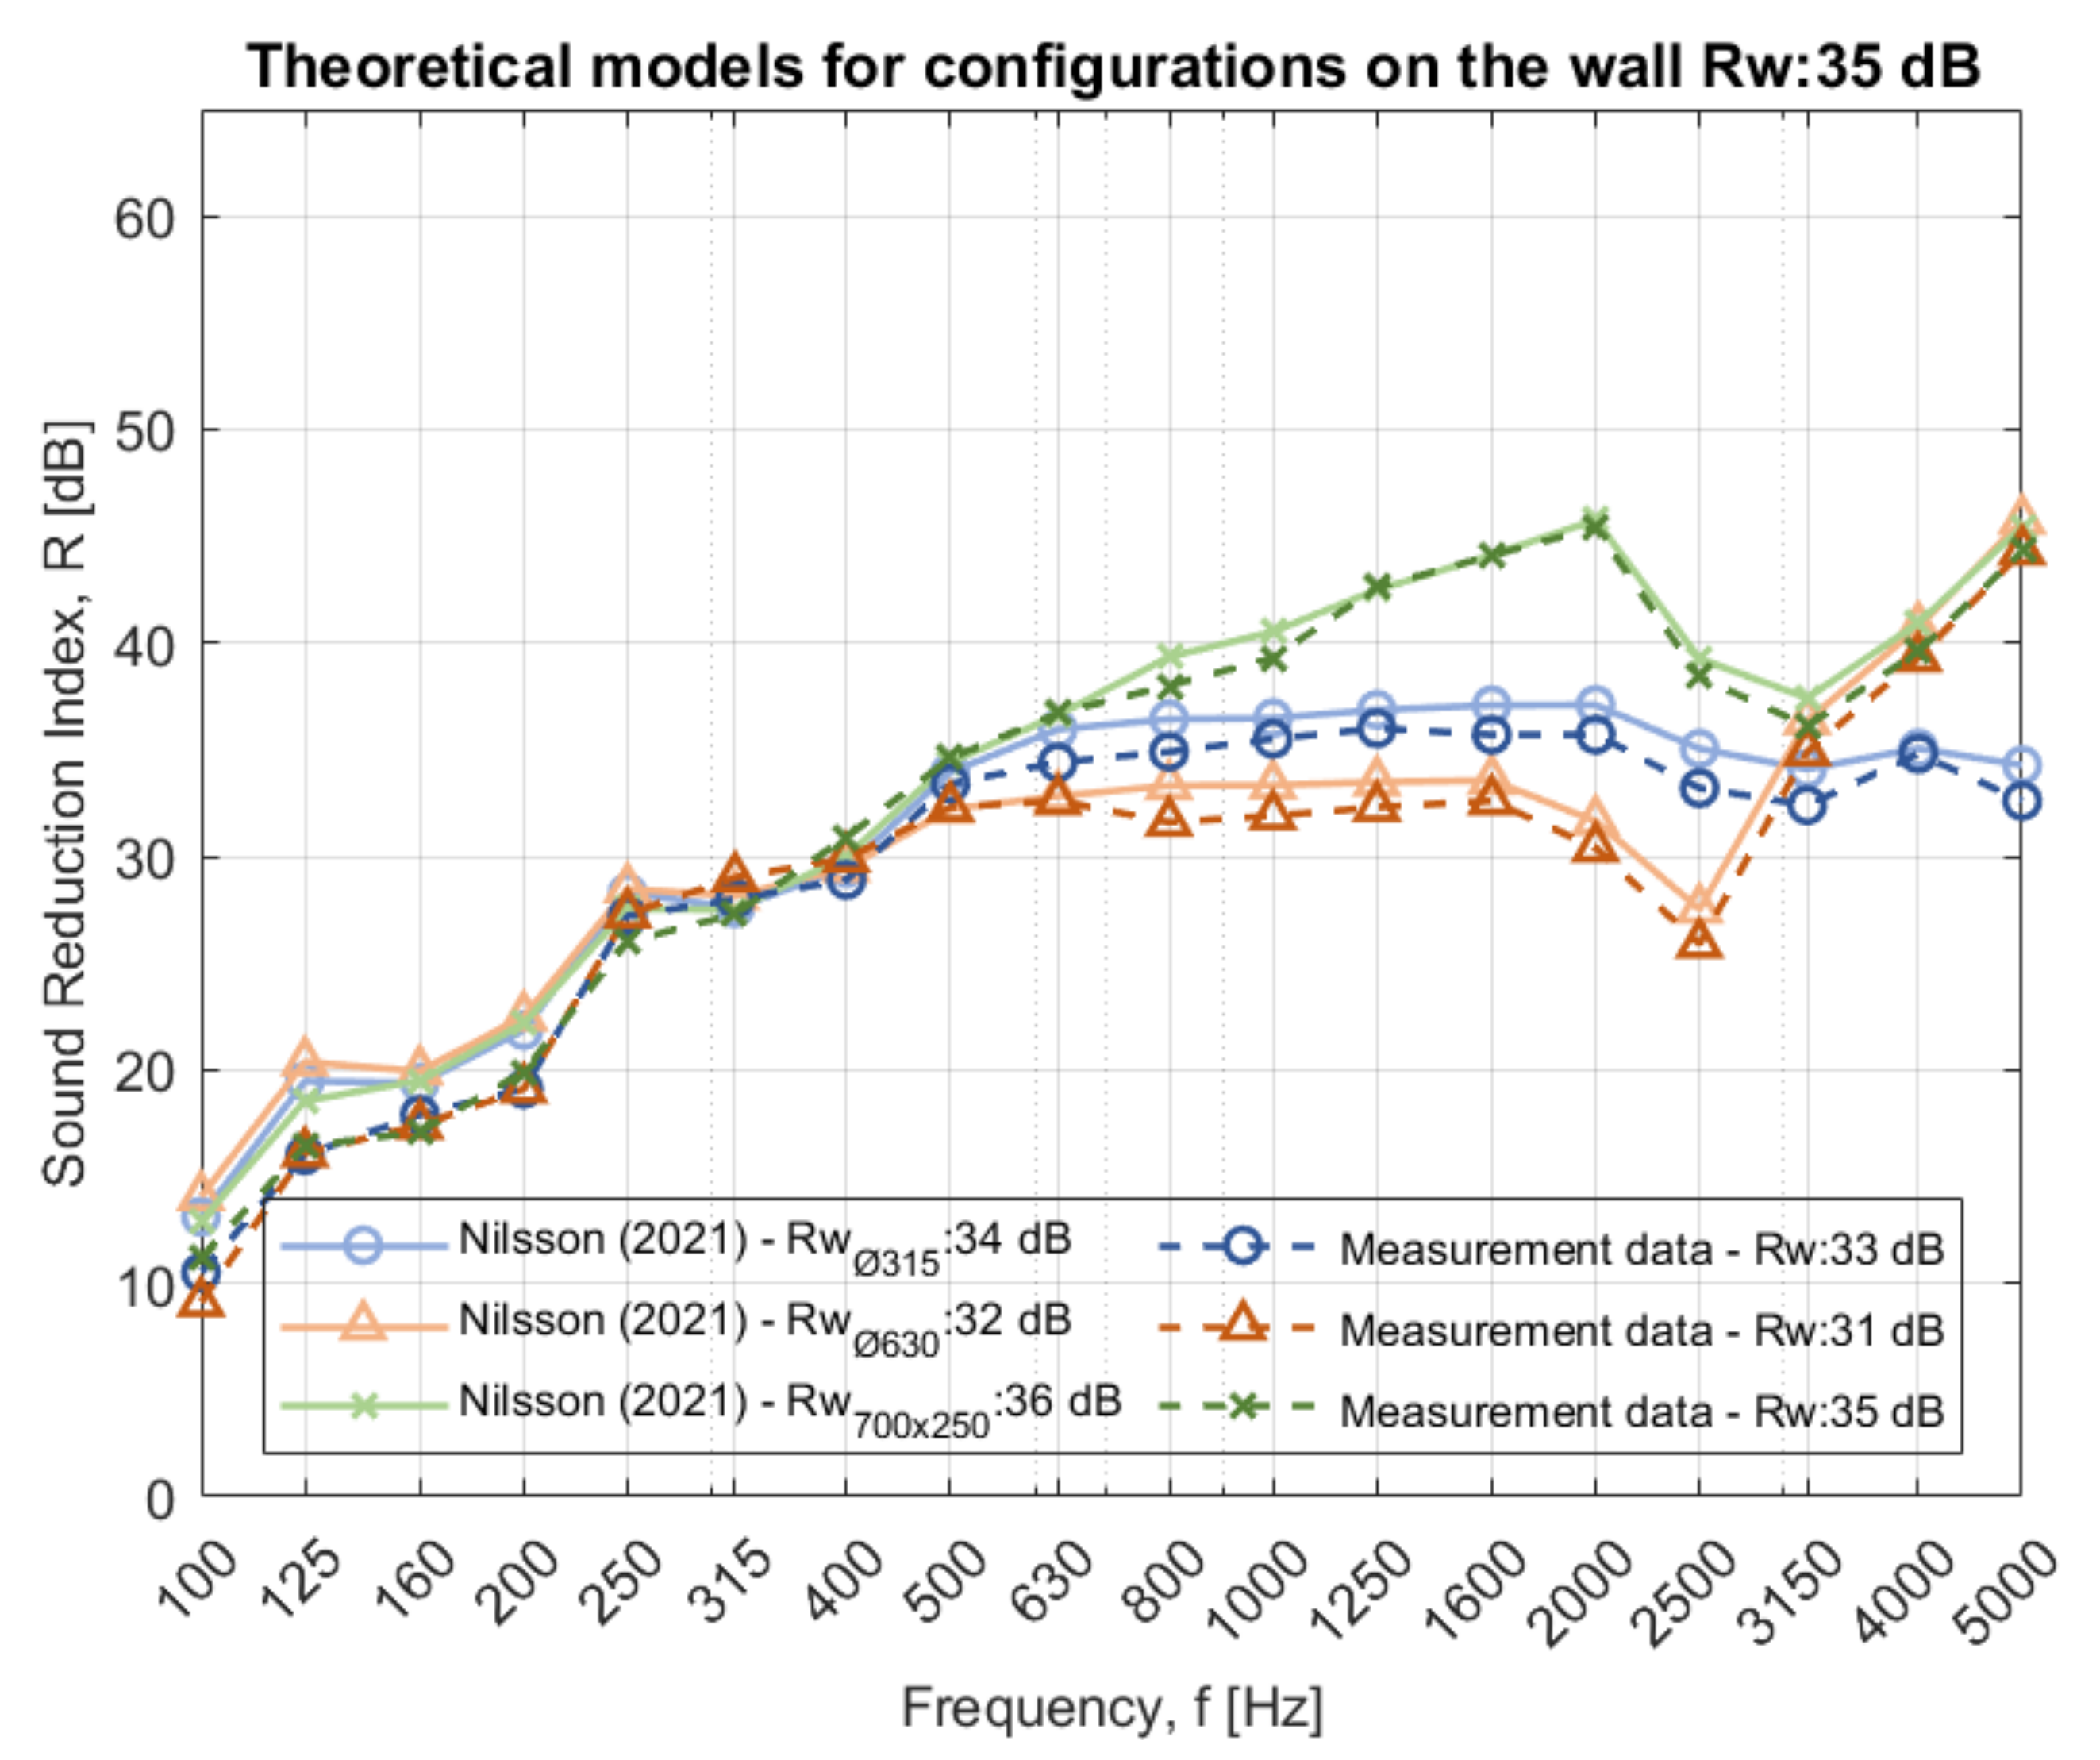
4.1. For Wall A, with a Measured Sound Reduction Index of 35 dB
Simple treatments were required for all three ventilation ducts. For the rectangular duct, a sealant was sufficient. For the small circular 315 mm duct, 50 mm stone wool (density: 100 kg/m3) was needed to cover the surface area closest to the wall on each side by 600 mm. For the larger circular duct, 630 mm, the wrapping length must be 1200 mm instead.
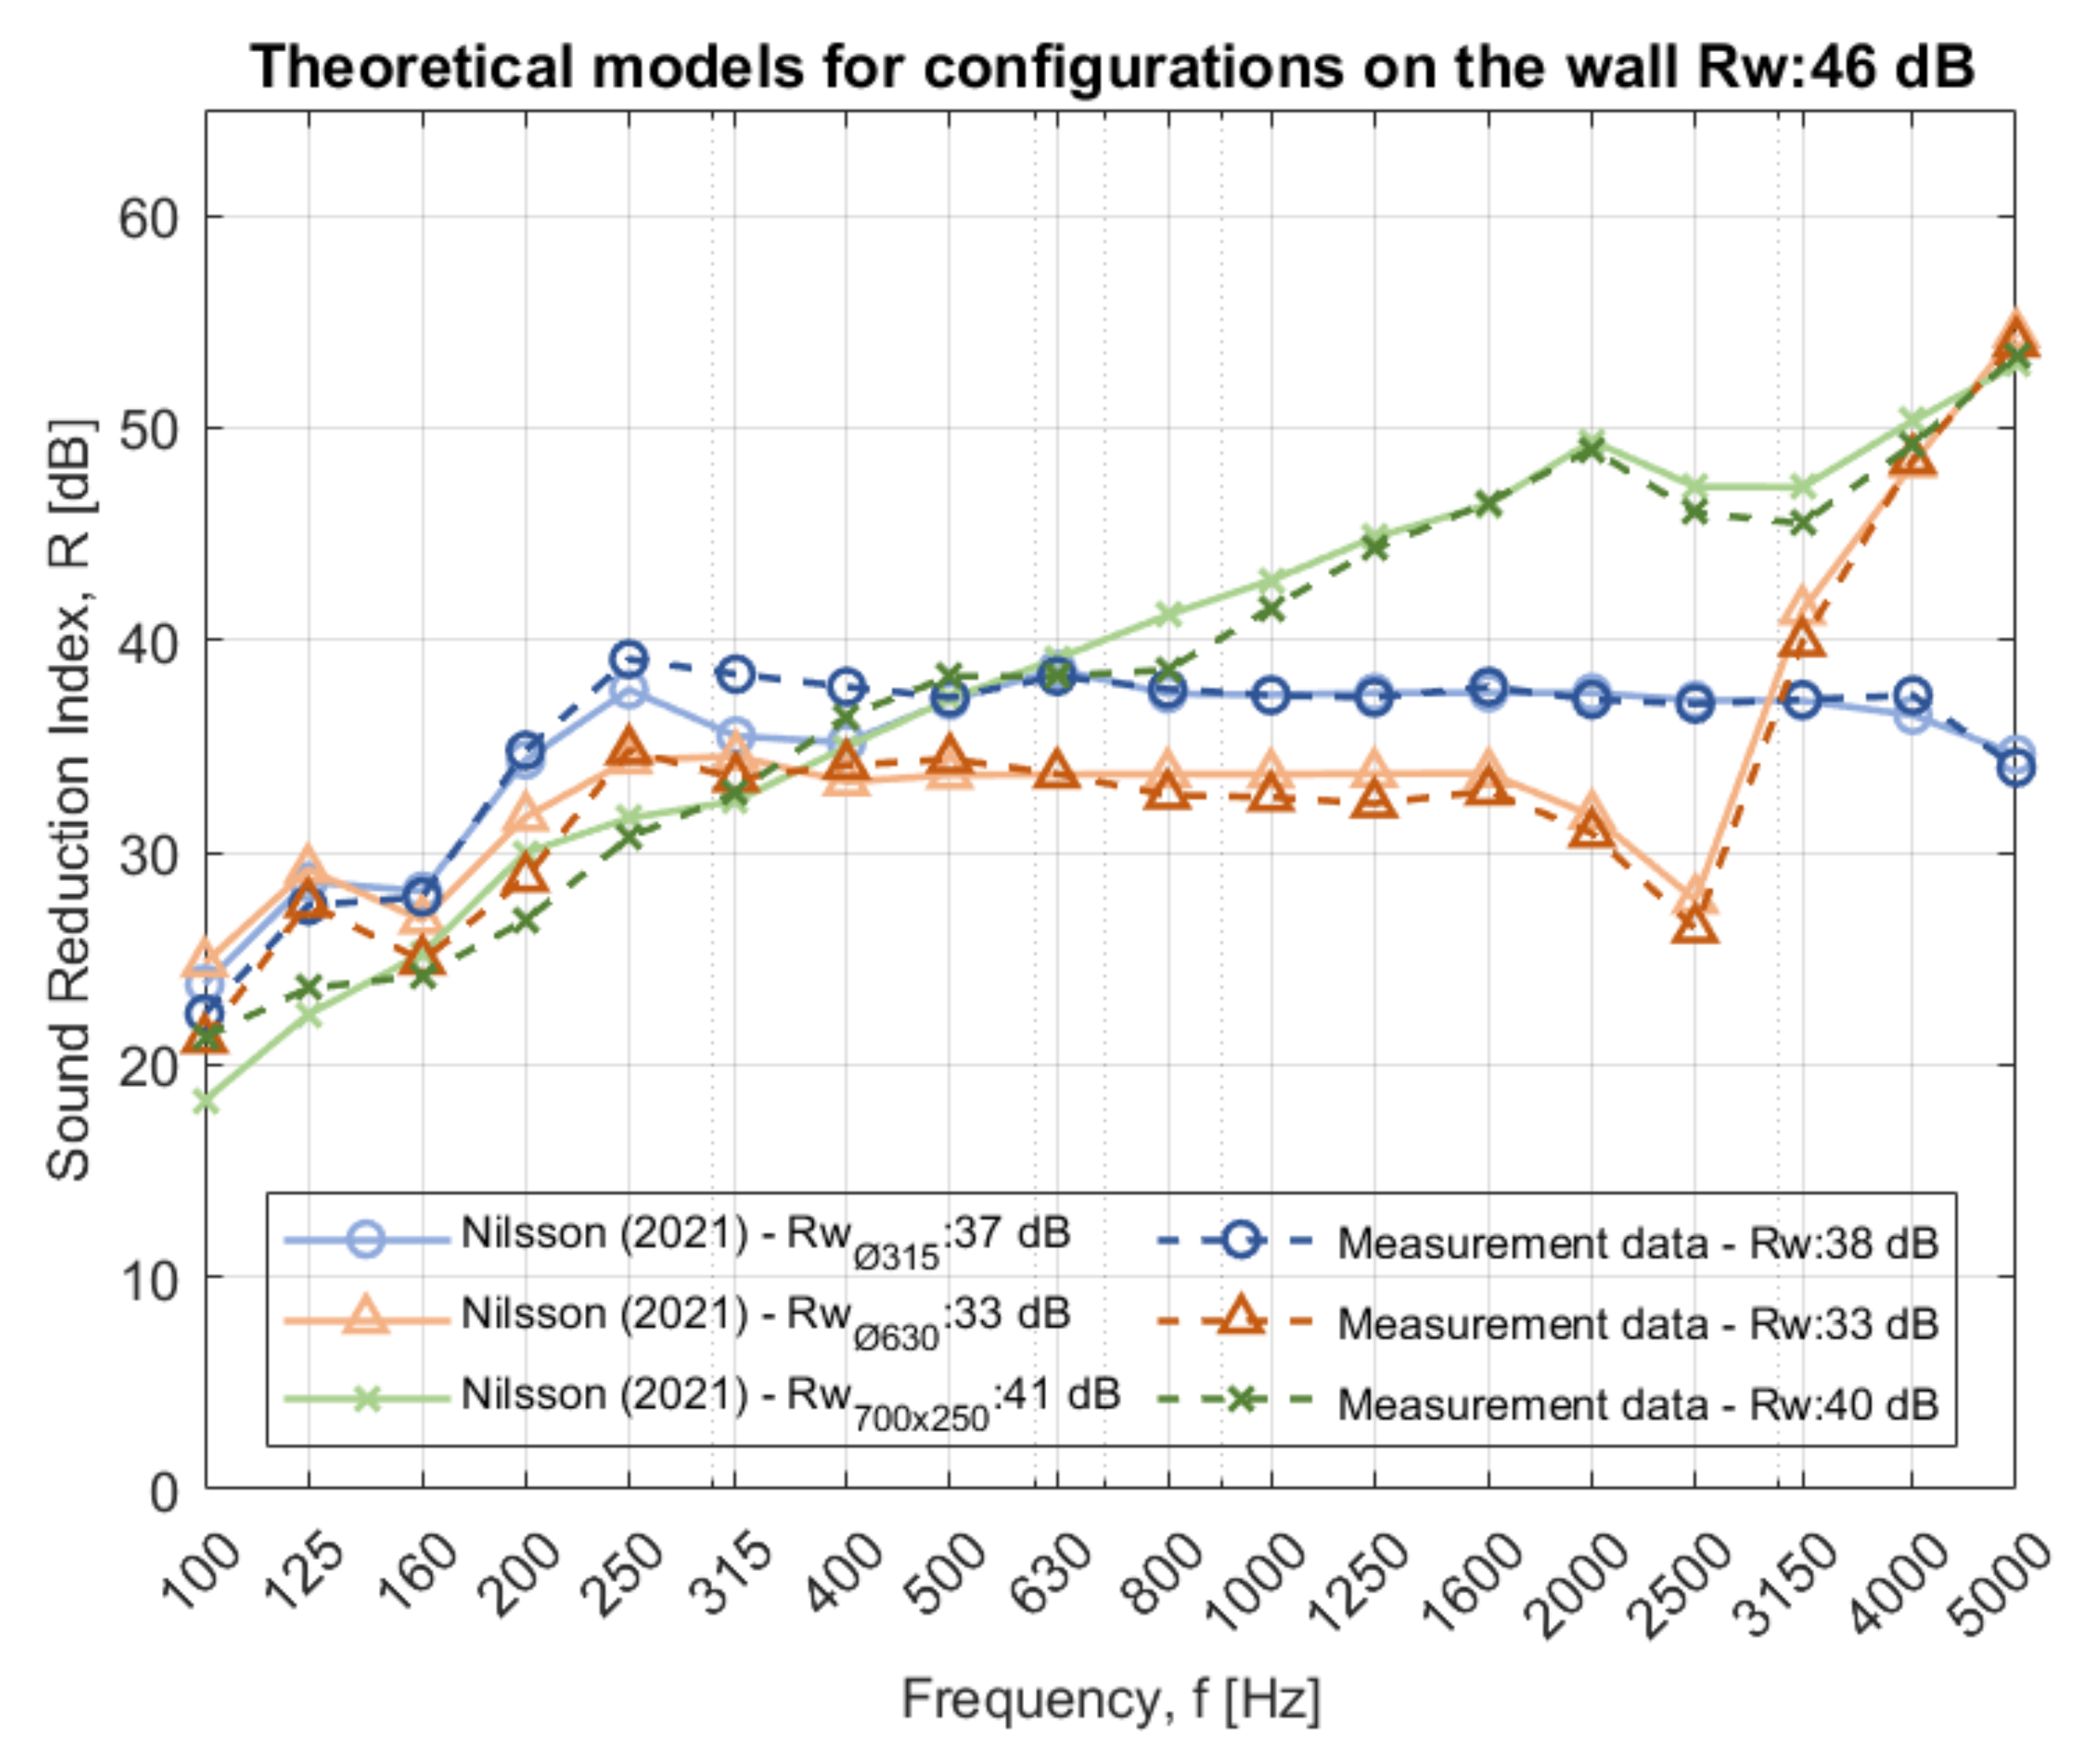
4.2. For Wall B, with a Measured Sound Reduction Index of 46 dB
The ventilation ducts through the second wall required different treatments. For the circular 315 mm duct, 50 mm stone wool (density: 100 kg/m3) was needed to cover the surface area closest to the wall on each side by 1800 mm. For the rectangular and the larger circular duct, the whole length needed to be covered with stone wool (density: 100 kg/m3), 50 mm in thickness on both sides of the wall. Unlike wall A, the two last-mentioned ducts required the same treatments for wall B.
4.3. For Wall C, with a Measured Sound Reduction Index of 54 dB
The ventilation ducts through the third wall required the most treatment. The circular 315 mm duct needed to be covered completely with 50 mm stone wool (density: 100 kg/m3) in both rooms. This treatment was not sufficient for the other ducts. Both the rectangular and the larger circular duct, 630 mm, needed to be covered with 100 mm stone wool at a length of 1800 mm closest to the wall. For the rest of the surface area, 50 mm stone wool was sufficient, both with a density of 100 kg/m3.
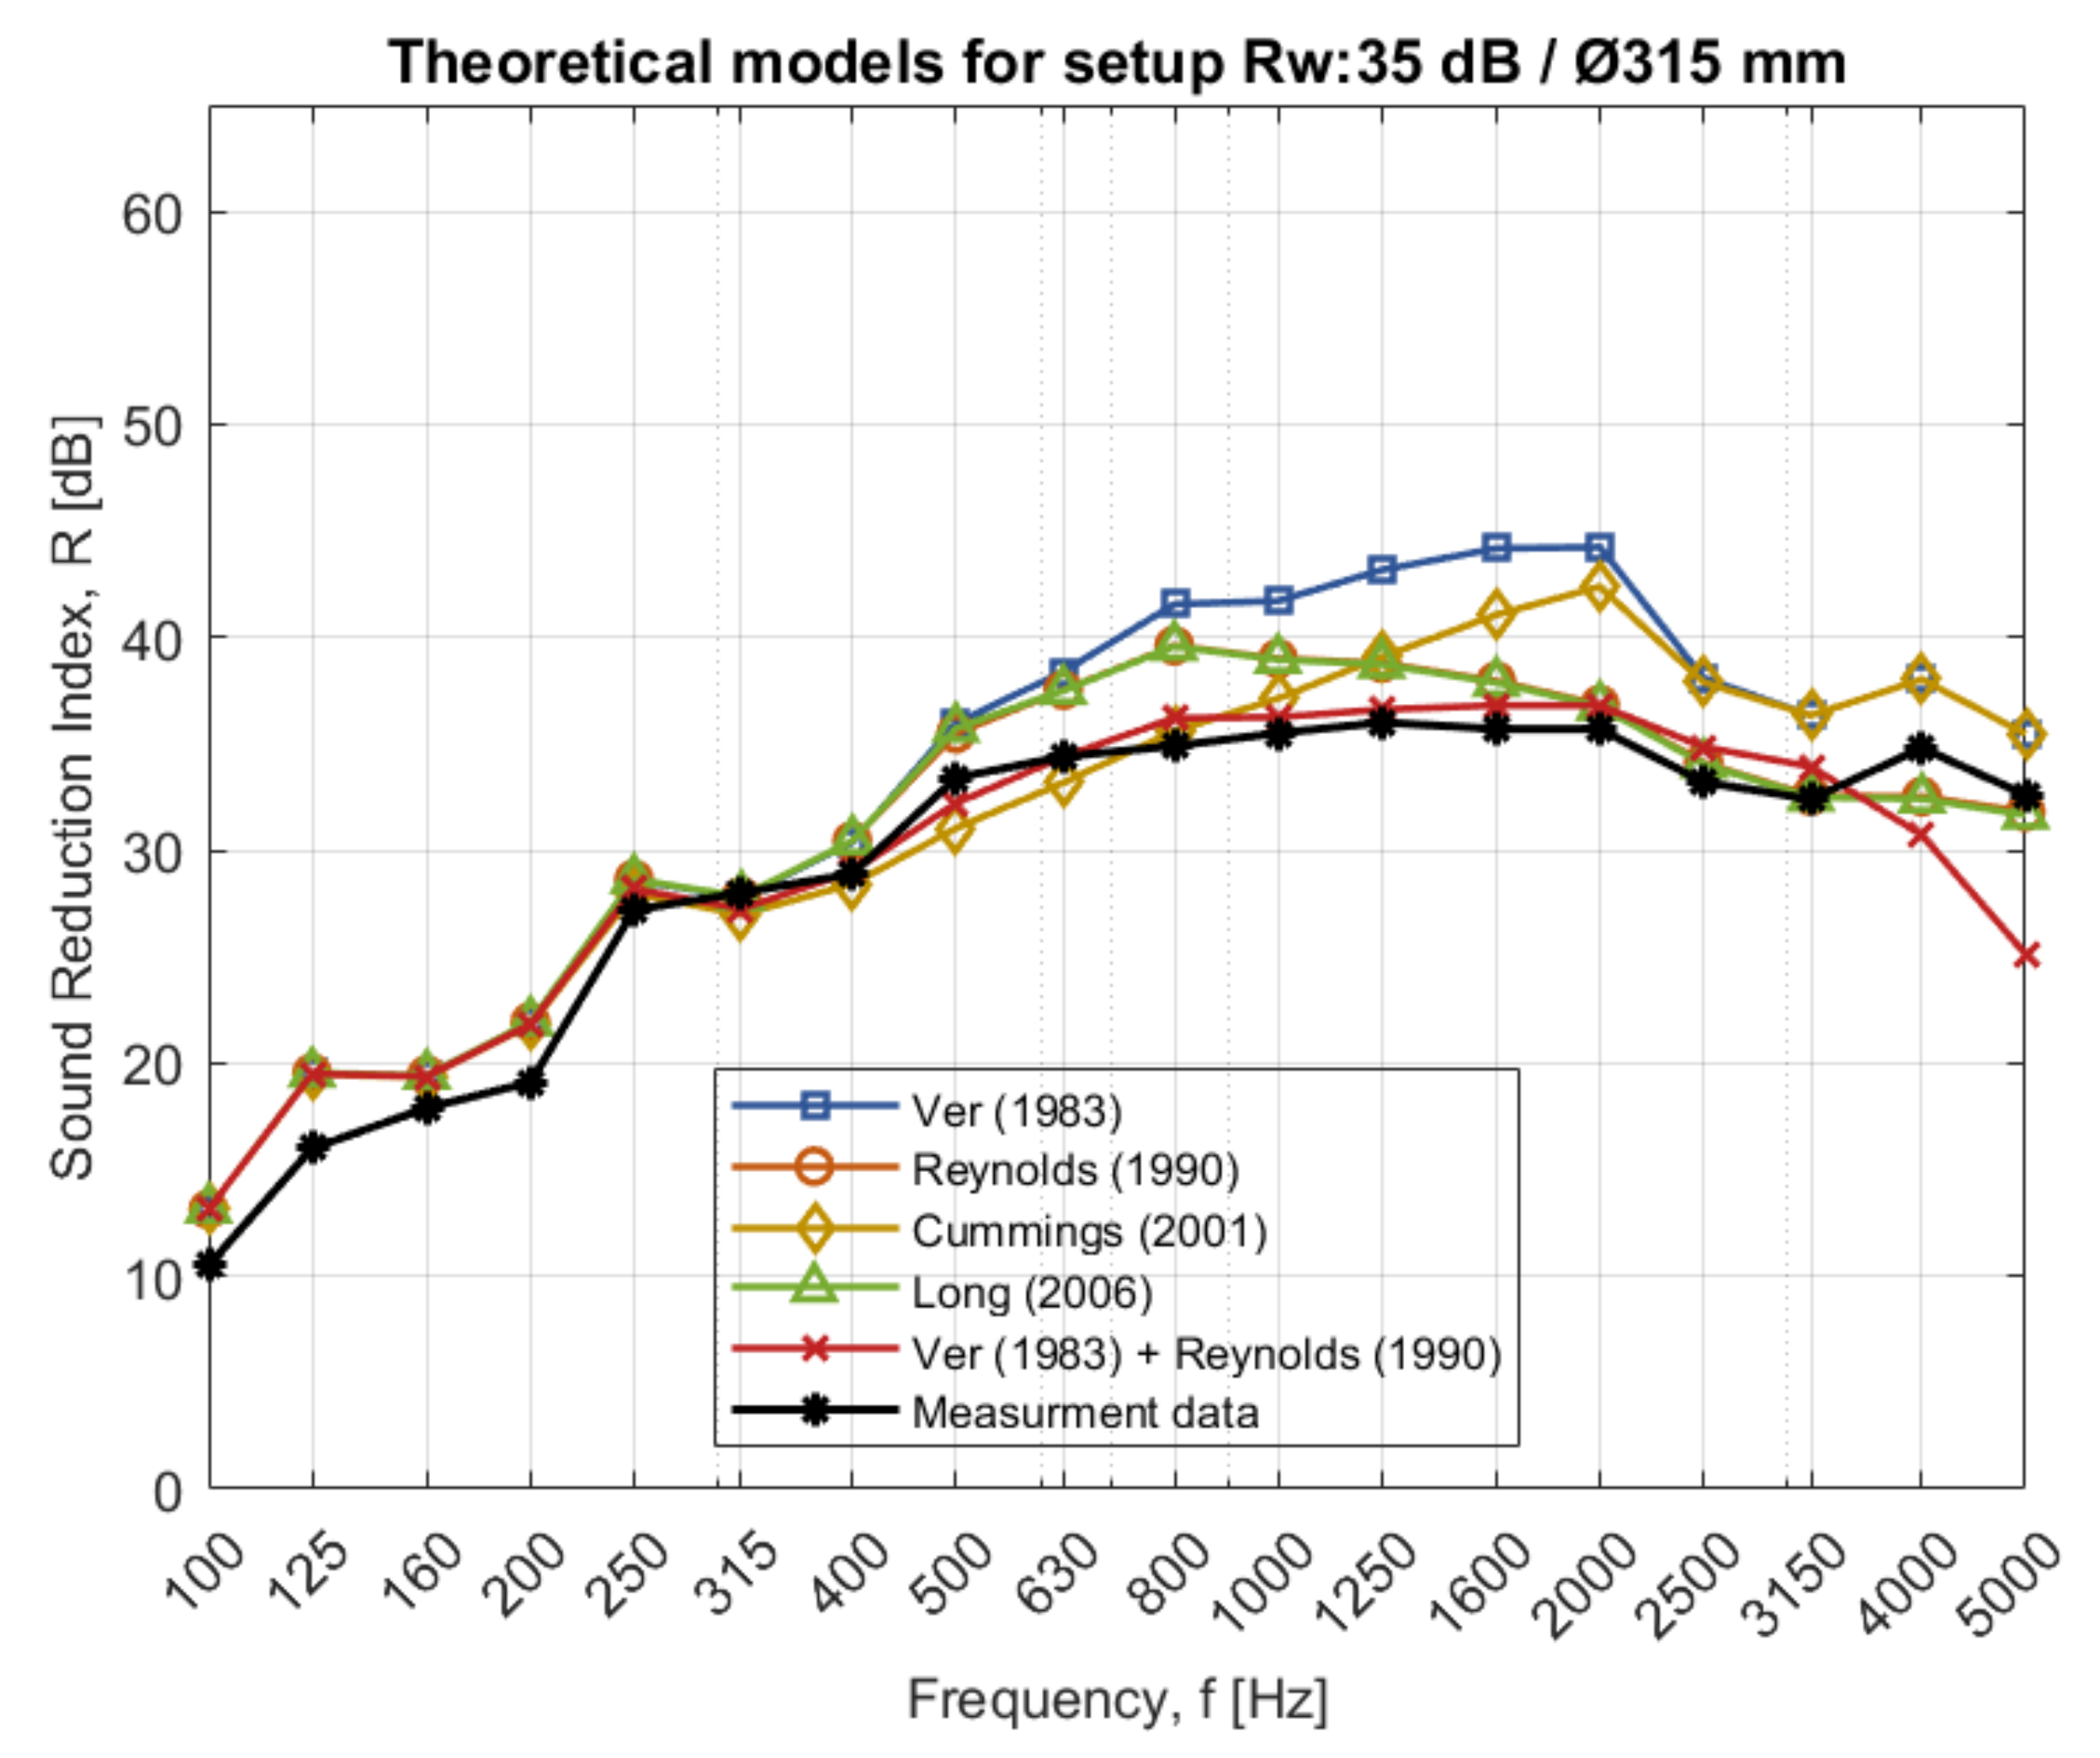
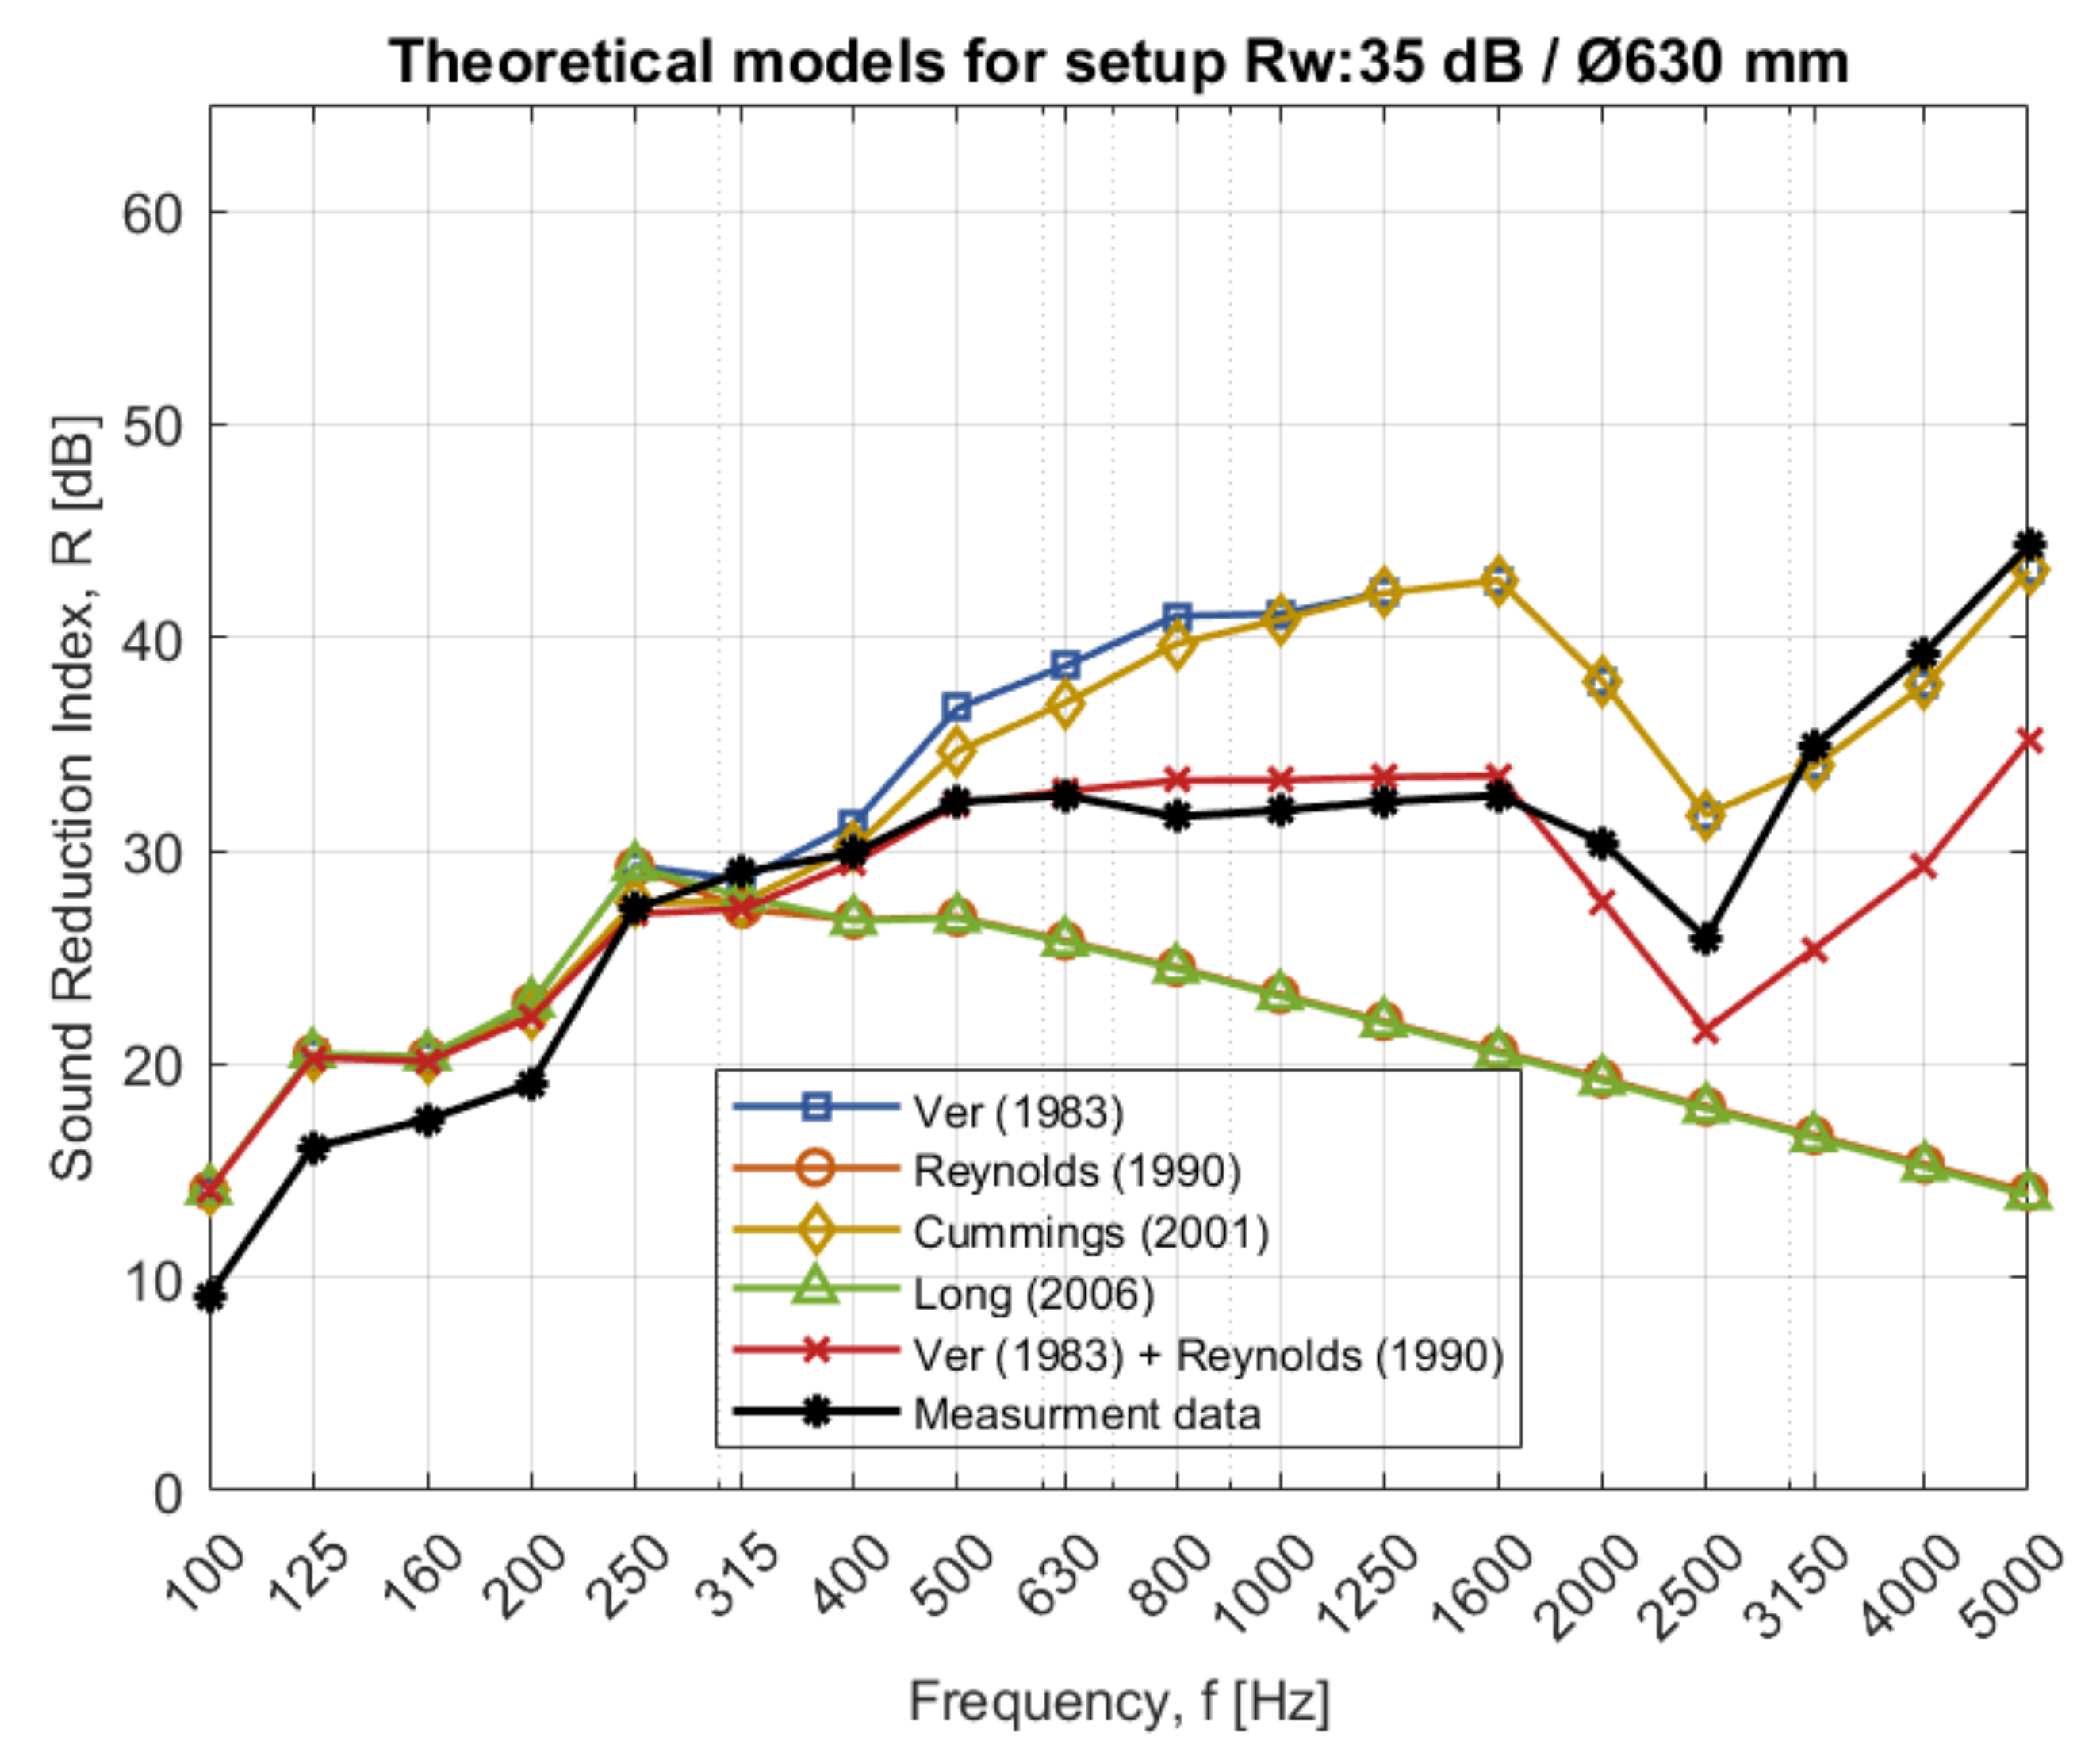
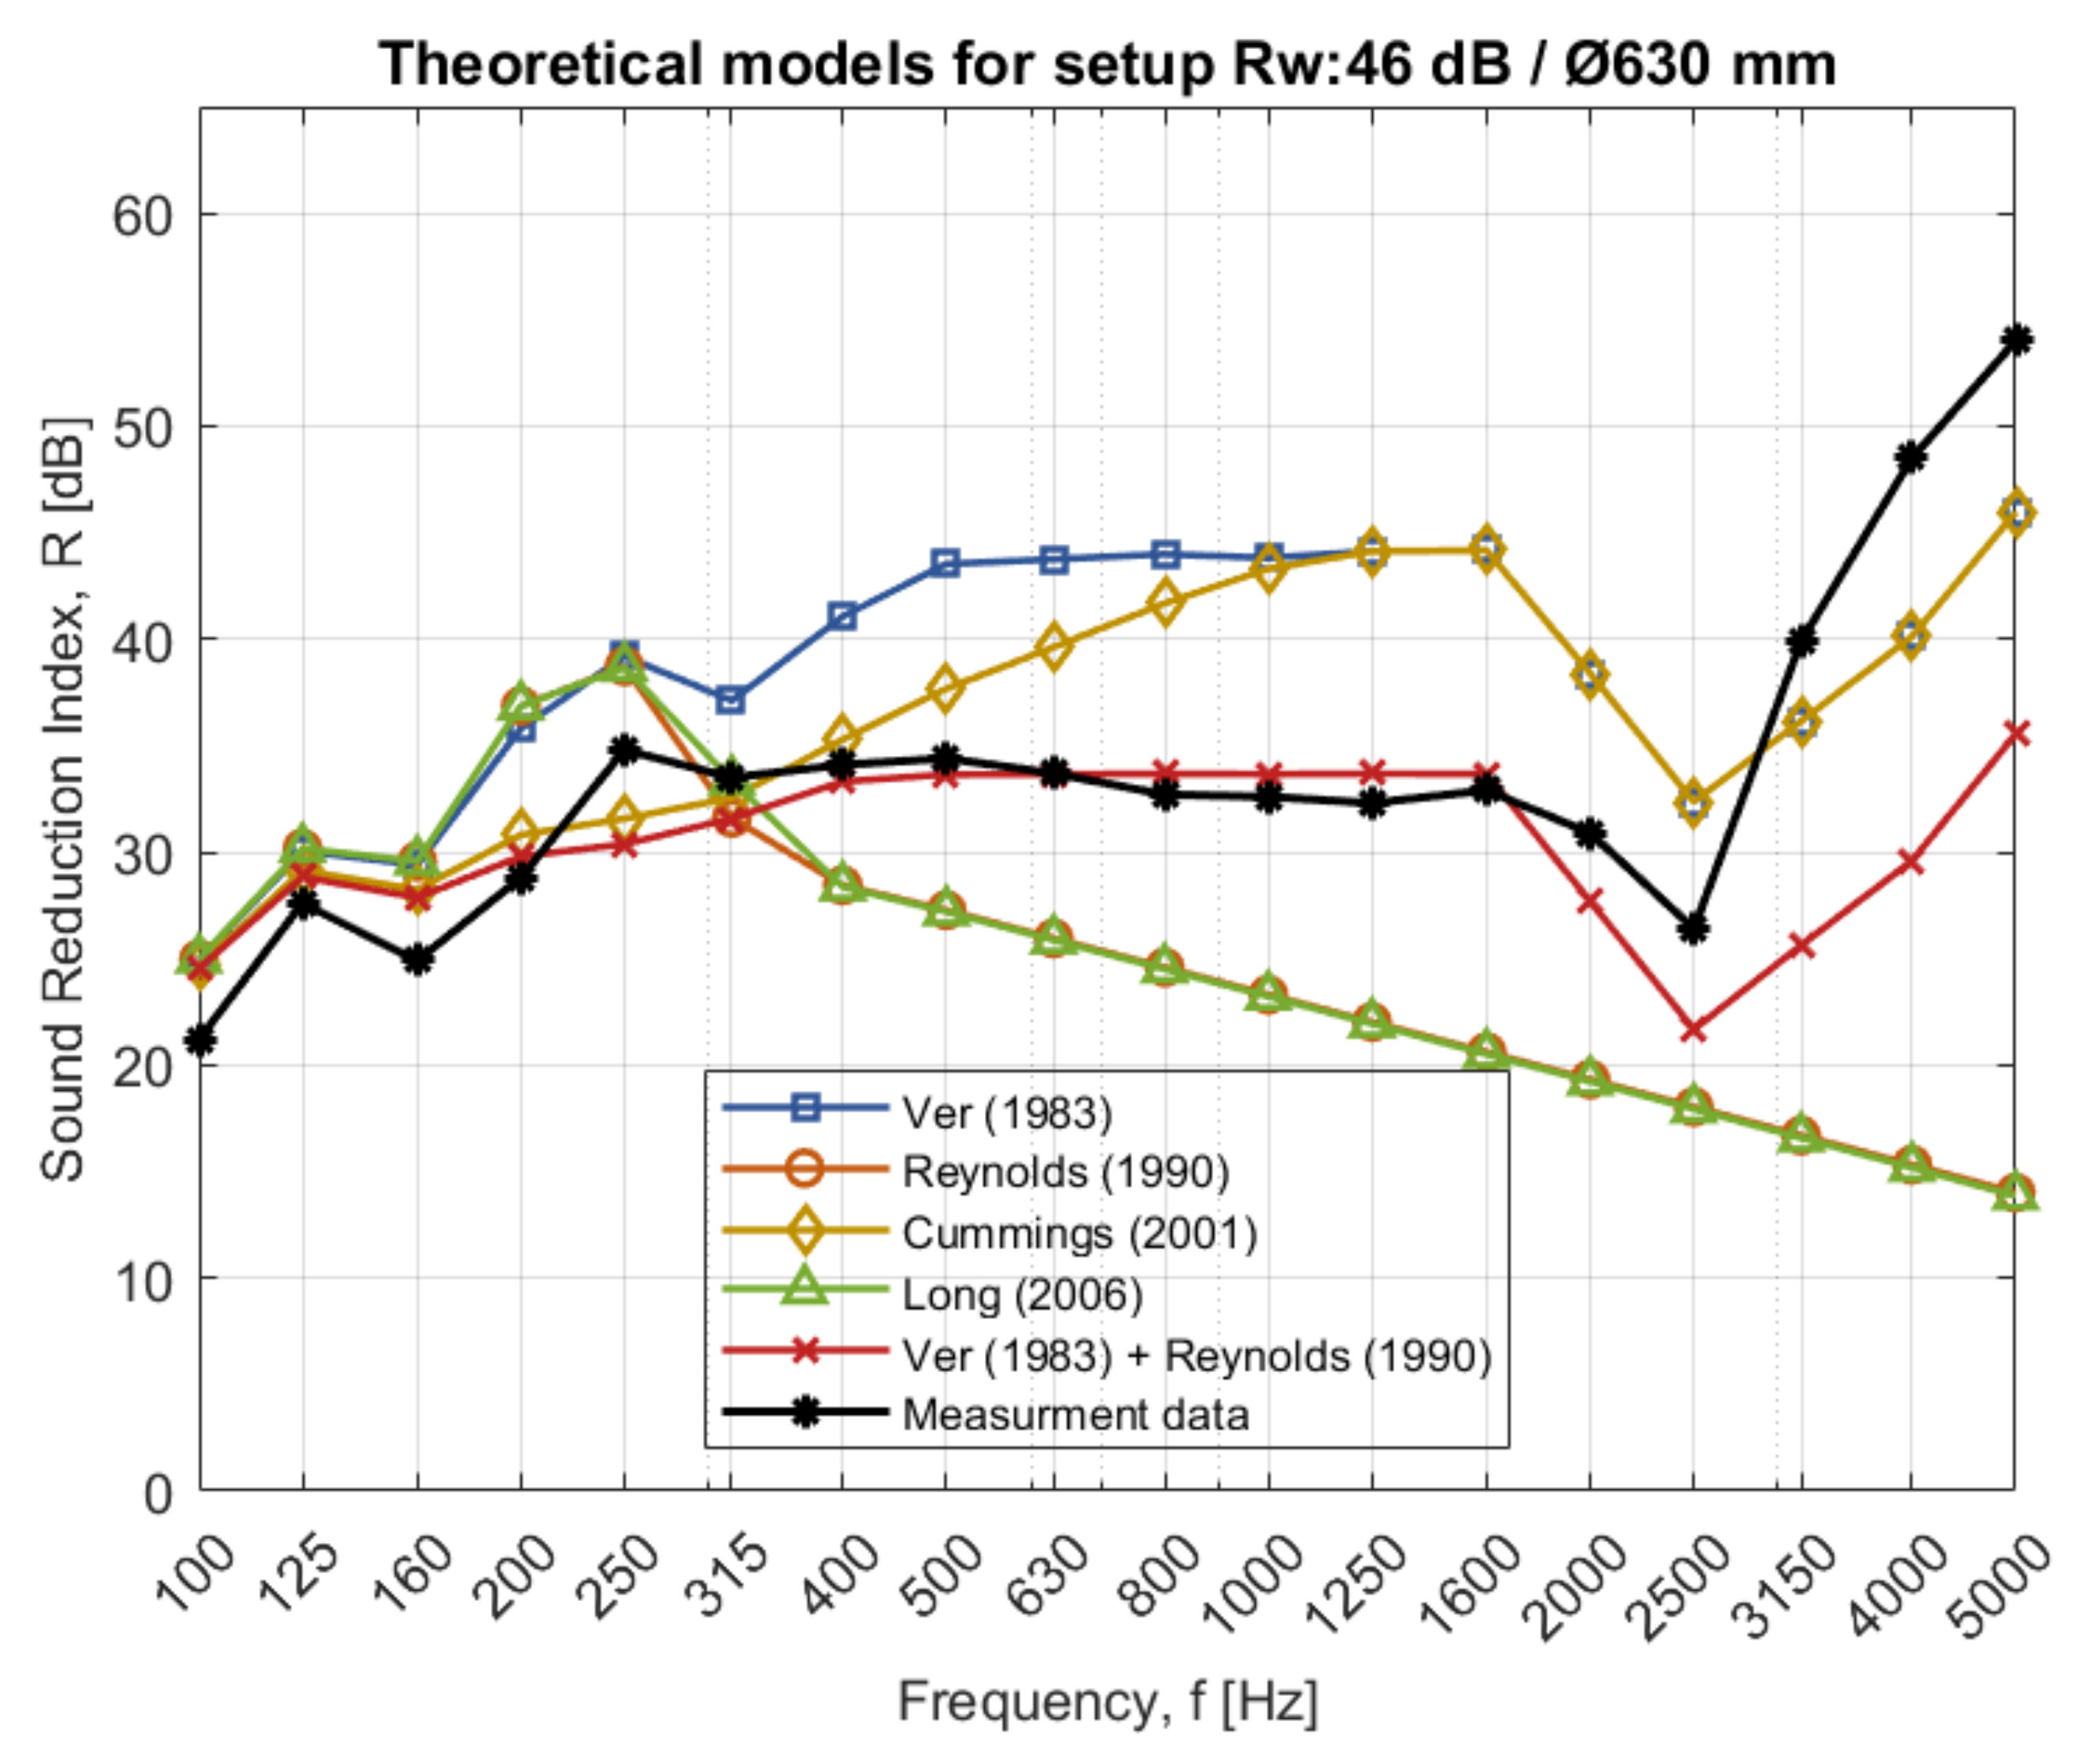
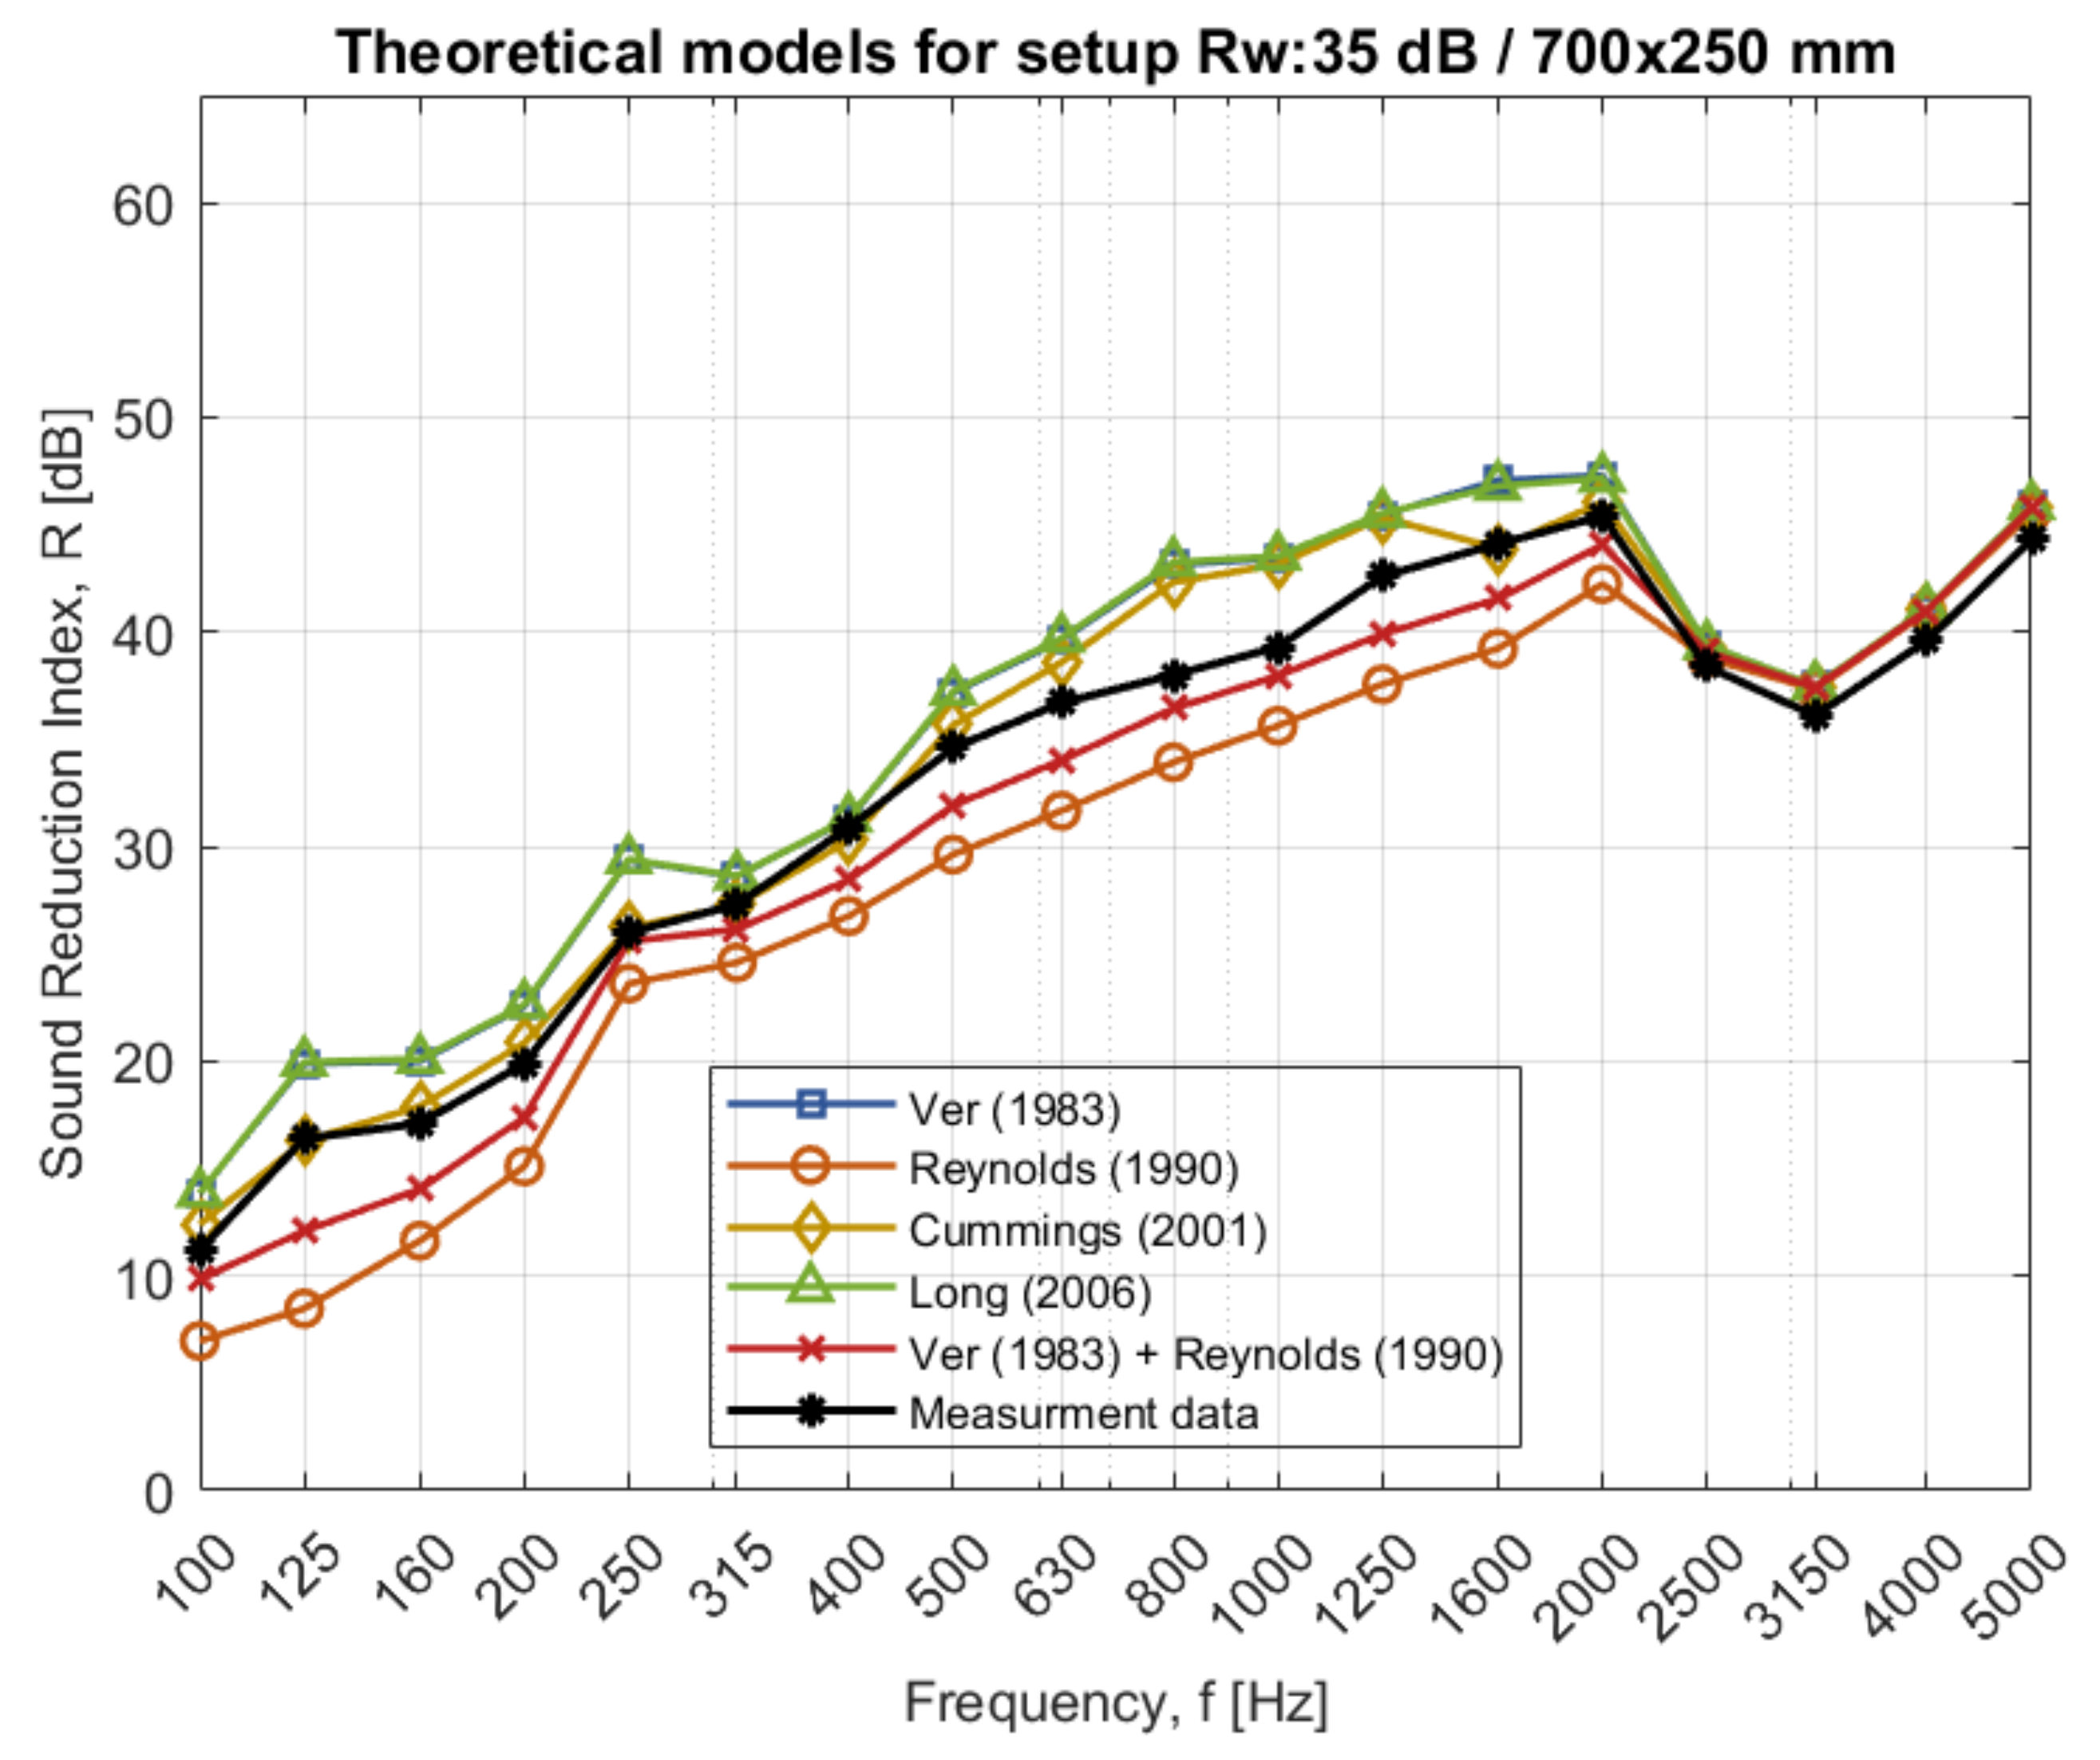
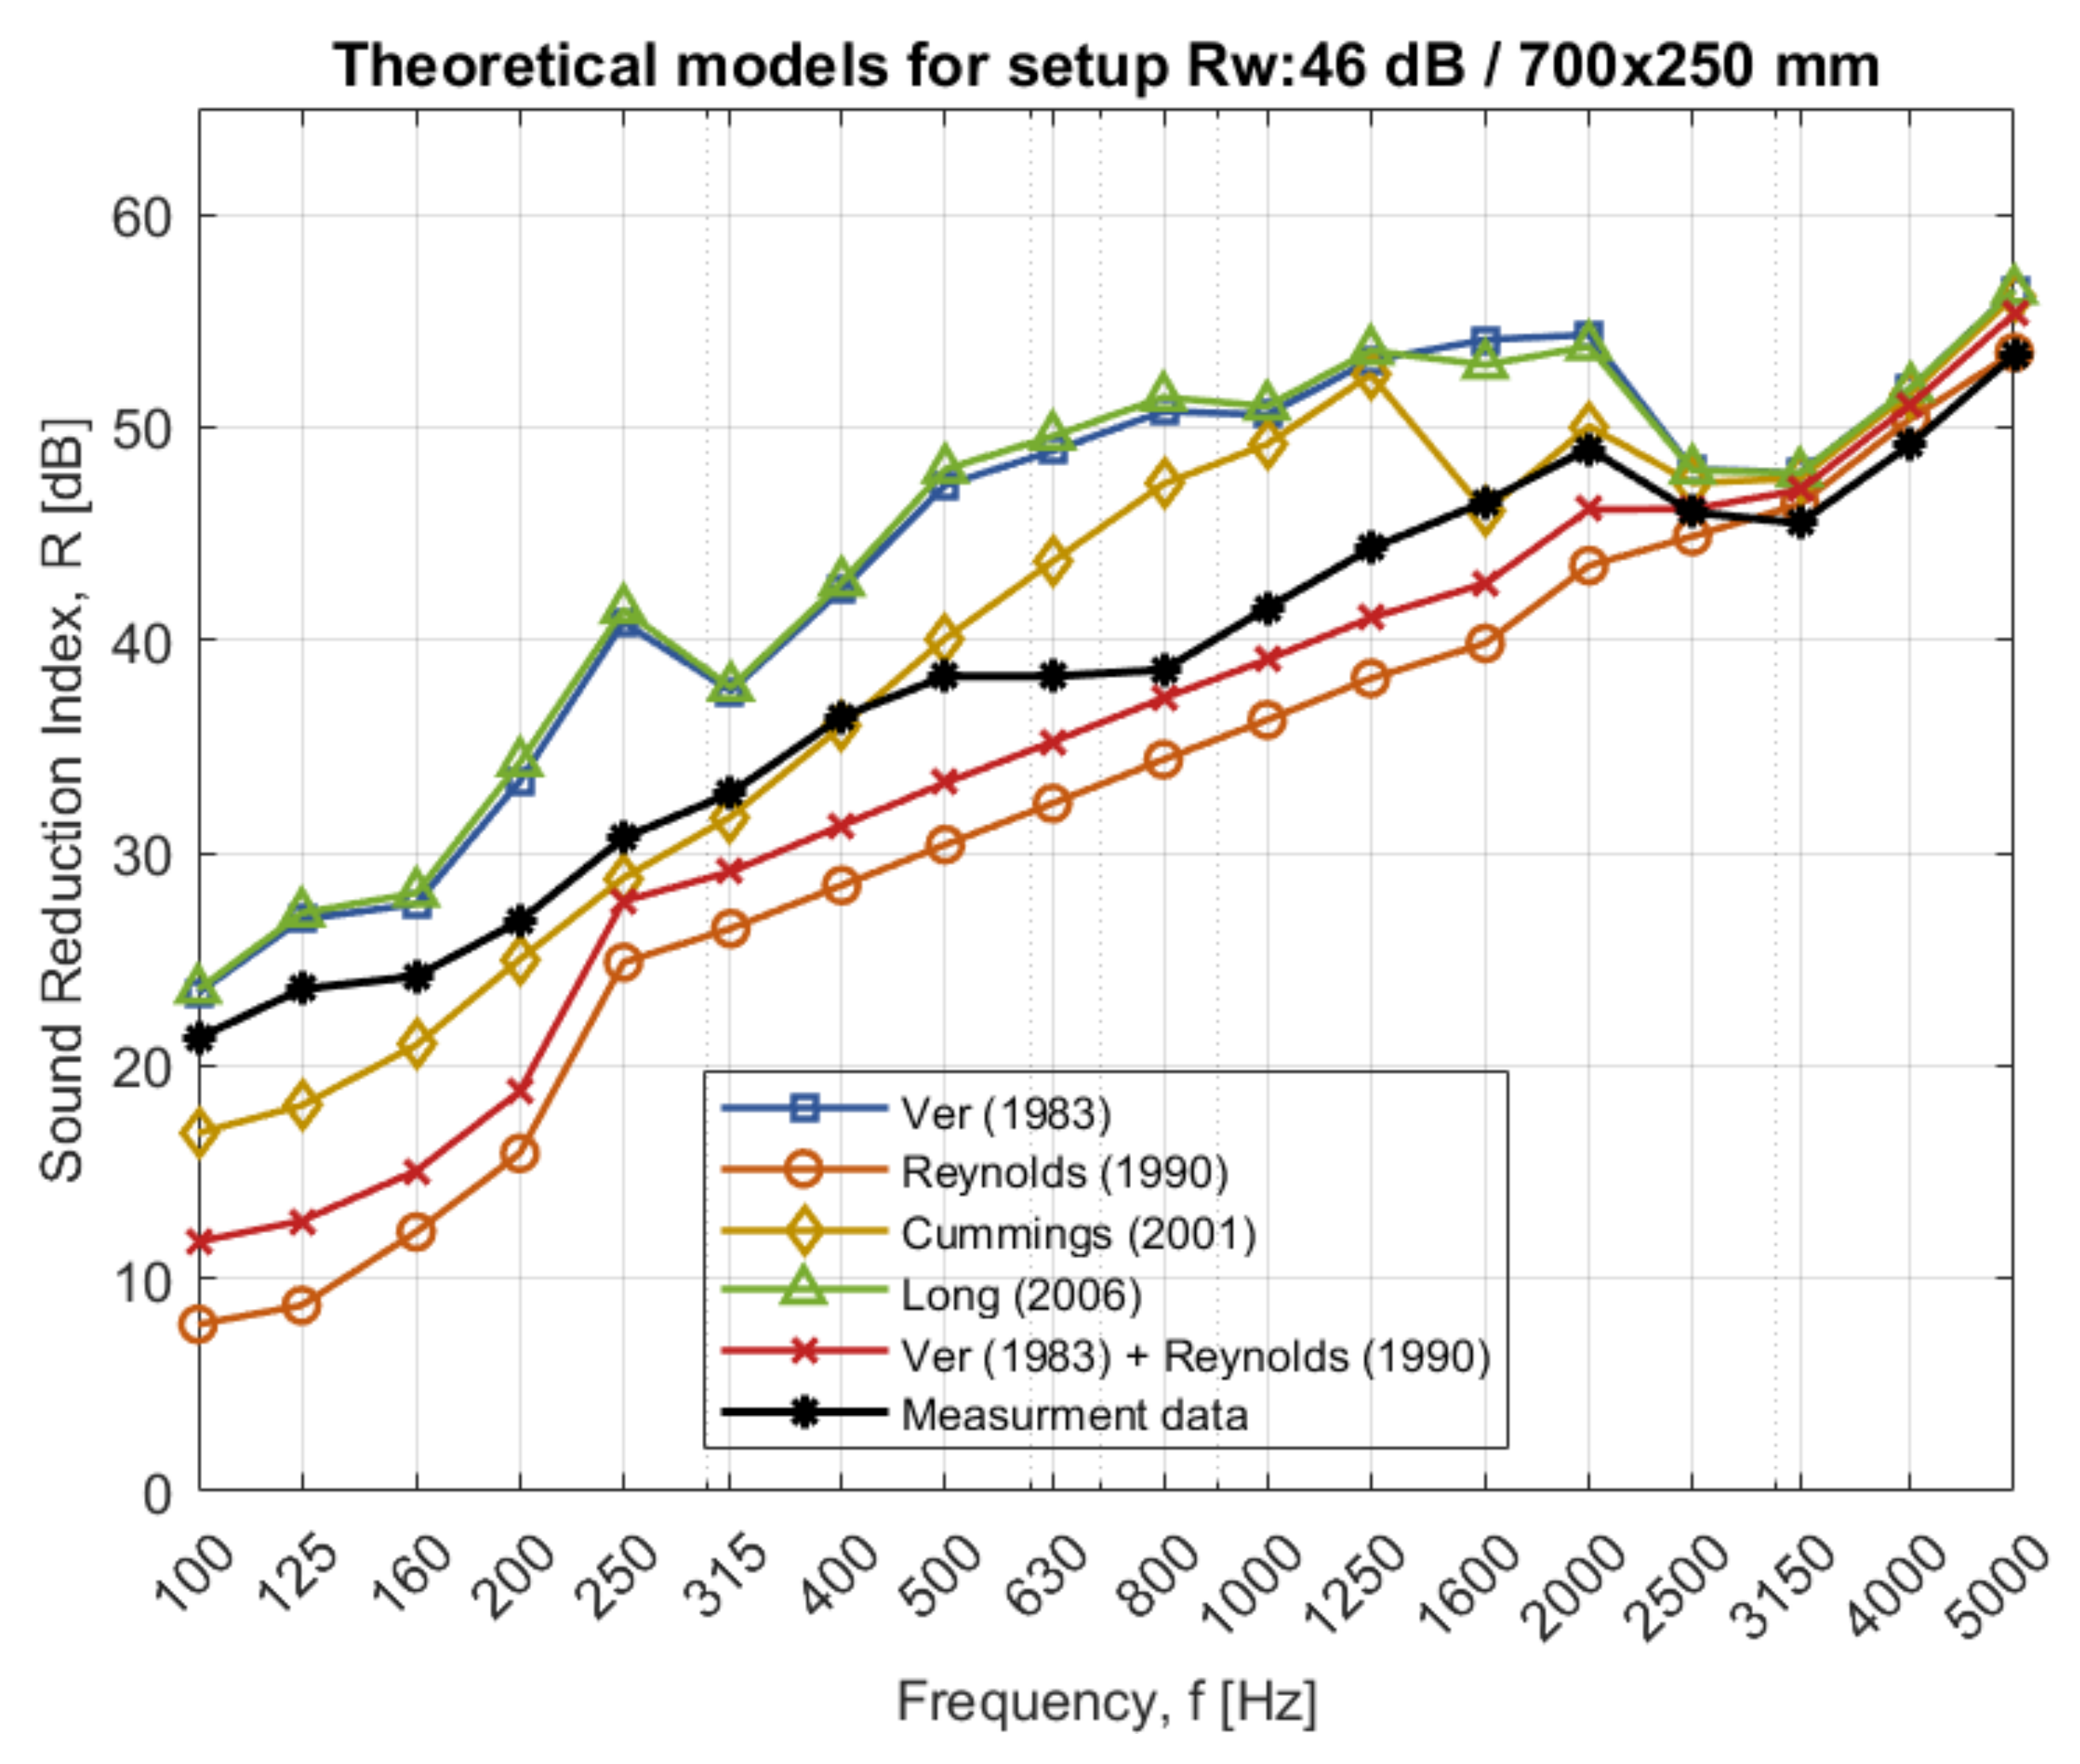
4.4. Existing Theory Compared to Measurement Result for Case 2
5. Theoretical Analysis
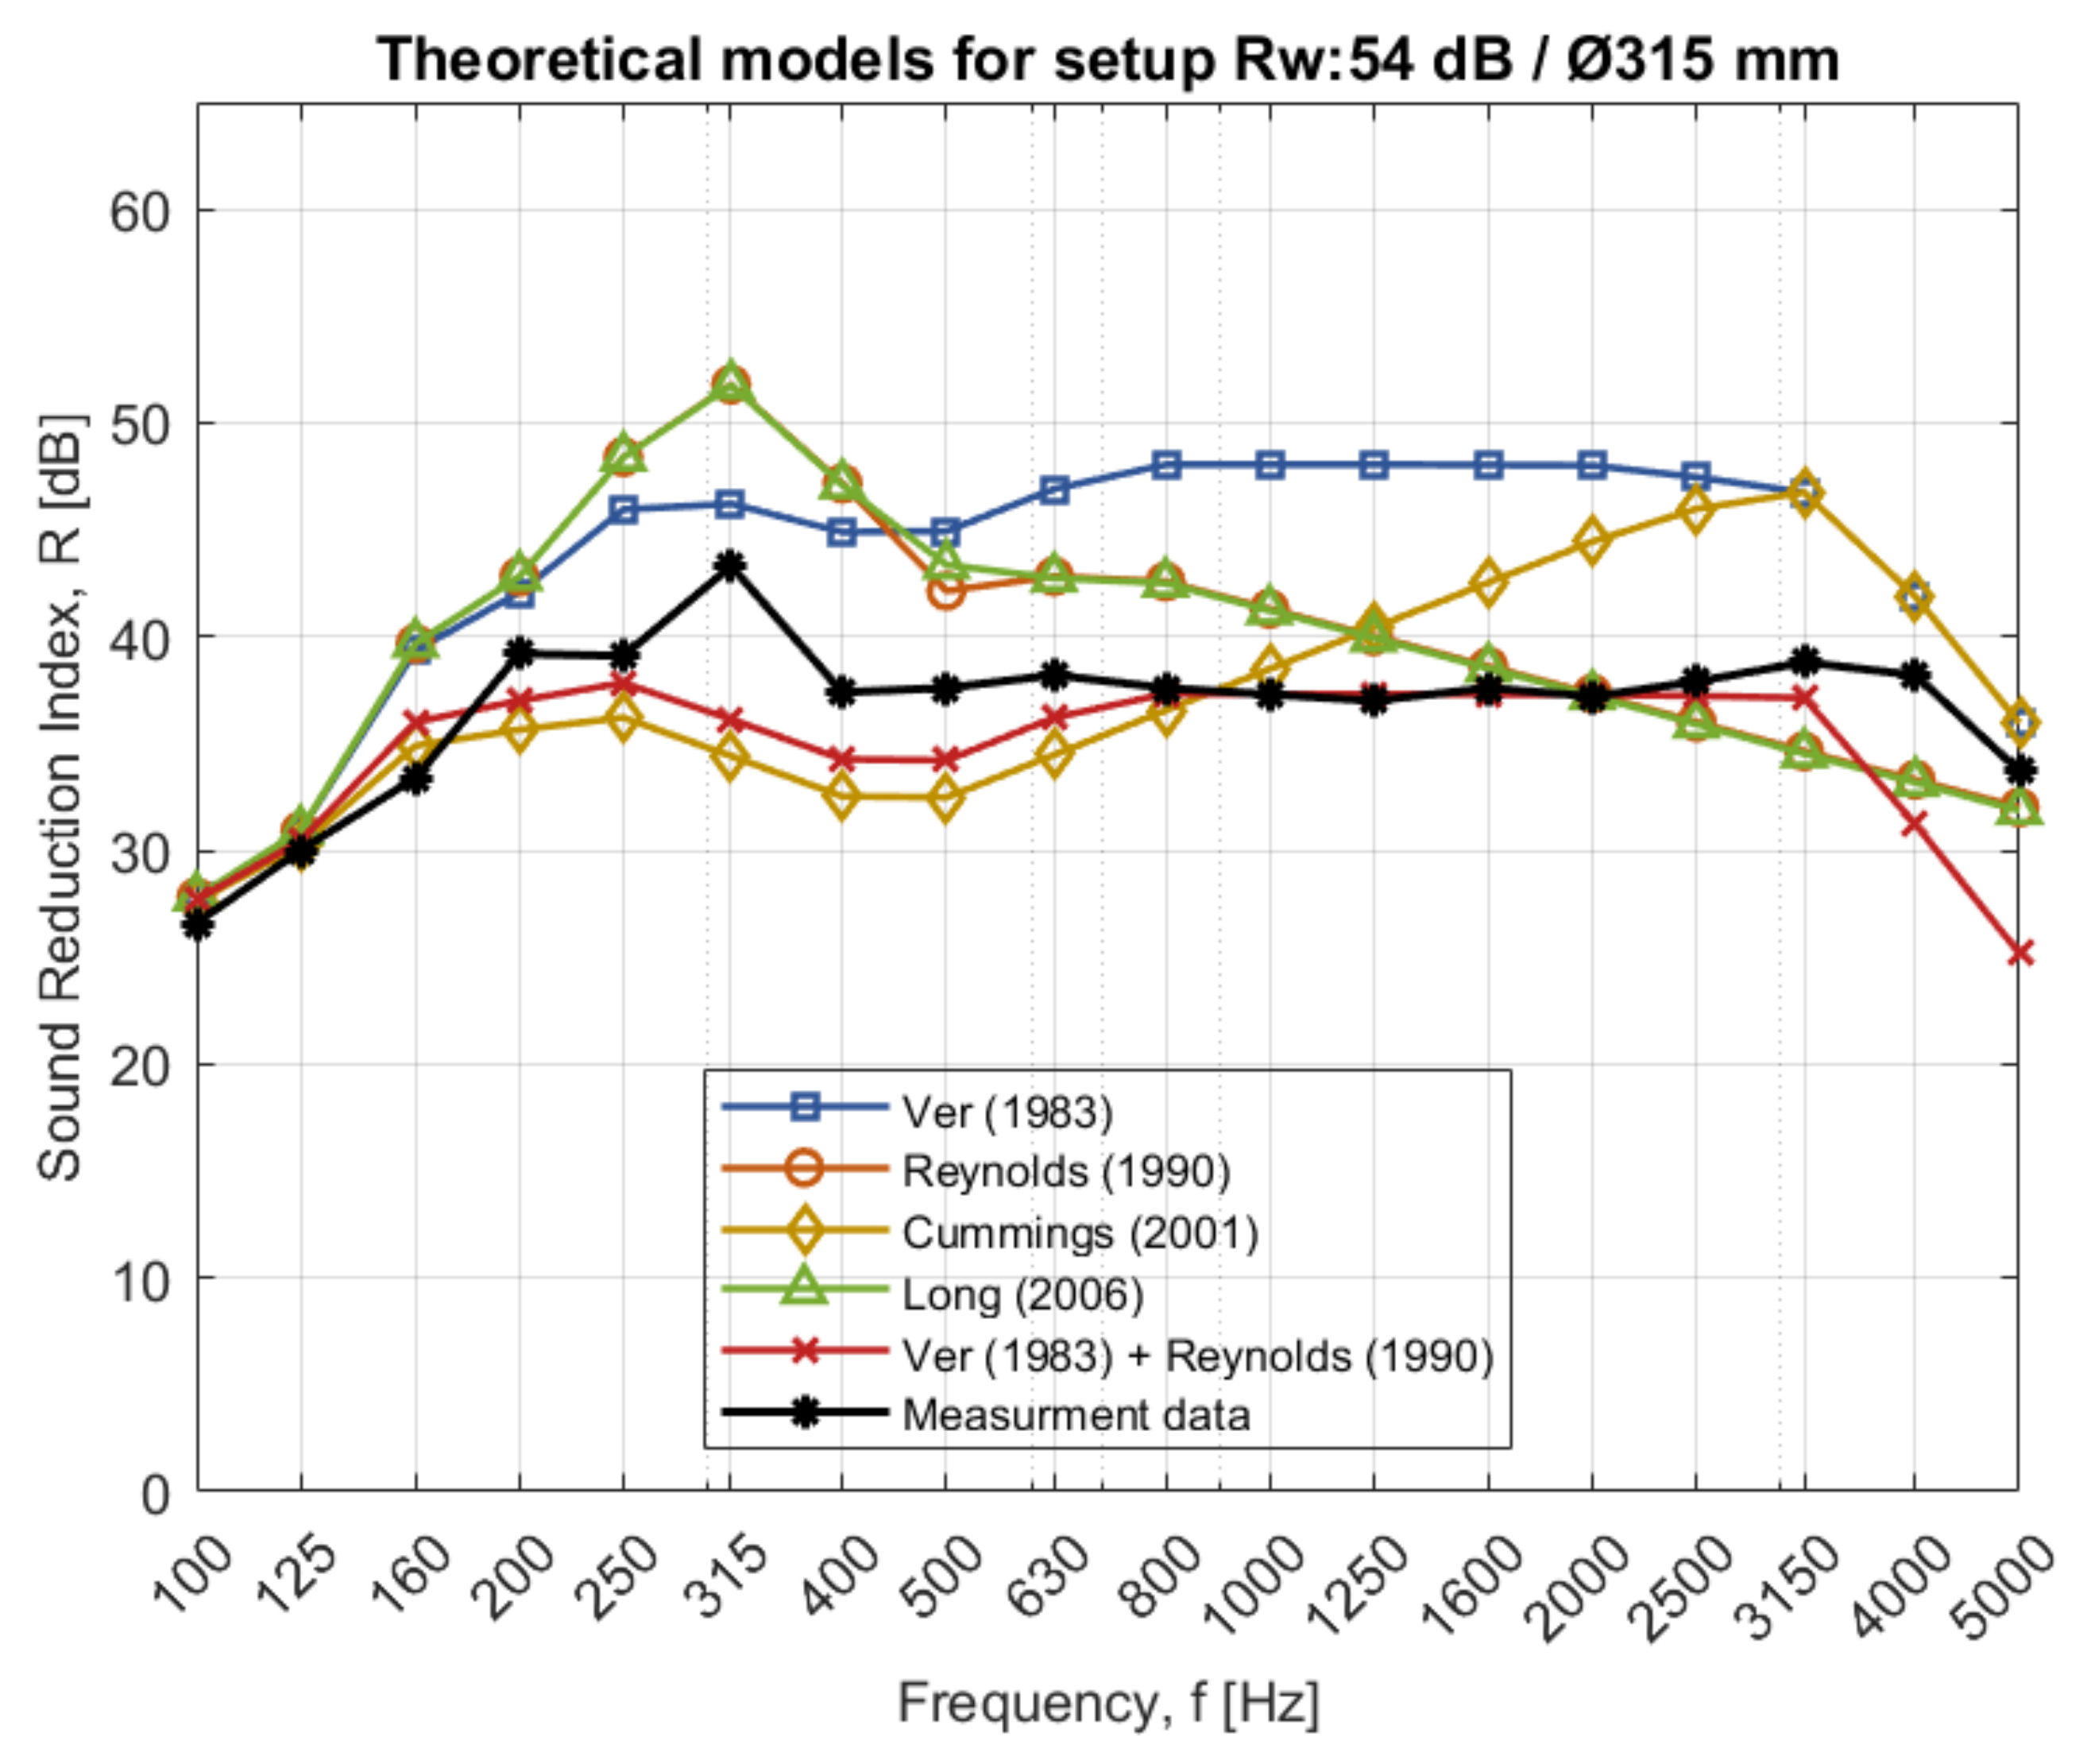
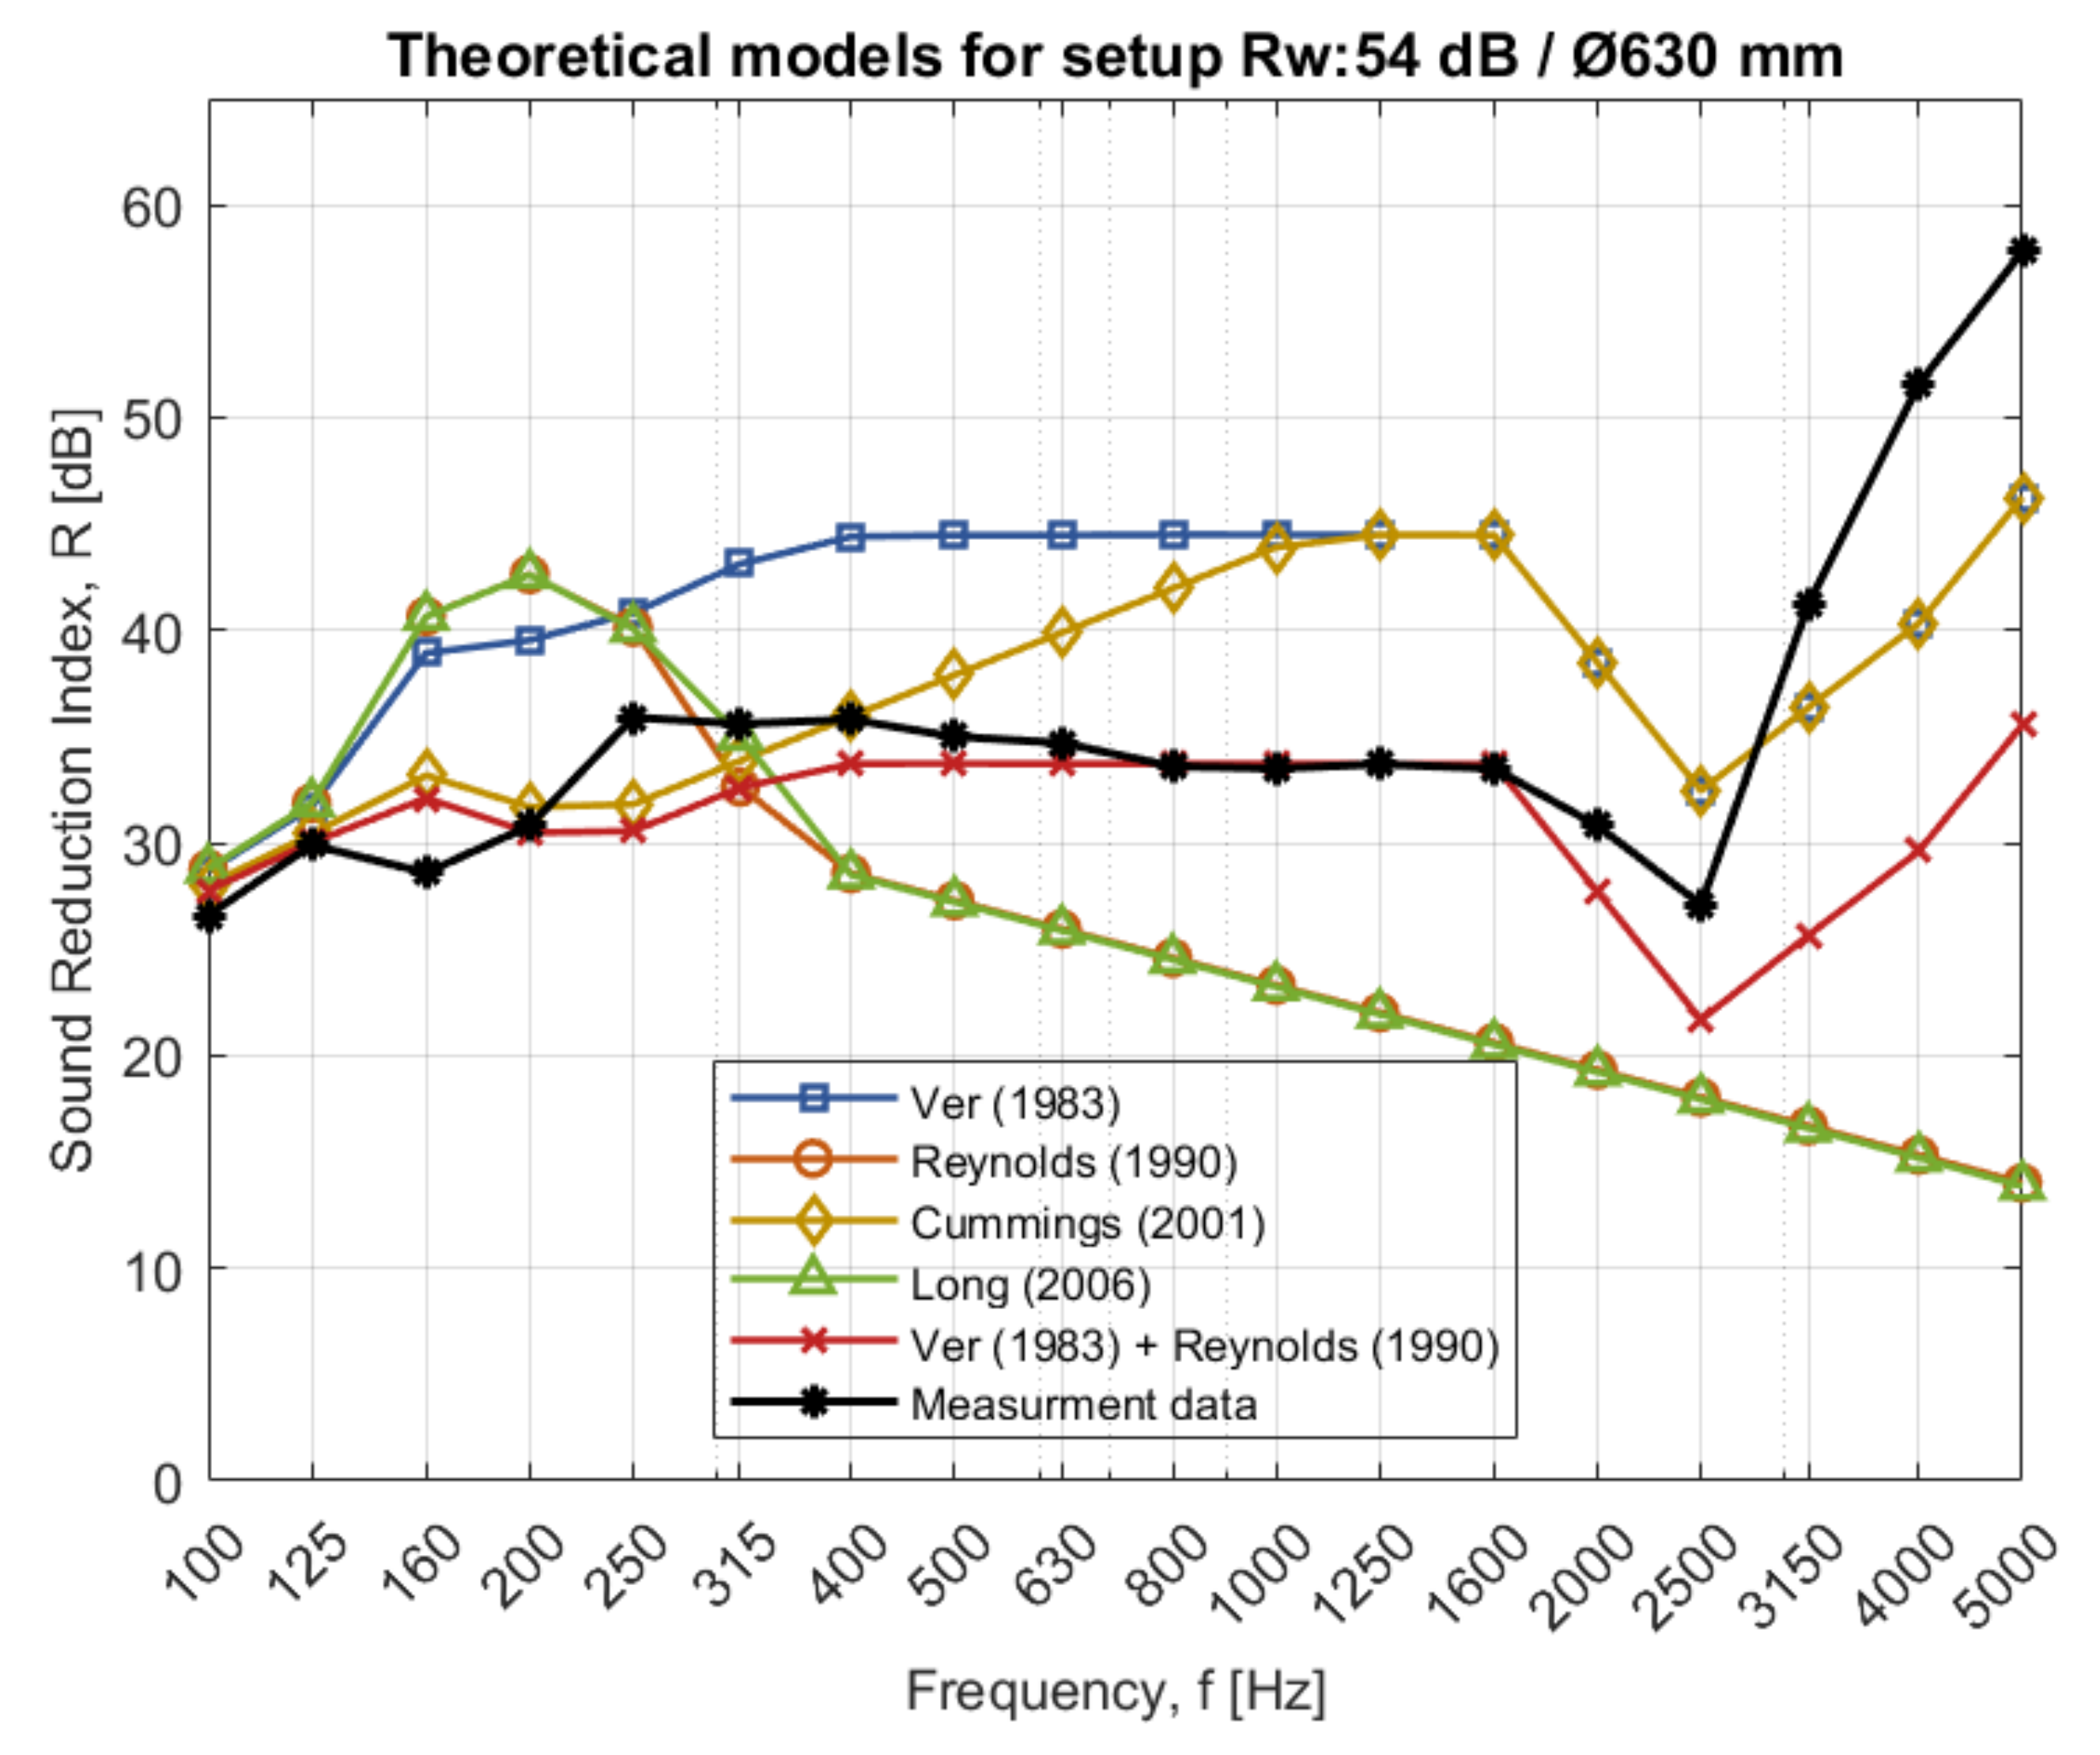
Comparing the existing theory to measurement data in
Figure 5,
Figure 6 and
Figure 7, several discrepancies can be observed. Some predicted curves for the circular ducts do not match the measurement data in either value or shape, as shown in
Figure 5 and
Figure 6 and
Figure A1,
Figure A2,
Figure A3 and
Figure A4 (
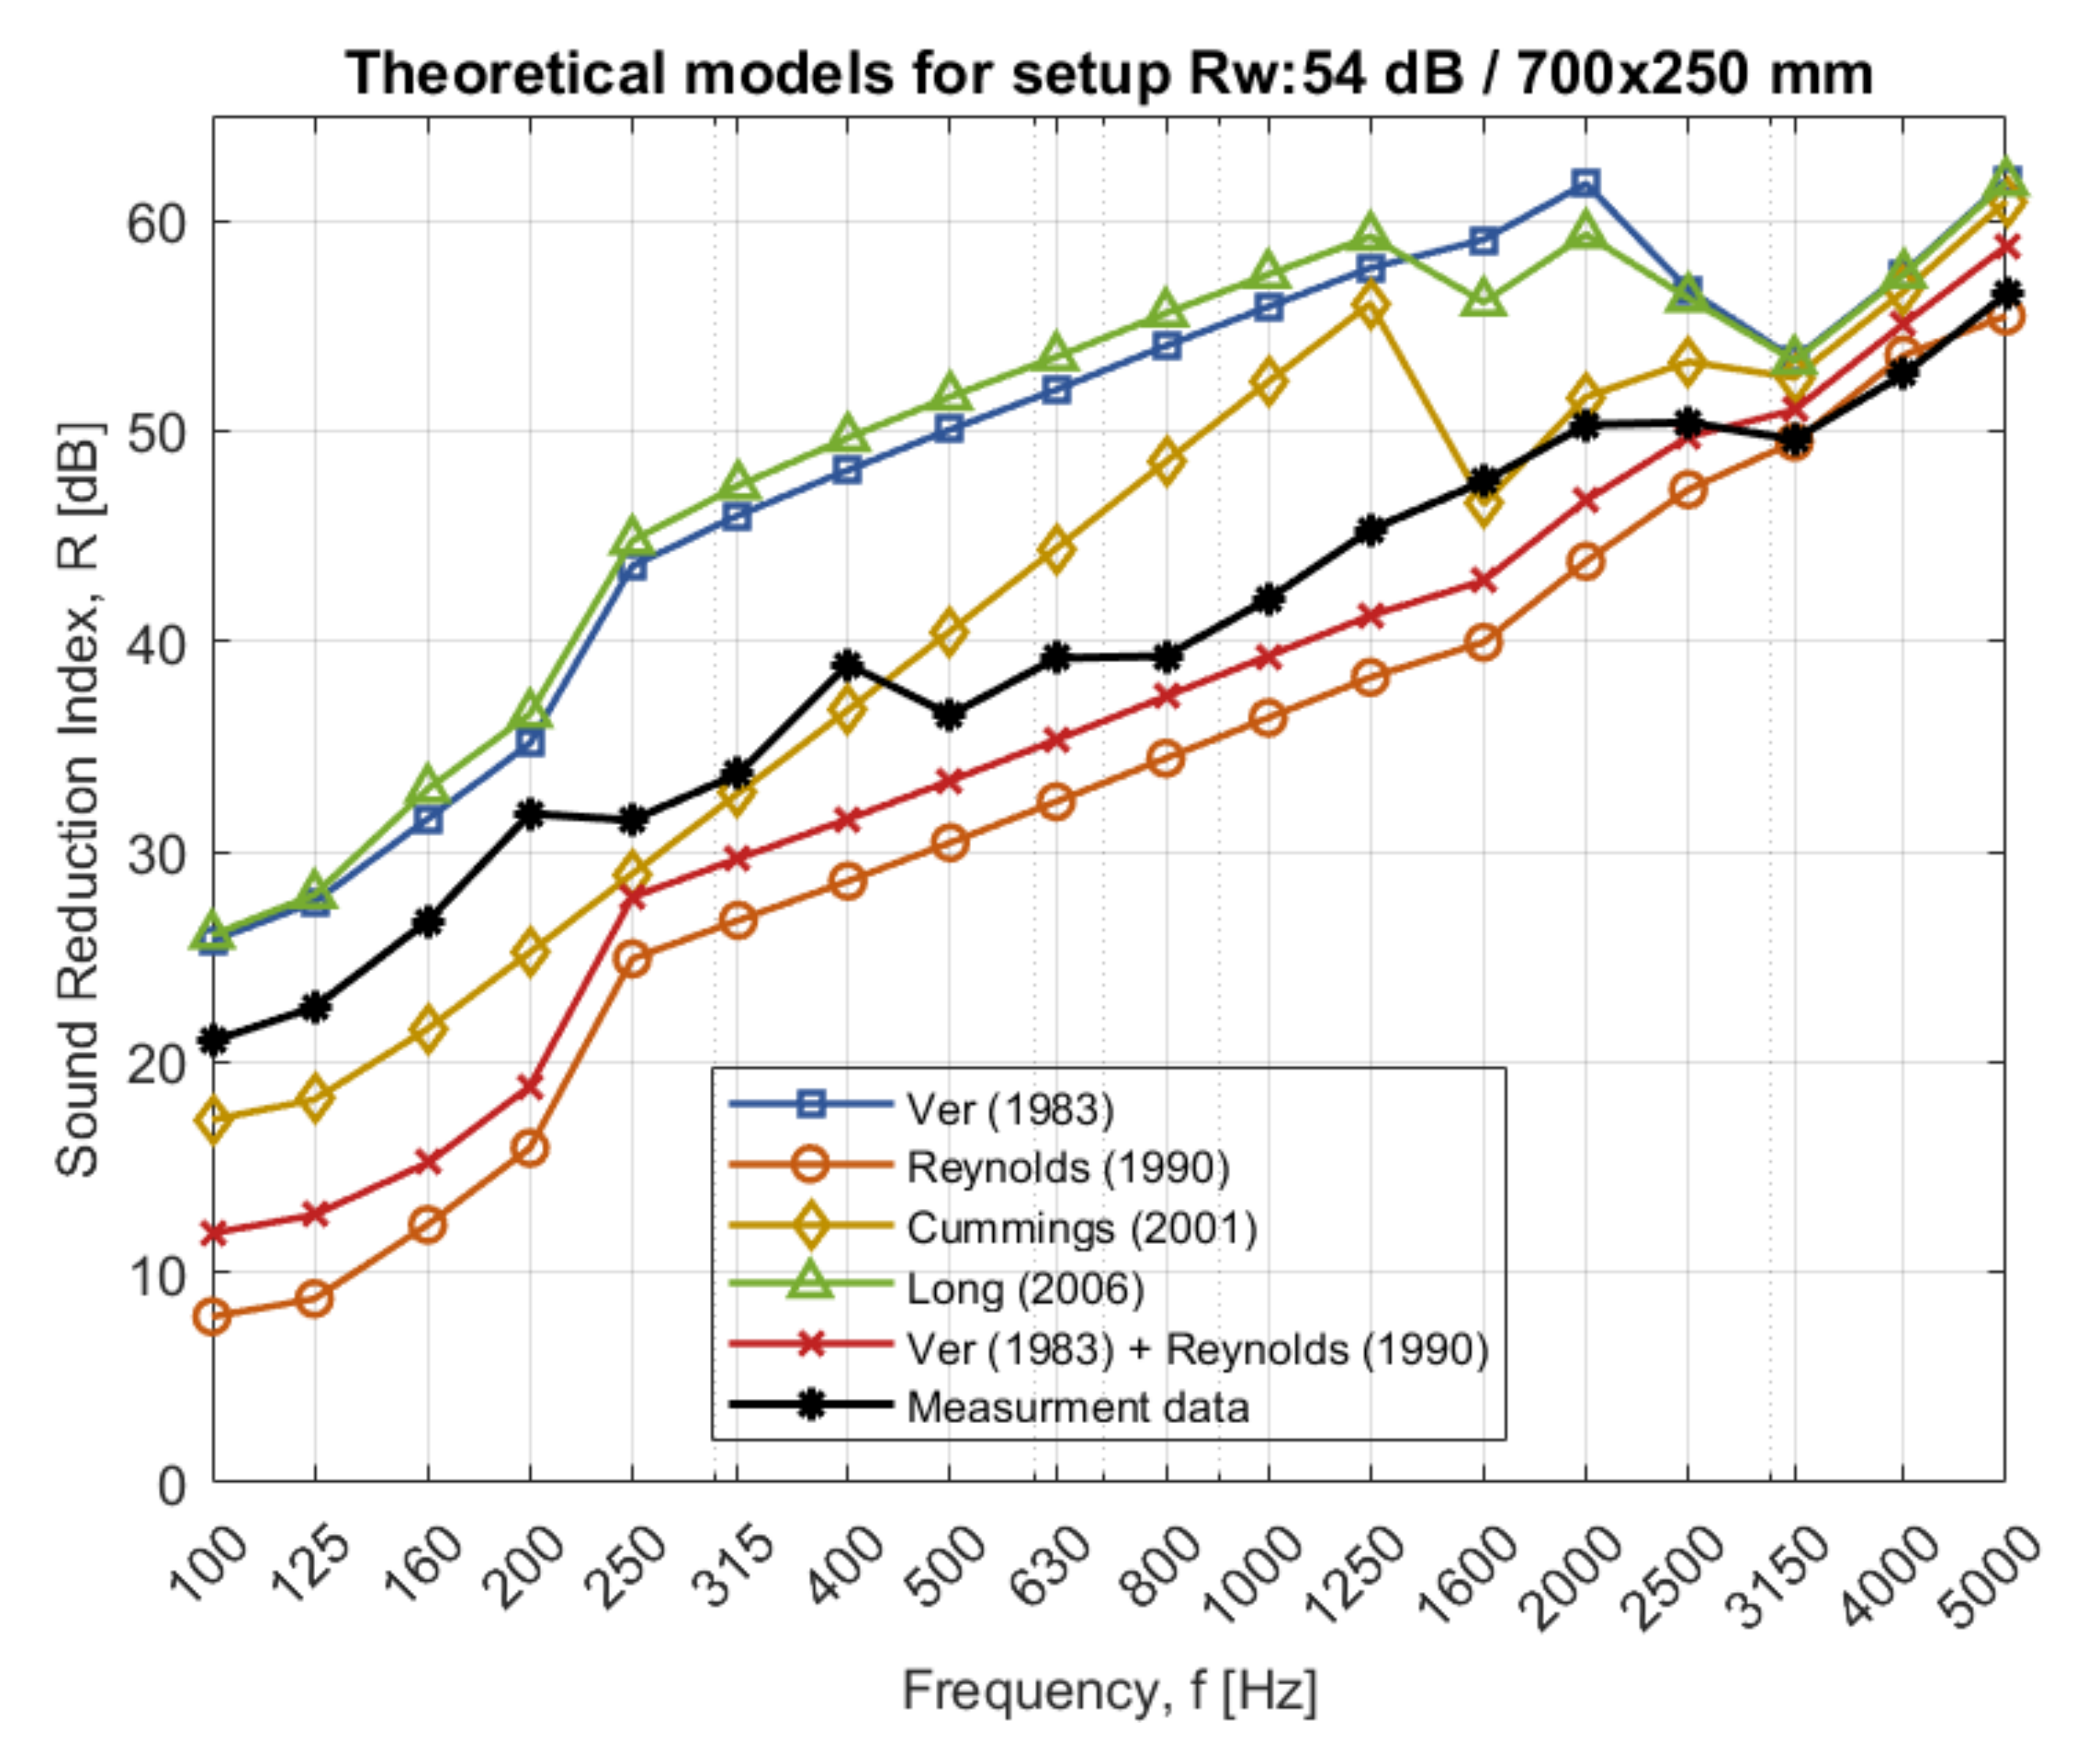
Appendix A). The theories are either overestimating or underestimating the sound reduction and the shape of the theoretical curves is inconsistent with the measurement data. However, by combining the theory regarding TL-breakout and TL-breakin according to Ver with the equations describing breakin and breakout for a system according to Reynold, consistency between measurement data and theory is fulfilled. Similar results can be observed for the rectangular duct through the different walls in
Figure 7,
Figure A5 and
Figure A6 (
Appendix A).
Only the theory according to Refs. [
5,
20] considers the ring frequency,
. The latter term refers to the frequency at which the longitudinal sound waves arrive just in phase after they have circulated an entire lap along the inner circumference of the duct which causes resonance effects [
5].
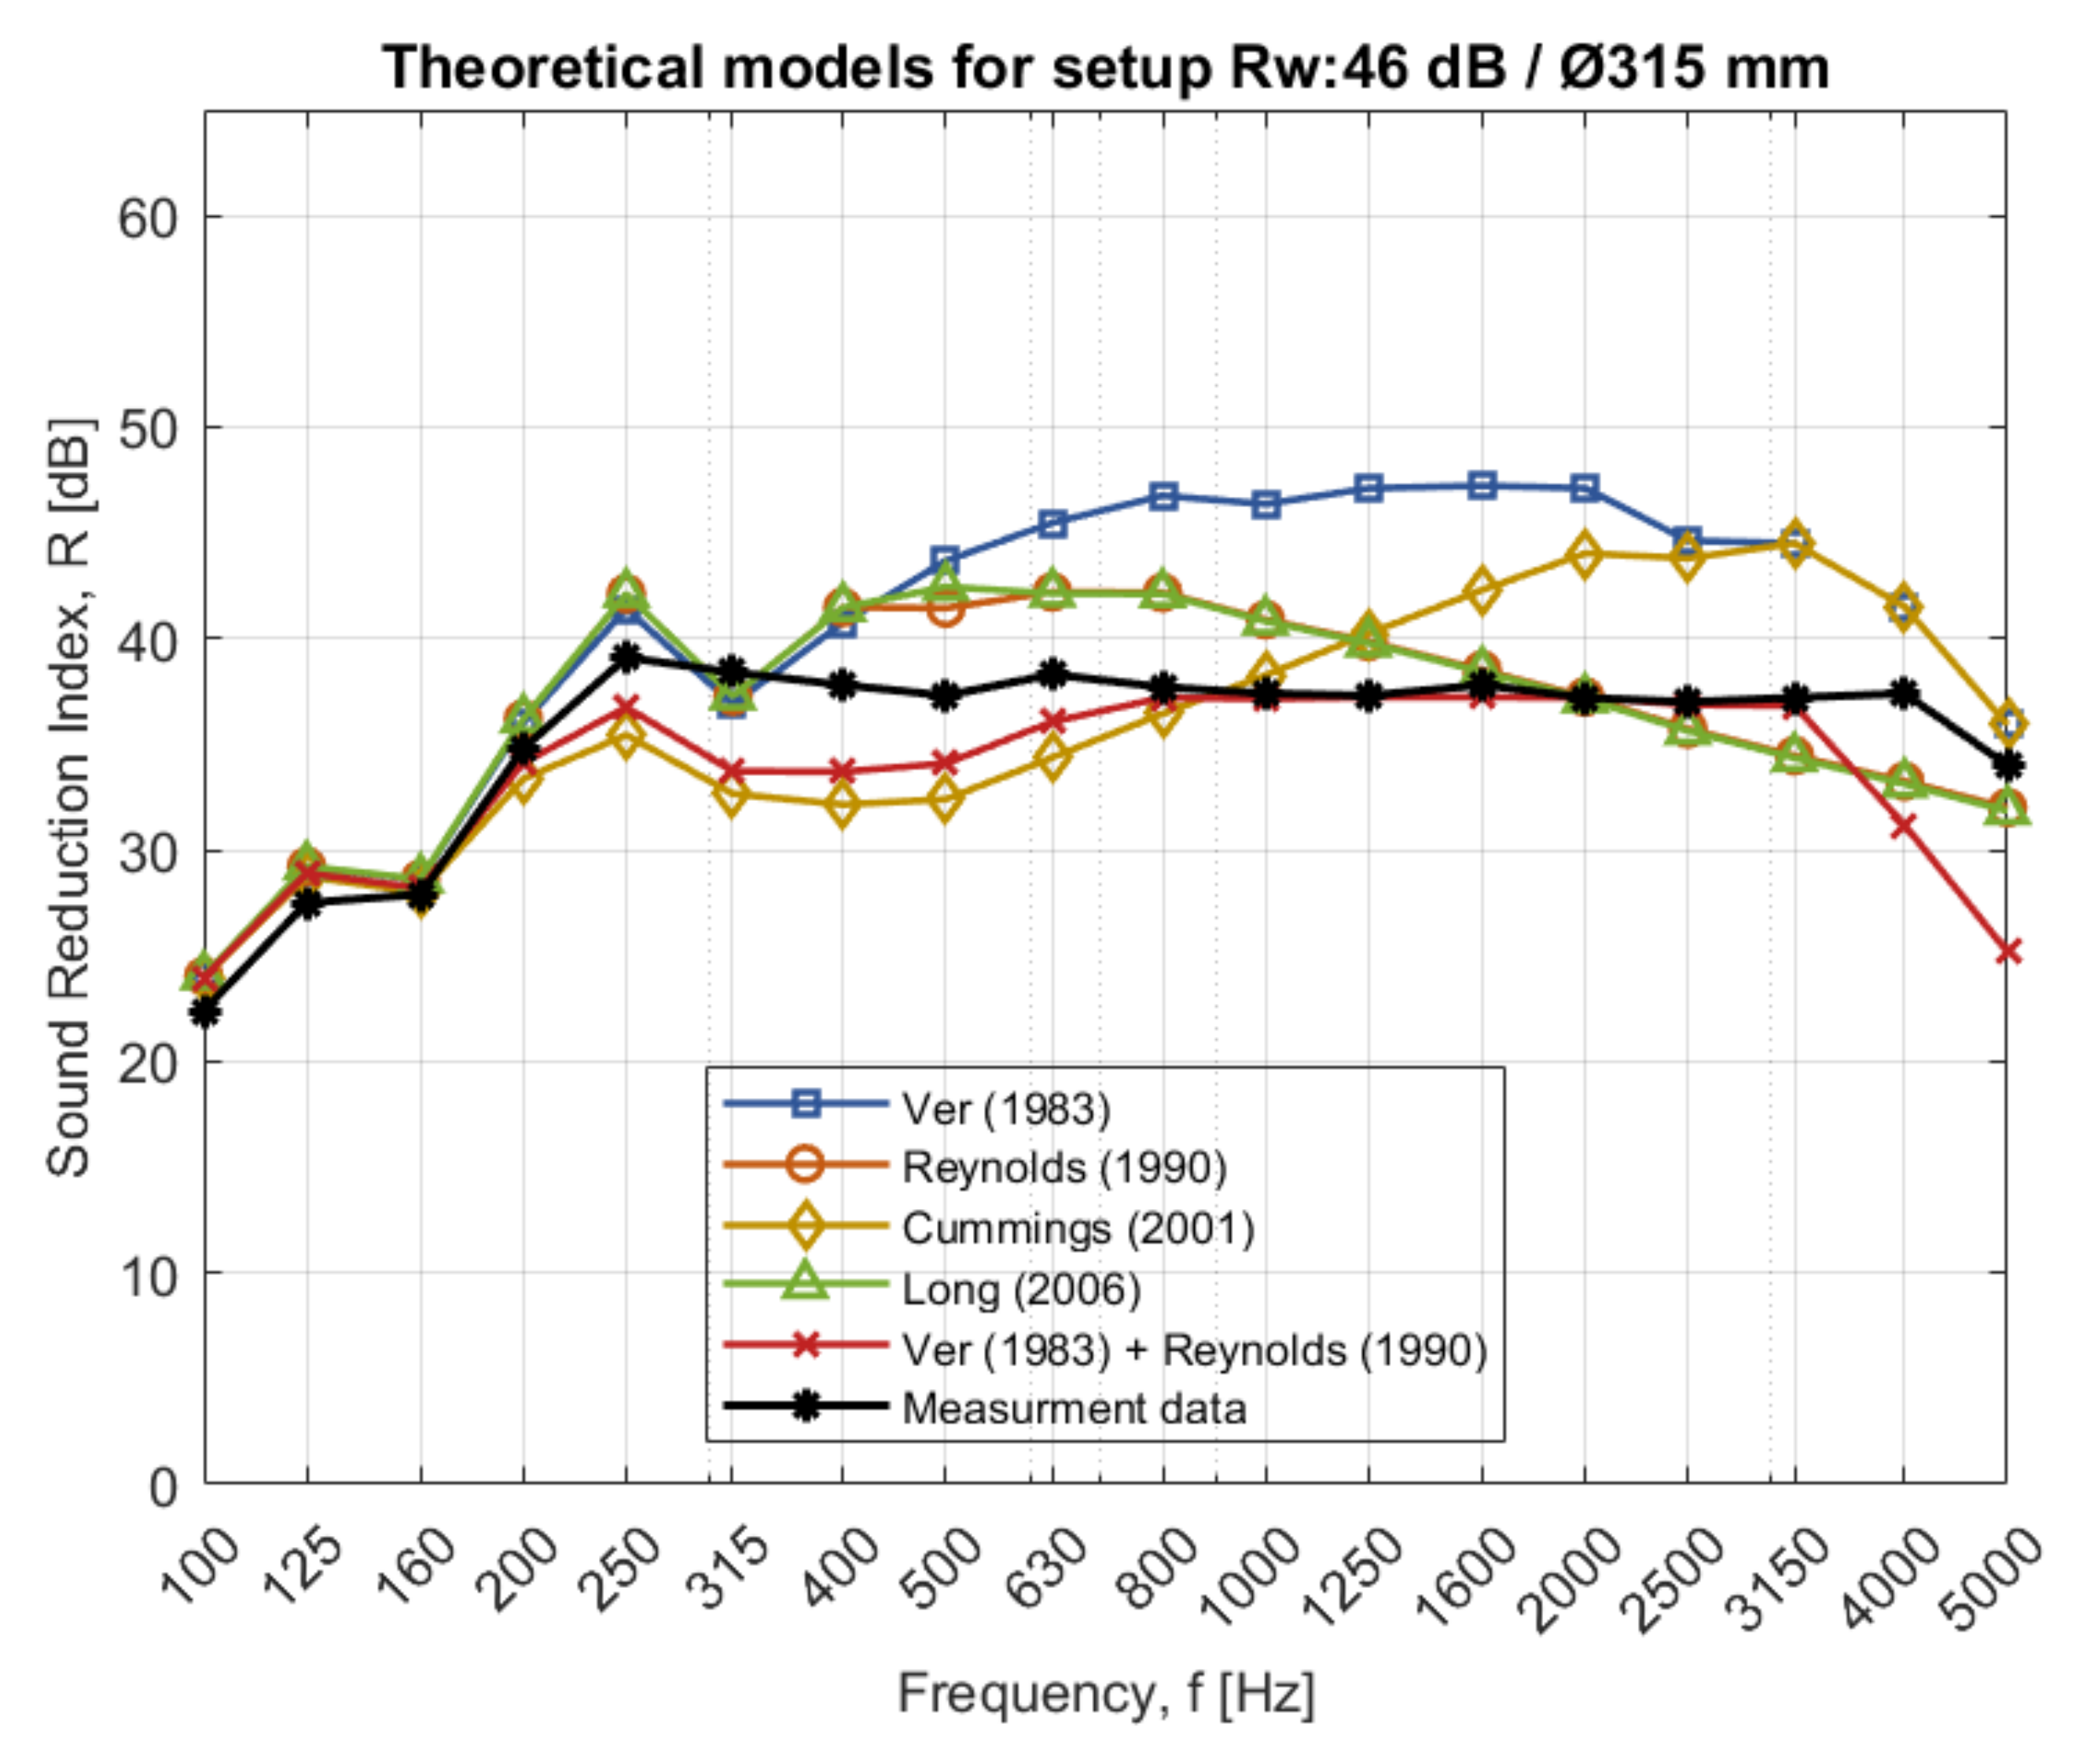
This study also considers theory from Cummings [
19] for both the rectangular and the circular ducts with different inputs. When the transmission loss for breakin from Cummings [
19] is added to Ver’s theory [
5] for circular ducts, the sound reduction curve increases with the frequency over the cut-off frequency,
, which is visually described in
Figure 6 (yellow line). The cut-off frequency denotes the frequency at which the lowest acoustic cross-mode occurs for a ventilation duct [
21]. Cross-modes are modes that excite standing waves inside the duct that oscillate in a direction perpendicular to the main flow velocity and the cylinder axis [
39]. The theoretical shape with the proposed model (yellow lines in
Figure 5 and
Figure 6) does not match the measurement data.
If the transmission loss for breakin from Cummings [
19] is combined with Ver’s theory [
5] for rectangular ducts, the sound reduction decreases (compared to only Ver’s theory) with a better match to the measurement data, specifically below 500 Hz (see Cummings (2001) in
Figure 7). However, these changes are not enough to describe the sound reduction index of ventilation ducts with adequate accuracy for all three configurations.
The current theories regarding sound transmission via circular ventilation ducts are, to some extent, insufficient when compared to measurement data. Thus, improvements are needed to better and easier describe the sound reduction for the ventilation duct. TL-breakout is calculated according to a prediction scheme from [
20] in reference [
5] that is not easily adapted. Instead, by studying the shape of the curves on both the theory and the measurement data, conclusions were made to decide the shape of the sound reduction curve for the ventilation duct. Further studies are required to deeper understand how the ventilation ducts behave acoustically for the circular ducts.
For measurement data of the circular ducts in
Figure 5 and
Figure 6, when only the sealant is applied, the sound reduction index tends to increase with the frequency up until the cut-off frequency,
. The increase is divided into two sections, one below the cut-off frequency divided by 1.9, named
and one above. Afterward, the sound reduction index seems to be constant with increased frequency until 5000 Hz in
Figure 5 or 2500 Hz in
Figure 6. Here, one can notice a significant linear drop over two-third of the octave bands followed by an increase of the sound reduction index once more. From measurement data, it was concluded that the drop is related to the ring frequency,
, of the ventilation duct. This is described by Refs. [
5,
16] for the transmission loss when sound breaks out and is confirmed for measurement data in the study [
6], as well when measuring the sound reduction index. The ring frequency can be calculated with the circumference,
, and the speed of longitudinal waves in the duct wall material,
, according to Equation (6), which depends on the density and modulus of elasticity of the material [
5,
40]. The ring frequency for the circular ducts, 315 and 630 mm, is calculated to 5100 and 2550 Hz. The identified points where a significant drop occurred were for the frequencies 5000 Hz (duct with Ø315 mm) and 2500 Hz (duct with Ø630 mm), which is close to the ring frequency for each dimension.
For the rectangular duct, the theory according to Reynold [
21], which includes theory from Refs. [
5,
8,
22], is adapted since it best describes the measurements with few deviations. The adaptation is described in more detail in Ref. [
6] where the theory is originally calculated according to the Imperial system. Modifications have been made between the theory in Ref. [
6] and this article.
Theories are developed, with the conclusions above, through an iterative process with the final result as the equations in
Section 5.1 and
Section 5.2 for circular and rectangular ducts which describe the sound reduction index for the ducts only. The newly developed equations for circular ducts have been evaluated together with the theory named Ver (1983) + Reynolds (1990) to test the impact of the different inputs that have not been tested in the laboratory. Changes have been made during the iteration process to make sure that the following equations suit a large number of different combinations.
5.1. Sound Reduction for Circular Ducts Based on the Proposed Theory
The International System of Units should be used with the equations in this section. Physical quantities and units are displayed in
Table A1 (
Appendix B). Before calculating the sound reduction for circular ducts, the cut-off frequency and the ring frequency need to be determined according to Equations (5) and (6) from Refs. [
5,
7]:
where
is the speed of sound in air,
is the diameter of the duct,
is as mentioned before and
is the perimeter of the ventilation duct. The sound reduction of the ventilation duct can be calculated according to the proposed theory in Equations (8)–(13).
When
:
where
is the cross-section area of the ventilation duct and
is the mass per unit area of the duct.
When
When
The newly developed theory matches measurement data for all six configurations when only a sealant is applied with minor deviations. For the weighted sound reduction index, the error between measured data and theory is 0–1 dB. Results are displayed in
Section 5.3.
5.2. Sound Reduction for Rectangular Ducts, Updates of Existing Theory According to Measurement Result
For the sound reduction of the rectangular duct, the theory is originally calculated with the Imperial system in Ref. [
6]. This article aims to describe calculations using the SI-system, factors have therefore been listed in
Table 1, which enables both systems to be used. Physical quantities and units are displayed in
Table A1 (
Appendix B). It is strongly recommended to use the SI-system when using the following equations. The equations describing the new adapted theory follow where
and
describe the longest and smallest dimensions of the rectangular duct cross section. Then, the surface area
and the cross-area
are calculated as Equations (14) and (15):
Before calculating the sound reduction for rectangular ducts, the cut-off frequency [
5] and the cross-over frequency [
21] need to be determined according to Equations (16) and (17). Plane mode transmission is dominant below
and above
, multi-mode transmission is dominant [
21]
It is important that
and
in Equation (16) uses the same length-unit (m and m/s or inch and inch/s). The sound reduction index is described in Equation (18):
The transmission loss when sound breaks out, , can be described as Equations (19)–(21) depending on if the frequency is below or above the cross-over frequency, .
If
with a rule that
The transmission loss when sound breaks in, , can be described as Equations (22) and (23) depending on if the frequency is below or above .
The internal loss factor,
, is calculated according to Equation (24) followed by Equations (25) and (26) and can be neglected if the length of the ventilation duct is small and specifically if the duct is unlined [
5]
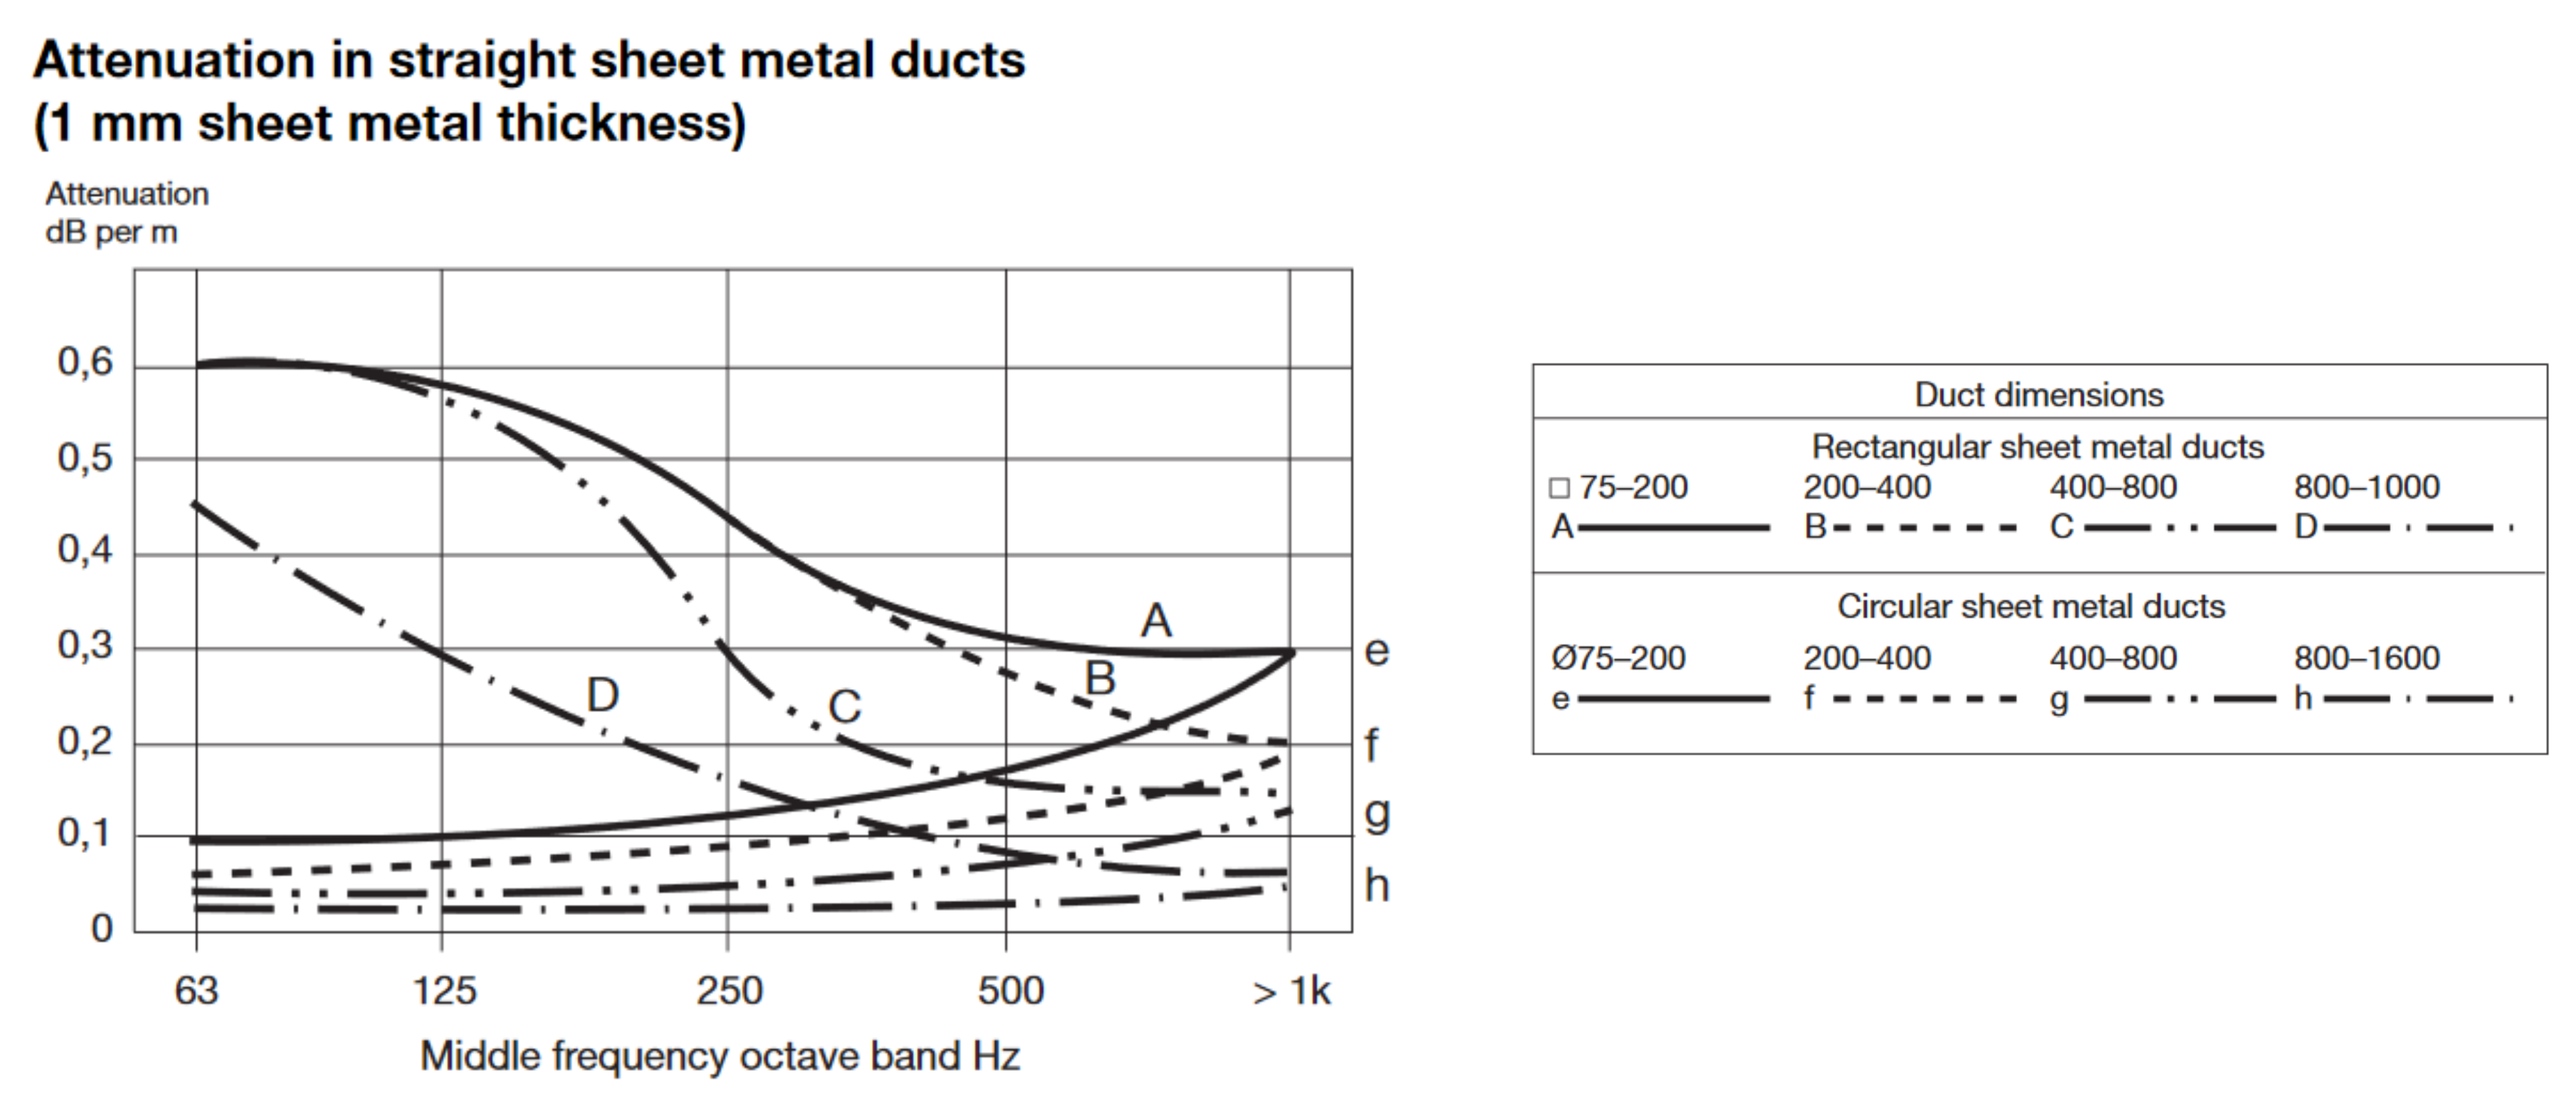
Finally, the sound attenuation per unit length in the duct,
, needs to be determined. The variable is dependent on the shape and size of the ventilation duct according to Lindab [
41] in
Figure 8 with the sound attenuation in dB per meter.
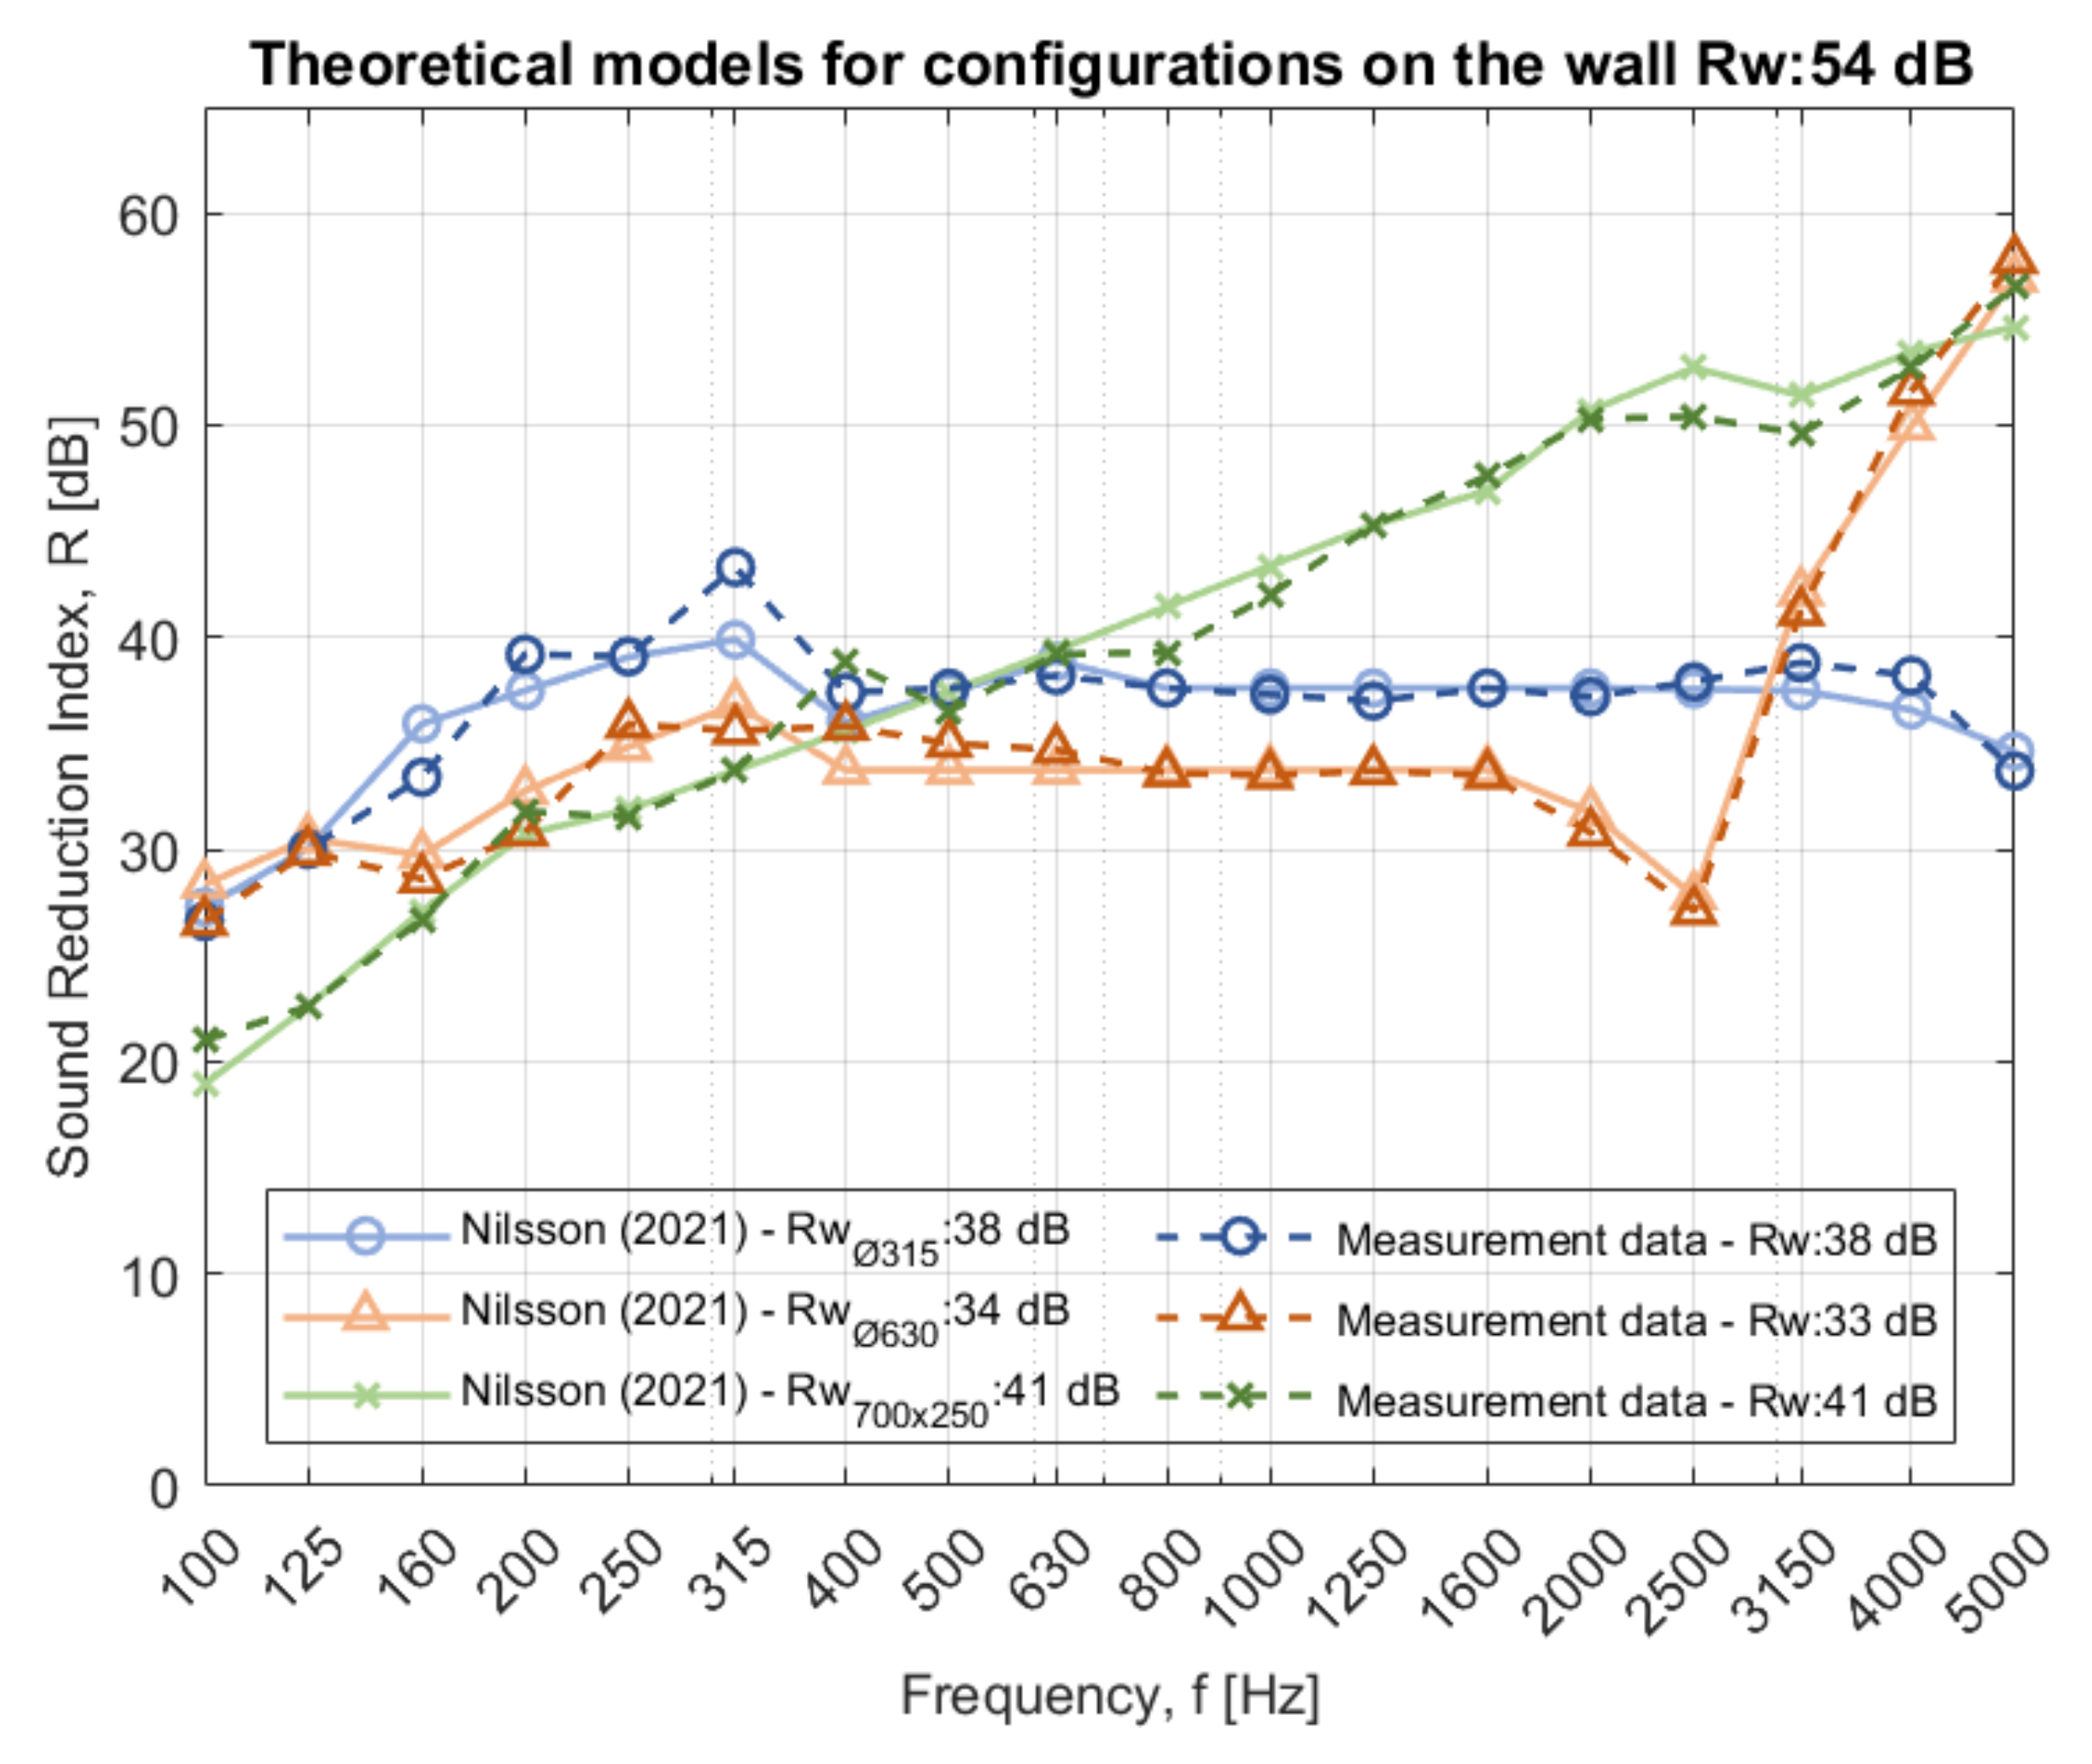
5.3. Measurement Result Compared to Developed and Adapted Theories according to Nilsson
The sound reduction for the three different ducts can be calculated according to equations in
Section 5.1 and
Section 5.2, which can be combined with the sound reduction of the measured reference wall with Equation (4). The proposed and adapted theories are compared with measurements when the duct goes through wall C when only a sealant is applied according to
Figure 9. The same precision is seen for the two other tested walls, A and B, which are displayed in
Figure A7 and
Figure A8 (
Appendix A).
6. Discussion
The new proposed theory for circular ducts is based on a few factors that have not been changed in the laboratory such as the length and the mass per unit area. Since the existing combined theory named Ver (1983) + Reynold (1990) matches measurement data to some extent (
Figure 5 and
Figure 6), it can be used to validate the newly proposed theory which makes it more secure to apply to actual buildings. By iteration, the proposed theory was compared with existing theories so that changes in length and mass per unit area have the same impact. The proposed theory for circular ducts does not consider the sound attenuation,
, inside the duct because it is considerably small for circular ducts, especially with the length that was tested in the lab. The factor could be added to the presented equations if wanted. The measurements indicate that the main factor parameter affecting the sound reduction is the length closest to the wall. This can be observed when treatment close to the wall is applied for wall A (with the lowest sound reduction index) as described in Ref. [
6]. It is therefore unlikely that a 20-m-long ventilation duct will have a larger impact than a ventilation duct with a length of 15 m since the sound will attenuate in the duct and breakout from the duct (mainly close to the wall). The length is considered in the equations to calculate the sound reduction of both the ventilation duct and the wall combined with the ventilation duct. That length parameter might need to be changed in the theory to a standard maximum length, which has to be determined and verified in the lab or in the field for various configurations.
The weighted sound reduction index does not increase significantly when changing the wall from a sound reduction index of 46 dB to 54 dB (namely wall B to C), see measurement data in
Figure A8 and
Figure 9. However, it changes between walls A and B as depicted in
Figure A7 and
Figure A8. This happens because the radiated sound from the ventilation duct is dominant compared to the wall. The ventilation duct thereby dictates the value for the sound reduction index for the walls with a higher sound reduction index. With this observation, it is concluded that calculations for walls B and C with a sound reduction index of 46 and 54 dB, respectively, are more valid than wall A with 35 dB. However, this could also mean that the proposed model is less accurate at predicting sound reduction when the difference in sound insulation between the ventilation duct and the separating wall is small.
When analyzing measurement data, differences between lab and field values should be considered. In the field, more variables affect the sound reduction than only the ventilation duct, which is why the lab and field values in the product datasheet differ. On the other hand, treatments that have been applied in the lab are optimized for a higher sound reduction than expected in the field for the same type of configuration. Therefore, the same treatments might not be needed on the ventilation ducts in the field to fulfill the sound reduction index that is required for the separated wall construction. This can be concluded from Equation (4) that describes the combined sound reduction for the wall and the ventilation duct. Another factor to be considered is the flow inside the ventilation duct. The lab measurements were made with a closed ventilation duct unlike the setup in the field where there is a flow of air inside the duct. This can have an impact on the sound reduction of the combined system, although Craik [
25] highlighted that the airflow does not have a practical impact on the system for airflow velocity up to 30 m/s.
When applying different treatments to the configurations in the field, the length of the ventilation duct needs to be considered. A direct application is assessed to work for the treatments where only part of the ventilation ducts are covered, 600–1200 mm on both sides of the wall. For more demanding treatments, the dimensions of the rooms must be considered, as well as the sound reduction of the wall. In a large room, parts of the sound power will successively attenuate and breakout with the length of the duct. However, if the sound reduction of the wall is high, the whole ventilation duct still might need to be covered with heavy stone wool regardless of the dimensions of the rooms and the length of the ventilation duct. The different treatments are demonstrated in Ref. [
6] for the nine configurations. Other treatments than wrapping the ventilation duct with stone wool may be more efficient for some configurations.
Several interesting aspects can be discovered when analyzing variations between rectangular and circular ducts. For wall A, 35 dB, applying a sealant is sufficient for the rectangular duct. For the circular ducts, stone wool was necessary to cover the surface area at a length of 600–1200 mm. The sound reduction curve for the rectangular duct increases relatively linearly with frequency, unlike the circular ducts. For the circular ducts, the sound reduction is constant with the frequency between
and
, which is also described in Ref. [
6]. The reason why a few simple treatments are needed for combination 35/700x250 is that the sound reduction curve for the wall is similar in shape and value to the sound reduction curve of the ventilation duct. If only the surface area of the duct is considered as a factor, then the same treatments (only applying sealant) should be enough for the larger circular duct (630 mm) and the rectangular duct since they almost have the same surface area/circumference (
: 1.98 m
2,
: 1.90 m
2). This is not the case because the shape and setup are different. For the rectangular duct, more connections are required as they do not come in large sections, usually between 1–2 m. Circular ducts usually come in sections of 3 m. Therefore, the rectangular ducts have more coupling connectors in their system than the circular ducts, which gives more sound attenuation via the material of the ventilation ducts. This could be a reason for the different needs of treatments between the different ventilation ducts through wall A. On the other hand, when increasing the sound reduction index of the wall to 46 and 54 dB (wall B and C), the same treatments are required. Further investigation of the measurement data leads to the following aspects:
The first interesting difference is the deviation of the sound reduction for the circular duct at the ring frequency. However, this factor has no meaning when the whole ventilation duct is covered with heavy stone wool.
The rectangular duct has a high sound reduction in the higher frequencies, one reason could be the higher damping in the system with more connectors, but for the middle frequencies, 160–1200 Hz, it is not as sufficient as the wall’s sound insulation.
For the circular ducts, the sound reduction curve is flat above the cut-off frequency. When the circular ventilation ducts are wrapped with stone wool, the sound reduction is successively increasing. However, the flat trend of the curve only shifts when the whole ventilation duct is covered with stone wool.
For lower sound reduction indices of the test walls, the rectangular duct needs fewer treatments than the circular 630 mm duct. When the sound reduction index of the wall increases, both the rectangular and circular ventilation duct needs to be covered completely since they are not sufficient in the middle frequencies and because of the ring frequency for the circular duct.
Instead of developing a new theory for circular ducts, the prediction scheme according to Heckl and Müller [
20] could be used or described with equations and thereby be adjusted as the rectangular duct theory. However, the prediction scheme seems hard to use since a graph needs to be shifted with outputs from equations. Therefore, another approach was taken in this study with iterations to match the measurement result for these ducts. A similar model for rectangular ducts cannot be developed with enough accuracy since measurements were only made with one sample size of the rectangular duct.
The frequency span for the measurements is 50–5000 Hz but the analysis and theories start from 100 Hz. Frequencies below 100 Hz were not considered since the frequency span of the standard regulation for offices and schools starts from 100 Hz in, for example, Sweden [
42]. Contrary to that, sound reduction for frequencies below 100 Hz is considered in Swedish dwellings [
43]. However, the diameter of the ventilation ducts in dwellings is often below 315 mm unlike offices, schools and hospitals where larger dimensions are common. Since ventilation ducts in dwellings have smaller diameters, they have less impact on the sound insulation. Therefore, the analysis starts from 100 Hz instead of 50 Hz.
7. Conclusions
The aim of the study was to model the sound reduction of a combined system with a separating wall and a ventilation duct through it.
A new theory is proposed for circular ducts, and it matches measurement data for a combined system with few deviations according to the proposed model. The same agreement between measurements and existing theory for rectangular ducts is yielded with some modifications, mainly for lower frequencies, together with the proposed model.
From measurement data, it is concluded that the part of the ventilation duct closest to the wall is the main factor affecting the sound reduction. For some configurations, it is enough to only apply stone wool around the surface area of the duct closest to the wall on each side but the reduction of sound insulation at the ring frequency only disappears when the whole ventilation duct is covered. The same treatments presented here and in Ref. [
6] may be dissimilar in the field since they are optimized for lab values. Wrapping ventilation ducts with stone wool yields effective results but other treatments can be more efficient for some configurations.
For lower sound reduction indices of the test walls, the shape of the ventilation ducts and the number of coupling connectors in the system are dependent and determine the type of treatments needed. For higher sound reduction indices of the wall, the surface area is the factor that controls which treatments are required.


