
Experimental Investigation of Wave Attenuation Using a Hybrid of Polymer-Made Artificial Xbloc Wall and Mangrove Root Models


Department of Civil Engineering, School of Architecture, Design and the Built Environment, Nottingham Trent University, Nottingham NG1 4FQ, UK
*
Author to whom correspondence should be addressed.
Eng 2021, 2(2), 229-248; https://0-doi-org.brum.beds.ac.uk/10.3390/eng2020015
Submission received: 6 January 2021
/
Revised: 10 May 2021
/
Accepted: 14 May 2021
/
Published: 7 June 2021
(This article belongs to the Special Issue Advanced Research in Hydraulics and Water Engineering)
Abstract
:Rising sea levels, strong wave currents and destructive human activities put coastal areas at risk of erosion and potential flooding. Several countermeasures have been introduced—both artificial and natural—to tackle the issue. This study investigated the effectiveness of the use of hybrid polymer-made artificial Xbloc walls and mangrove root models for protection against water waves. One Xbloc wall was made up of three Xbloc units stacked on top of each other and joined together using water-resistant tape. The artificial models were designed using SolidWorks and AutoCAD software, 3D printed, laser cut and then superglued. The experiment was conducted at Nottingham Trent University Laboratory with a varying combination of single/multiple Xbloc walls and mangrove root models. The change in the wavelength, height, celerity and period was observed for six different model arrangements. The results revealed a successful decrease in the celerity, height and wavelength, as well as the elongation of the wave period (one cycle time). The hybrid arrangement of one Xbloc wall and two mangrove roots provided the best protection, reducing the wavelength, celerity and height by 5.50%, 26.46% and 58.97%, respectively, and also delaying the wave period by 28.34%. The lowest attenuation in the entire wave parameters stated was observed for the arrangement containing only one set of mangrove roots model. Therefore, the wave attenuation using the combined action of 3D printed polymer-made Xbloc walls and mangrove roots was better, because it facilitated the dissipation of wave energy to a greater degree compared to the use of only Xbloc walls or mangrove roots separately.
1. Introduction
Erosion in coastal areas is influenced by physical features including rising sea levels, major wave events, and natural or man-made variations in the sediment supply [1]. Coastal protection can be achieved by using either hard (e.g., retaining wall) or soft structures (e.g., mangrove, coral reefs, etc.). Other functions of mangrove ecosystems in addition to erosion control include water purification and shelter for fish and other living organisms. The role played by mangrove forests during the Indian Ocean Tsunami in 2004 was reported by Hashim and Catherine [2]. According to The World Conservation Union, about 6000 deaths were recorded during the Indian Tsunami in a location without vegetation compared to the densely vegetated area, which had only two death cases. In areas of lower Tsunami intensity, mangrove forests significantly lowered the resultant damages, but did not prevent major destruction at the highest Tsunami intensity locations.
The influence of vegetation characteristics (mangrove species and density, forest width and structure) on the wave damping capacity of the mangrove was reviewed by Hashim et al. [3]. The variation of mangrove structural parts (sizes and forms) between species results in differences in their level of resistance to water flow, and complex root systems provide greater drag force. Based on the mathematical models, site measurements and direct observations, the findings revealed that better wave attenuation is attributed to denser mangrove forests. For thick and tall vegetation, narrower mangrove forest widths can be adopted for coastal protection. With respect to the influence of hydraulic conditions (water depth and wave height), in the case of mangrove areas, more leaves/branches are submerged at higher water depths, which further obstructs flow and in turn increases the wave resistance coefficient [3]. However, for unvegetated areas, the resistance decreased with an increase in the water depth. As for the incident wave height, the rate of wave attenuation varies linearly with the height at the mangrove-protected zone, but is independent of the wave height in no-mangrove zones. Table 1 summarises the contributions of mangrove plant characteristics and wave hydraulic features towards wave attenuation.
Moreover, according to Yoshihiro Mazda et al. [4], the rate of wave attenuation by Sonneratia sp. mangrove depends on the water depth as well as the height of the incident wave. With an increase in the water depth, a decrease in the wave attenuation capacity was observed in the area without mangroves. While in the case of the mangrove-protected zone, the wave attenuation rate decreased temporarily at slightly higher water depths before it later increased at deeper water depths. This was because, at shallow water depths, the shape of the Sonneratia sp. roots becomes narrower from the ground level upwards; as a result of this, the drag force due to the roots decreased when the water depth increased to the thinner section of the roots. However, when the water depth rises above the roots to the level of the branches and leaves, the resistance to the flow increases due to the additional drag from the widely spread branches and leaves. In addition, the species type and vegetation configuration also influence wave attenuation in natural environments [4]. Each species type has its unique hydrological functions and physical behaviour, which affects the entire system of wave attenuation. For example, Kandelia candel has no pneumatophores compared to Rhizophora spp. and Bruguiera spp., which have complex and bigger aerial roots [5]. With its absence of pneumatophores, and when the distributed mangrove density involved was high, the wave attenuation effect of Kandelia candel was constant with the increase in the water depth, unlike the case of Sonneratia sp. examined by Yoshihiro Mazda et al. [4], as explained previously. Likewise, as stated by Wolanski et al. [6], the resistance (drag force) to sea waves is affected by the configuration of the trunks and aerial roots (prop roots/pneumatophores). The large size and more complex root configurations provide a higher resistance to the sea flow.
Strusínska-Correia et al. [7] stated that, within a particular species type, the age and stiffness of the structural parts play a vital role with regards to the wave attenuation capacity. Mature (aged) trees are stiffer, more structurally stable and less susceptible to uprooting/breakage, the work also assumed a stiff structure parameterization for the trunk and root systems, but a flexible structure for the tree canopy [8]. The mangrove’s age defines its stem density, tree height and the diameter of the roots or trunk [2], and aged and bigger trees impose greater resistance to damage by waves. Mazda et al. [5] investigated wave attenuation capacity with respect to water depth for Kandelia candel; the results indicated small (0.01 to 0.03) and large (0.2) attenuation for young/sparse (half-year) and well developed (5–6 year old) mangroves, respectively. An experiment by Bouma et al. [9] on Spartina anglica (stiff shoots) and Zostera noltii (flexible shoots) subjected to similar waves and currents revealed that the hydrodynamic forces dissipated were about three times less in vegetation with flexible leaves compared to stiffer-leaved vegetation. Stiffer vegetation which does not bend with the water flow has higher drag and is more sensitive to hydrodynamic forces.
A study by Hoque et al. [10] analysed the irregular wave attenuation performance of mangrove forests with respect to the coefficient of wave dissipation, reflection and transmission. The experiment was conducted using a Twin Wave Flume (TWF); the larger flume contained installed parameterized Rhizopora sp. mangrove trees, while the smaller flume didn’t. Because of the complexity and density of its root system, Rhizophira sp. is significantly effective in terms of reducing tsunami-induced flow [7,8]. Within the forest region of the flume, the wave energy reduces exponentially, and the magnitude of the dissipated energy decreases from the vegetation’s front towards its end (with more attenuation at the mangrove front). It was also found that, for a given relative water depth (h/L), the transmission coefficient decreases while the dissipation coefficient increases with increasing forest width. However, only little changes were observed with respect to the reflection coefficient for increasing forest widths.
With the aim to optimise the coastal protection, Delta Marine Consultants (DMC) developed a new armour unit (the Xbloc), which has improved fabrication and reduced concrete demand while maintaining high structural and hydraulic stability [11]. During the Xbloc’s development (2001–2003), the performance of single-layer armour units was studied in detail [12]. Other single-layer blocs which have been applied to breakwaters include Accropode™ (120 applications since 1980) and Coreloc® (executed 16 times since 1996). There have been no well-judged criteria for the determination of the structural strength and placement quality of Xblocs; the most attention was given to their hydraulic stability instead. The results of structural analysis from prototype drop tests and 3D finite element modelling conducted by Muttray et al. [12] showed that structural strength of Xblocs and Accropode are similar, while the Coreloc® is weaker. Extra design parameters have been proposed in order to assess the ease and placement quality, and to evaluate the risks of inappropriate placement. The three parameters are the pull-out force, target and stability packing densities. In a similar study by Oever et al. [13], another parameter—known as the Potential Interlocking Coefficient (PIC)—was presented. The essence was to address the issue of distortion in horizontal and upslope distances during Xbloc placement.
Van Zwicht [11] analysed the influence of the concrete’s specific weight on the hydraulic stability of Xbloc units, and also checked which structural parameters can be correctly used to define the mathematical expression of the stability number (). It was concluded that, in the absolute sense, as the specific weight increases the hydraulic stability increases, but when the influence of different slopes is to be considered, the following information was derived from the model tests conducted. The increase in stability observed was more than the expected results from the existing expression for slopes of 2:3 and steeper, and less than expected for a 1:2 slope. This is in the case for heavyweight concrete only. However, for light and normal weight concrete (at slope 1:2), the stability was close to the expected results given by the existing expression. As a result of this variation in stability with slopes, and give that the existing expression did not provide for it, Van Zwicht [11] proposed new expression that takes into account the effect of both the slope angle and the specific weight.
The stability of armour bloc units during coastal protection depends on their shape, packing density and placement pattern (random or ordered) [14]. Single layer interlocking armour block units including Accropode® and Xbloc® are vulnerable to damage by oscillation. This early stage of damage occurs when the block units oscillate due to poor base or unsatisfactory interlocking, causing changes in their equilibrium position. In order to address the difficulties associated with the mentioned armour blocs, Safari et al. [14] examined the newly developed armour unit ‘The Starbloc®’, which consists of a central hexagonal core, three ‘legs’ and two ‘noses’. Its design features facilitate better performance, easy placement and high hydraulic stability. The bloc was arranged in shipshape and random placement patterns, with 0.64 and 0.60 packing densities, respectively. The aim of the placement patterns was to find the best favourable stability for the utmost interlocking of the blocs and the optimum armour layer porosity. The results from this experiment revealed very high hydraulic stability for the shipshape placement in comparison with random placement. In addition, the series of tests conducted showed that Starblocs® arranged in shipshape pattern had no better stability compared to other single-layer armour blocs for design criteria . Its stability was defined by its own weight and good interlocking.
An improved version of the Xbloc, known as XblocPlus, was introduced to the public in 2018, 15 years after the release of the original Xbloc [15]. Unlike other single layer blocs which are placed in random orientations, e.g., Xbloc and Accropode™, the new XblocPlus was designed to be placed uniformly. It combined the advantages of both randomly and uniformly placed single-layer armour units, including efficient material use and fast placement, etc. When applied to an uneven underlayer or an irregular slope during the trial tests, the XblocPlus maintained both its interlocking property and hydraulic stability. It also demonstrated good stability on straight and curved sections of breakwater for normal and oblique waves. In 2019, it was applied to the Porto Albania Marina and Afsluitdijk projects in Albania and The Netherlands, respectively.
This research is limited to finding the influence of a hybrid of polymer-made artificial Xbloc walls and mangrove root models on wave characteristics at a laboratory scale. The work is expected to examine the effectiveness of the use of Xbloc walls combined with mangrove roots in comparison to each model being used separately for coastal protection. Artificial models were selected in this study in order to allow for control over the mangrove structural configuration, and to scale down real roots to a smaller size that can be accommodated by a 5 m flume tank.
The outcome of this experiment is expected to provide insight into the concept of the protection of coastal zones against destructive sea waves. Therefore, with real life bigger mangroves and concrete Xblocs, the practical expectations are a decrease in the number of causalities and damage to infrastructure and homes along shorelines. In addition to the flood defence function, the combination of mangrove roots and Xbloc walls could serve socioeconomic and environmental functions by giving habitats for aquatic life, and by providing tourist attraction and safe environment for economic activities. The nature of the hybrid system is such that the costs are minimised by using mangrove plants combined with Xblocs, instead of constructing more expensive sea walls and other non-sustainable defence measures.
This study analysed the effect of Xbloc walls and mangrove roots on the wavelength, height, celerity and period of waves using a 5 m flume.
The following objectives were set for the experiment:
- To fabricate polymer-made Xblocs and mangrove root models, and to examine their wave attenuation capacity.
- To analyse the wave damping by polymer-made artificial Xbloc walls and mangrove roots.
- To examine the efficacy of the hybrid polymer-made models on wave damping.
2. Materials and Methods
2.1. Design and Modelling
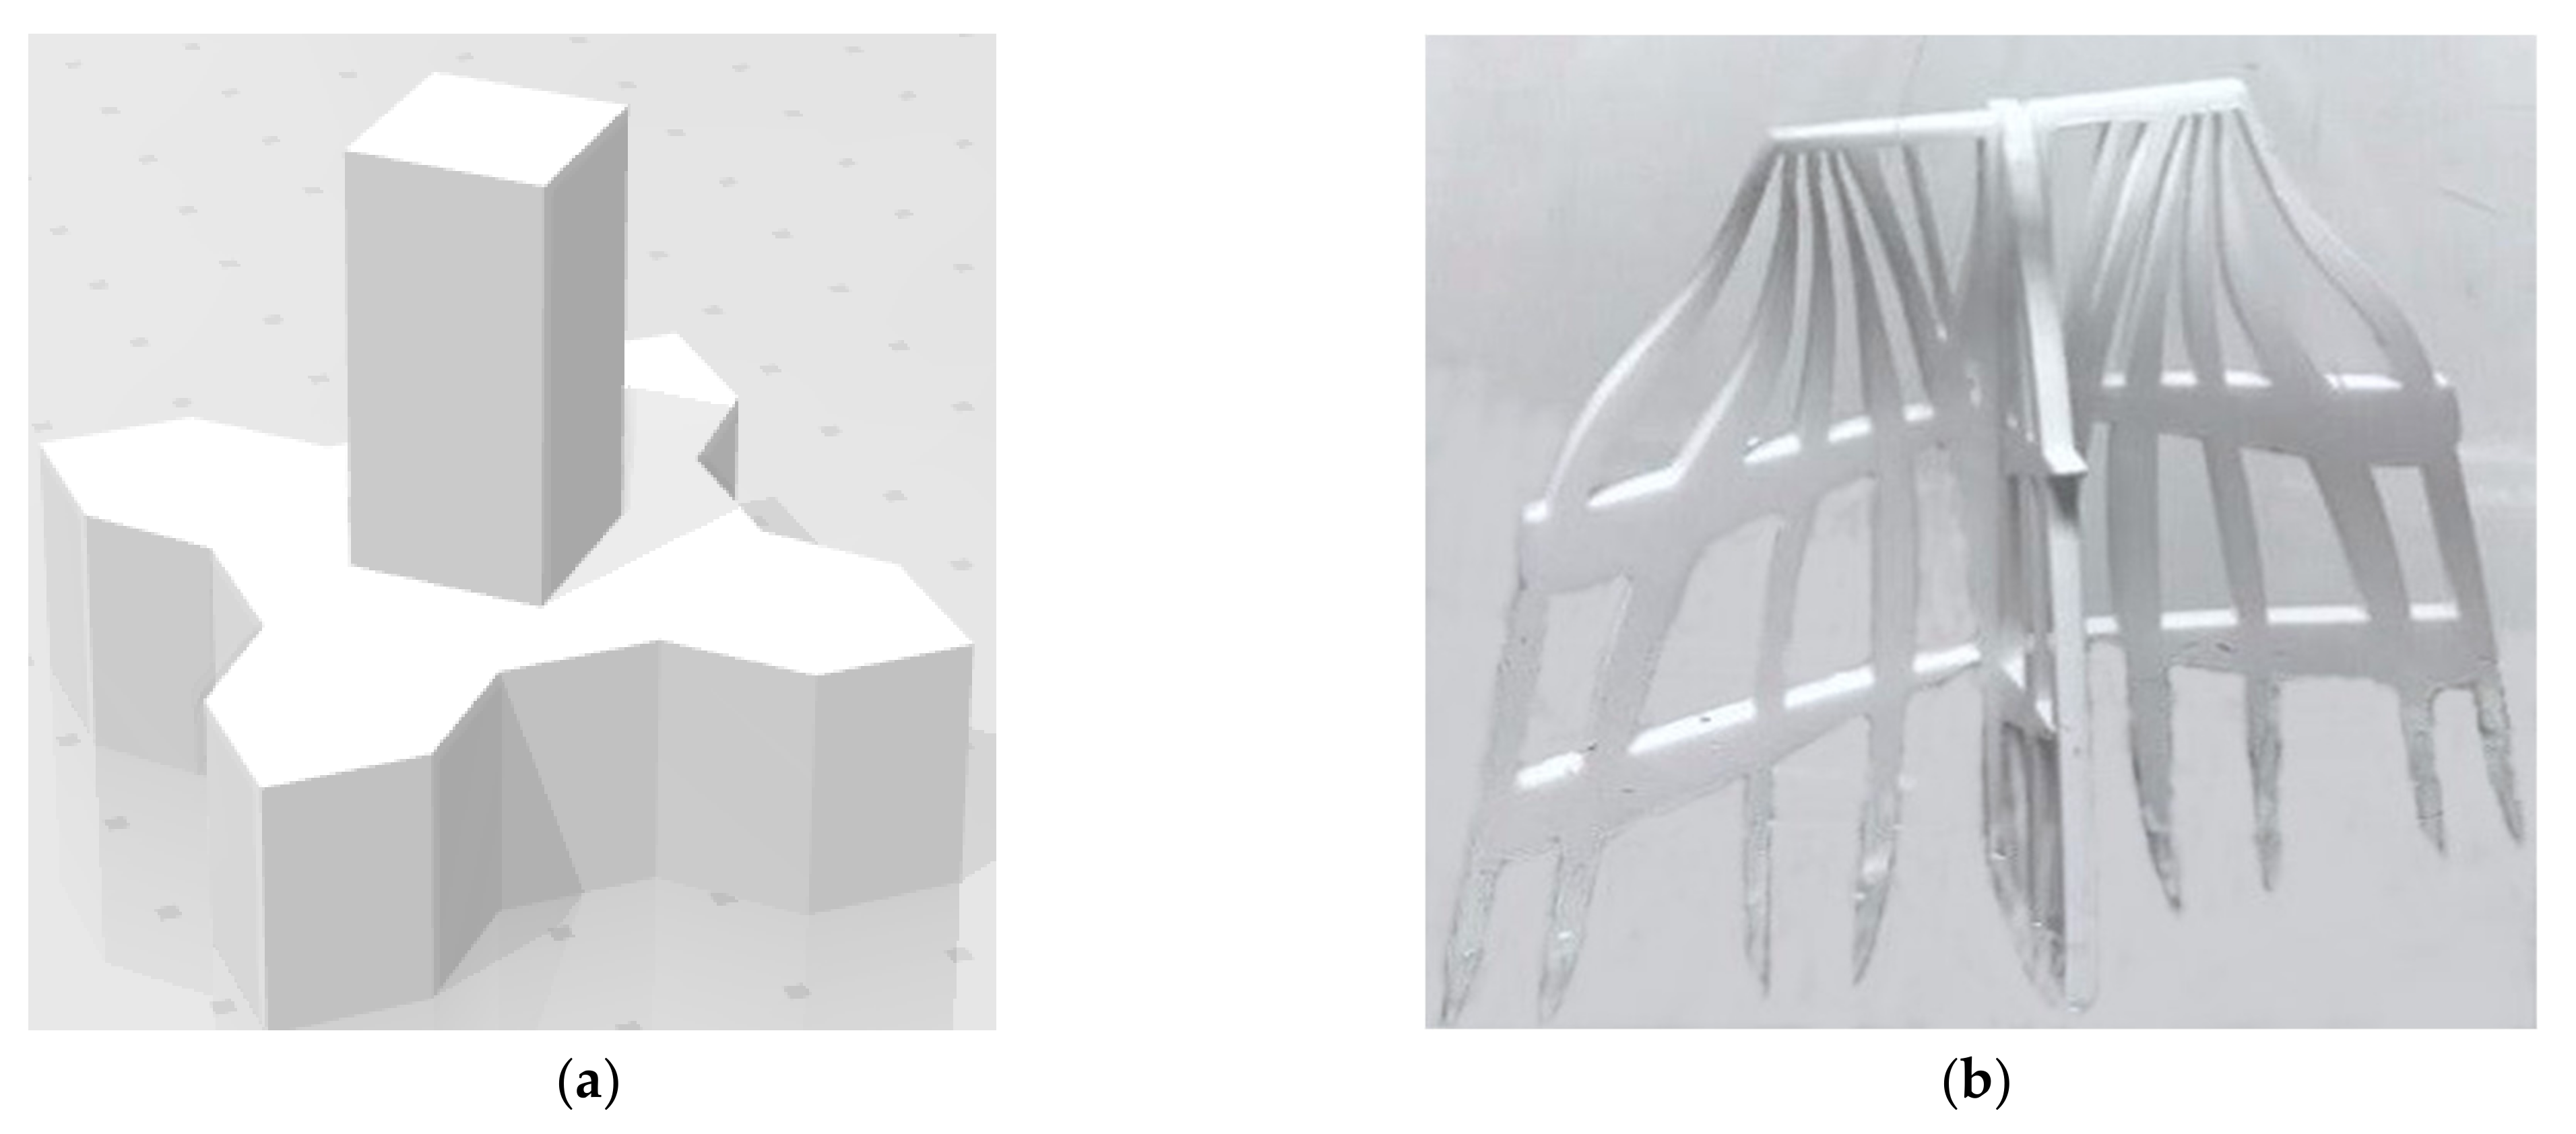
The models of the Xblocs and mangrove roots for this experiment were fabricated from plastic and acrylic polymer materials, respectively. The fabrication was aimed at optimising the models’ impact on the wave attenuation. The design was made using SolidWorks and AutoCAD software, and was 3D printed, laser cut and superglued in the pattern shown in Figure 1.
The dimensions (height and width) of the models are 50 mm by 50 mm for the Xblocs and 120 mm by 60 mm for the mangrove roots. The Xbloc design was symmetrical, in order to allow the creation of a continuous wall by stacking multiple Xblocs on top of each other; a 25 mm-long extruded stand was constructed at the center of the Xbloc to provide extra support and inclination to the ground. The roots’ height (120 mm) was chosen to ensure a significant influence on the wave. A lot of trial and error was conducted to meet the optimal wave characteristics and to ensure that the models fit properly into the flume tank.
2.2. Materials
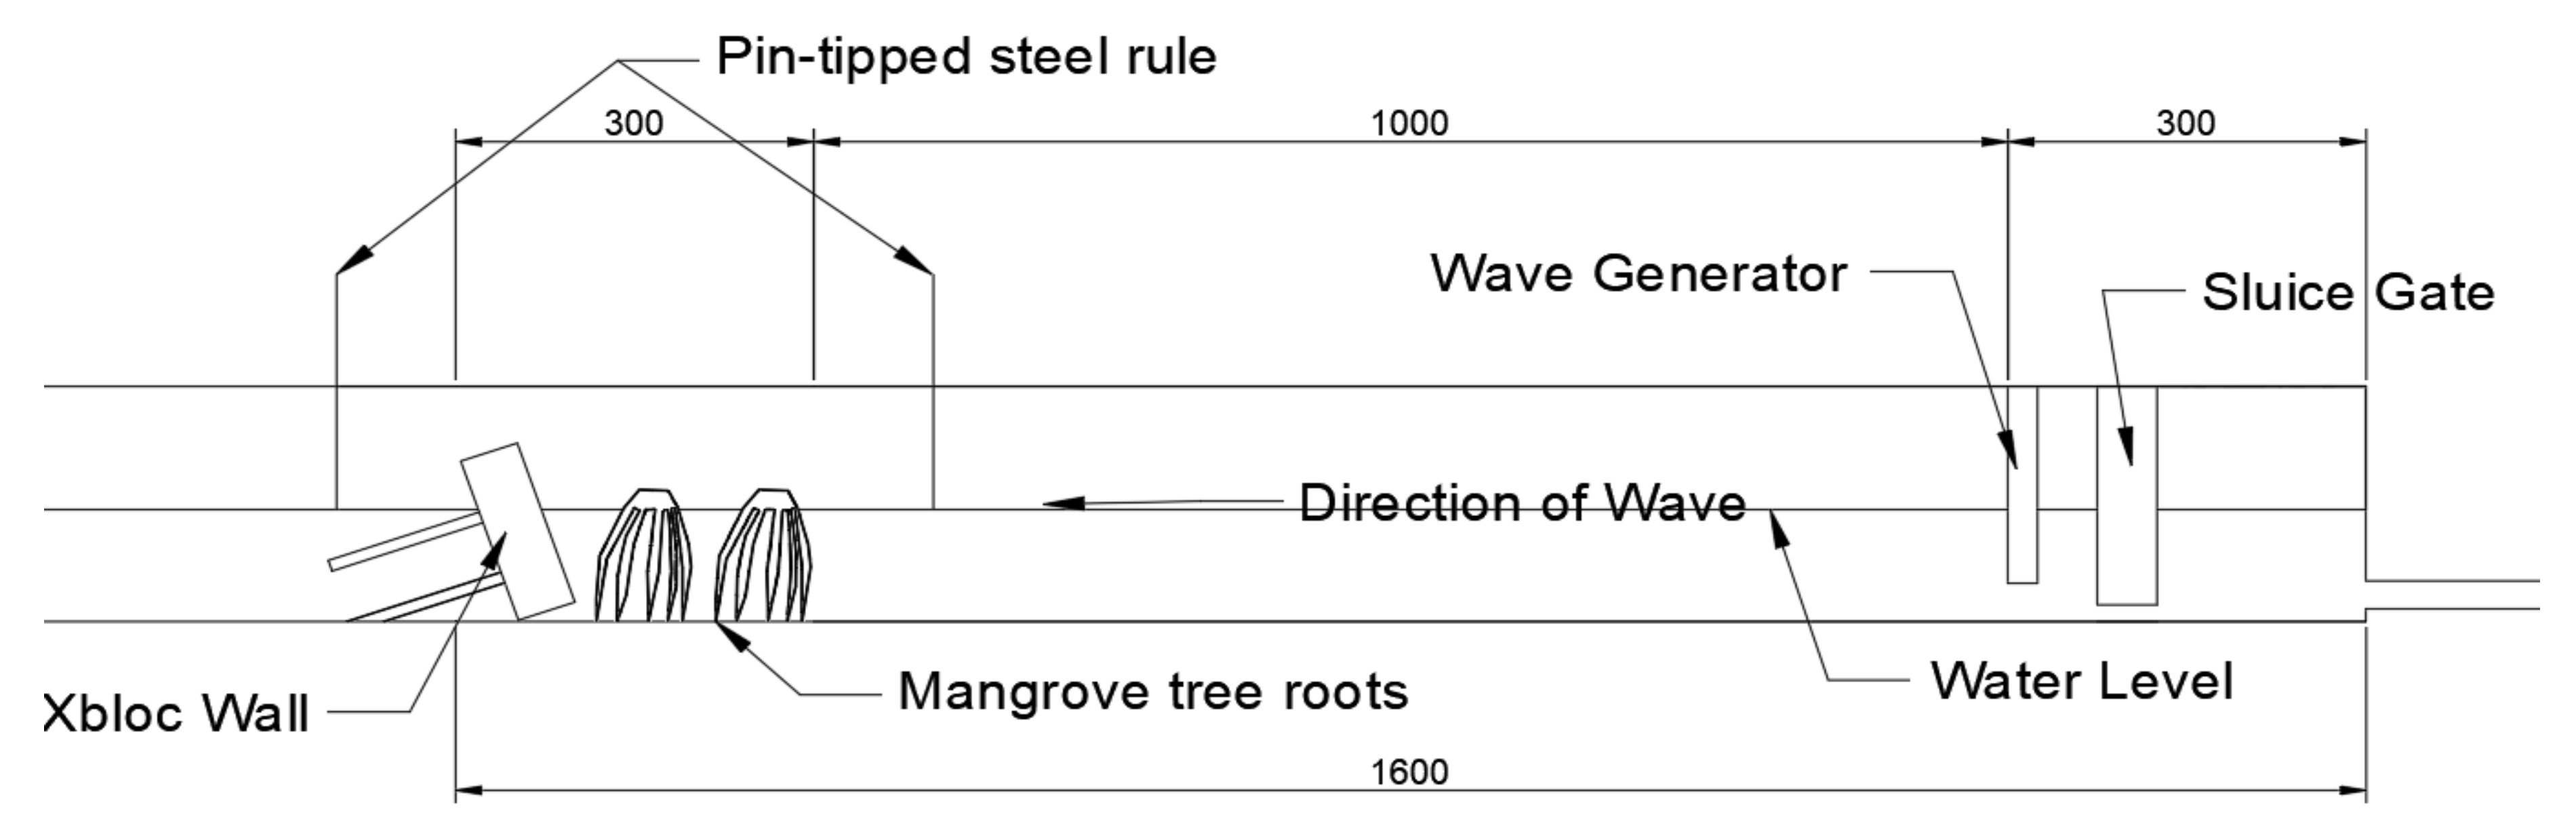
The apparatus used in this study (Figure 2) includes a 5 m flume tank, a sluice gate, a wave generator and beach machine, water-resistant tape, a pin-tipped steel ruler, a stopwatch and the Xbloc wall and mangrove root models.
2.3. Experimental Procedure
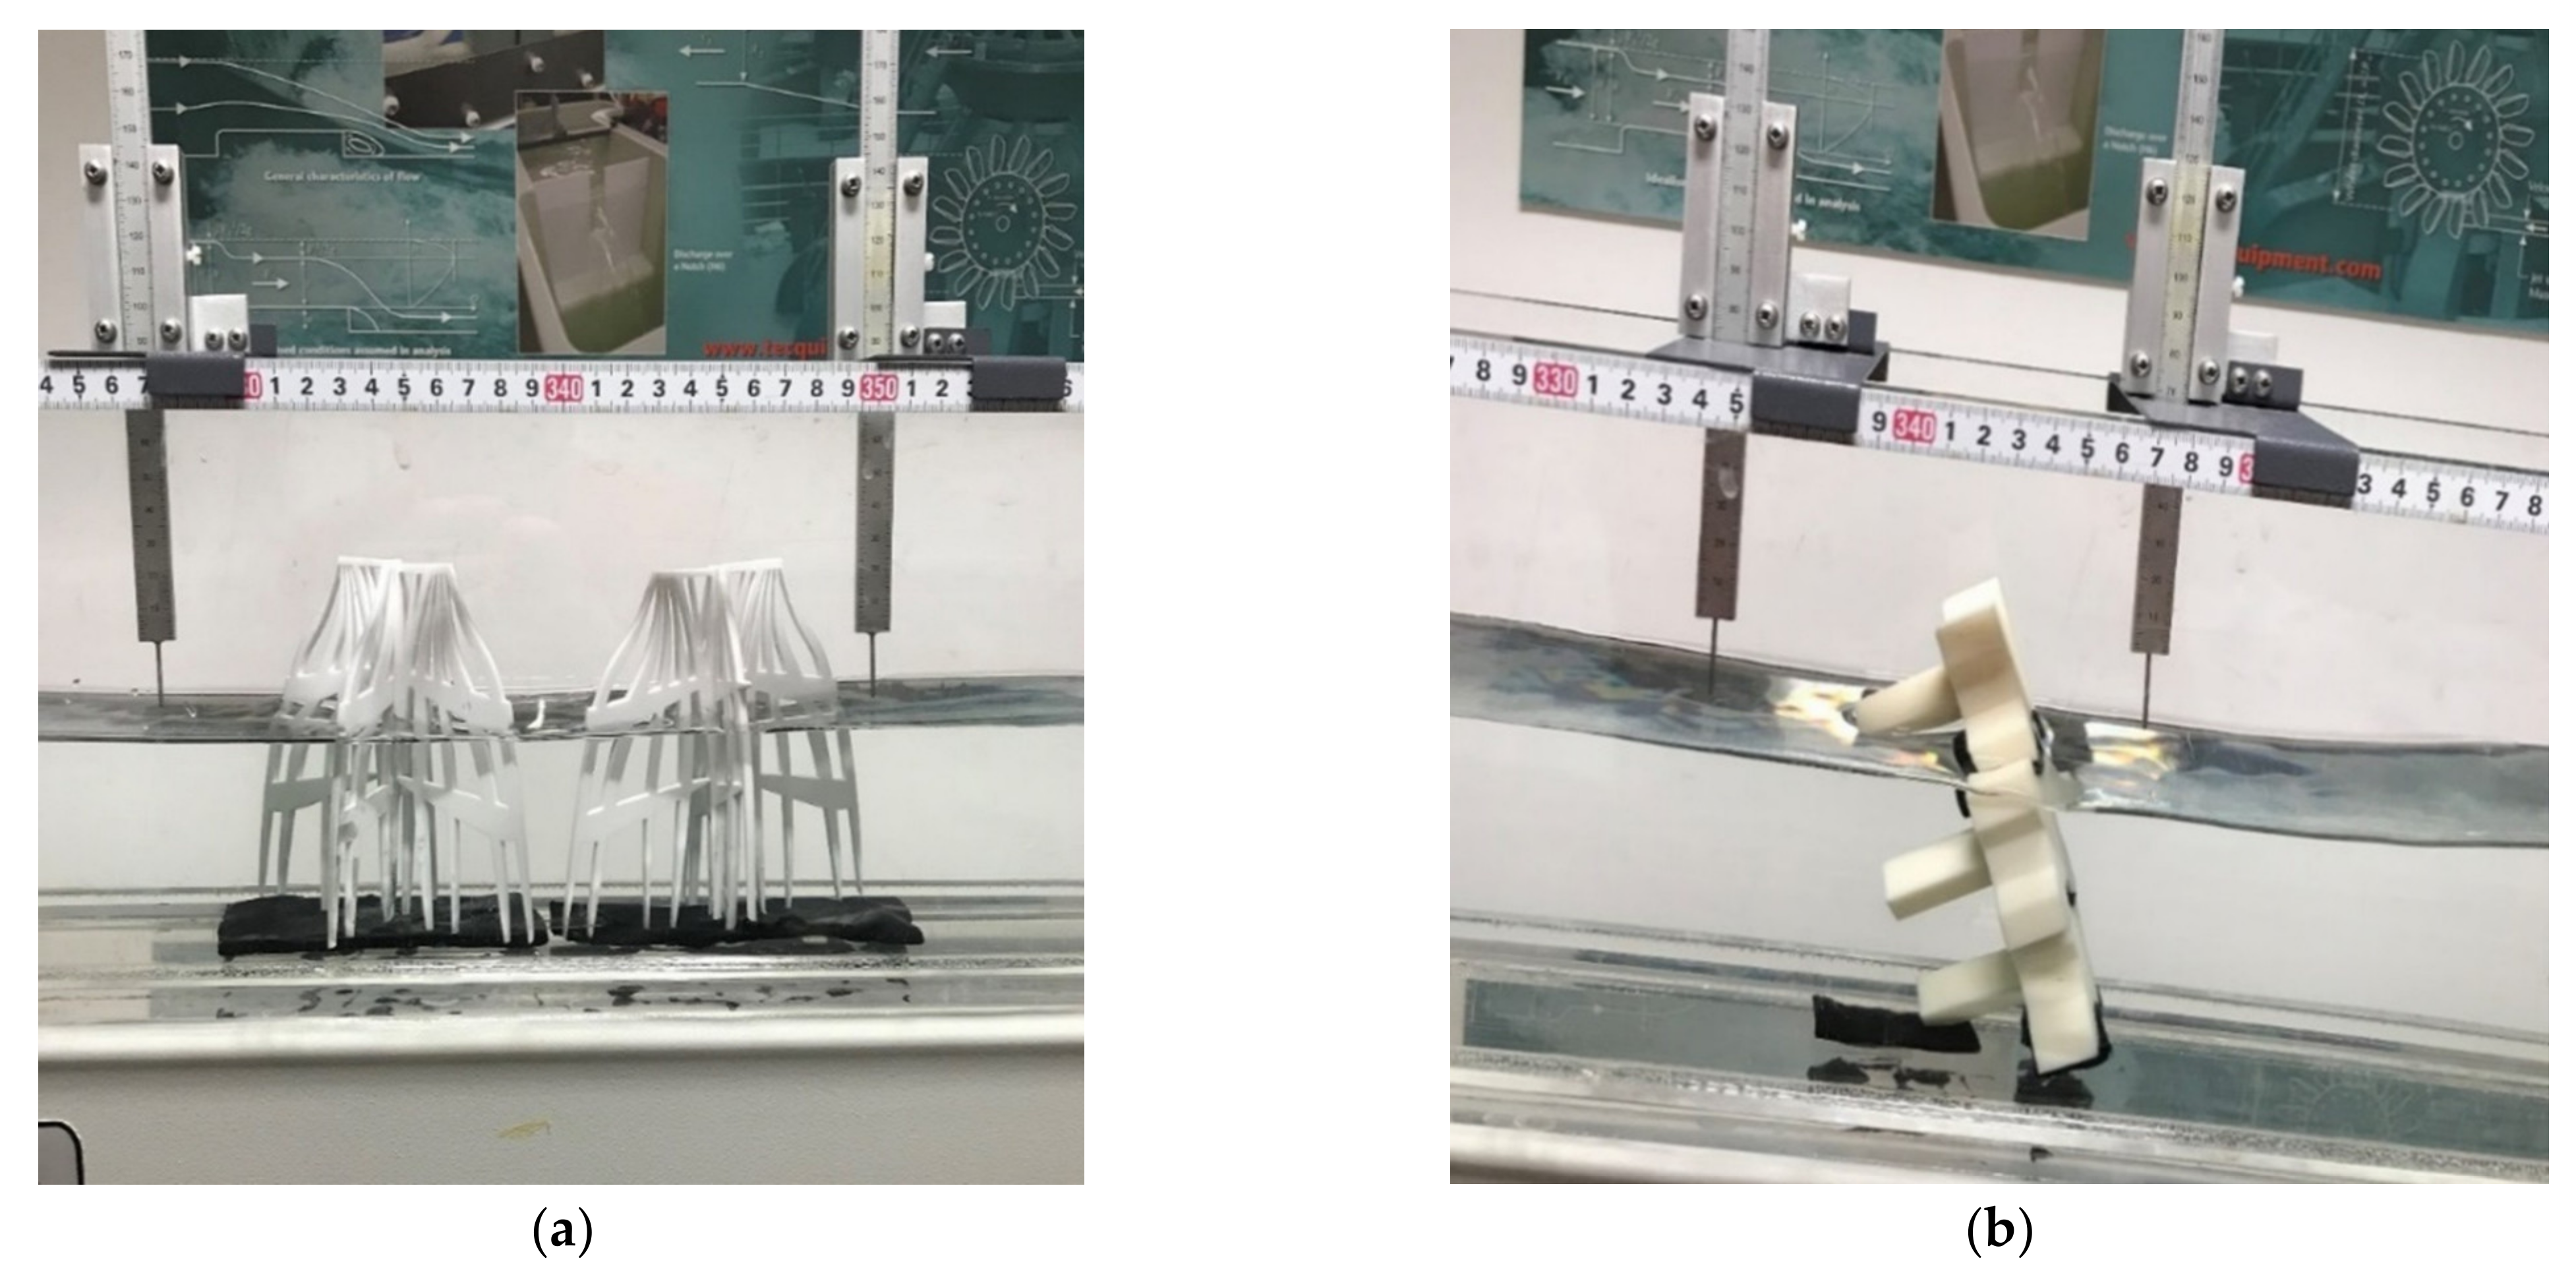
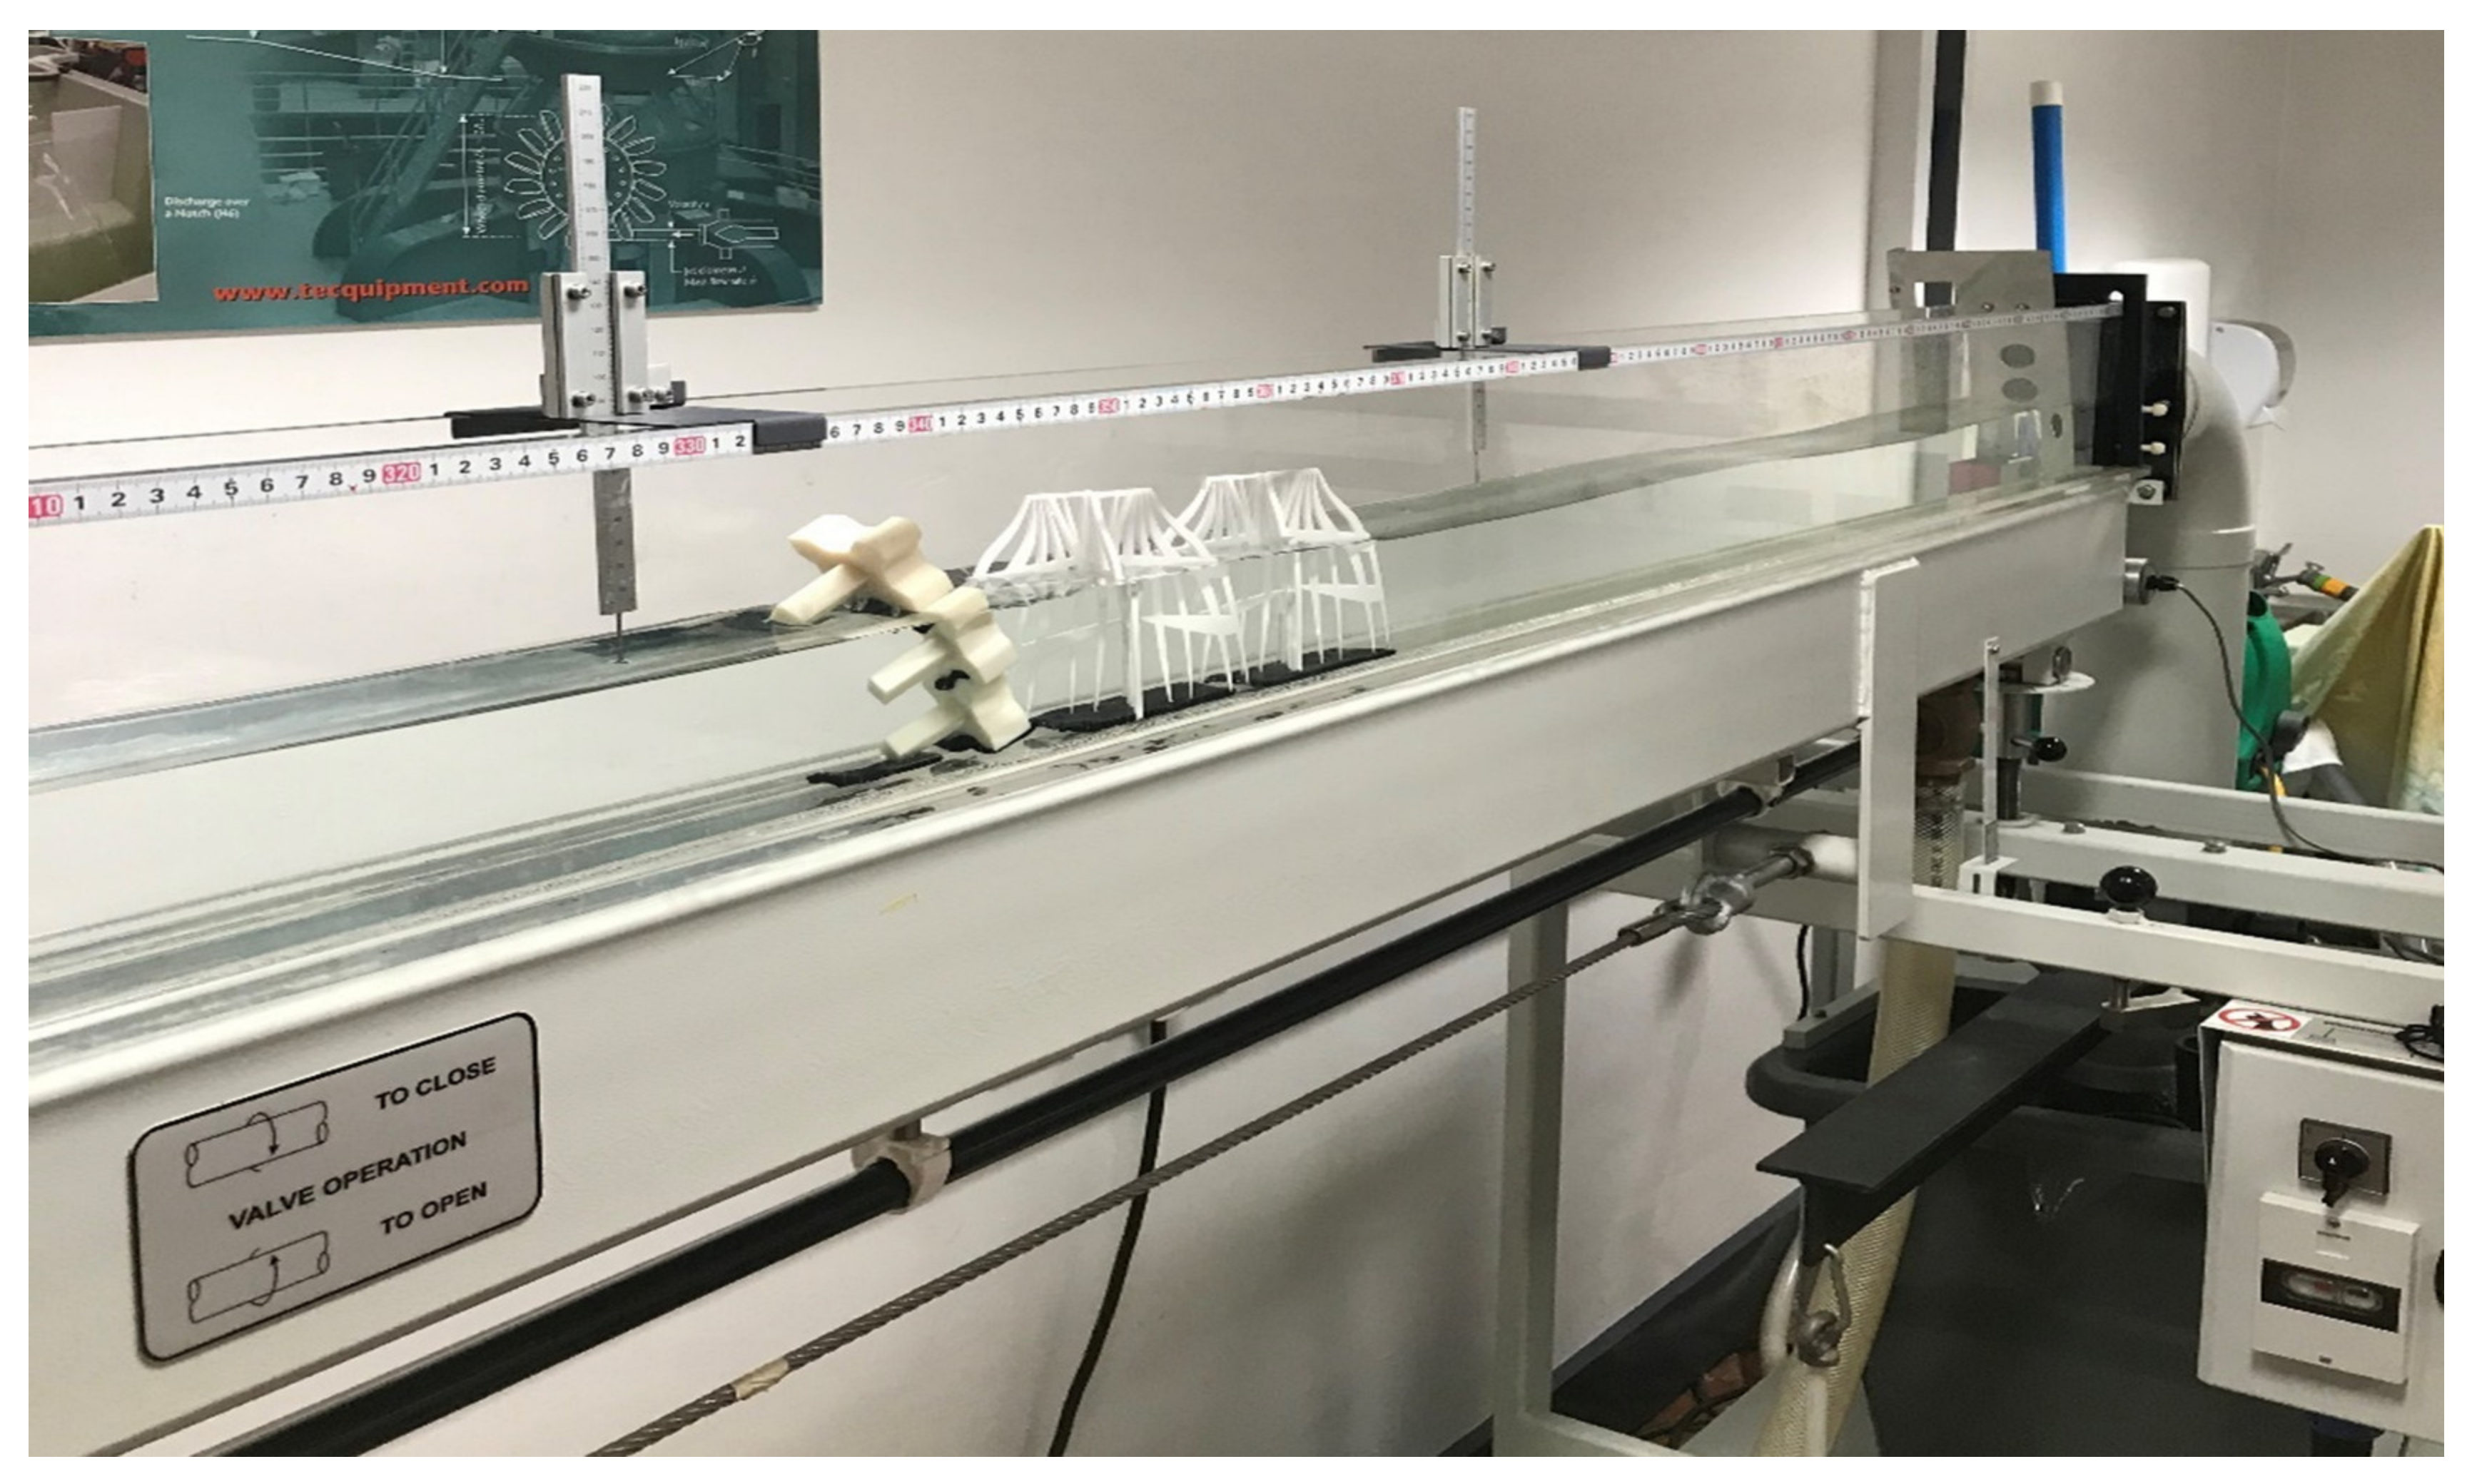
The sluice gate was placed at the 4.8 m mark within the tank, leaving a gap of a few mm from the bottom to allow for some water to drain out. The wave generator and beach machine were also placed at the 4.7 m mark within the tank (Figure 2). Tape was laid between 3.4 and 3.7 m to allow for the models to be stuck down. A wall was created by stacking Xblocs on top of each other. The Xbloc wall was then placed in a backward angled position at the 3.4 m mark within the tank, as shown in Figure 3 and Figure 4. One Xbloc wall was made up of three Xbloc units joined using water-resistant tape. Two mangrove roots were placed towards the wave machine between 3.5 m and 3.7 m using the tape.
A pin-tipped ruler was then placed before and after the models at 3.3 m and 3.8, respectively, in order to facilitate the accurate taking of readings (crest and trough heights). For the maximum effect, the flume was filled to approximately 2/3 of its height. On reaching the desired level, the flow rate was then adjusted to maintain a constant volume of water in the flume. Lastly, after the wave machine was fully set for operation, measurements of the crest and trough both before and after the models were carried out. A stopwatch and measuring tape were used to track the wave period (s) and wavelength (mm) at a very low flow rate in order to ensure stable waves and consistent water depth.
The experiment was conducted for the following models arranged in a tandem pattern:
- (1)
- 1 Xbloc wall and 2 mangrove roots
- (2)
- 1 Xbloc wall and 1 mangrove roots
- (3)
- 1 Xbloc wall
- (4)
- 2 Xbloc wall
- (5)
- 1 set of mangrove roots
- (6)
- 2 sets of mangrove roots
The experiment was repeated ten times, showing similar results for each set of model arrangements mention above. This was to accommodate for any possible errors. The results are shown in Appendix A.
2.4. Observation
Water enters into the flume at 0 m and exits at 5 m; the models were placed between 3.4 m and 3.7 m, the wave machine was positioned at 4.7 m, the sluice gate was positioned at 4.8 m, and the flume dimension was 0.21 m deep, 0.076 m wide and 5 m long. Typical set-ups for the wave height measurement both before and after the models are shown in Figure 3 and Figure 4.
It should be noted that the ruler position was set up at the locations stated in the experimental procedure, which are not exactly as shown in Figure 3 and Figure 4, which appeared to be too close to the models. The correct ruler position (as in Figure 2) was used to take the readings during the experiment. The ruler location shown is for pictorial purposes, not the actual experimental positioning.
2.5. Calculations
Due to the obstruction to the wave movement induced by the models, the height of the incident wave was reduced on passing over the Xbloc wall and the mangrove roots. This implies lower impact and less destruction to any property located after the models. Researchers in the past have related the transmitted and incident wave height by means of the transmission coefficient (), as mentioned below.
According to Yuanita et al. [16]:
Hoque et al. [10] calculated the transmission coefficient in terms of both the wave height and wave energy, as given in the equation below. Another two wave attenuation analysis parameters defined in their experiments include the reflection and dissipation coefficients. The three coefficients were related through energy balancing in the mangrove forests surroundings.
Manis et al. [17] studied the wave attenuation over living shorelines over time, and defined the parameter () as the attenuation coefficient given by the ratio of the attenuated wave height (after passing through treatment) to the height of the incoming wave given by
Osorio et al. [1] considered a model consisting of both primary and secondary roots in their experiment. The model dimensions were calculated from a system of equations developed by researchers in the past. In the United States, other protection measures such as intertidal oysters and cordgrass were successfully used to reduce the energy of waves created by boat wakes [17].
In this present experiment, the transmission coefficient was taken as the ratio of the residual wave height (after the models) to the incident wave height (before passing over the models).
3. Results and Discussion
3.1. Results
Table 2 shows the results obtained from 5 m flume tank experiment. It consists of six different structure combinations of Xbloc walls and mangrove roots. The variations of the wave parameters, including the height, celerity, wavelength and period, were calculated for the different combinations. The percentage reduction in the wave height, celerity and wavelength after crossing the models was also tabulated. The percentage delay in the period due to the slowing down of the waves after impact was determined.
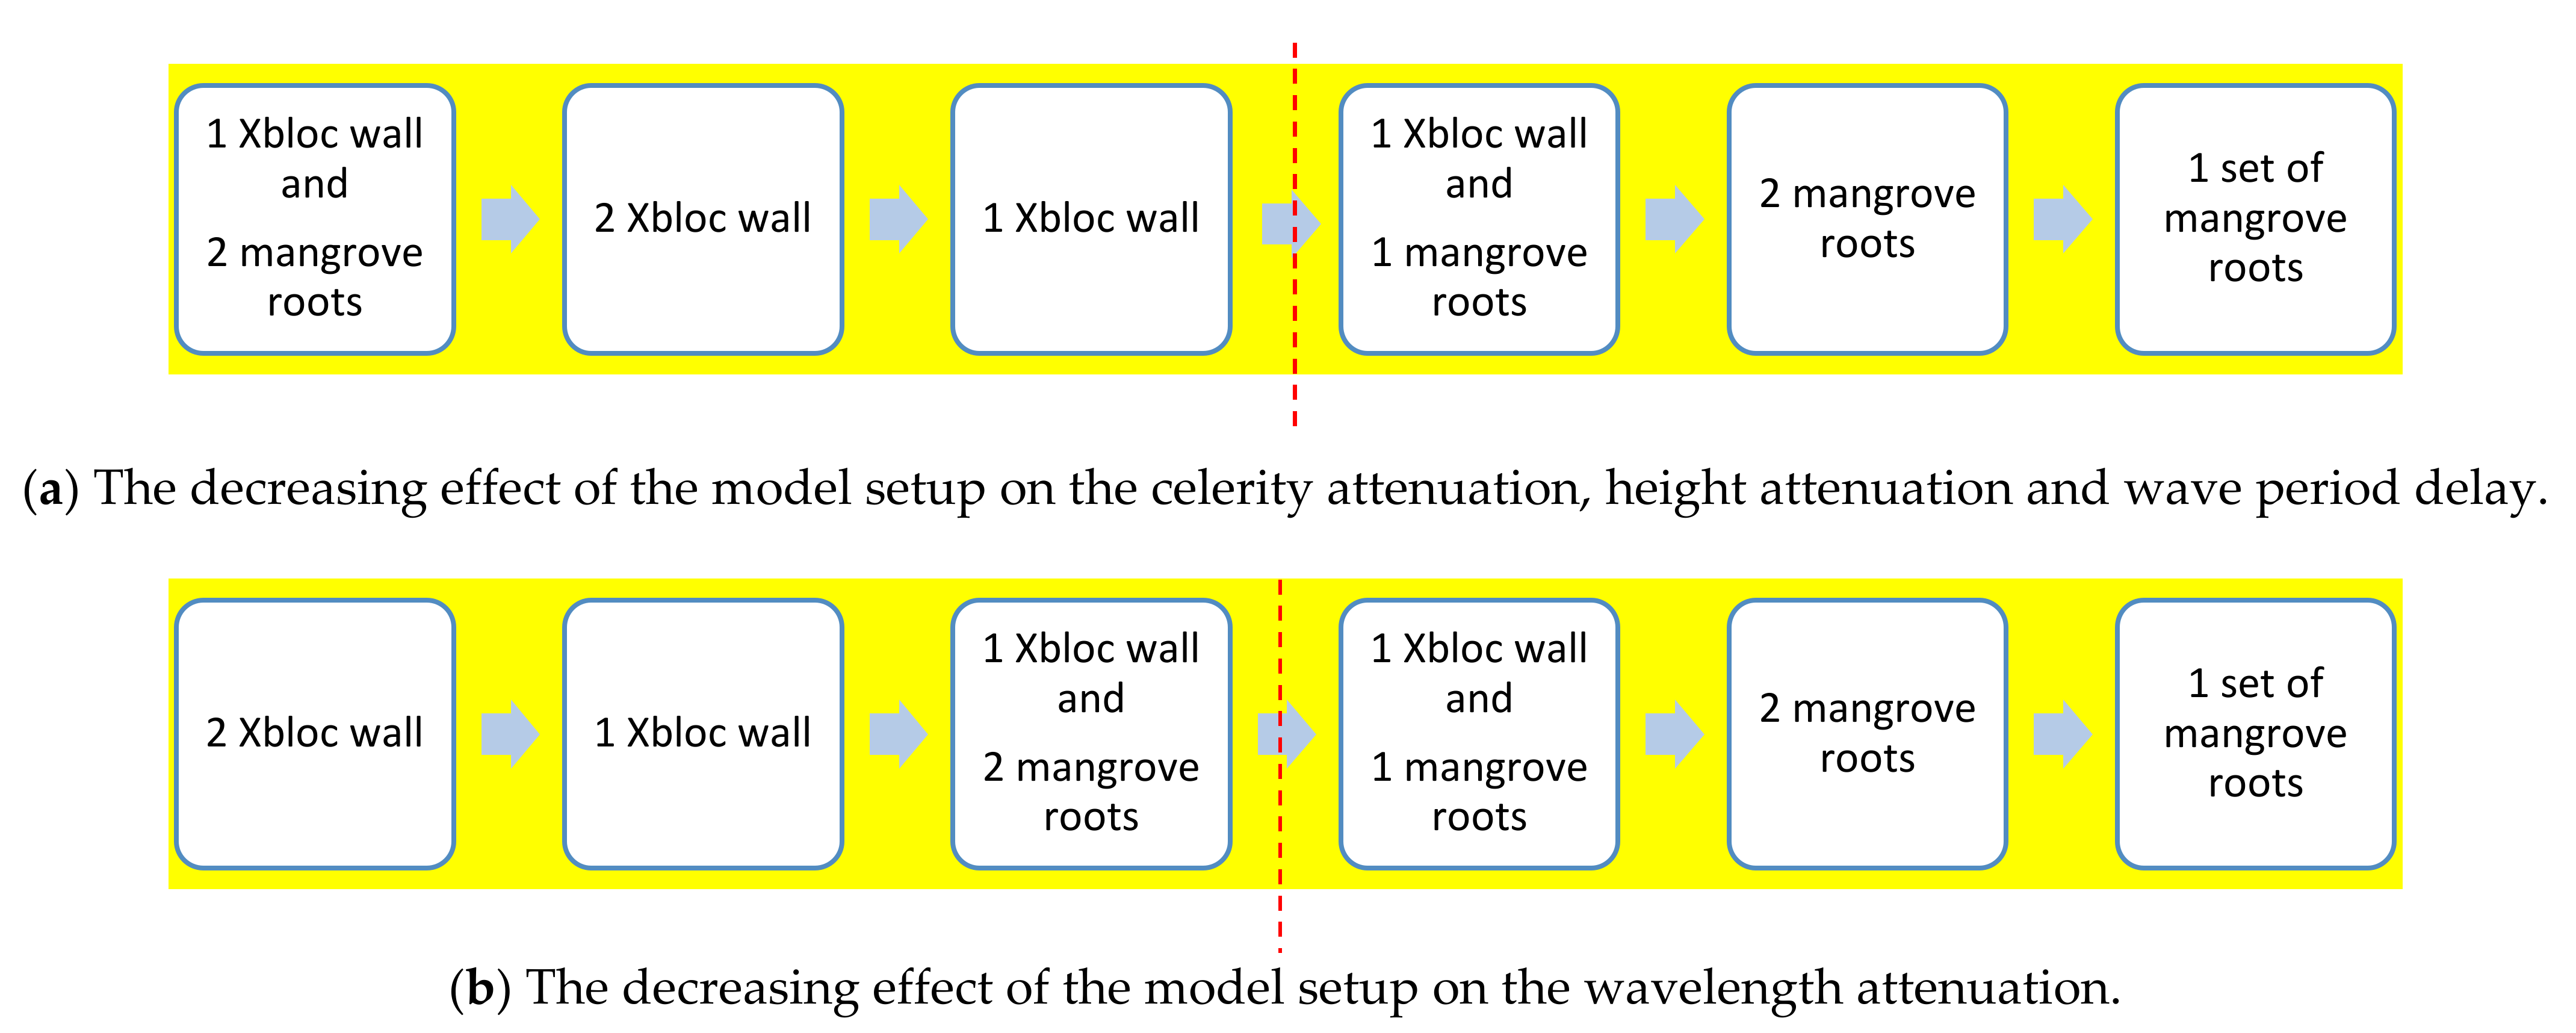
It was found that the models’ effect on the changes in celerity, height and period follow similar pattern to that shown in the first illustration, Figure 5a. The largest celerity and height reduction, as well longest delay in period, was observed in the hybrid model of one Xbloc wall and two mangrove roots, followed by two Xbloc wall and one Xbloc wall models, the effect keep going down in the order shown and the parameters are least affected in model set-up containing only one set of mangrove roots. However, reduction in wavelength take a pattern different from what other wave parameters followed, Figure 5b. In this case, the largest wavelength reduction was observed for two Xbloc wall models, followed by one Xbloc wall, then the hybrid of one Xbloc wall and two mangrove roots, and continued in the order shown in the second illustration, Figure 5b. The disorder in the models pattern is shown on the left side of the red-colored dashed line drawn across the two illustrations. The sequence of the last three models in the right hand-side of the red dashed line in Figure 5a,b is similar, while the order is followed by the first three models differ in the two figures. Further research is recommended to analyze why the wavelength results deviated from the sequence followed by the celerity, period and height.
It was observed that the attenuation capacity of one Xbloc wall was higher than the capacity for the combined Xbloc wall and mangrove roots from both illustrations, Figure 5a,b. This was not expected because, according to the hypothesis, a hybrid combination of mangrove roots and Xbloc walls was presumed to be more effective than a singly used Xbloc wall or mangrove model. The irregularity may be due to the error found in one of the readings recorded during the one Xbloc wall model experiment (the error highlighted in yellow in Appendix A).
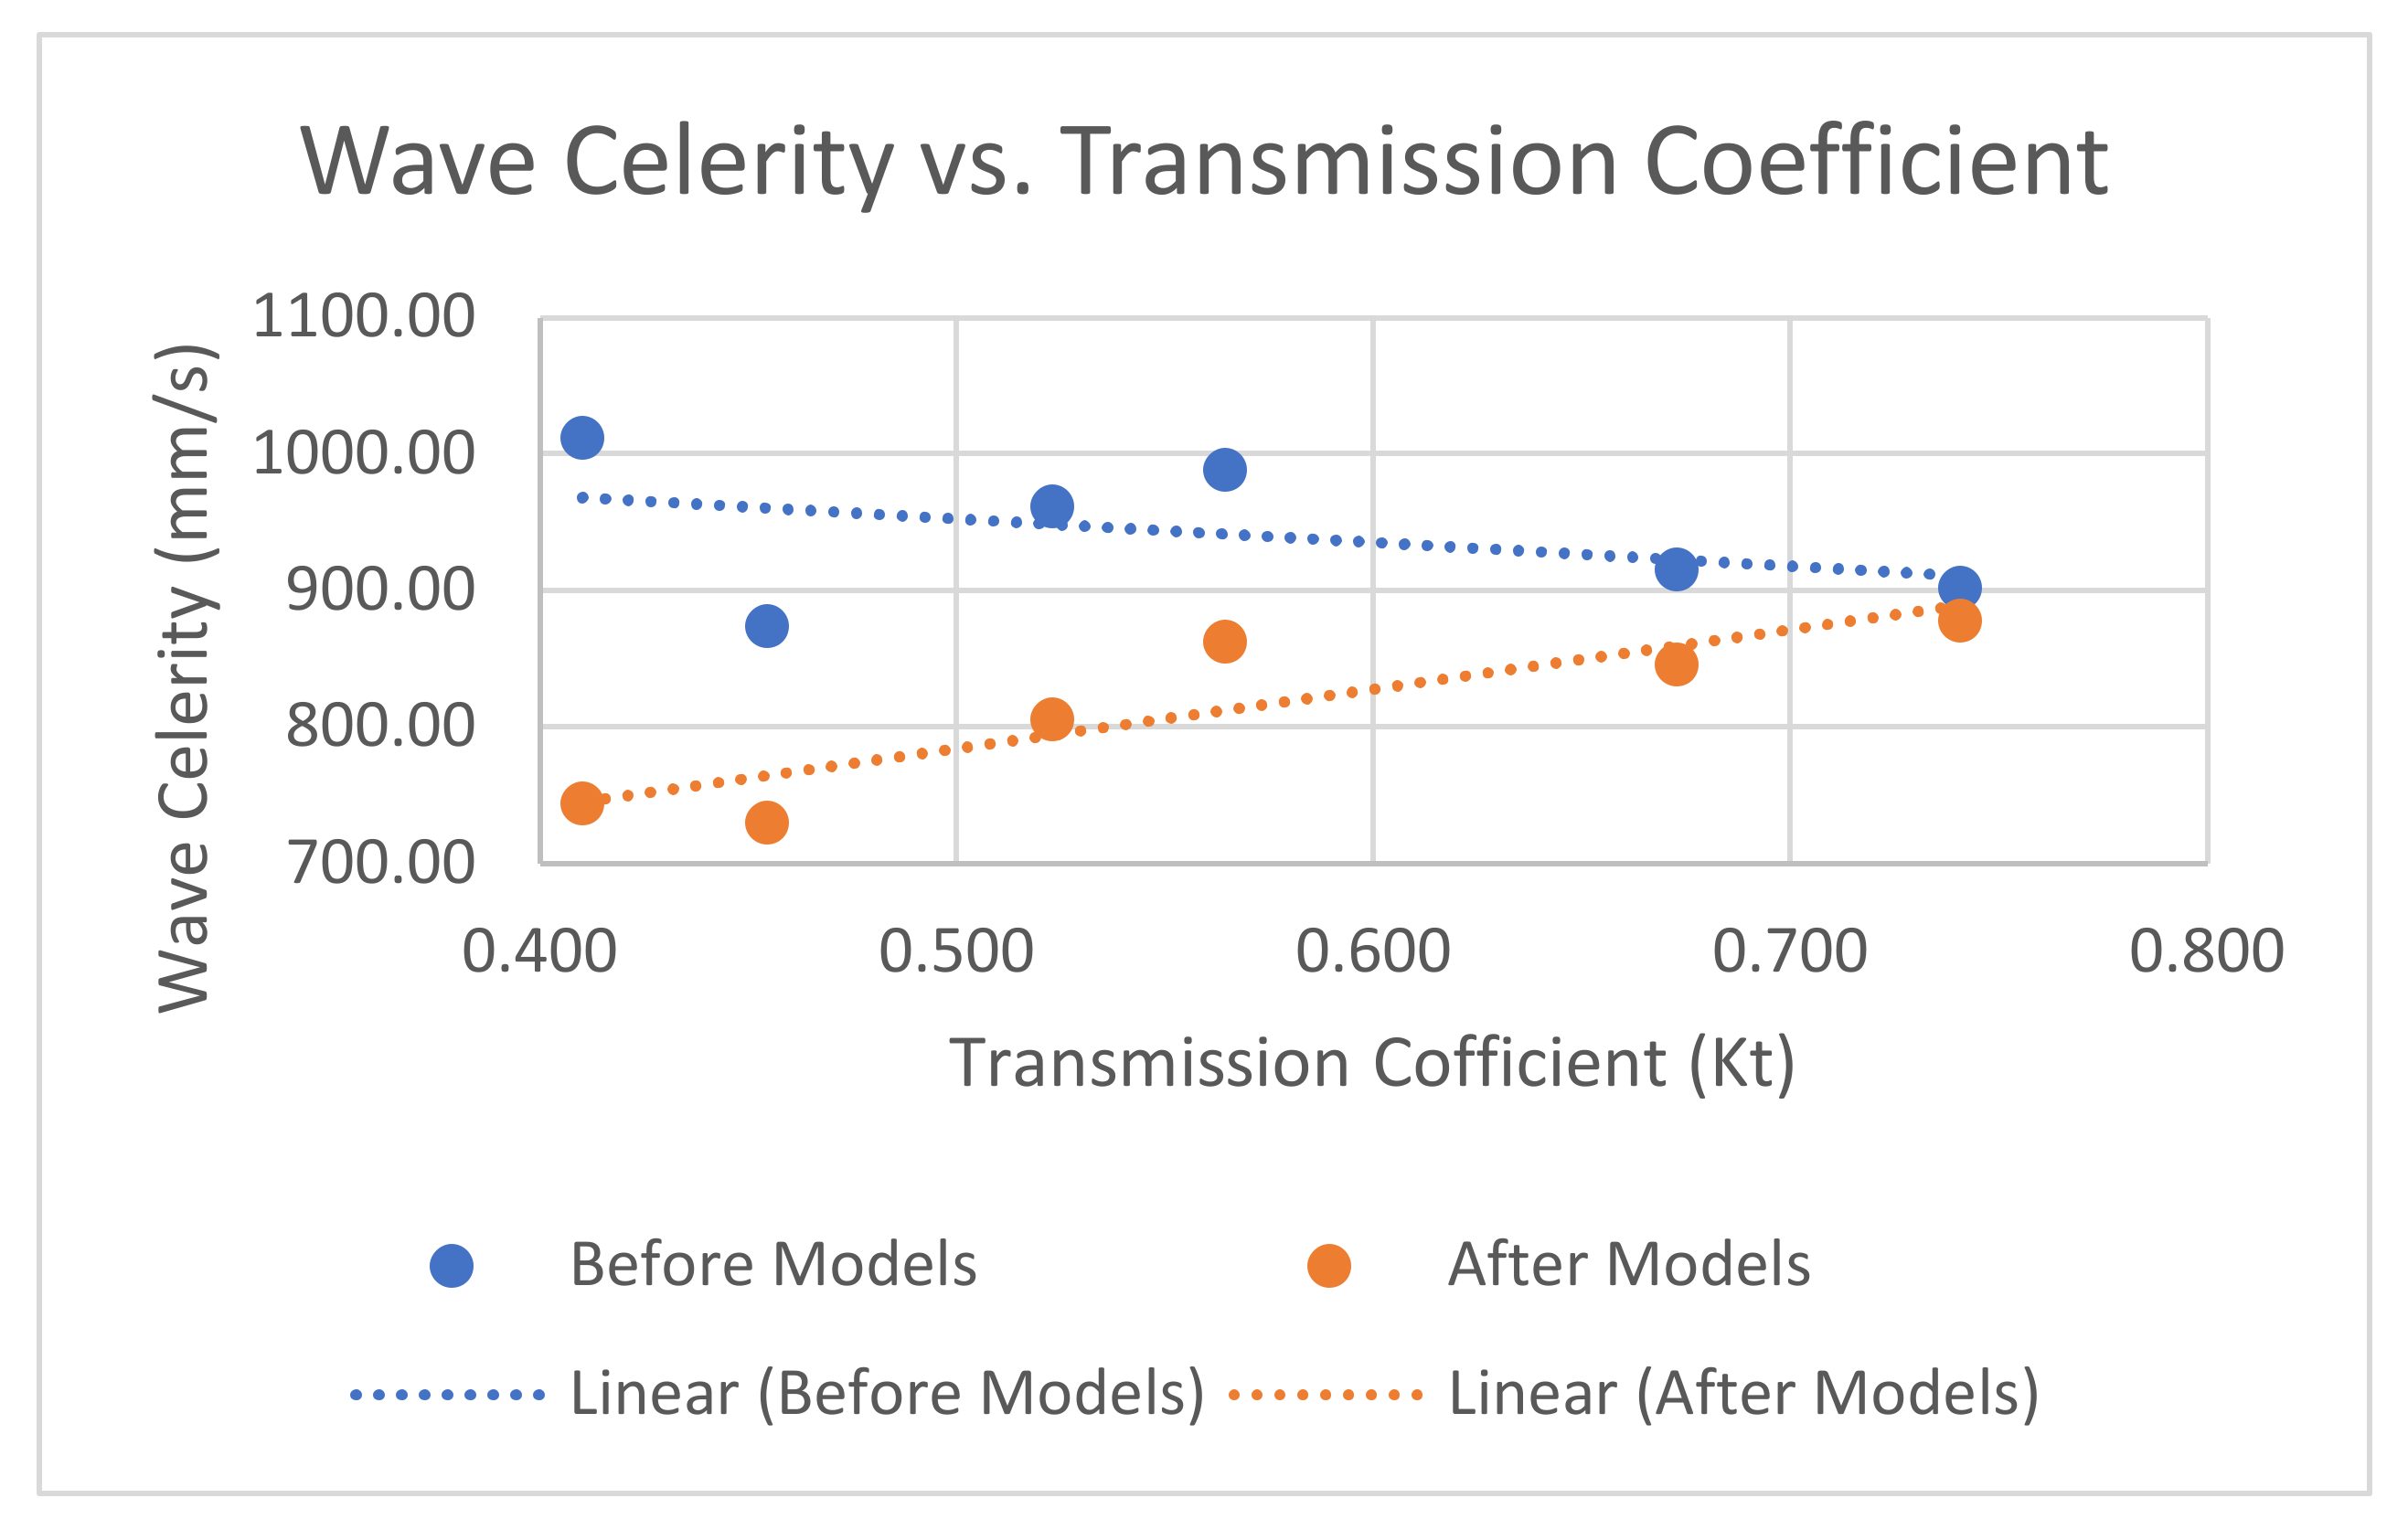
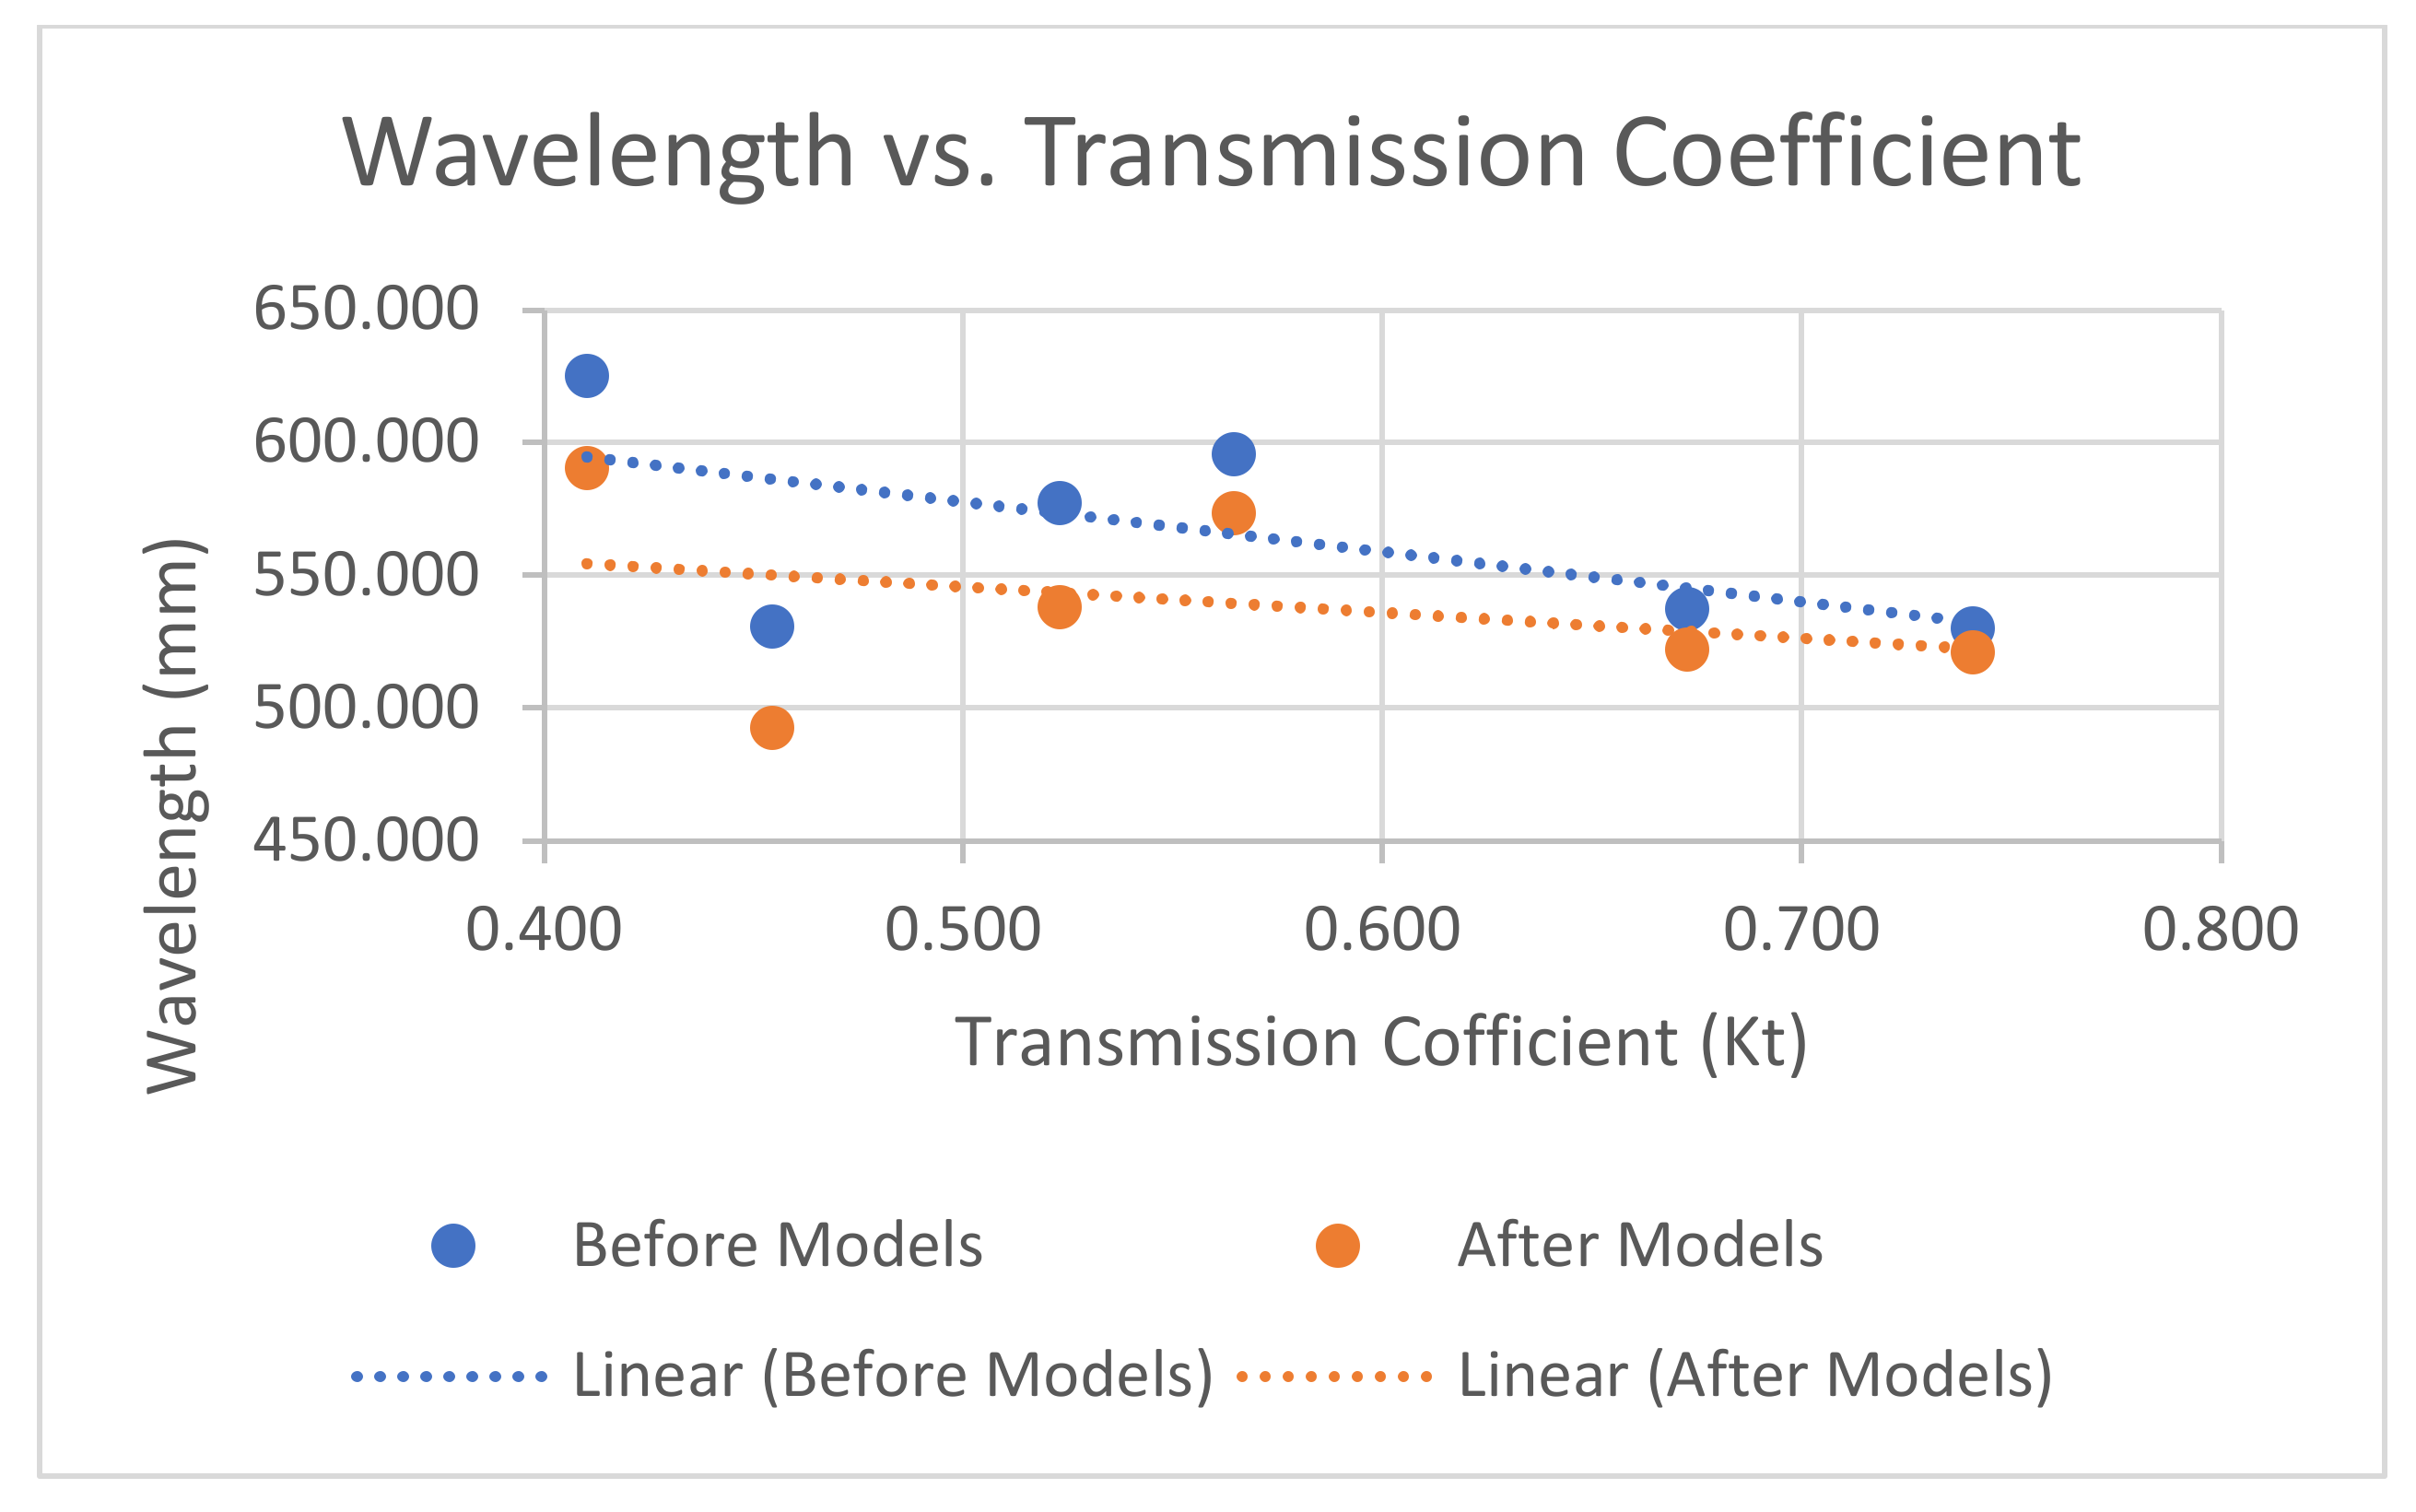
The plots in Figure 6, Figure 7 and Figure 8 show the variation of the wave celerity, wavelength and period with transmission coefficient . The wave characteristic results obtained before and after passing over the models were plotted against the transmission coefficient for each models’ combination. The interval between the before and after model trendlines (blue and orange colours) was wider initially at lower transmission coefficient values, but the gap becomes closer as we move to the right along the horizontal axis. The amount of interval between the trendlines signifies the magnitude of effect the models have on the wave parameters. Therefore, the intensity of the celerity and wavelength attenuation was higher (wider gap) at a lower transmission coefficient (Figure 6 and Figure 7). The increase in the wave period was also higher (wider gap) at lower transmission coefficients (Figure 8), which means that the waves became slower after passing over the models and needed more time to make one complete cycle.
From the trendlines in Figure 6, Figure 7 and Figure 8, it was observed that the change in wave parameters after passing over the models was larger at lower transmission coefficient, and that the effect decreases as the coefficient increases along the horizontal axis. Therefore, the effectiveness of the models decreases in this order from the hybrid combination of one Xbloc wall and two mangrove roots to the single model with only one set of mangrove roots , see Table 2.
3.2. Description of the Results
Wave energy and height reductions were observed when Xbloc walls and mangrove roots were used as wave attenuation measures in this experiment.
The resistance imposed upon the incoming waves by the mangrove is due to the friction offered by the mangroves’ root and trunk systems against the flow, and it increases with the number of trunks or roots present per unit area [2].
3.2.1. Average Transmission Coefficient
The transmission coefficient was calculated as the ratio of the residual height after crossing the models to the incident wave height before the models. The average transmission coefficient for each of the model setups considered is shown in Table 2. In every case examined, the transmission coefficient obtained was less than 1, and this signifies a reduction in wave height. The arrangement with one Xbloc wall and two mangrove roots produced the lowest coefficient (0.410), which means highest reduction in wave height after passing over the models (about 58.97% decreases). Therefore, it is the best option among the six tested protection arrangements. The models are responsible for damping of the wave amplitude.
3.2.2. Average Wave Height Reduction
Table 2 shows the percentage reduction in wave height after passing over the mangrove roots and Xbloc wall models. The wave height attenuation capacity of 1 Xbloc wall (47.69%) was higher than the capacity for combined Xbloc wall and mangrove roots (43.55%). This was not expected, because by hypothesis hybrid of mangrove roots and Xbloc wall is presumed to be more effective in reducing wave height than singly used Xbloc wall or mangrove model. The irregularity may be due to the error found in one of the readings recorded during the one Xbloc wall model experiment (the error highlighted in yellow in Appendix A).
It was also noticed that the wave height reduction capacity of one Xbloc wall (47.69%) was higher than the capacity for one set of mangrove roots (25.93%). This was because one Xbloc wall is composed of three sets of smaller Xblocs stacked on top of each other to make a bigger wall (see Figure 1, Figure 3 and Figure 4), which means that a single Xbloc wall may be assumed to have capacity of three pieces of Xblocs. In addition, an Xbloc wall is a complete solid structure, unlike the mangroves, with openings between roots, which reduces the impact effect on the waves; this adds to the effectiveness of the Xbloc wall. There is an increase in the reduction capacity by 6.8% and 6.86% upon doubling the number of mangrove roots and Xbloc walls, respectively, within the flume. The highest reduction capacity (58.97%) was obtained in hybrid set-up of one Xbloc wall and two mangrove roots.
3.2.3. Wave Celerity vs. the Transmission Coefficient
Table 2 contains the percentage reduction in the celerity after the wave passed over the protective models. The arrangement with one Xbloc wall and two mangrove roots produced the biggest percentage (26.48%), and this means the highest reduction in the celerity. In the case of one set of mangrove roots only, a very small decrease was observed. The plot of the wave celerity against the transmission coefficient in Figure 6 shows that, in the entire model setups examined, the celerity after the models was less than before models. This implies a successful reduction in the rate at which the wave travelled due to the decrease in wavelength and the increase in the period upon impact. Further research in this area is recommended to prove extensively the dependence of celerity on wavelength and period.
3.2.4. Wavelength vs. the Transmission Coefficient
The wavelength was computed by positioning markers at the crests of the wave and measuring distance between the two points. The plots of the wavelength against the transmission coefficient in Figure 7 shows that, in all of the model setups examined, the wavelength measured after passing over the models was less than that before the models. This implies a successful reduction in the distance travelled by the wave in one cycle, which in turn will reduce the wave’s travel speed. Table 2 contains the percentage reduction in the wavelength after the wave passed over the protective models. The arrangement with only two Xbloc wall gave the biggest percentage (7.18%), and this means the highest reduction in the length of the wave. It is evident from the results that the decrease in wavelength was more prominent in arrangements containing Xbloc walls compared to those with mangrove roots. Therefore, based on the scope of this experiment, Xbloc walls are more efficient than mangrove roots in attenuating the wave travel distance (wavelength).
3.2.5. Wave Period vs. the Transmission Coefficient
Table 2 contains the percentage delay in the wave period after the wave passed over the protective models. The least delay in period was observed in the case of one set of mangrove roots only. The highest delay (28.34%) was observed in the one Xbloc wall and two mangrove roots combination; it is, therefore, the most effective among all of the combinations, because a longer travel time means lower celerity and fewer consequences. The plot of the wave period against the transmission coefficient in Figure 8 shows that here was increase in period after the wave passed over the models in the entire model set-ups examined. This implies an increase in the time the wave travelled in one cycle, leading to a decrease in the wave travel speed, and hence less impact.
3.3. Limitations
- The width of the flume tank was 76 mm, while the models were 50 mm and 60 mm wide for the Xblocs and mangrove roots. This means that even two models could not be placed adjacent to each other to analyse the effect of a wider model set-up, resembling real life situation. A more accurate estimation could be obtained by placing the models beside each other using a wider flume.
- This research considered a tandem configuration of models; however, future works in wider flume should consider a staggered arrangement of models to avoid the creation of a preferential flow direction.
- It was difficult to maintain a stable flow and water depth within the flume tank used; therefore, a very low flow rate was considered in order to maintain stable waves and a consistent water depth.
- Furthermore, the waves produced by this wave generator reflect off of the sluice gate and travel back up the tank, which then interfere with the next generated wave; this means that the height and speed of the waves will be slightly affected compared to other flume tanks which can produce waves at a predefined height and speed. Higher control over the apparatus will give more accurate results in the future.
- Human error might have affected some of the readings during the data collection process, because error was observed in the one Xbloc wall model data. Using digital devices for measurement will increase the accuracy of the work.
3.4. Pros and Cons of Using Artificial Mangrove Models
- The use of artificial mangrove models allows the representation of large and complex natural mangrove roots in a small-scale model that can be easily analysed.
- There is full control over the model’s structural configuration and hydrodynamic properties, unlike real mangrove roots, which exist naturally and cannot be altered.
- The artificial model may not have the actual structural properties or hydrodynamic resistance of the natural mangrove root species it represents; this will reduce the accuracy during the implementation in real life applications.
- Experiments using representative mangrove root models need to be validated and further conducted to at least accommodate the error that might have occurred (if any) in the modelling process, geometric/kinematic design imperfections, or faulty experimental procedure before it can be proven to correctly apply to the real mangrove roots.
4. Conclusions
Wave attenuation experiments using Xbloc walls and artificial mangrove root models as protection measures were carried out and the following conclusions were derived based on the results obtained:
- The use of an Xbloc wall and artificial mangrove roots led to a successful reduction in the wave height, wavelength and celerity, as well as a delay in the period of the flume tank-generated water waves.
- A transmission coefficient formula adopted from the literature was applied in order to determine the wave reduction capacity for each model set-up. The arrangement with one Xbloc wall and two mangrove roots produced the lowest coefficient (0.410), which was equivalent to about a 58.97% decrease in wave height, which was the maximum percentage recorded from the experiment.
- The hybrid model containing one Xbloc wall and two mangrove roots produced the highest celerity reduction, at 26.46%, as well as the highest period delay at 28.34%. Its wavelength reduction capacity was also high, at about 5.50%, which is slightly less than the peak value observed (about 7.18%) in the case of the two-Xbloc wall.
- The model containing one set of mangrove roots only was the least effective wave attenuation measure observed in this study, because it produced the lowest celerity, wave height and wavelength reductions. The lowest delay in the wave period was also observed in this same model arrangement. The low delay in the wave period for this model set-up means that the time that the wave would travel in one cycle is faster than in the other model set-ups, causing a greater impact on coastlines, which is not desirable.
- Based on the above discussions, it can be concluded that hybrid protection is the best option for coastal protection in areas prone to sea wave attacks. The combined action of the 3D-printed polymer-made Xbloc walls and mangrove roots facilitated the dissipation of wave energy better compared to using only Xbloc walls or mangrove roots separately.
- The objective of demonstrating the hybrid solution as the most effective protection measure was achieved based on the limitations of this work. This was successfully established based on the data analyzed for the celerity, height and period. However, further study is recommended in order to validate this, because the wavelength data indicated otherwise.
- It was observed in some cases that the attenuation capacity of the Xbloc wall was higher than the capacity for hybrid Xbloc walls and mangrove roots. This irregularity may be due to an error found in one of the readings recorded during the one Xbloc wall model experiment (the error highlighted in yellow in Appendix A).
- The manual measurement undertaken in this study might have caused some of the irregularities reported; therefore, the use of a digital device for readings is recommended for future works.
Author Contributions
Conceptualization, S.A. and A.R.O.; methodology, A.R.O. and A.A.S.; writing—original draft preparation, A.A.S. and A.R.O.; writing—review and editing, S.A. and A.A.S.; supervision, S.A. All authors have read and agreed to the published version of the manuscript.
Funding
This research received no external funding.
Institutional Review Board Statement
Not applicable.
Informed Consent Statement
Not applicable.
Data Availability Statement
Not applicable.
Acknowledgments
We thank laboratory assistant Insa Ba from Nottingham Trent University, who help in the model design and fabrication. We express gratitude to James Cooper, the laboratory technician, for setting up the experiment within the flume tank and providing the equipment.
Conflicts of Interest
The authors declare no conflict of interest.
Appendix A

Table A1.
Wave measurement results for six different model combinations of Xbloc walls and mangrove roots (each combination was repeated 10 times).
Table A1.
Wave measurement results for six different model combinations of Xbloc walls and mangrove roots (each combination was repeated 10 times).
| All Measurements Are Inverted | Trough of Wave (mm) | Crest of Wave (mm) | Wavelength (mm) | Wave Period (s) | Wave Celerity (mm/s) | Change in Wave Height at Crest (mm) | Wave Height (mm) | Change in Wave Height before to after Models (mm) | Transmission Coefficient (Kt) | Reduction in Wave Height (%) | ||||||
|---|---|---|---|---|---|---|---|---|---|---|---|---|---|---|---|---|
| Models | Before Models | After Models | Before Models | After Models | Before Models | After Models | Before Models | After Models | Before Models | After Models | Before Models | After Models | ||||
| 2 Xbloc wall | 131 | 128 | 122 | 124 | 490 | 421 | 0.58 | 0.64 | 844.83 | 657.81 | −2 | 9 | 4 | 5 | 0.455 | 54.545 |
| 2 Xbloc wall | 132 | 129 | 121 | 124 | 538 | 502 | 0.60 | 0.68 | 896.67 | 738.24 | −3 | 11 | 5 | 6 | ||
| 2 Xbloc wall | 135 | 132 | 125 | 128 | 500 | 534 | 0.61 | 0.67 | 819.67 | 797.01 | −3 | 10 | 4 | 6 | ||
| 2 Xbloc wall | 136 | 134 | 126 | 129 | 530 | 481 | 0.57 | 0.66 | 929.82 | 728.79 | −3 | 10 | 5 | 5 | ||
| 2 Xbloc wall | 136 | 134 | 126 | 129 | 550 | 501 | 0.64 | 0.70 | 859.38 | 715.71 | −3 | 10 | 5 | 5 | ||
| 2 Xbloc wall | 137 | 134 | 127 | 130 | 530 | 487 | 0.61 | 0.69 | 868.85 | 705.80 | −3 | 10 | 4 | 6 | ||
| 2 Xbloc wall | 134 | 131 | 124 | 126 | 520 | 490 | 0.60 | 0.69 | 866.67 | 710.14 | −2 | 10 | 5 | 5 | ||
| 2 Xbloc wall | 133 | 130 | 123 | 125 | 531 | 498 | 0.60 | 0.61 | 885.00 | 816.39 | −2 | 10 | 5 | 5 | ||
| 2 Xbloc wall | 134 | 131 | 125 | 127 | 580 | 510 | 0.65 | 0.72 | 892.31 | 708.33 | −2 | 9 | 4 | 5 | ||
| 2 Xbloc wall | 130 | 127 | 120 | 123 | 541 | 505 | 0.62 | 0.70 | 872.58 | 721.43 | −3 | 10 | 4 | 6 | ||
| Average | 133.8 | 131 | 123.9 | 126.5 | 531 | 492.90 | 0.608 | 0.676 | 873.58 | 729.97 | −2.60 | 9.90 | 4.50 | 5.40 | ||
| 1 Xbloc wall | 146 | 144 | 139 | 140 | 560 | 540 | 0.60 | 0.67 | 933.33 | 805.97 | −1 | 7 | 4 | 3 | 0.523 | 47.692 |
| 1 Xbloc wall | 146 | 144 | 139 | 140 | 540 | 532 | 0.59 | 0.61 | 915.25 | 872.13 | −1 | 7 | 4 | 3 | ||
| 1 Xbloc wall | 146 | 145 | 139 | 140 | 565 | 545 | 0.58 | 0.68 | 974.14 | 801.47 | −1 | 7 | 5 | 2 | ||
| 1 Xbloc wall | 137 | 136 | 128 | 131 | 564 | 521 | 0.61 | 0.70 | 924.59 | 744.29 | −3 | 9 | 5 | 4 | ||
| 1 Xbloc wall | 136 | 134 | 127 | 129 | 573 | 490 | 0.62 | 0.65 | 924.19 | 753.85 | −2 | 9 | 5 | 4 | ||
| 1 Xbloc wall | 144 | 142 | 135 | 138 | 601 | 571 | 0.65 | 0.71 | 924.62 | 804.23 | −3 | 9 | 4 | 5 | ||
| 1 Xbloc wall | 147 | 146 | 140 | 142 | 606 | 545 | 0.63 | 0.68 | 961.90 | 801.47 | −2 | 7 | 4 | 3 | ||
| 1 Xbloc wall | 143 | 142 | 136 | 138 | 587 | 557 | 0.60 | 0.68 | 978.33 | 819.12 | −2 | 7 | 4 | 3 | ||
| 1 Xbloc wall | 131 | 131 | 135 | 138 | 590 | 545 | 0.60 | 0.69 | 983.33 | 789.86 | −3 | −4 | −7 | 3 | ||
| 1 Xbloc wall | 136 | 138 | 129 | 132 | 590 | 536 | 0.54 | 0.62 | 1092.59 | 864.52 | −3 | 7 | 6 | 1 | ||
| Average | 141.20 | 140.20 | 134.70 | 136.80 | 577.60 | 538.20 | 0.602 | 0.669 | 961.23 | 805.69 | −2.10 | 6.50 | 3.40 | 3.10 | ||
| 1 Xbloc wall and 2 mangrove roots | 149 | 147 | 143 | 145 | 631 | 588 | 0.60 | 0.78 | 1051.67 | 753.85 | −2 | 6 | 2 | 4 | 0.410 | 58.974 |
| 1 Xbloc wall and 2 mangrove roots | 141 | 138 | 133 | 135 | 621 | 601 | 0.61 | 0.81 | 1018.03 | 741.98 | −2 | 8 | 3 | 5 | ||
| 1 Xbloc wall and 2 mangrove roots | 141 | 139 | 131 | 134 | 640 | 600 | 0.62 | 0.77 | 1032.26 | 779.22 | −3 | 10 | 5 | 5 | ||
| 1 Xbloc wall and 2 mangrove roots | 146 | 143 | 138 | 140 | 621 | 578 | 0.65 | 0.81 | 955.38 | 713.58 | −2 | 8 | 3 | 5 | ||
| 1 Xbloc wall and 2 mangrove roots | 142 | 138 | 134 | 135 | 645 | 599 | 0.60 | 0.83 | 1075.00 | 721.69 | −1 | 8 | 3 | 5 | ||
| 1 Xbloc wall and 2 mangrove roots | 141 | 138 | 134 | 136 | 659 | 605 | 0.57 | 0.71 | 1156.14 | 852.11 | −2 | 7 | 2 | 5 | ||
| 1 Xbloc wall and 2 mangrove roots | 136 | 133 | 128 | 130 | 599 | 570 | 0.61 | 0.80 | 981.97 | 712.50 | −2 | 8 | 3 | 5 | ||
| 1 Xbloc wall and 2 mangrove roots | 143 | 141 | 135 | 138 | 622 | 588 | 0.66 | 0.84 | 942.42 | 700.00 | −3 | 8 | 3 | 5 | ||
| 1 Xbloc wall and 2 mangrove roots | 140 | 140 | 133 | 136 | 589 | 580 | 0.70 | 0.86 | 841.43 | 674.42 | −3 | 7 | 4 | 3 | ||
| 1 Xbloc wall and 2 mangrove roots | 141 | 140 | 133 | 136 | 626 | 600 | 0.59 | 0.76 | 1061.02 | 789.47 | −3 | 8 | 4 | 4 | ||
| Average | 142.00 | 139.70 | 134.20 | 136.50 | 625.30 | 590.90 | 0.621 | 0.797 | 1011.53 | 743.88 | −2.30 | 7.80 | 3.20 | 4.60 | ||
| 1 Xbloc wall and 1 mangrove roots | 150 | 149 | 145 | 146 | 590 | 569 | 0.63 | 0.70 | 936.51 | 812.86 | −1 | 5 | 3 | 2 | 0.565 | 43.548 |
| 1 Xbloc wall and 1 mangrove roots | 150 | 149 | 144 | 146 | 581 | 558 | 0.61 | 0.71 | 952.46 | 785.92 | −2 | 6 | 3 | 3 | ||
| 1 Xbloc wall and 1 mangrove roots | 147 | 145 | 140 | 142 | 601 | 576 | 0.55 | 0.64 | 1092.73 | 900.00 | −2 | 7 | 3 | 4 | ||
| 1 Xbloc wall and 1 mangrove roots | 135 | 133 | 127 | 129 | 600 | 576 | 0.61 | 0.68 | 983.61 | 847.06 | −2 | 8 | 4 | 4 | ||
| 1 Xbloc wall and 1 mangrove roots | 134 | 134 | 127 | 129 | 609 | 590 | 0.58 | 0.66 | 1050.00 | 893.94 | −2 | 7 | 5 | 2 | ||
| 1 Xbloc wall and 1 mangrove roots | 134 | 134 | 127 | 129 | 598 | 583 | 0.63 | 0.67 | 949.21 | 870.15 | −2 | 7 | 5 | 2 | ||
| 1 Xbloc wall and 1 mangrove roots | 132 | 131 | 126 | 128 | 599 | 581 | 0.63 | 0.65 | 950.79 | 893.85 | −2 | 6 | 3 | 3 | ||
| 1 Xbloc wall and 1 mangrove roots | 138 | 138 | 133 | 135 | 605 | 561 | 0.60 | 0.66 | 1008.33 | 850.00 | −2 | 5 | 3 | 2 | ||
| 1 Xbloc wall and 1 mangrove roots | 139 | 139 | 133 | 135 | 587 | 577 | 0.61 | 0.65 | 962.30 | 887.69 | −2 | 6 | 4 | 2 | ||
| 1 Xbloc wall and 1 mangrove roots | 139 | 138 | 134 | 136 | 590 | 567 | 0.59 | 0.64 | 1000.00 | 885.94 | −2 | 5 | 2 | 3 | ||
| Average | 139.80 | 139.00 | 133.60 | 135.50 | 596.00 | 573.80 | 0.604 | 0.666 | 988.59 | 862.74 | −1.90 | 6.20 | 3.50 | 2.70 | ||
| 2 Mangrove roots | 151 | 151 | 147 | 149 | 552 | 521 | 0.63 | 0.68 | 876.19 | 766.18 | −2 | 4 | 2 | 2 | 0.673 | 32.727 |
| 2 Mangrove roots | 146 | 145 | 139 | 140 | 549 | 531 | 0.57 | 0.61 | 963.16 | 870.49 | −1 | 7 | 5 | 2 | ||
| 2 Mangrove roots | 145 | 144 | 140 | 141 | 536 | 520 | 0.60 | 0.60 | 893.33 | 866.67 | −1 | 5 | 3 | 2 | ||
| 2 Mangrove roots | 142 | 141 | 136 | 137 | 540 | 525 | 0.57 | 0.62 | 947.37 | 846.77 | −1 | 6 | 4 | 2 | ||
| 2 Mangrove roots | 142 | 141 | 134 | 135 | 529 | 519 | 0.59 | 0.63 | 896.61 | 823.81 | −1 | 8 | 6 | 2 | ||
| 2 Mangrove roots | 150 | 150 | 145 | 147 | 535 | 521 | 0.59 | 0.56 | 906.78 | 930.36 | −2 | 5 | 3 | 2 | ||
| 2 Mangrove roots | 148 | 148 | 145 | 146 | 530 | 528 | 0.59 | 0.64 | 898.31 | 825.00 | −1 | 3 | 2 | 1 | ||
| 2 Mangrove roots | 145 | 146 | 140 | 142 | 535 | 517 | 0.55 | 0.61 | 972.73 | 847.54 | −2 | 5 | 4 | 1 | ||
| 2 Mangrove roots | 147 | 145 | 141 | 141 | 528 | 519 | 0.61 | 0.63 | 865.57 | 823.81 | 0 | 6 | 4 | 2 | ||
| 2 Mangrove roots | 148 | 147 | 142 | 143 | 541 | 521 | 0.58 | 0.61 | 932.76 | 854.10 | −1 | 6 | 4 | 2 | ||
| Average | 146.40 | 145.80 | 140.90 | 142.10 | 537.50 | 522.20 | 0.588 | 0.619 | 915.28 | 845.47 | −1.20 | 5.50 | 3.70 | 1.80 | ||
| 1 set of mangrove roots | 147 | 147 | 141 | 143 | 531 | 521 | 0.61 | 0.61 | 870.49 | 854.10 | −2 | 6 | 4 | 2 | 0.741 | 25.926 |
| 1 set of mangrove roots | 144 | 144 | 137 | 139 | 529 | 519 | 0.57 | 0.60 | 928.07 | 865.00 | −2 | 7 | 5 | 2 | ||
| 1 set of mangrove roots | 145 | 145 | 139 | 140 | 535 | 523 | 0.55 | 0.58 | 972.73 | 901.72 | −1 | 6 | 5 | 1 | ||
| 1 set of mangrove roots | 146 | 146 | 139 | 141 | 535 | 530 | 0.60 | 0.62 | 891.67 | 854.84 | −2 | 7 | 5 | 2 | ||
| 1 set of mangrove roots | 142 | 142 | 137 | 138 | 528 | 519 | 0.61 | 0.60 | 865.57 | 865.00 | −1 | 5 | 4 | 1 | ||
| 1 set of mangrove roots | 148 | 147 | 142 | 142 | 519 | 515 | 0.62 | 0.60 | 837.10 | 858.33 | 0 | 6 | 5 | 1 | ||
| 1 set of mangrove roots | 149 | 148 | 142 | 143 | 539 | 528 | 0.57 | 0.51 | 945.61 | 1035.29 | −1 | 7 | 5 | 2 | ||
| 1 set of mangrove roots | 152 | 152 | 149 | 150 | 527 | 520 | 0.57 | 0.61 | 924.56 | 852.46 | −1 | 3 | 2 | 1 | ||
| 1 set of mangrove roots | 150 | 150 | 146 | 147 | 532 | 520 | 0.61 | 0.63 | 872.13 | 825.40 | −1 | 4 | 3 | 1 | ||
| 1 set of mangrove roots | 147 | 147 | 144 | 145 | 530 | 519 | 0.58 | 0.60 | 913.79 | 865.00 | −1 | 3 | 2 | 1 | ||
| Average | 147.00 | 146.80 | 141.60 | 142.80 | 530.50 | 521.40 | 0.589 | 0.596 | 902.17 | 877.71 | −1.20 | 5.40 | 4.00 | 1.40 | ||
References
- Osorio, A.; Piedrahita, A.; Arredondo, M.; Henao, A. Study of the Velocity and Wave Damping in a Physical Model of a Mangrove Forest Including Secondary Roots Study of the Velocity and Wave Damping in a Physical Model of a Mangrove Forest In-cluding Secondary Roots. Coastal Struct. 2019. [Google Scholar] [CrossRef]
- Hashim, A.M.; Catherine, S.M.P. A Laboratory Study on Wave Reduction by Mangrove Forests. APCBEE Procedia 2013, 5, 27–32. [Google Scholar] [CrossRef] [Green Version]
- Catherine, S.M.P.; Takaijudin, H.; Hashim, A.M. Effectiveness of Mangrove Forests in Surface Wave Attenuation: A Review. Res. J. Appl. Sci. Eng. Technol. 2013, 5, 4483–4488. [Google Scholar] [CrossRef]
- Mazda, Y.; Magi, M.; Ikeda, Y.; Kurokawa, T.; Asano, T. Wave reduction in a mangrove forest dominated by Sonneratia sp. Wetl. Ecol. Manag. 2006, 14, 365–378. [Google Scholar] [CrossRef]
- Mazda, Y.; Magi, M.; Kogo, M.; Hong, P.N. Mangroves as a coastal protection from waves in the Tong King delta, Vietnam. Mangroves Salt Marshes 1997, 1, 127–135. [Google Scholar] [CrossRef]
- Wolanski, E.; Mazda, Y.; Furukawa, K.; Ridd, P.; Kitheka, J.; Spagnol, S.; Stieglitz, T. Water circulation in mangroves, and its implications for biodiversity. In Oceanographic Processes of Coral Reefs: Oceanographic Processes of Coral Reefs; CRC Press: Boca Raton, FL, USA, 2001; pp. 53–76. [Google Scholar]
- Strusinskacorreia, A.; Husrin, S.; Oumeraci, H. Tsunami damping by mangrove forest: A laboratory study using parameterized trees. Nat. Hazards Earth Syst. Sci. 2013, 13, 483–503. [Google Scholar] [CrossRef] [Green Version]
- Husrin, S.; Strusińska, A.; Oumeraci, H. Experimental study on tsunami attenuation by mangrove forest. Earth Planets Space 2012, 64, 973–989. [Google Scholar] [CrossRef] [Green Version]
- Bouma, T.J.; De Vries, M.B.; Low, E.; Peralta, G.; Tánczos, I.C.; Van De Koppel, J.; Herman, P.M.J. Trade-offs related to ecosystem engineering: A case study on stiffness of emerging macrophytes. Ecology 2005, 86, 2187–2199. [Google Scholar] [CrossRef] [Green Version]
- Hoque, A.; Husrin, S.; Oumeraci, H. Laboratory studies of wave attenuation by coastal forest under storm surge. Coast. Eng. J. 2018, 60, 225–238. [Google Scholar] [CrossRef]
- Van Zwicht, B.N.M. Effect of the Concrete Density on the Stability of Xbloc Armour Unit. Master’s Thesis, Delft University of Technology, Hydraulic Engineering Section, Delft, The Netherlands, 2009. Available online: https://repository.tudelft.nl/islandora/object/uuid:8866d0ca-1ecf-4ea0-bb91-f0623a14de94?collection=research (accessed on 16 April 2021).
- Muttray, M.; Reedijk, J.; Vos-Rovers, I.; Bakker, P. Placement and structural strength of Xbloc® and other single layer armour units. In Proceedings of the International Conference on Coastlines, Structures and Breakwaters 2005: Harmonising Scale and Detail, London, UK, 20–22 April 2006; pp. 556–567. [Google Scholar]
- Oever, E.T.; Verhagen, H.J.; Klabbers, M.; Reedijk, B. Theoretical and experimental study on the placement of Xbloc armour units. In Coastal Engineering; Delft University of Technology, Coastal Engineering Section: Delft, The Netherlands, 2007. [Google Scholar] [CrossRef]
- Safari, I.; Mouaze, D.; Ropert, F.; Haquin, S.; Ezersky, A. Hydraulic stability and wave overtopping of Starbloc® armored mound breakwaters. Ocean Eng. 2018, 151, 268–275. [Google Scholar] [CrossRef]
- De Koppel, V. Hydraulic Stability and Practical Application of XblocPlus Breakwater Armouring. Coastal Struct. 2019. [Google Scholar] [CrossRef]
- Yuanita, N.; Kurniawan, A.; Setiawan, H.; Hasan, F.; Khasanah, M. Physical Model of Natural Coastal Protection System: Wave Transmission over Mangrove Seedling Trees. J. Coast. Res. 2019, 91, 176–180. [Google Scholar] [CrossRef]
- Manis, J.E.; Garvis, S.K.; Jachec, S.M.; Walters, L.J. Wave attenuation experiments over living shorelines over time: A wave tank study to assess recreational boating pressures. J. Coast. Conserv. 2015, 19, 1–11. [Google Scholar] [CrossRef]
Figure 1.
The designs of the Xbloc (a) and mangrove roots (b) to be 3D printed.

Figure 2.
Sketch of experimental setup within the 5 m flume tank.

Figure 3.
Front view showing before and after model wave height measurements using the pin-tipped steel ruler for two mangrove roots (a) and one Xbloc wall (b) (three Xblocs on top of each other = Xbloc wall).
Figure 3.
Front view showing before and after model wave height measurements using the pin-tipped steel ruler for two mangrove roots (a) and one Xbloc wall (b) (three Xblocs on top of each other = Xbloc wall).

Figure 4.
Typical arrangement of one Xbloc wall with two mangrove roots inside a 5 m flume tank.

Figure 5.
Effect of artificial Xbloc walls and mangrove root models on wave parameters (red dotted line divides left and right halves of the figures to distinguish the first three from the last three models).
Figure 5.
Effect of artificial Xbloc walls and mangrove root models on wave parameters (red dotted line divides left and right halves of the figures to distinguish the first three from the last three models).

Figure 6.
Variation of the wave celerity with the transmission coefficient.

Figure 7.
Variation of the wavelength with the transmission coefficient.

Figure 8.
Variation of the wave period with the transmission coefficient.

Table 1.
Summarised list of the mangrove characteristics/hydraulic conditions and their contribution towards wave attenuation.
Table 1.
Summarised list of the mangrove characteristics/hydraulic conditions and their contribution towards wave attenuation.
| S/N | Feature | Contribution |
|---|---|---|
| 1 | Mangrove density | Denser forests attenuate wave more effectively |
| 2 | Forest structure and width | Narrower forest width can be adopted for coastal protection when vegetation is tall and thick |
| 3 | Water depth | Resistance to wave increases with water depth in vegetated areas due to submergence of extra shoot but decrease with water depth for unvegetated areas |
| 4 | Incident wave height | Wave attenuation varies linearly with incident wave height in mangrove-protected zones but independent of the height for non-vegetated areas |
| 5 | Rhizophora spp. and Bruguiera spp. have complex and bigger aerial roots compared to Kandelia candel | Rhizophora spp. and Bruguiera spp. provide greater drag force and extra resistance to waves attack than Kandelia candel |
| 6 | Mangrove age | Mature trees are stiffer, more structurally stable and less susceptible to uprooting/breakage, therefore better attenuation capacity |
| 7 | Spartina anglica has stiffer shoot compared to Zostera noltii | Spartina anglica dissipate hydrodynamic forces up to about three times higher than Zostera noltii |
Table 2.
Average wave measurement results for six different model combinations of Xbloc walls and mangrove roots (each combination was repeated 10 times, and the details are given in Appendix A).
Table 2.
Average wave measurement results for six different model combinations of Xbloc walls and mangrove roots (each combination was repeated 10 times, and the details are given in Appendix A).
| Model Combination | Two Xbloc Wall | One Xbloc Wall | One Xbloc Wall and Two Mangrove Roots | One Xbloc Wall and One Set of Mangrove Roots | Two Mangrove Roots | One Set of Mangrove Roots |
|---|---|---|---|---|---|---|
| Height before models | 9.9 | 6.50 | 7.80 | 6.20 | 5.50 | 5.40 |
| Height after models | 4.5 | 3.40 | 3.20 | 3.50 | 3.70 | 4.00 |
| % Wave height Reduction | 54.55 | 47.69 | 58.97 | 43.55 | 32.73 | 25.93 |
| Transmission Coefficient | 0.455 | 0.523 | 0.410 | 0.565 | 0.673 | 0.741 |
| Wave Celerity (mm/s) | ||||||
| Before Models | 873.58 | 961.23 | 1011.53 | 988.59 | 915.28 | 902.17 |
| After Models | 729.97 | 805.69 | 743.88 | 862.74 | 845.47 | 877.71 |
| % Reduction | 16.44 | 16.18 | 26.46 | 12.73 | 7.63 | 2.71 |
| Wave length (mm) | ||||||
| Before Models | 531.00 | 577.60 | 625.30 | 596.00 | 537.50 | 530.50 |
| After Models | 492.90 | 538.20 | 590.90 | 573.80 | 522.20 | 521.40 |
| % Reduction | 7.18 | 6.82 | 5.50 | 3.72 | 2.85 | 1.72 |
| Wave Period (s) | ||||||
| Before Models | 0.608 | 0.602 | 0.621 | 0.604 | 0.588 | 0.589 |
| After Models | 0.676 | 0.669 | 0.797 | 0.666 | 0.619 | 0.596 |
| % delay | 11.18 | 11.13 | 28.34 | 10.26 | 5.27 | 1.19 |
Publisher’s Note: MDPI stays neutral with regard to jurisdictional claims in published maps and institutional affiliations. |
© 2021 by the authors. Licensee MDPI, Basel, Switzerland. This article is an open access article distributed under the terms and conditions of the Creative Commons Attribution (CC BY) license (https://creativecommons.org/licenses/by/4.0/).
Share and Cite
MDPI and ACS Style
Sabari, A.A.; Oates, A.R.; Akib, S. Experimental Investigation of Wave Attenuation Using a Hybrid of Polymer-Made Artificial Xbloc Wall and Mangrove Root Models. Eng 2021, 2, 229-248. https://0-doi-org.brum.beds.ac.uk/10.3390/eng2020015
AMA Style
Sabari AA, Oates AR, Akib S. Experimental Investigation of Wave Attenuation Using a Hybrid of Polymer-Made Artificial Xbloc Wall and Mangrove Root Models. Eng. 2021; 2(2):229-248. https://0-doi-org.brum.beds.ac.uk/10.3390/eng2020015
Chicago/Turabian StyleSabari, Adam Ado, Ashley Richard Oates, and Shatirah Akib. 2021. "Experimental Investigation of Wave Attenuation Using a Hybrid of Polymer-Made Artificial Xbloc Wall and Mangrove Root Models" Eng 2, no. 2: 229-248. https://0-doi-org.brum.beds.ac.uk/10.3390/eng2020015