Article

Selection of Unique Molecules for Cancer Treatment by Distance-Based Method: Hypericin Effect on Respiratory Chain

1
Center for Interdisciplinary Biosciences, Technology and Innovation Park, P.J. Safarik University in Kosice, Jesenna 5, 041 54 Kosice, Slovakia
2
Department of Biophysics, Institute of Physics, Faculty of Science, P.J. Safarik University in Kosice, Jesenna 5, 041 54 Kosice, Slovakia
*
Authors to whom correspondence should be addressed.
Submission received: 1 April 2021 / Revised: 31 May 2021 / Accepted: 3 June 2021 / Published: 8 June 2021

Abstract

:
The heterogeneous composition of tumors presents a significant obstacle to the selection of a single molecule as a potential universal inhibitor of tumor growth. Lipid signaling and cellular metabolism have become the main targets of anticancer treatment in recent years. The protein kinase C (PKC) regulators Gö6976, rottlerin, hypericin, and phorbol myristyl acetate have been identified as agents affecting cellular metabolism. Measurable parameters describing metabolism, endocytosis, and respiration were subjected to a distance-based computational procedure for higher dimensions to complement and extend the knowledge gained from experimental data. The mutual distances of the parameters of the substances applied to the cancer cells in the presence and absence of lipids were calculated within the Lp spaces. The distance-based methods and comparisons of the generalized distances suggested to us the exceptional role of hypericin in heterogeneous systems. Furthermore, our results are confirmed by Western blotting of the levels of respiratory chain proteins and enzymes active in oxidative stress defense in cancer cell monolayers and spheroids. PKCα and PKCδ have been studied for lipid-activated cell signaling. In this study, we attempt to apply the concept of parametric distance in cell signal transduction and activation where the above methods have not yet been used.

1. Introduction

Historically, theoretical approaches in the field of fundamental physics have led to geometrization, i.e., the transformation of information into a geometrical form or even its embodiment in manifolds [1]. The best known examples are Newtonian mechanics, special and general relativity, and, more recently, string theory. For example, in a recent mathematical formalization of superstring theory, the extra dimensions of spacetime are expected to take the form of a six-dimensional Calabi–Yau manifold [1]. It can be conjectured that, mainly due to the popularity of these physics-motivated spacetime abstractions and notions of dimensionality, this knowledge has been widely used in various scientific fields. Today, it is no longer surprising that we understand the information around us to be highly dimensional. Closer to our current topic is the problem of multidimensional inputs. This has become relevant, for example, in data mining. An elementary strategy that allows a better understanding of the problem of multidimensional data refers to the evaluation of a scalar quantity: the distance. The duality in determining the proximity or distance of data objects then promotes reduction, compression, and visualization techniques, as seen in the dimensionality reduction [2] and clustering methods of manifold learning (see, e.g., their application in genetics [3]).
Models for evolutionary distances and dissimilarities between units and species are well known in biology [4]. For example, the distance between a descendant and its ancestor is typically discussed. In terms of model selection, there are parametric and non-parametric types of models. An example of a parametric model of evolutionary distance written in the expected number of nucleotide changes is the Jukes–Cantor model [5], which studies similarity differences between DNA sequences. In general, however, the concept of distance in biological modeling and processing is not always derived from first principles. Although the form of distance is difficult to determine, guidelines are usually derived based on general analogies as well as simplicity of choice. Some distance model settings can be set iteratively by optimization processes in the space of possible distance shapes with free parameters. For example, in the case of Minkowski distances, there is a single free parameter, p. The process of finding and selecting free parameters can also be called learning, which is often based on an optimization procedure.
The problem of analysis, as well as comparing the stabilizing or destabilizing effect of different types of stimuli leading to either survival or cell death, can be applied to the specific case of protein kinase C (PKC) regulation. In this context, we have already identified four regulators of PKC: Gö 6976, PMA, rottlerin, and hypericin [6]. The evaluation can be based on a reduction to three levels of molecular effects, e.g., to discrete values of 0, 1, and 2. Each molecule can be characterized on the basis of eleven features (the number of dimensions equal to the number of features is typical for our examples, but not mandatory), depending on the specifics of the cellular stimuli, i.e., the features that form a vector comprising eleven dimensions, each dimension containing a unique number {0, 1, 2}. The most valuable message of this study is that the proposed approach can be used by anyone who wants to compare molecules by highlighting the importance of their differences (distances) in relation to their cellular effects.
There is some continuity of development in our research steps, which we briefly summarize here. We have shown that distance-based approaches, specifically cluster analysis of fluorescence lifetime probability vectors, can be used to reliably assess the extent of oxidative stress to glioma cells based on differences in sensor fluorescence lifetimes between five different treatments [6]. A recent study investigated statistical fluorescence lifetime abnormalities in oxygenation and oxidative stress in cells and tissues using different spacing models, which then served as the basis for hierarchical clustering approaches [7].
Our current research focuses on the methodological proposal of an effective distance-based model to characterize the effect of the lipid environment on cellular signaling, on one hand, and respiration, on the other. Therefore, we expect that the results of this distance-based study will be valuable in the study of cell death. The present work involves not only methodological and computational goals but also new opportunities for the development of systematic knowledge in the field of cell death processes.
Our goal is to demonstrate the effects of a molecule identified and computationally re-evaluated using the initially proposed methods on PKC signaling under lipid deprivation conditions. Furthermore, we will subsequently investigate the effect of the selected molecule on respiratory chain complexes in monolayers and spheroids of glioma cells. Spheroids will serve as a model for different arrangements of a spatially heterogeneous tumor with a heterogenous lipid supply.

2. Materials and Methods

2.1. Cell Cultures

U87 MG (human glioma, Cells Lines Services, Eppelheim, Germany) cells were cultured in monolayers (seeded into flask at 24 h before experiment) to 80% confluence and as spheroids (for one week in high density (>106 cells)) in the dark at 37 °C in a 5% CO2 humidified atmosphere. The cell culture medium (Dulbecco’s modified Eagle medium, D-MEM) was supplemented with 10% fetal bovine serum (FBS) and UltroserTM G serum (Pall, France), a serum substitute (2% UG). The medium contained L-glutamine (862 mg/L), sodium pyruvate (110 mg/L), glucose (4500 mg/L), and penicillin/streptomycin (1% w/w). All cell culture solutions were purchased from Gibco-Invitrogen, Life Technologies Ltd., Paisley, UK. BT 474 (human ductal breast carcinoma) cells were a gift from Prof. Pluckthun laboratory, University of Zurich, Zurich, Switzerland, and were grown in RPMI 1640 (LM-R1638/500, biosera, Nuaille, France) with 25 mM Hepes and stable glutamine supplemented with 10% fetal bovine serum (FBS). Cells were affected with 0.5 µM Gö 6976 (Sigma-Aldrich, Darmstadt, Germany), 0.5 µM PMA (Sigma-Aldrich), 10 µM rottlerin (Sigma-Aldrich), and 0.5 µM hypericin (Sigma-Aldrich).

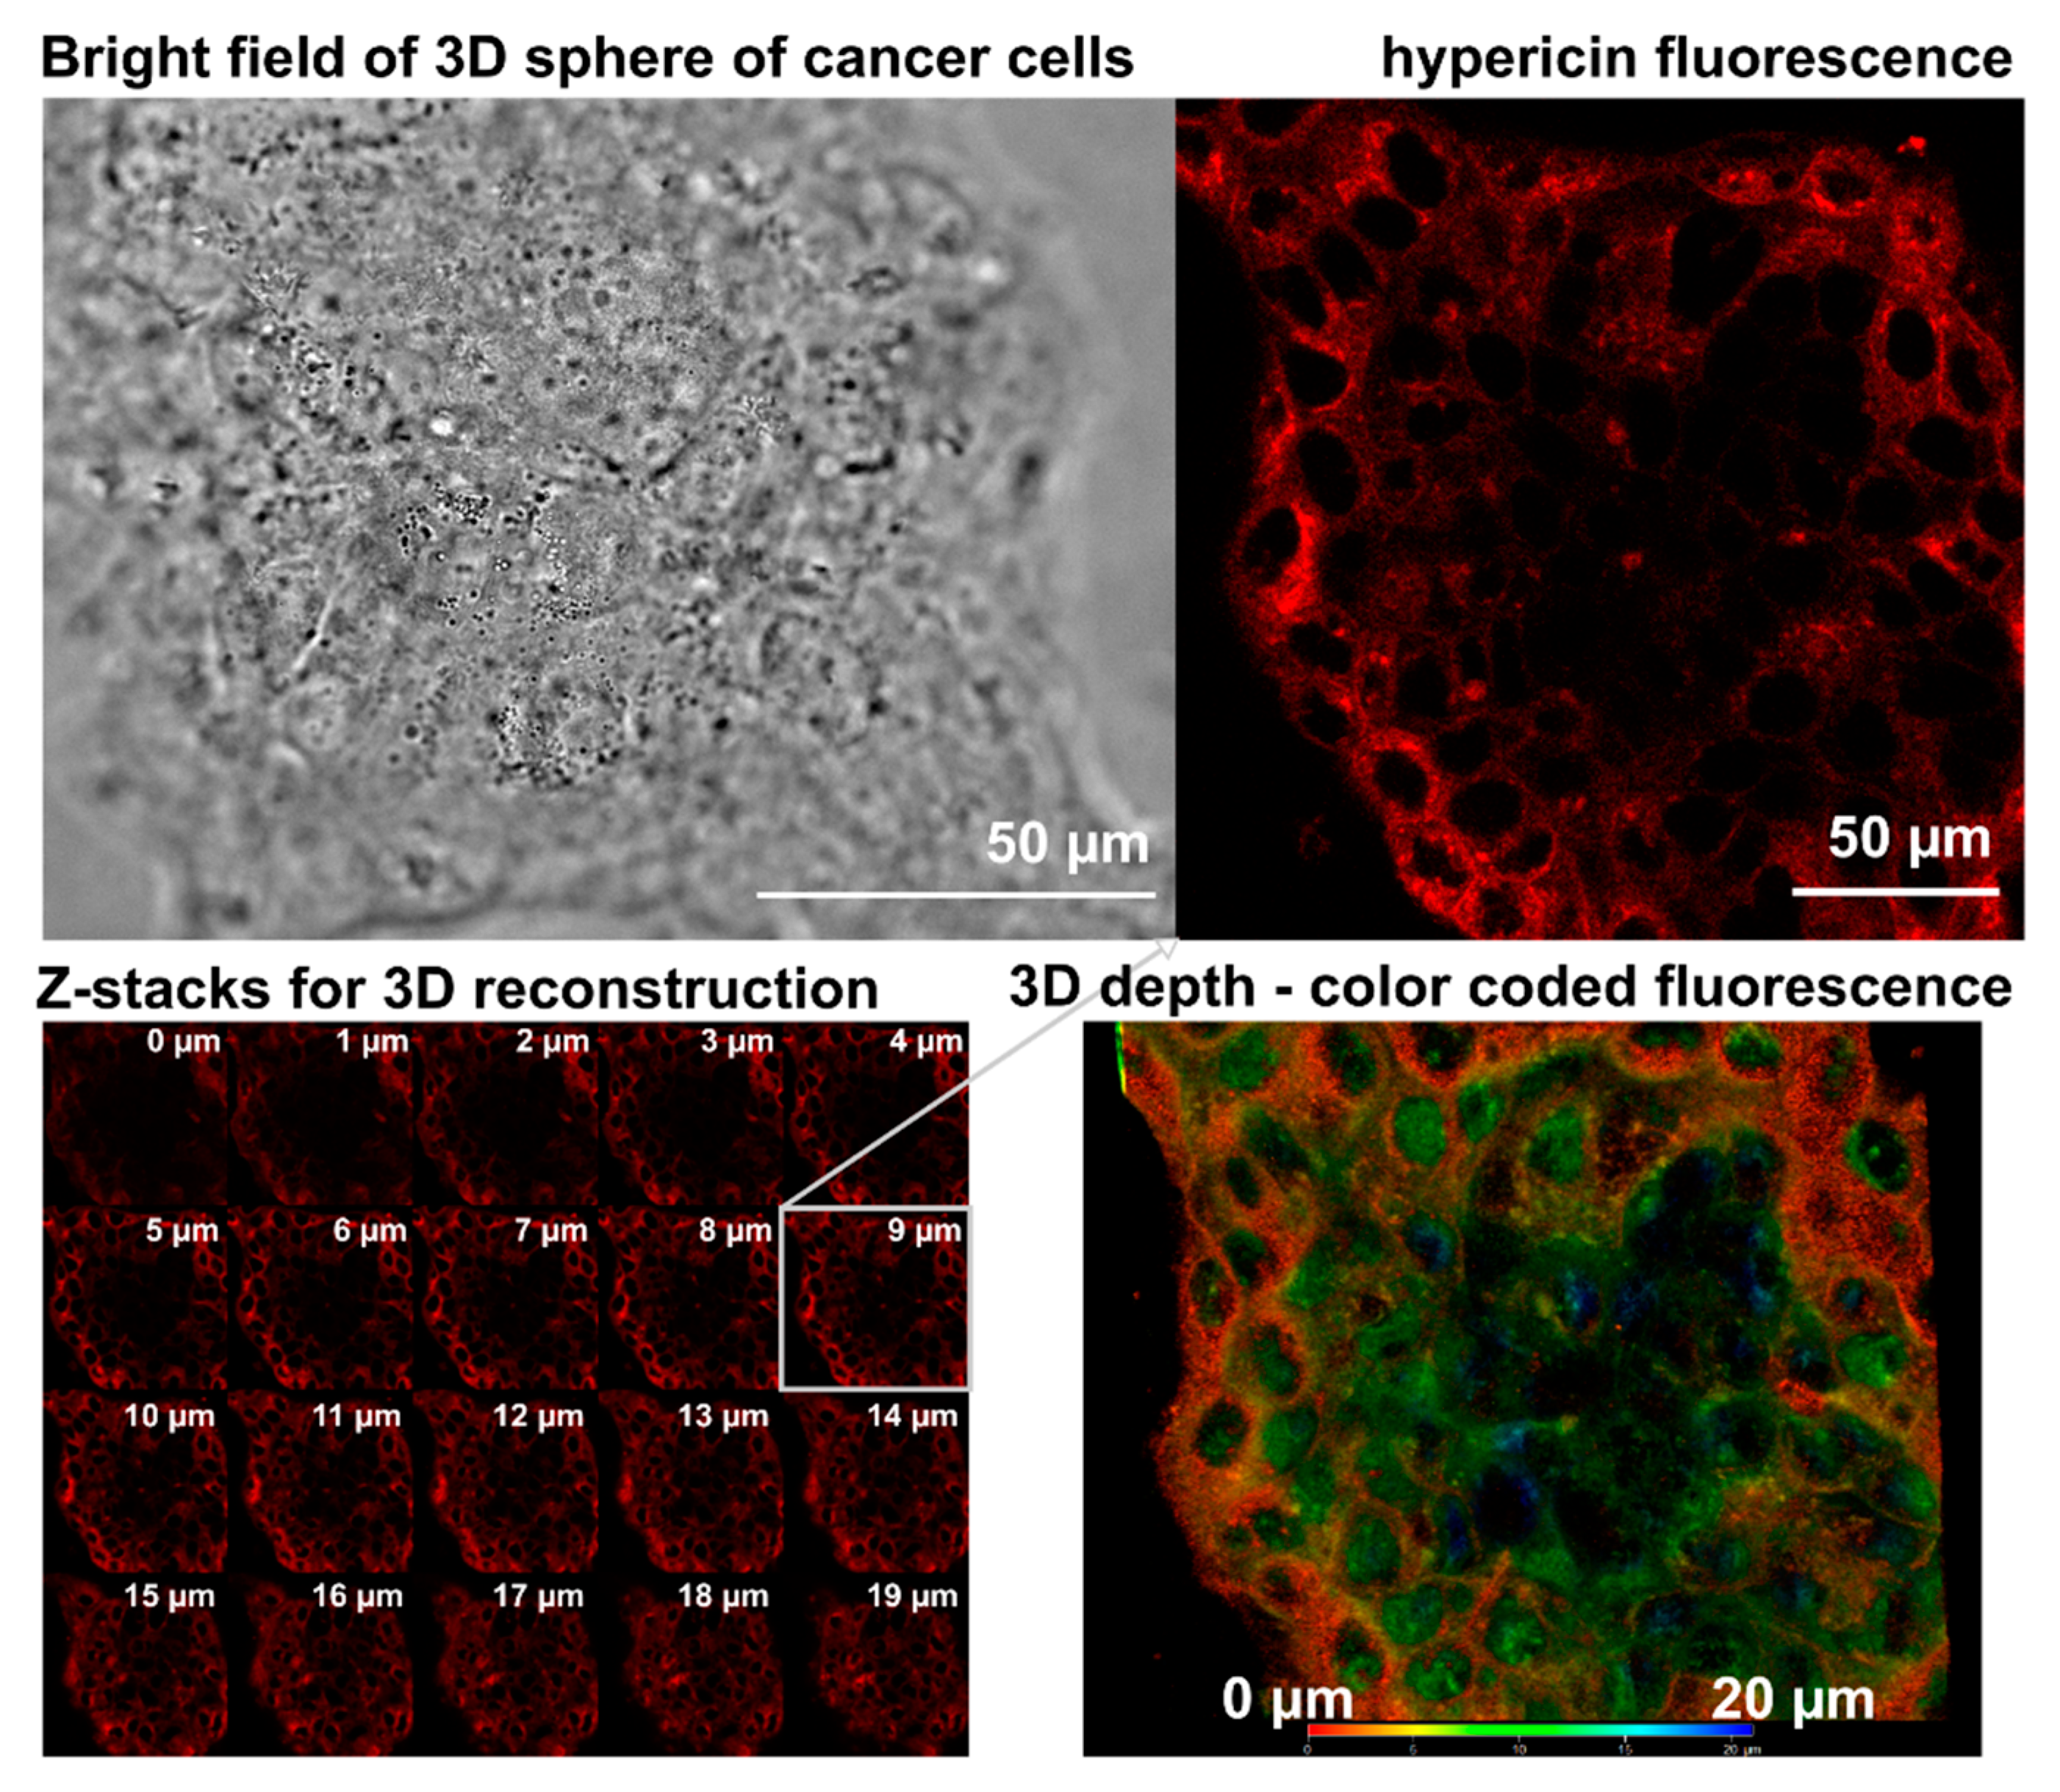
2.2. Confocal Fluorescence Microscopy

Spheroids from BT 474 cells were grown in coverslip-bottom Petri dishes (35 mm, MatTek, MA USA). Spheroids were treated with 0.5 µM hypericin for 1 h, washed, and transferred to an inverted LSM700 confocal microscope (Zeiss, Oberkochen, Germany) equipped with a 40× water immersion objective and a CCD camera (AxioCam HRm, Zeiss). Fluorescence images were acquired in brightfield and fluorescence modes at 555 nm excitation and > 580 nm emission. The Z-stack of a single spheroid was imaged. Three-dimensional reconstruction was performed using Zen 2011 software (Zeiss).

2.3. Western Blot

Western blot analysis of OXPHOS (V-ATP5A, III-UQCRC2, II-SDHB, IV-COX II, I-NDUFB8), oxidative stress defense (catalase, smooth muscle actin, SOD1, TRX), PKCα, and PKCδ levels in U87 MG monolayers and spheroids grown in 10% FBS and 2% UG were determined using antibodies (abcam, Cambridge, UK): anti-PKC delta ab182126 (1:5000), anti-PKC alpha ab23513 (1:3000), total OXPHOS human Western blot antibody cocktail ab110411(1:1000), and oxidative stress defense Western blot cocktail ab179843 (1:1000). Cell lysates were prepared in RIPA buffer (150 mM NaCl, 1% Triton X-100, 0.5% sodium deoxycholate, 0.1% sodium dodecyl sulfate, 20 mM Tris buffer saline at pH 8.0) with inhibitor cocktail (2x 1:100, HaltTM Protease & Phosphatase Inhibitor Cocktail, ThermoFisher Scientific, Waltham, MA, USA) from cells incubated for 1 h with 0.5 µM Gö 6976, 0.5 µM PMA, 10 µM rottlerin, and 0.5 µM hypericin in 10% FBS or 2% UG. Electrophoresis was performed according to the protocol described previously [6]. Proteins were transferred to a nitrocellulose membrane. The densities of the bands were immunodetected using Western Breeze Chromogenic Kit (ThermoFisher Scientific) according to the supplier’s protocol. The optical densities of visualized bands were calculated using ImageJ software (National Institutes of Health, Bethesda, MD, USA). The degree of significant difference from the untreated control and between samples in the presence and absence of lipids was evaluated using a one-way ANOVA test.

2.4. MTT Metabolic Assay

The metabolic assay was based on the conversion of 3-(4,5-dimethylthiazol-2-yl)-2,5-diphenyltetrazolium bromide (MTT, Sigma-Aldrich) to purple formazan in the mitochondria of cells. Formazan production dissolved in dimethyl sulfoxide (Sigma-Aldrich) was measured using a 96-well plate reader (GloMax®-Multi + Detection System with Instinct Software, Promega Corporation, Madison, WI, USA) from cells administered 0.5 μM hypericin along with respiratory chain regulators. Cells were co-incubated with 10 μM carbonyl cyanide 4-(trifluoromethoxy)phenylhydrazone (FCCP, Sigma-Aldrich), 10 μM oligomycin (Sigma-Aldrich), 10 μM antimycin A (Sigma-Aldrich), 10 μM rotenone (Sigma-Aldrich), and 0.238 μM catalase (Sigma-Aldrich) for 1 h. The cells were then incubated with a mixture of the two substances. After incubation, the cell culture medium was replaced and cells were irradiated with a homemade irradiation platform (orange light at 590 nm) at 1 and 4 J/cm2. MTT assay was performed 24 h after irradiation according to the supplier’s protocol.

2.5. Evaluation Criteria to Create Spider Diagram Presentation

The literature and references from our previous publications [6,8,9,10,11,12,13,14,15,16,17,18,19,20,21,22,23,24] provide us with quantitative information that suggests a possible classification. We first categorize and standardize the obtained knowledge into two main areas to investigate the topic using our chosen methods. When investigating the topic with our chosen approaches, we first categorize and standardize the knowledge by dividing it into two basic groups. The internal structure of these groups is also well defined and sufficiently rich in internal features. As the first group of cellular aspects, we introduce the one that evaluates stability/instability to metabolism, endocytosis, or respiration. The second group of aspects, on the other hand, will integrate information about cell growth in the presence and absence of lipids.
The first group was evaluated to determine the stabilization and destabilization of cells after their stimulation by Gö 6976, PMA, rottlerin, and hypericin. A control was set to the value of “1”, and the deviation towards stabilization was designated as “0” and destabilization as “2”. Parameters that were evaluated were: (1) fragmentation of Golgi apparatus (GA stability), (2) fluorescence intensity of NBDC6 (GA drug loading), (3) fluorescence lifetime of NBDC6 (oxidative stress in endomembrane system), (4) content of sphingosine-1-phosphate (regulation of cell fate), (5) number and integrity of lysosomes (acidification), (6) intensity of LysoTracker Green (endocytosis), (7) extracellular acidification rate (ECAR), (8) oxygen consumption rate (OCR), (9) dissipation of mitochondrial membrane potential (∆Ψm), (10) mitochondrial integrity (energetic metabolism), and (11) production of reactive oxygen species (oxidative stress). The second group was evaluated to determine pro-apoptotic and prosurvival stimuli induced by the studied molecules. Control was set to value “1”, and deviation towards “0” was assigned to apoptosis, and “2” to survival. Parameters evaluated were the cellular level of (1) increase in LDL receptors, (2) phosphorylation of PKCα catalytic domain (S657/Y658), (3) increase in PKCα, (4) increase in sphingosine-1-phosphatase, (5) phosphorylation of the regulatory domain of PKCδ (Y311), (6) phosphorylation of the catalytic domain of PKCδ (S645), and (7) the increase in PKCδ in the presence of the investigated molecules.

3. Results and Discussion

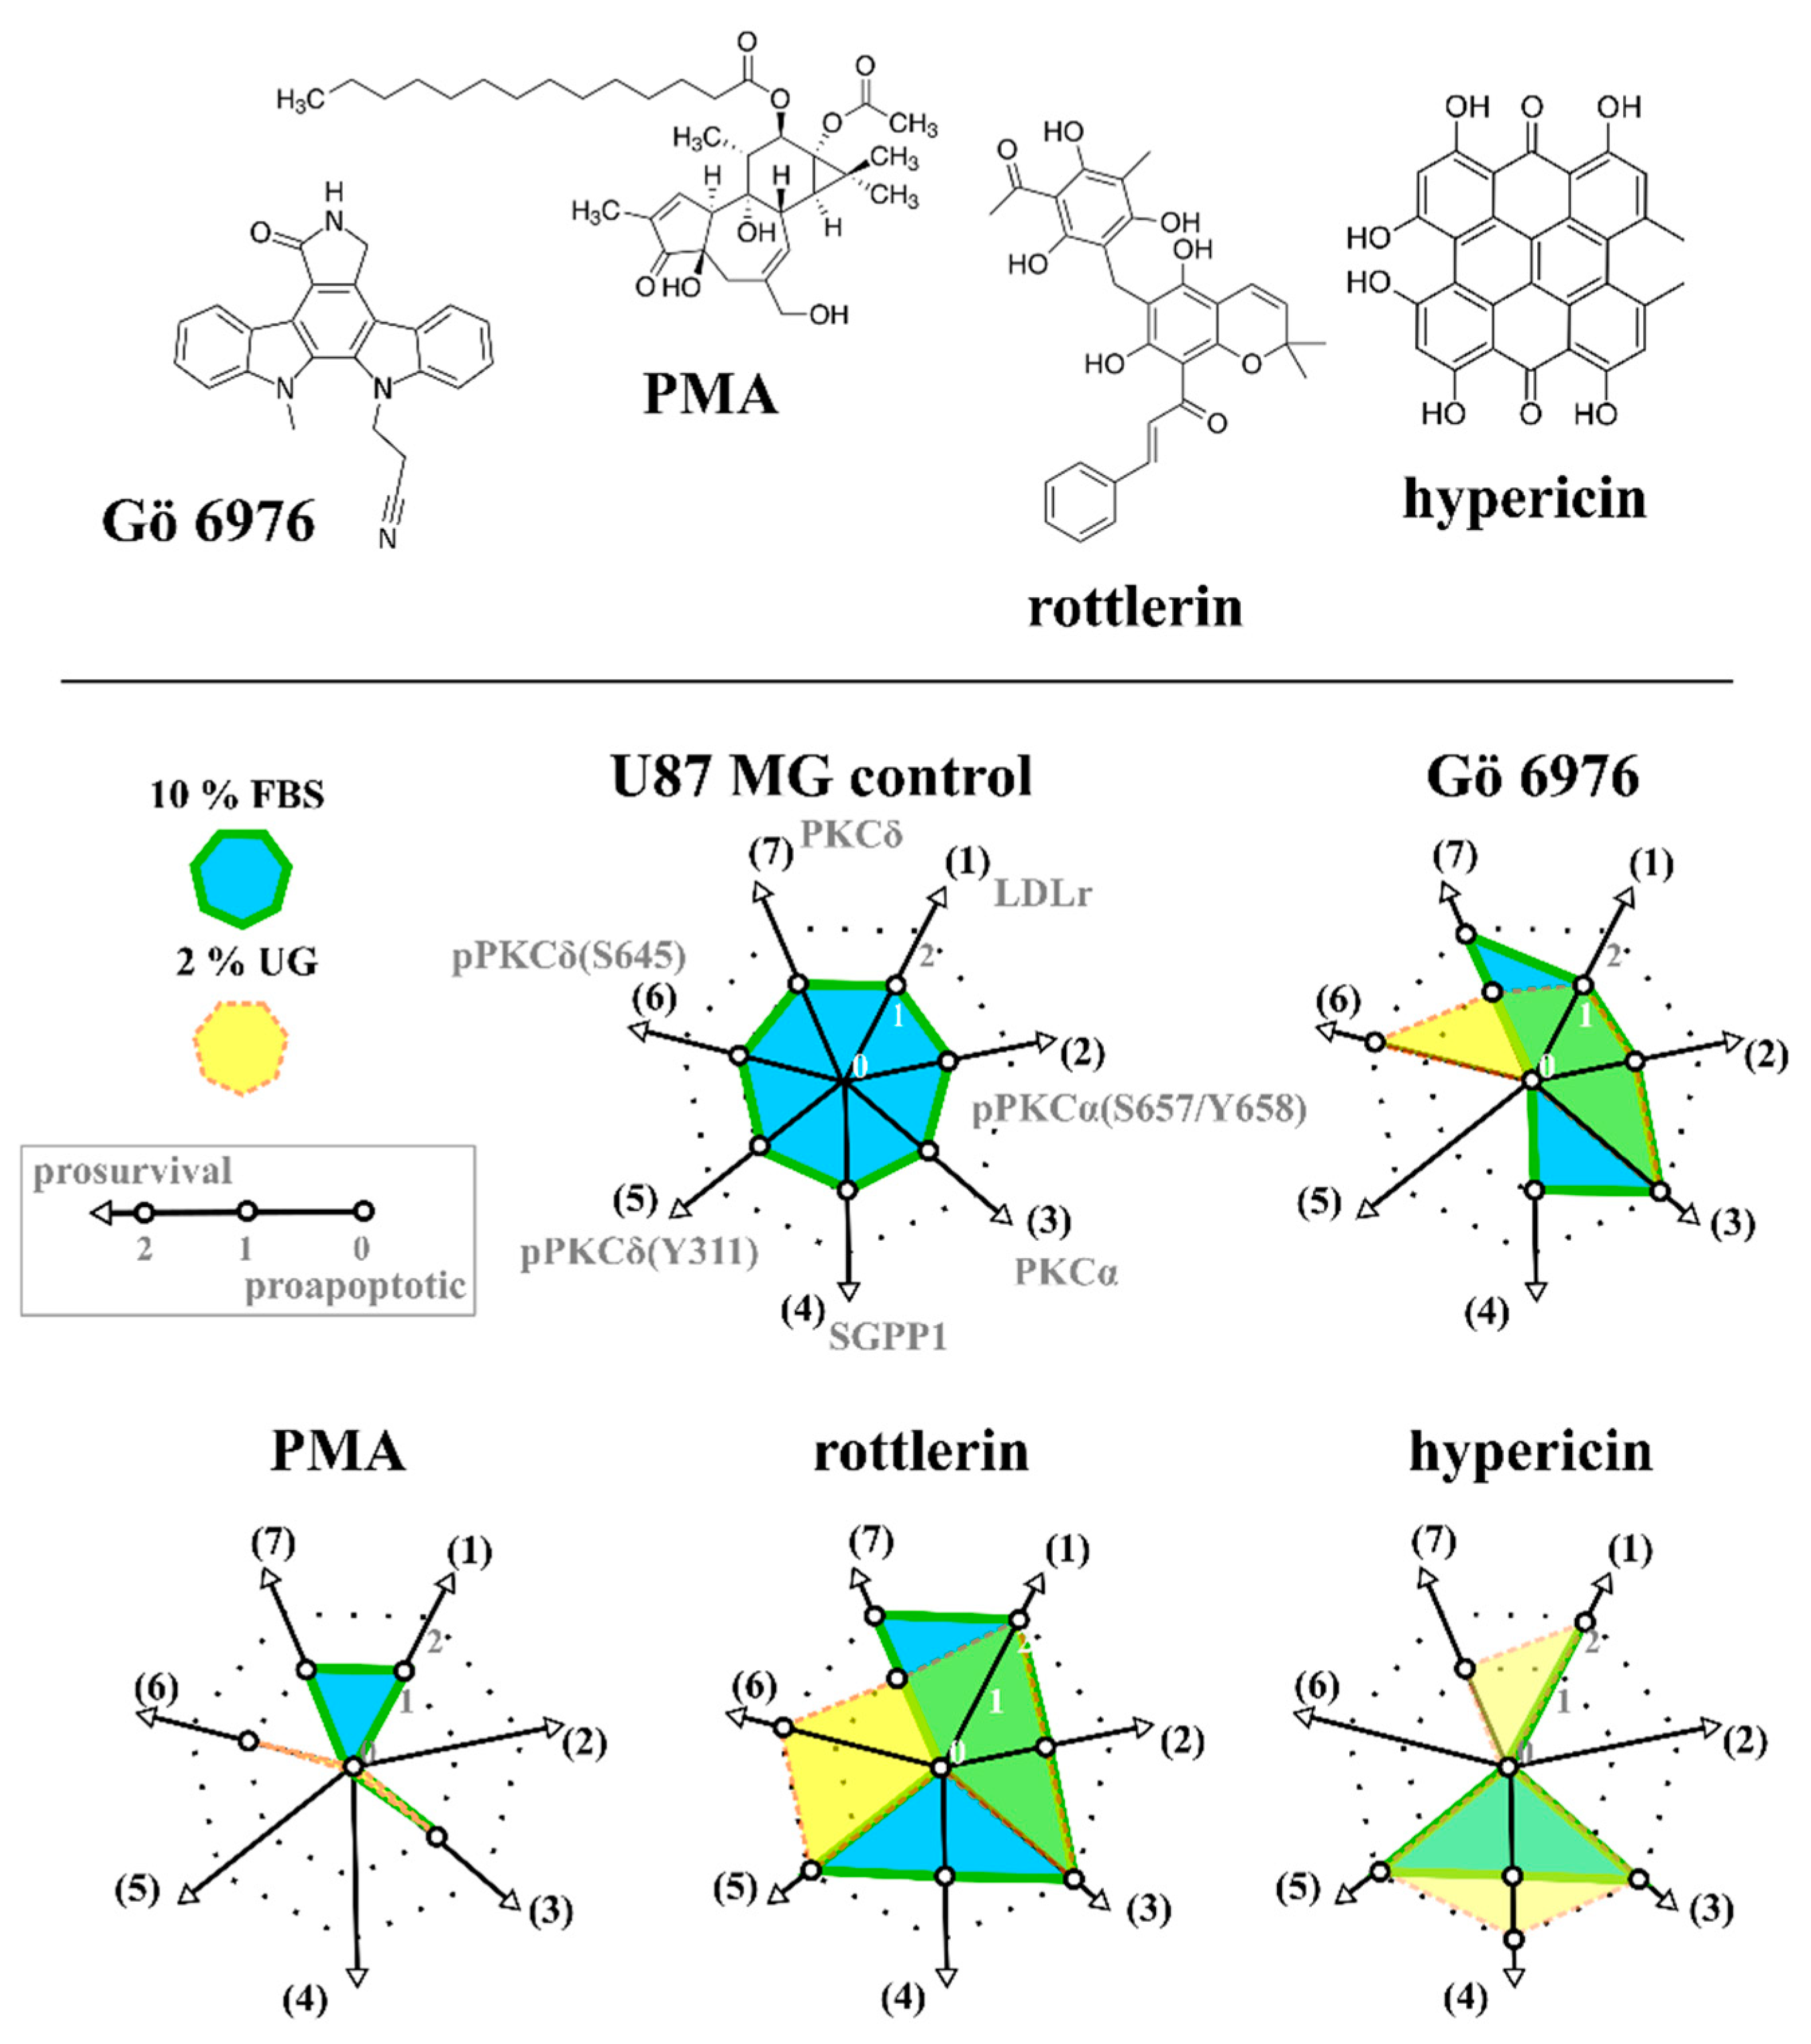
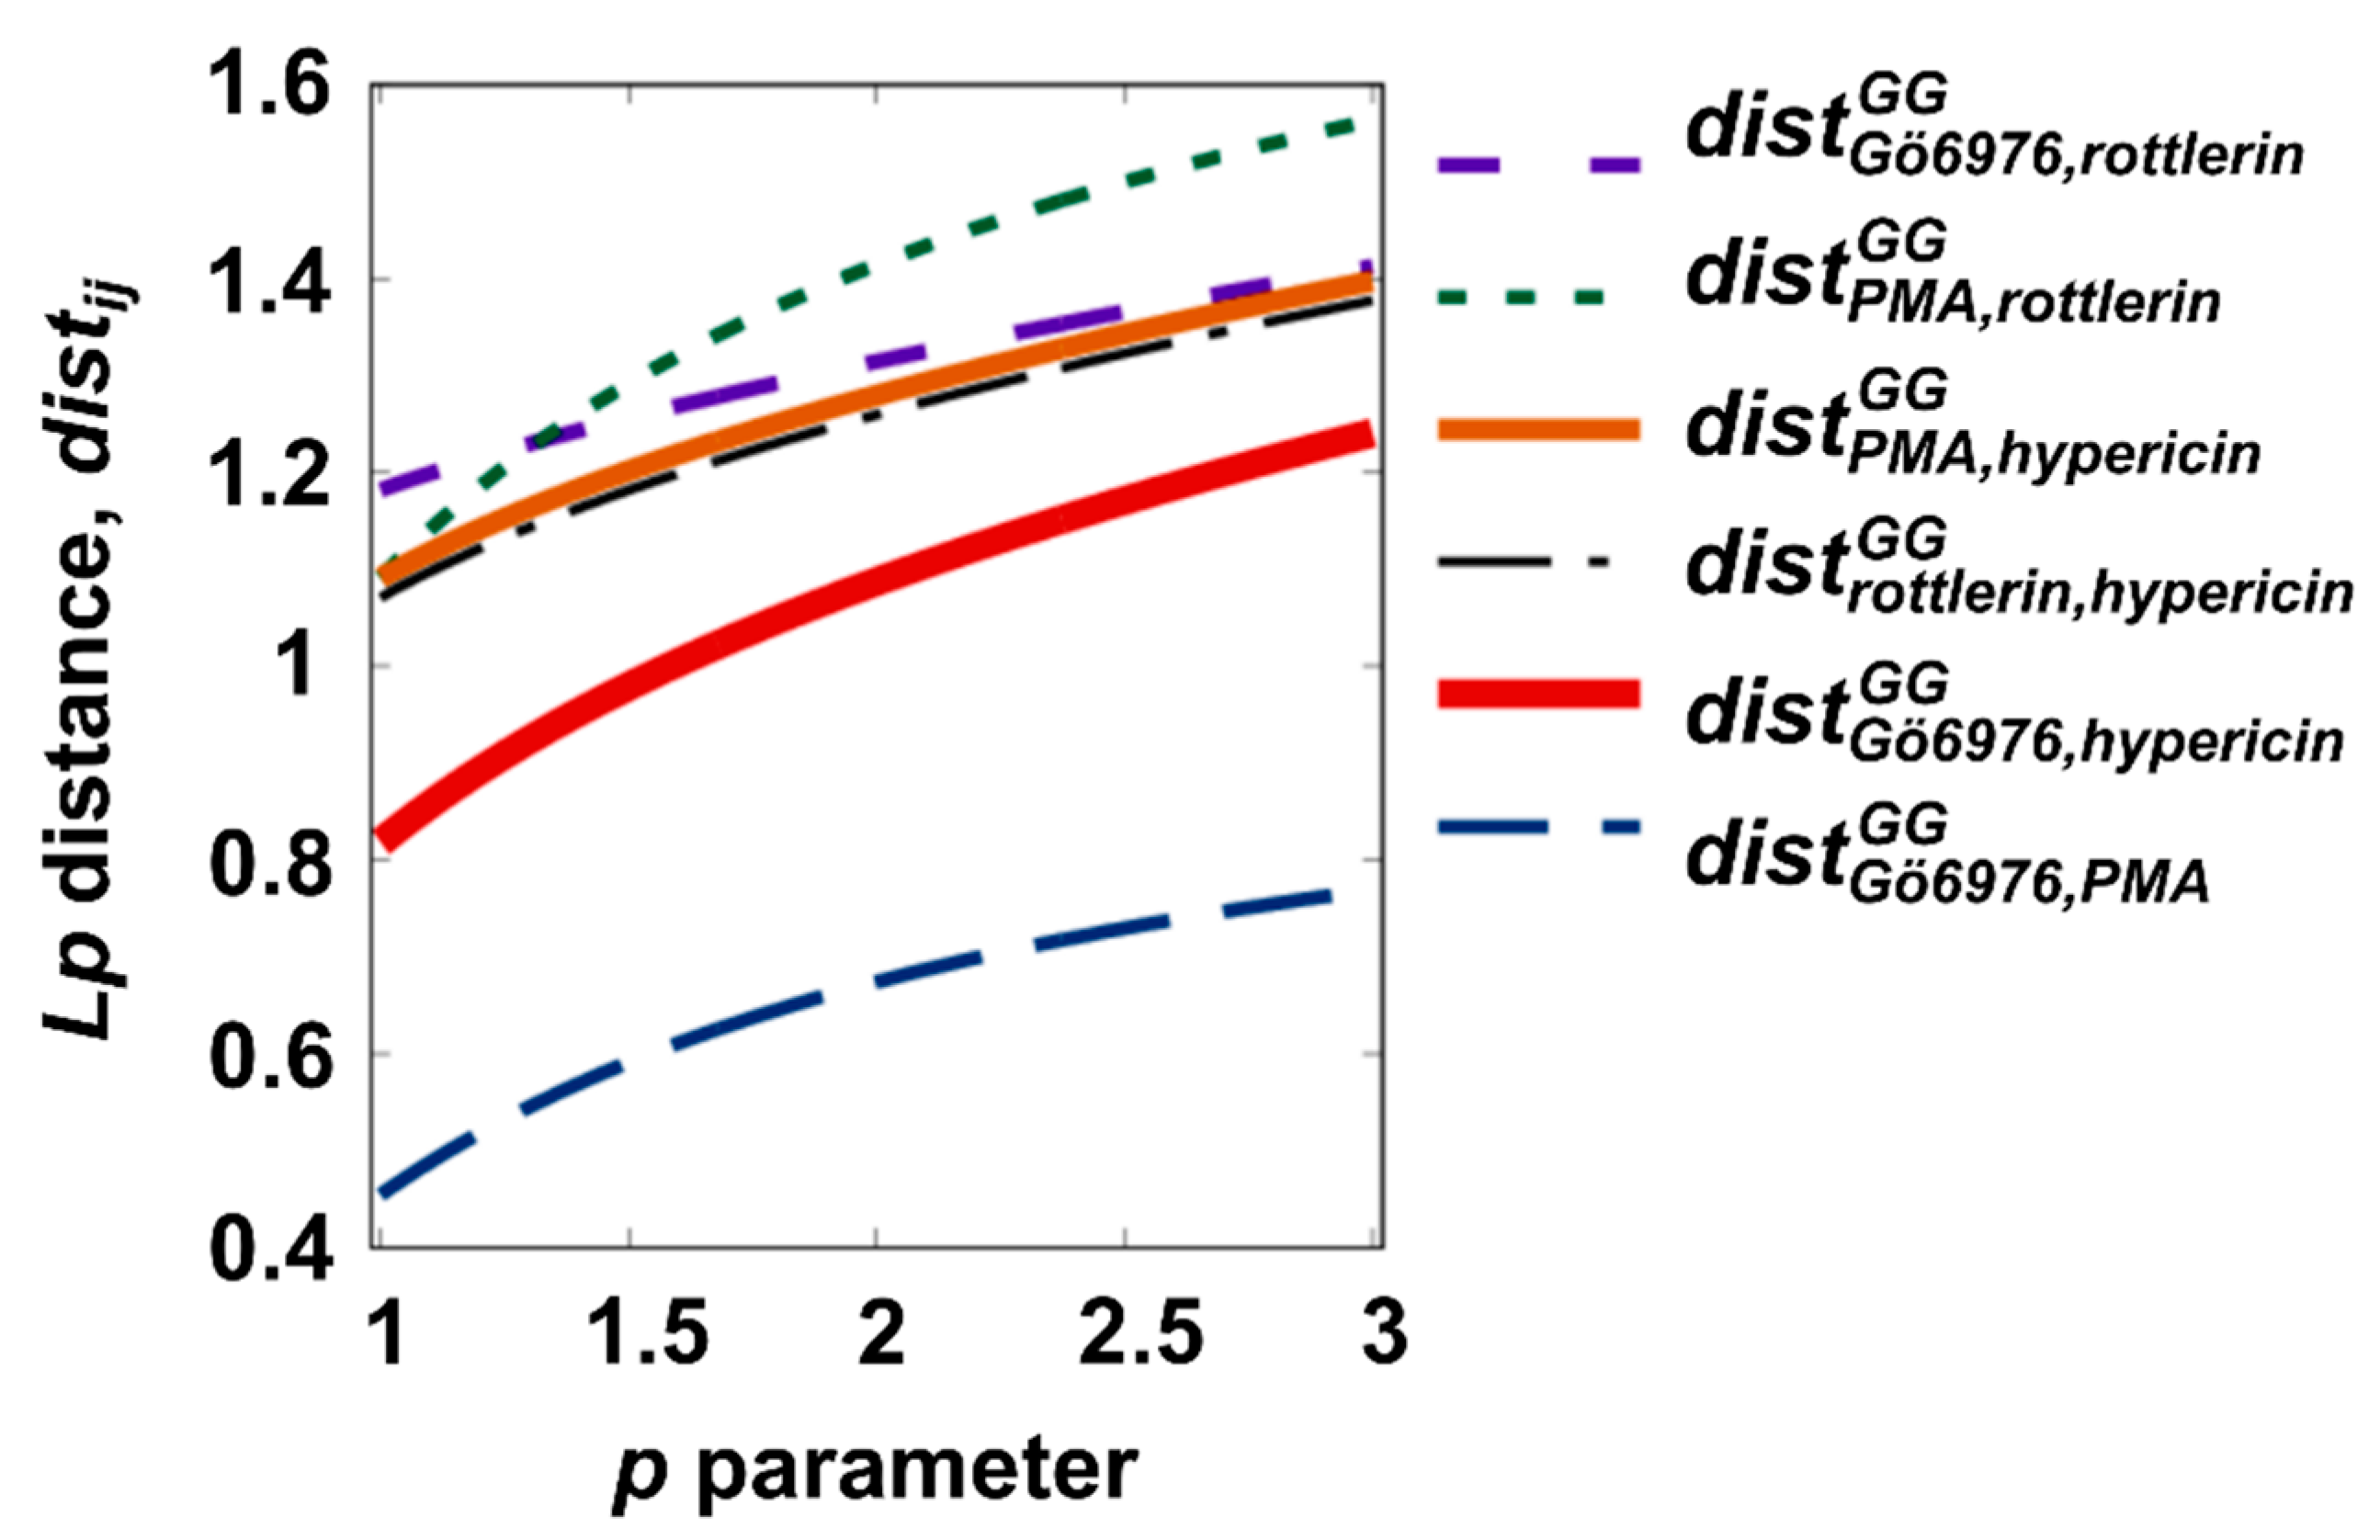
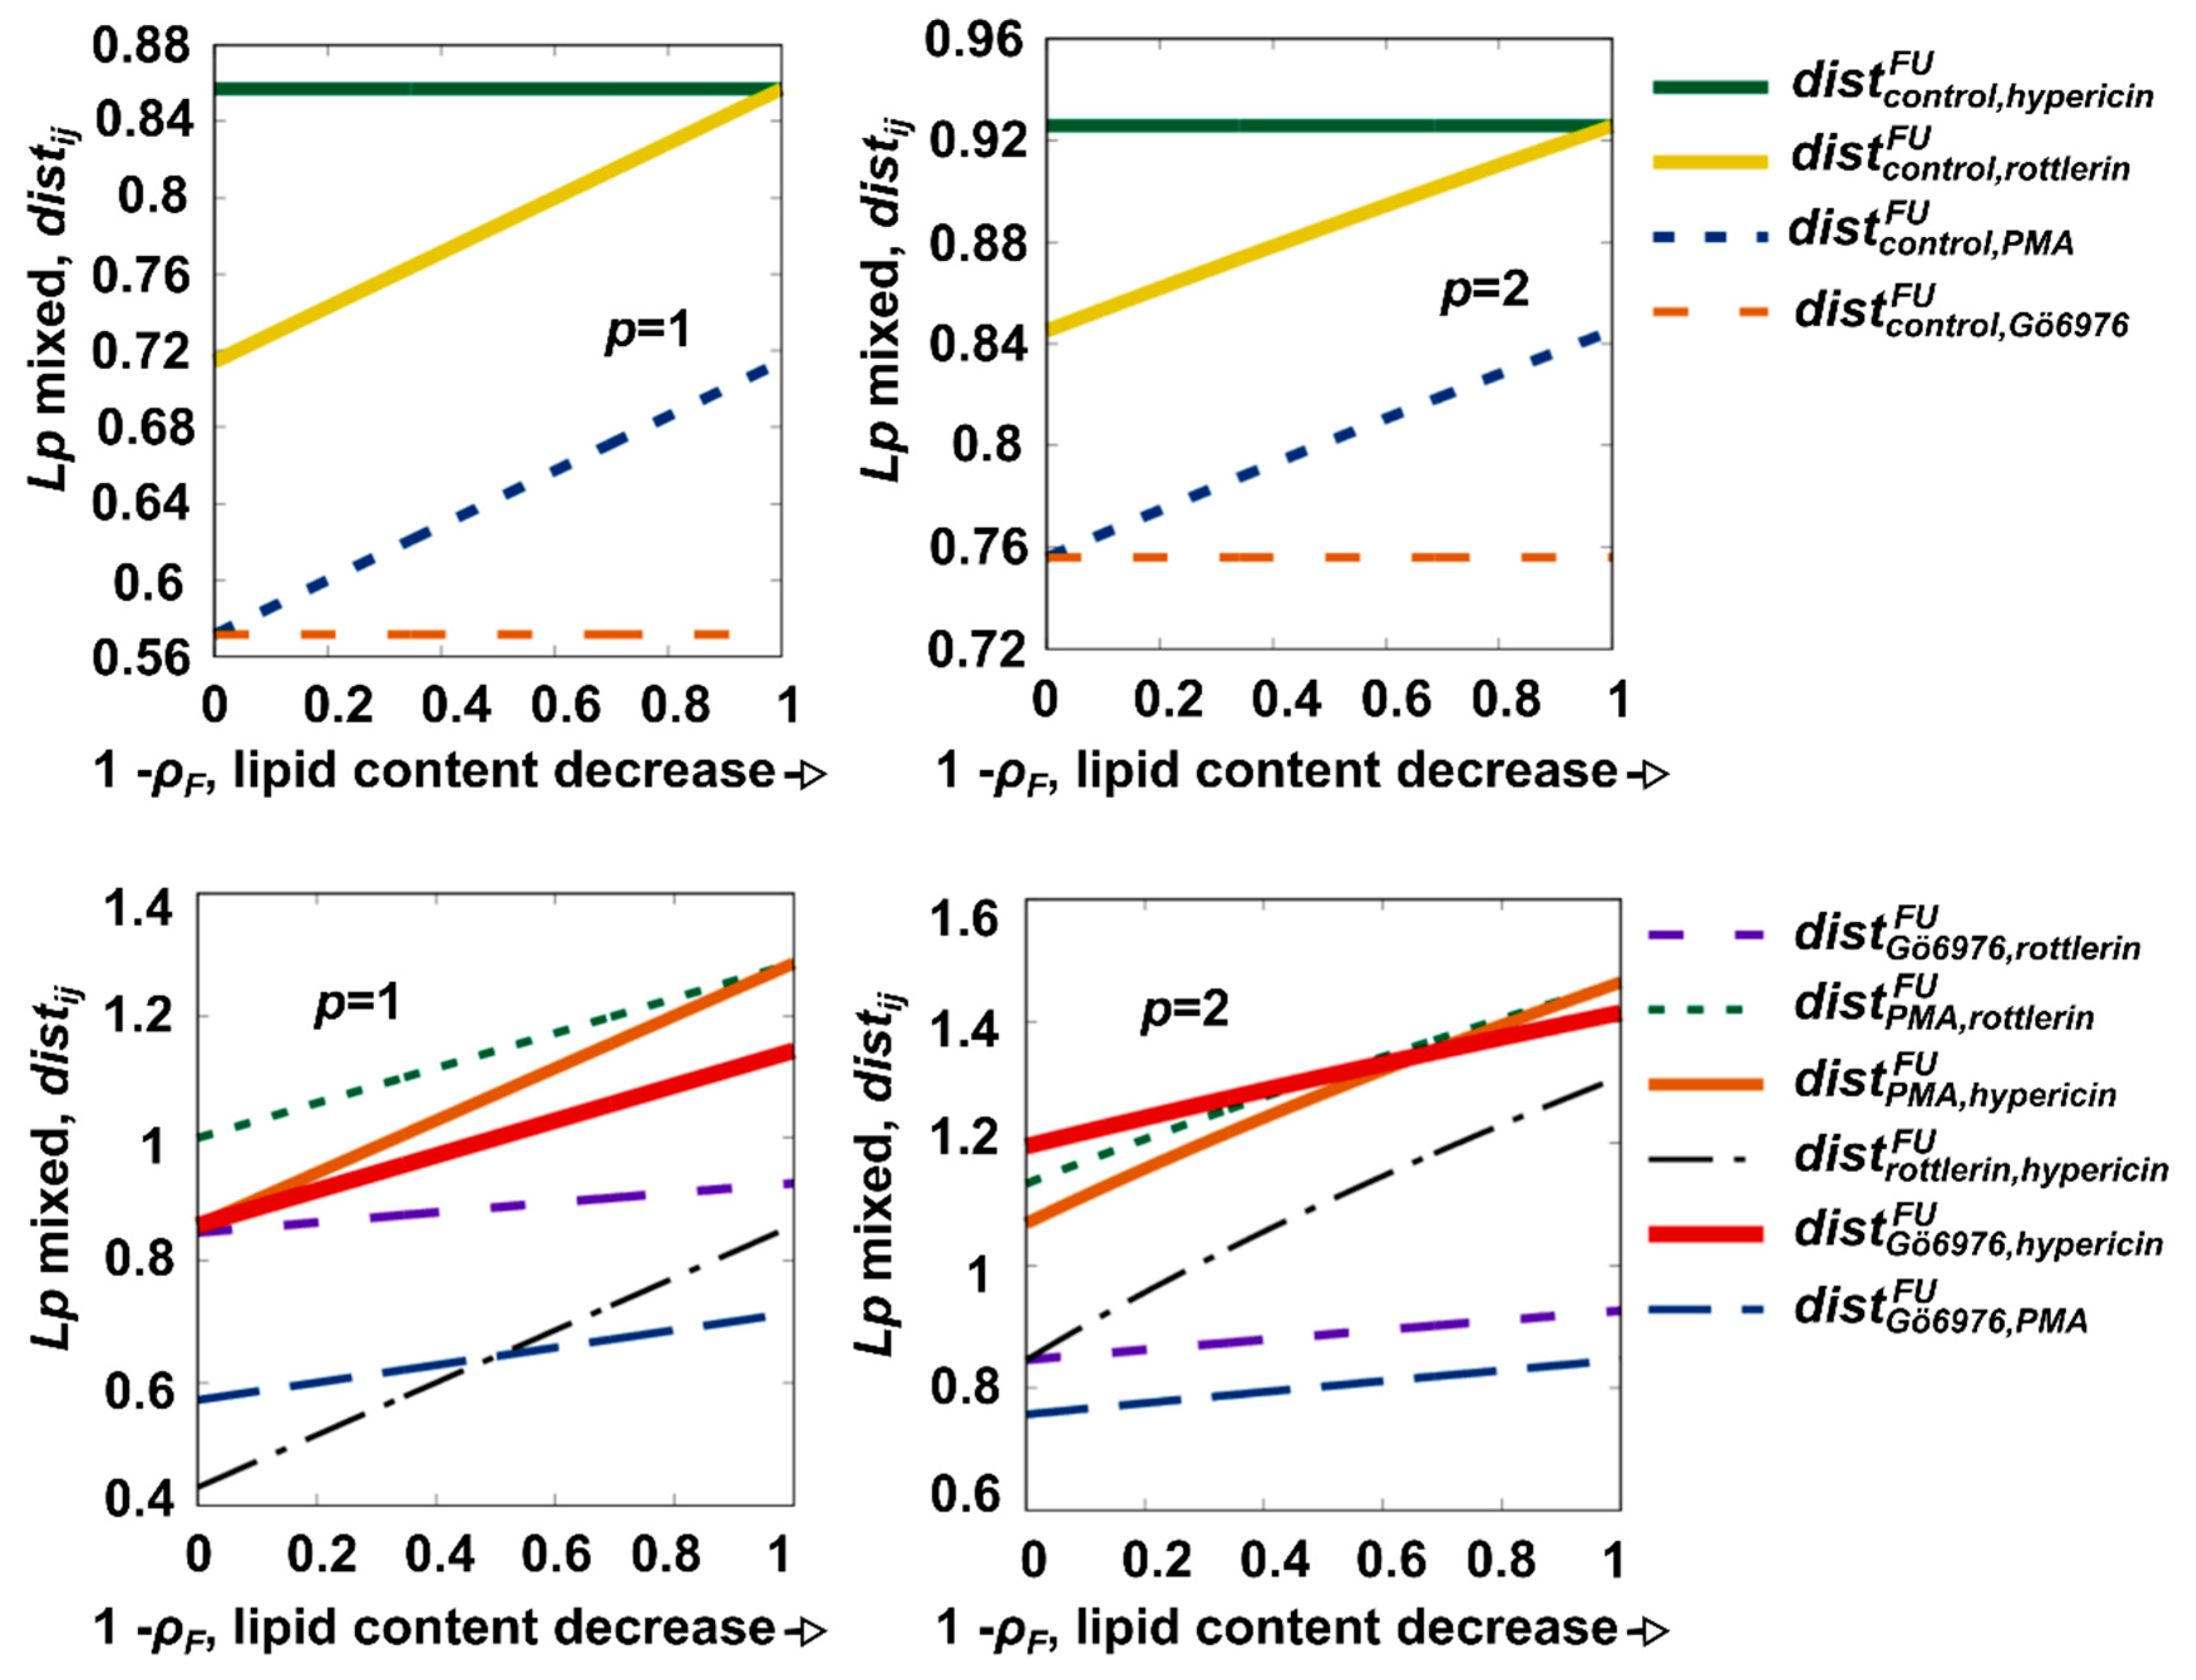
3.1. Selection of an Extraordinary Molecule between PKC Regulators by Distance-Based Analysis

As mentioned earlier, we have evaluated the agreement between experimental data patterns using distances (also referred to as differences or dissimilarities). In general, in the field of data science, these concepts are mainly focused on applications where they determine the aggregation of data into clusters (in our case, these would be clusters of similar molecules).
However, in this work, we only focus on the evaluation of distance in the context of finding pairwise relationships of vectors consisting of categorical (discrete) data, which is also due to the limited number of measurements or information sources available.
In our dataset, we aim to determine the distances of vectors whose components are categorized by the three levels, as explained previously in Section 2.5 in groups (1) and (2). The dataset can be organized in a matrix structure, where jM ≡ {0,1,2,3,4} denotes the columns corresponding to the molecules: control (j = 0), Gö 6976 (j = 1), PMA (j = 2), rottlerin (j = 3), and hypericin (j = 4). The categorical values of the group 1 parameters are summarized in Table 1. The parameters summarized in group 1 can be indexed by i ∈ {0,1,…,10} with X = G and characterize the response of cell metabolic activity. The identified categorical levels refer to GA stability (i = 0), GA drug tolerance (i = 1), oxidative stress in the endomembrane system (i = 2), cell fate regulation (i = 3), acidification (i = 4), endocytosis (i = 5), ECAR (i = 6), OCR (i = 7), ∆Ψm (i = 8), energetic metabolism (i = 9), and oxidative stress (i = 10).
In the dataset of group (2) (see Table 2 and Figure 1) (X = F,U), the data dimension is seven, i.e., the seven matrix rows contain the factors increase in LDL receptors (i = 0), phosphorylation of the PKCα catalytic domain (S657/Y658) (i = 1), increase in PKCα (i = 2), increase in sphingosine-1-phosphatase (i = 3), phosphorylation of the regulatory domain of PKCδ (Y311) (i = 4), phosphorylation of the catalytic domain of PKCδ (S645) (i = 5), and increase in PKCδ (i = 6).
Depending on the processed inputs, three matrix labeling variants were thus generated. The DatijG variant (size 11 × 5) contained data corresponding to the response to cell metabolic activity, DatijF (7 × 5) was used for lipid-mediated signaling in the presence of lipids (10% FBS), and DatijU (7 × 5) labeled data obtained for lipid-mediated signaling in the absence of lipids (2% UG).
For data corresponding to the response to cell metabolic activity, differences between molecules were quantified by the standard Lp form of the distance
distijGG(p) = [1/11Σk = 010|DatikG−DatjkG|p]1/p,   X = G
with (i,j) ∈ M × M, p ∈ [1,∞)⊂ R+. The norm 1/11 was used for normalization reasons. For the free parameter p, there is a variation in the class of distances. The known norms are p = 1 (Manhattan) and p = 2 (Euclidean).
In the case of lipid-mediated signal transduction, the differences between the effects of molecular species can be suitably described by weighted parametric measures based on Lp metrics. From a quantitative point of view, the lipid content is characterized by a normalized (homotopy) parameter, ρF ∈ [0,1], which occurs in the modified relation for the data distance given by
distijFU(p,ρF) = [ρFDijF(p) + (1−ρF)DijU(p)]1/p,
with two auxiliary terms
DijX(p) = 1/7Σk = 06|DatikX−DatjkX|p,   X ∈ {U,F}.
The upper indices F and U are used to distinguish two marginal data variants. Normalization is performed by averaging by a factor of 1/7. The specificity of the description is redetermined by the homotopic weights of the components connecting the marginal case ρF = 0 (low lipid content) with ρF = 1 (high lipid content). The role of categorical variables and the accuracy associated with the use of categorical variables are discussed in the Supplementary Material (Figures S1 and S2).
Figure 2 shows the distances resulting from the description by categorical variables (factors) describing the metabolic activity of cells (see Table 1). Here, we show both the dependencies and the distance relationships associated with the free parameter p. This plot illustrates that the choice of metric (mediated by p) has a significant quantitative aspect that can meaningfully influence interpretation. A total of six pairs of molecules were evaluated. The distances within two pairs of molecules, Gö 6976/PMA and Gö 6976/hypericin, were exceptionally small. A systemic relationship with hypericin features showed that the molecules had more similarities to Gö 6976 than to PMA or rottlerin (Figure 2). This statement is based on relationships within the subgroup described by three distances distY,hypericin, where Y represents Gö 6976, PMA, and rottlerin (dependencies on p should be mentioned). Rottlerin has special properties that set it apart from other molecules, almost as if it were its own molecule. When comparing PMA to other molecules, the differences emphasize the similarity of the PMA/Gö6976 pair. Note that the p ranges from one to three are central to our distance statements.
A homotopic [25,26,27] version of the Lp-like distance (see Equation (3)) was calculated for a system in which the fraction of lipids gradually decreases with the scalar coordinate ρF (Figure 3). The methods showed that the distances between hypericin and Gö 6976 were factors larger in the presence and absence of lipids than in the presence of the control (Figure 3). Moreover, the distance induced by rottlerin and PMA increased. The next step was to extensively test the effects of spacing for p = 1, 2, attempting to run the set of all possible pairs (Figure 3). The largest distances were found between stimuli elicited by Gö 6976 and PMA or rottlerin. The variations in spacing in the absence and presence of lipids are also of our interest, as they represent a natural explanation to construct homotopy. The influences of the lipids are, according to our findings, responsible for the great differences in action between rottlerin and hypericin, as is seen by their distance, which changes somewhat more rapidly to ρF.
To make the visual representation (spider diagrams) more feasible, we rearranged the categorized factors. This means that the values embodying the properties of the molecules can be viewed as projections of multidimensional spaces. Therefore, an appropriate projection is required to achieve insight, interpretation, and possible predictability. A widely known tool for converting high-dimensional data into low-dimensional values is the calculation of the distance itself (the scalar function of many variables) [28]. In the present work, the concept of distance was not forced to classify molecules themselves, but to compare them within pairs of molecules. Molecules are perceived here not only as chemical structures but also as abstract systems of categorically classified biological effects they have on the cell.
In data processing, the problem of selecting the appropriate metric is often ambiguous and depends largely on whether experts consider multidimensional data features to be the same or different. To properly determine which features—dimensions of the metric space—are uniquely needed, a comprehensive analysis based on the meaning of important and uniquely measurable categories, as well as the essential literature in the field, is paramount. In many disciplines where geometrically inspired distance-based methods (e.g., in economics, psychology, clustering, data comparison, data mining in general, or biostatistics) are used to process the data [29], determining not only the full metric but also, for example, its specific constant parameters p, based on empirical values or traditions, is justified.
In general, the machine learning method, also known as “metric learning”, can be used when the dataset is at least medium in size and there is a specific experience that can generate feedback. It can be designed to work in the direction in which the numerical result (distance, dissimilarity) can be fed back to form a more appropriate metric parametrization. At this stage, we have not applied such sophistication in our procedure. However, we have tried to find out to what extent the results obtained for other p parameter values are qualitatively different.
Tumors and cancerous structures are often spherical and not planar. The distribution of nutrition, including lipids, has a heterogeneous character [30]. Indeed, an abnormality of lipid metabolism promotes cancer development [31]. For this reason, a greater effort is devoted to multiscale analysis of the problem [32,33]. As shown in our recent research [6], the induction of PKC activation and phosphorylation depends on the lipid content, and lipid metabolism could be controlled with the hydrophobic molecules used. According to the heterogeneous distribution of lipids in the tumor, the cell response and signaling pathways triggered by PKC could also be heterogeneous. Moreover, cells may change their phenotype in response to treatments [34]. However, in the present study, distance-based analysis led to the identification of Gö 6976 and hypericin as unique molecules. In particular, hypericin, as a molecule effective in photodynamic therapy [22,35], appears to abolish the heterogeneity of the lipid distribution.
The calculation of abstract pairwise distances gives an idea of the richness of the relationships between the selected molecules in the test group or its subgroup. These sessions can be systematized and reduced, for example, by looking only for the closest or most distant pairs within a group. Emphasis can also be placed on understanding not only the absolute but also the relative measures obtained for pairs of stimulating molecular systems. The prerequisite for a more meaningful analysis is undoubtedly a thorough knowledge of the relevant features in the region of interest. Additionally, a better selection of factors/features can have a great impact on the significance and interpretation of the results.
One of the ideas presented in this paper is to link the lipid content using the abstraction distance. The linkage is conducted using the newly introduced scalar coordinate ρF. The resulting mapping has the character of a homotopic projection (continuous deformation), as known from topology. The independent coordinate ρF reflects how the lipid content affects differences (abstract distances) in the behavior of therapeutically relevant molecules. In perspective, ρF could be linked to a tumor-relevant coordinate, such as the lipid penetration depth or geometric distance measured from the malnutrition center. Consequently, in situations where the lipid concentration in space varies significantly, ρF could be a useful tool for heterogeneity understanding and tumor spheroid modeling. Furthermore, the distribution of the substance within the spheroids may introduce another degree of bias. An example of the distribution of hypericin in the microsphere of cancer cells is shown in Figure 4. The heterogeneity of the distribution is evident from the localization of fluorescence. We see that the localization is higher at the periphery but weak in the center of the spheroid. We suggest that hypericin is bound to cell membranes in the periphery of the spheroids. The fluorescence of hypericin increases with the presence of lipids and the hypericin concentration. Besides the different composition of the central core of the spheroids, a low hypericin concentration could be the reason for the heterogeneity of the distribution seen in Figure 4.

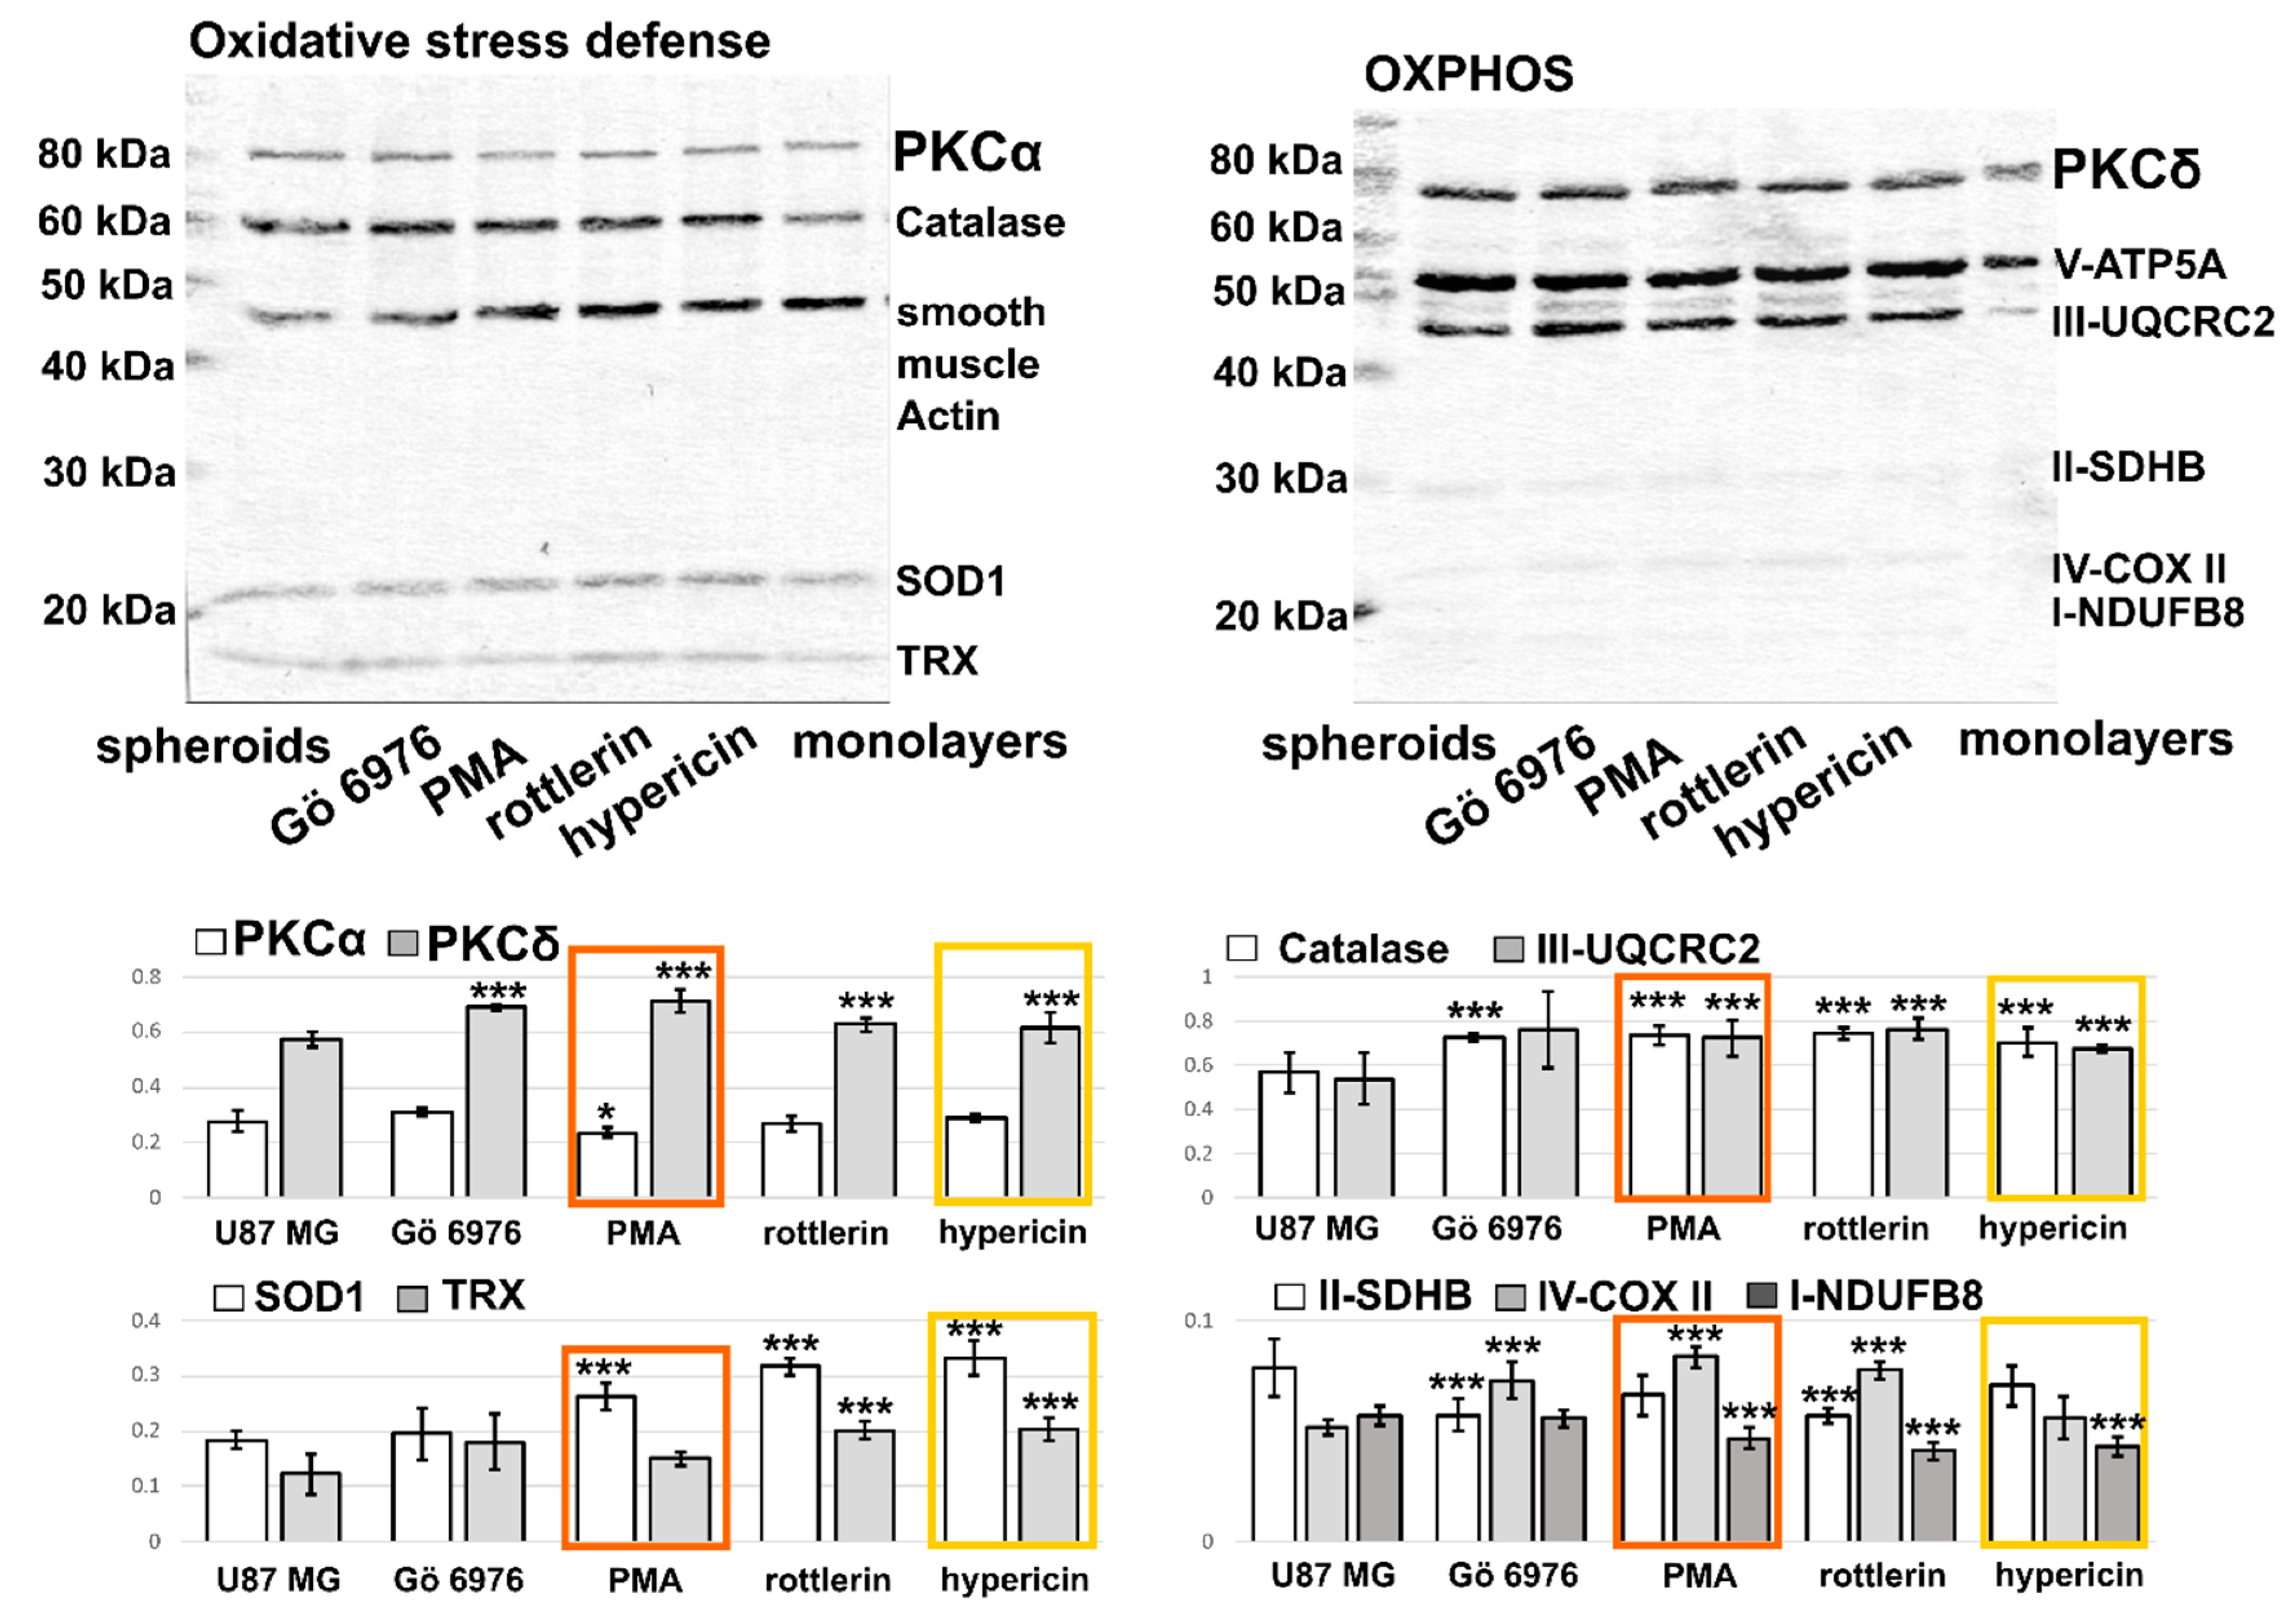
3.2. Validation of Selected Molecule in Monolayers and Spheroids of U87 MG Cells by Western Blot

PKCα, PKCδ, OXPHOS, and oxidative stress defense levels were determined in U87 MG cells exposed to Gö 6976, PMA, rottlerin, and hypericin in the presence (10% FBS) and absence (2% UG) of lipids (Figure 5). A representative image of the Western blot membrane is shown in Figure 5. We can see the difference in PKCα and PKCδ levels in the lipid-free condition. In the absence of lipids, lower levels of both PKC isomers were detected. The most reduced PKC levels were detected after PMA treatment. While PKCδ levels were not affected after PMA treatment, PKCα levels were significantly higher in the absence of lipids (orange columns in Figure 5). In contrast, the other PKC regulators examined did not affect PKCα levels, but PKCδ levels increased significantly in the presence of lipids and decreased in the absence of lipids, most significantly in hypericin-treated cells (yellow columns in Figure 5). The differences we observed could be explained by the known lipid activation of PKC [18]. While PMA is known to be a PKC activator [36], total PKCα and PKCδ levels decreased due to relocalization to the plasma membrane where they play a role in phosphorylation of other proteins [17]. The level of the PKCδ isoform is quite high in the presence of PKC inhibitors. We have previously shown that PKCδ accumulates prematurely in the Golgi apparatus under inhibition [37]. In the presence of the inhibitors, swelling of the Golgi apparatus was observed [6], which may lead to an increase in accumulated PKC.
Application of the studied molecules increases oxidative stress in cells [6,12,13,38]. Mitochondria, the target organelles in apoptosis and oxidative stress, were also studied. While complex V of the respiratory chain is not affected by the presence of lipids and PKC regulators in U87 MG cells, complexes III and II are moderately affected by PMA, rottlerin, and hypericin. The molecules increased the level of complex II in the presence of lipids, but a decrease in complex II was observed in the absence of lipids. The level of complex II was mainly affected by PMA, which partially decreased its level in the absence of lipids. Complex II, a succinate dehydrogenase (SDHB), was recently identified as a sensor of apoptosis [39]. One of the hypotheses is that inhibition of complex II forms the sublethal level of superoxide. Several sites have been identified in complexes I, II, and III that generate superoxide and hydrogen peroxide [40].
The major antioxidant enzymes responsible for neutralizing superoxides and peroxides are catalase and superoxide dismutase [41]. The catalase level was most affected by hypericin, and its reduction was observed in the presence of lipids (Figure 5). An increase in the catalase level was caused by PMA in the presence of lipids, and in the absence of lipids, Gö 6976 and rottlerin also increased catalase. The SOD1 level was affected by PMA in the presence of lipids, but in the absence of lipids, the reduction was observed in the presence of rottlerin and hypericin. We see that the activity of hypericin on the respiratory chain is strongly dependent on lipids.
As shown by Lp distance analysis, not only cell metabolism but also respiration is significantly affected by hypericin taken up by monolayers of U87 MG cells. It is well known that tumors can be considered, spatially, as very heterogeneous structures, where heterogeneity concerns both respiration and the presence of lipids [30,42]. To ensure that hypericin can be considered a unique anticancer molecule, Western blot analysis was performed on the spheroids of U87 MG.
Figure 6 shows a representative image of the Western blot membrane of the protein extracted from the lysates of the spheroids. The effect of the PKC regulators in the spheroids on the PKC isoforms was similar to that observed in the cell monolayers in the absence of lipids. While the levels of catalase and complex III were partially and uniformly affected by the molecules studied, SOD1 and TRX increased significantly in the presence of rottlerin and hypericin. An increase in complex IV was observed in the presence of Gö 6976, PMA, and rottlerin. A reduction in complex II was observed after treatment with Gö 6976 and rottlerin. A significant reduction in complex I was observed in cells treated with PMA, rottlerin, and hypericin. Hypoxia-inducible factor 1-α has been reported to be activated during hypoxia [43]. Consequently, HIF1α reduces the activity of complex IV and downregulates the expression of SDHB [44], which may lead to superoxide production. We suggest that the core of 3D spheroids may be partially hypoxic. For this reason, superoxide production and changes in SOD1 are expected in spheroids. On the other hand, both superoxide and a higher amount of hydrogen peroxide were observed in the monolayer of glioma cells.

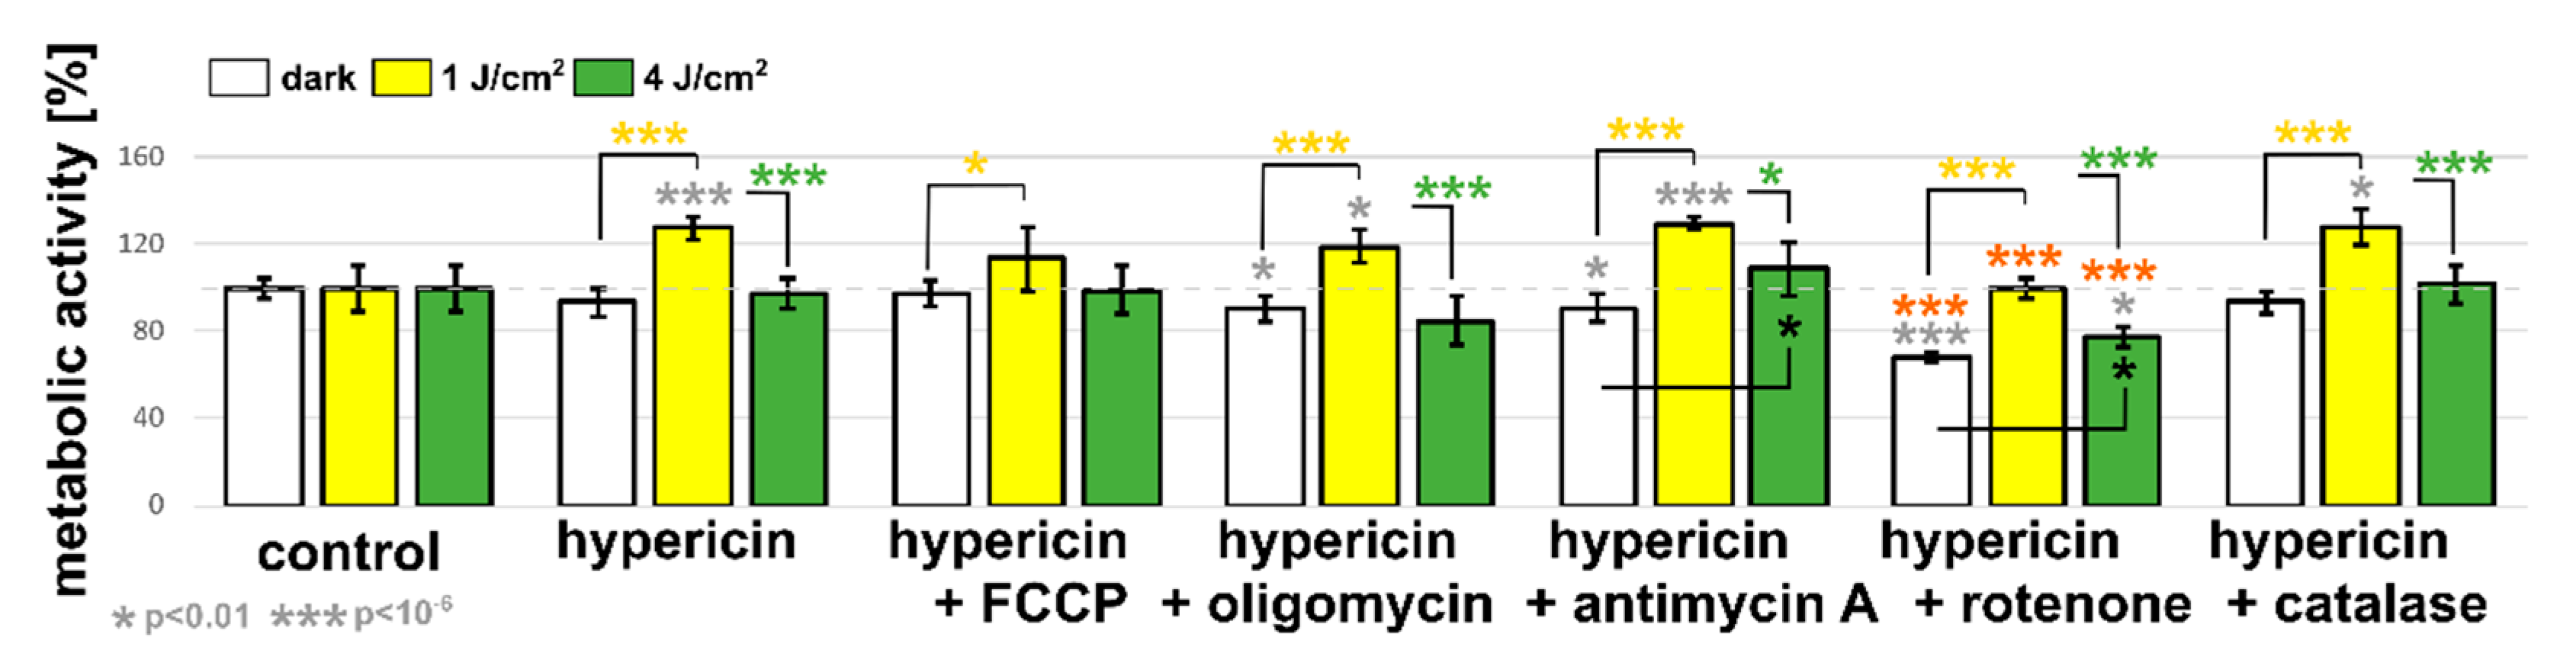
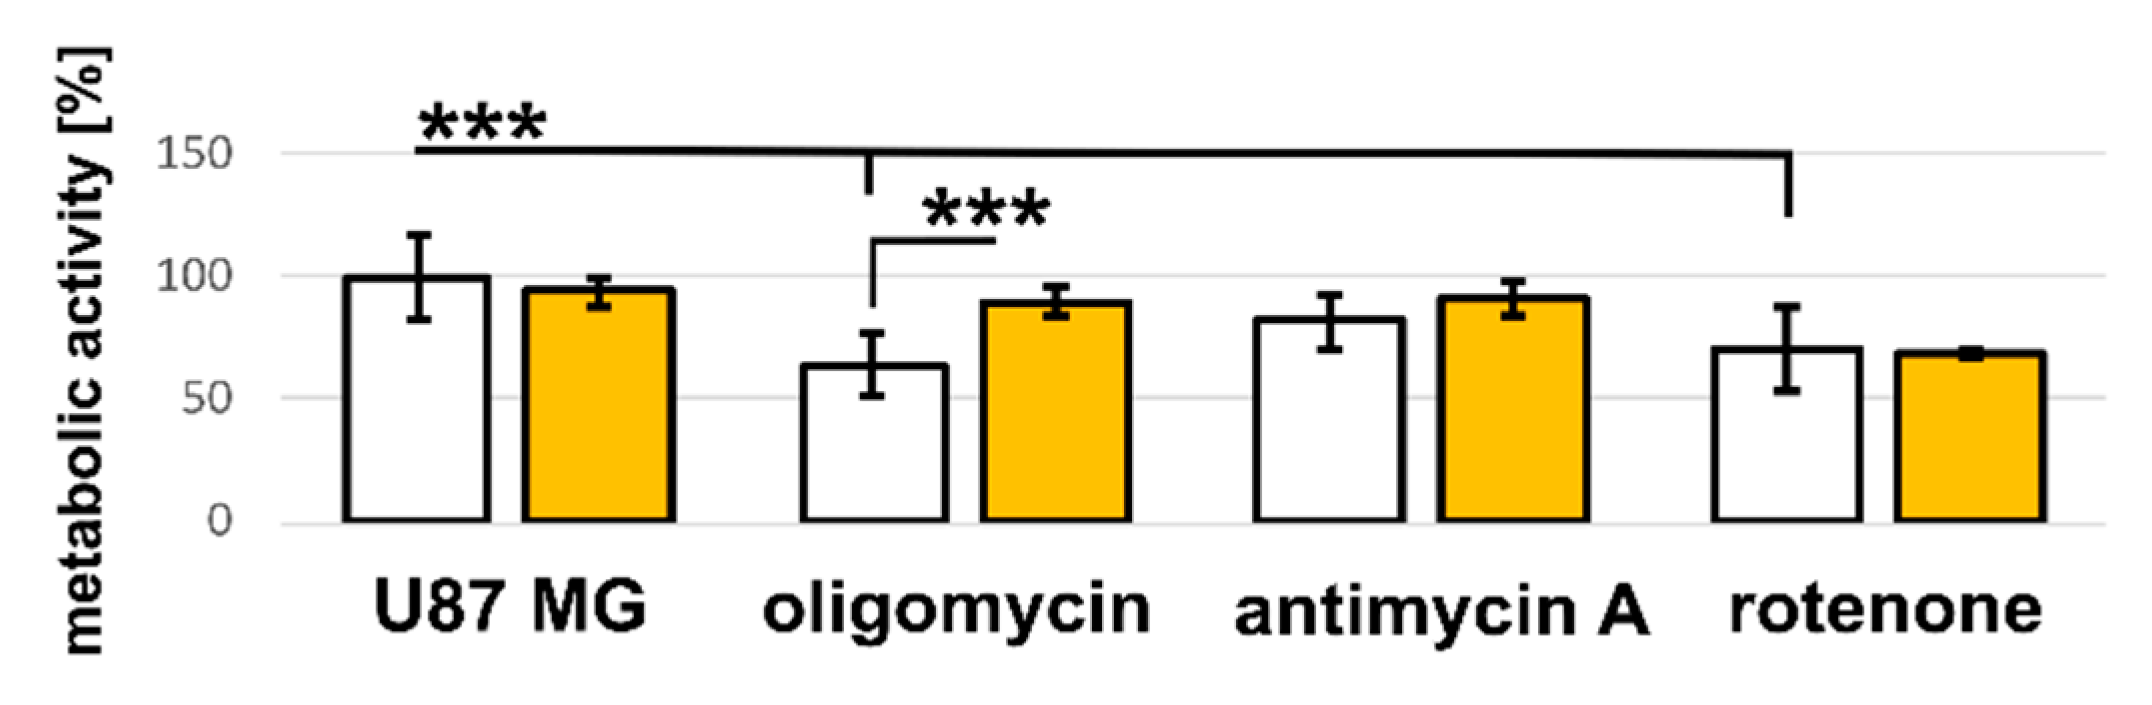
3.3. U87 MG Cells’ Response to Hypericin Treatment of the Monolayers

Considering the literature and our previous studies (see Ref. in Section 2.5.), we determined pro-apoptotic (0) and prosurvival (2) stimuli induced by the investigated compounds in cancer cells in the presence and absence of lipids (Figure 1). PMA elicited pro-apoptotic stimuli in both the presence and absence of lipids. Conversely, rottlerin induced prosurvival stimuli. Indeed, quantification, especially for Gö 6976 and hypericin, was not straightforward. For this reason, we determined the probabilities of pro-apoptotic and prosurvival stimuli in U87 MG cells. Table 3 shows the probabilities of pro-apoptotic and prosurvival stimuli induced by Gö 6976, PMA, rottlerin, and hypericin in the absence (2% UG) and presence (10% FBS) of lipids. As it can be seen, PMA was calculated to have a probability of inducing apoptosis greater than 57%. Conversely, a probability of more than 57% was demonstrated for rottlerin to induce prosurvival stimuli. In both cases, a probability of more than 70% was obtained in the absence of lipids. The probabilities calculated for Gö 6976 to induce apoptosis and cell survival were 28% in the absence and presence of lipids. Interestingly, the probability for hypericin to induce apoptosis was 28% in the absence and presence of lipids. However, the probability of hypericin inducing prosurvival stimuli was 42% in the presence and 57% in the absence of lipids.
Hypericin has previously been shown to selectively switch cell metabolism in response to light conditions [45]. Lipids and lipidic compartments in cells represent important targets of hydrophobic and lipophilic agents in cancer treatments; therefore, the Golgi apparatus can be identified as a potential target of these molecules. In our previous study, we showed that the cisternae of the Golgi complex are dynamically swollen or disrupted [6,12]. While rottlerin destabilized the Golgi complex and broke down lysosomes, PMA, in contrast, increased the number of lysosomes and caused the Golgi cisternae to coalesce. However, in the present study, we demonstrate the significant effect of hypericin on respiratory chain complexes and oxidative stress defense in U87 MG cell monolayers and spheroids (Figure 6). To identify the respiratory chain complex most affected by hypericin, we treated U87 MG cells with specific inhibitors of each complex.
Figure 7 shows the metabolic activity of cells in the presence of hypericin and its combination with FCCP (mitochondrial uncoupler), oligomycin (inhibitor of ATP synthase), antimycin A (complex III inhibitor), and rotenone (complex I inhibitor). To reduce the oxidative stress induced by hypericin, catalase was applied. Hypericin application did not alter the metabolic activity of U87 MG cells. A similar effect was observed for hypericin in the presence of FCCP and catalase. A slight decrease was observed when combined with oligomycin and antimycin A. The most significant decrease in metabolism was induced in cells with hypericin and rotenone application.
We have previously shown that activation of hypericin with orange light induces cell death and switches cell signaling from prosurvival to pro-apoptosis [20,21]. In the present study, irradiation of cells with a lower dose of light (1 J/cm2) increased the metabolic activity of the cells. In contrast, the higher dose (4 J/cm2) maintained the metabolic activity of the cells at a similar level to the untreated control. A significant increase in the metabolic activity of the cells (compared to the control value) after cell irradiation with 1 J/cm2 was also observed for the combinations of hypericin with other inhibitors, except rotenone. It should be noted, however, that metabolic activity increased in all groups studied after this irradiation compared with treatment without light. The higher dose did not elicit such a strong effect. Only in the presence of antimycin A and rotenone were the metabolic activities stimulated compared to the values in the dark.
The principle of the MTT assay is the reduction of yellow tetrazolium salt to purple formazan. It has been reported that most of the cellular MTT reduction occurs outside the mitochondrial inner membrane and involves NADH- and NADPH-dependent mechanisms [46]. Our results suggest that this process can be stimulated with hypericin and light at low doses. This may be partially effective even when complex I is blocked by rotenone (see Figure 8). Hypericin in the dark state can reduce the blocking effect of oligomycin at complex V of the respiratory chain, and after light activation, hypericin affects the inhibitory effect of antimycin A at complex III and rotenone at complex I. In summary, the information obtained leads to the hypothesis that hypericin is an important regulator of mitochondrial respiration that may play an antagonistic role to known inhibitors of the respiratory chain.

4. Conclusions

In the present study, we demonstrated the influence of computationally identified PKC regulators on PKC signaling and respiratory chain function in monolayers and spheroids of glioma cells and during lipid deprivation. The aim of this work was to provide a useful definition of abstract parametric distances, particularly in the areas of cell signal transduction and activation that have not previously been studied in this way. The calculations showing relatively large distances between stimuli triggered by Gö 6976 and PMA or rottlerin imply substantial differences in the respective molecular functions. Moreover, the introduction of a model in which the distances depend on the presence of lipids was a challenge and an innovation in our research with remarkable results. The most significant variation in relation to the presence of lipids caused the main functional contrast between rottlerin and hypericin. Although distance-based analysis in the present study led to the identification of Gö 6976 and hypericin as a potential pair of unique molecules, we focused our experimental selection on hypericin as a molecule effective in photodynamic therapy. Using the Western blot method, we showed that the activity of hypericin on the respiratory chain is strongly dependent on lipids. In fact, hypericin can be considered as an important regulator of mitochondrial respiration, which may play an antagonistic role to known inhibitors of the respiratory chain. However, to understand the mechanisms of this activity, a more complete analysis in different environments with variations in the lipid content is required.

Supplementary Materials

The following are available online at https://0-www-mdpi-com.brum.beds.ac.uk/article/10.3390/biophysica1020017/s1, Figure S1: The homotopy parameter has an impact on the mean relative distance error, Figure S2: The mean relative distance error varies depending on the interval determination parameter.

Author Contributions

Conceptualization, D.H. and V.H.; methodology, D.H.; software, D.H.; validation, V.H., S.T., and D.H.; formal analysis, D.H.; investigation, V.H. and S.T.; data curation, D.H.; writing—original draft preparation, D.H. and V.H.; visualization, D.H. and V.H. All authors have read and agreed to the published version of the manuscript.

Funding

This research was funded by the Ministry of Education, Science, Research, and Sport of the Slovak Republic, grant number VEGA 1/0421/18. This publication is the result of the project implementation: Open scientific community for modern interdisciplinary research in medicine (Acronym: OPENMED), ITMS2014+: 313011V455, supported by the Operational Programme Integrated Infrastructure, funded by the ERDF.

Institutional Review Board Statement

Not applicable.

Informed Consent Statement

Not applicable.

Data Availability Statement

The data presented in this study are available in article and supplementary material.

Conflicts of Interest

The authors declare no conflict of interest.

References

  1. Yau, S.-T.; Nadis, S. The Shape of Inner Space; Basic Books: New York, NY, USA, 2010; ISBN 978-0-465-02023-2. [Google Scholar]
  2. Roweis, S.T.; Saul, L.K. Nonlinear dimensionality reduction by locally linear embedding. Science 2000, 290, 2323–2326. [Google Scholar] [CrossRef] [Green Version]
  3. Nies, H.W.; Zakaria, Z.; Mohamad, M.S.; Chan, W.H.; Zaki, N.; Sinnott, R.O.; Napis, S.; Chamoso, P.; Omatu, S.; Corchado, J.M. A review of computational methods for clustering genes with similar biological functions. Processes 2019, 7, 550. [Google Scholar] [CrossRef] [Green Version]
  4. Yoshioka, P.M. Misidentification of the Bray-Curtis similarity index. Mar. Ecol. Prog. Ser. 2008, 368. [Google Scholar] [CrossRef] [Green Version]
  5. Jukes, T.H.; Cantor, C.R. Evolution of protein molecules BT—Mammalian protein metabolism. In Mammalian Protein Metabolism; Academic Press: New York, NY, USA, 1969; Volume III. [Google Scholar]
  6. Lenkavska, L.; Tomkova, S.; Horvath, D.; Huntosova, V. Searching for combination therapy by clustering methods: Stimulation of PKC in Golgi apparatus combined with hypericin induced PDT. Photodiagnosis Photodyn. Ther. 2020, 31. [Google Scholar] [CrossRef] [PubMed]
  7. Huntosova, V.; Horvath, D.; Seliga, R.; Wagnieres, G. Influence of Oxidative Stress on Time-Resolved Oxygen Detection by [Ru(Phen)3]2+ In Vivo and In Vitro. Molecules 2021, 26, 485. [Google Scholar] [CrossRef]
  8. Amos, S.; Mut, M.; DiPierro, C.G.; Carpenter, J.E.; Xiao, A.; Kohutek, Z.A.; Redpath, G.T.; Zhao, Y.; Wang, J.; Shaffrey, M.E.; et al. Protein kinase C-α-mediated regulation of low-density lipoprotein receptor-related protein and urokinase increases astrocytoma invasion. Cancer Res. 2007, 67. [Google Scholar] [CrossRef] [PubMed] [Green Version]
  9. Bornancin, F.; Parker, P.J. Phosphorylation of threonine 638 critically controls the dephosphorylation and inactivation of protein kinase Cα. Curr. Biol. 1996, 6. [Google Scholar] [CrossRef] [Green Version]
  10. Luo, B.; Prescott, S.M.; Topham, M.K. Protein kinase Cα phosphorylates and negatively regulates diacylglycerol kinase ζ. J. Biol. Chem. 2003, 278. [Google Scholar] [CrossRef] [Green Version]
  11. Reyland, M.E. Protein kinase Cδ and apoptosis. Biochem. Soc. Trans. 2007, 35, 1001–1004. [Google Scholar] [CrossRef]
  12. Larroque-Cardoso, P.; Swiader, A.; Ingueneau, C.; Nègre-Salvayre, A.; Elbaz, M.; Reyland, M.E.; Salvayre, R.; Vindis, C. Role of protein kinase C δ in ER stress and apoptosis induced by oxidized LDL in human vascular smooth muscle cells. Cell Death Dis. 2013, 4. [Google Scholar] [CrossRef] [Green Version]
  13. Basu, A.; Pal, D. Two faces of protein kinase Cδ: The contrasting roles of PKCδ in cell survival and cell death. Sci. World J. 2010, 10, 673080. [Google Scholar] [CrossRef]
  14. Le, T.L.; Joseph, S.R.; Yap, A.S.; Stow, J.L. Protein kinase C regulates endocytosis and recycling of E-cadherin. Am. J. Physiol. Cell Physiol. 2002, 283. [Google Scholar] [CrossRef] [PubMed] [Green Version]
  15. Johnson, K.R.; Becker, K.P.; Facchinetti, M.M.; Hannun, Y.A.; Obeid, L.M. PKC-dependent Activation of Sphingosine Kinase 1 and Translocation to the Plasma Membrane. J. Biol. Chem. 2002, 277. [Google Scholar] [CrossRef] [Green Version]
  16. Conway, A.M.; Pyne, N.J.; Pyne, S. Ceramide-dependent regulation of p42/p44 mitogen-activated protein kinase and c-Jun N-terminal-directed protein kinase in cultured airway smooth muscle cells. Cell. Signal. 2000, 12. [Google Scholar] [CrossRef]
  17. Newton, A.C. Protein kinase C: Poised to signal. Am. J. Physiol. Endocrinol. Metab. 2010, 298. [Google Scholar] [CrossRef] [Green Version]
  18. Newton, A.C. Lipid activation of protein kinases. J. Lipid. Res. 2009, 50, S266–S271. [Google Scholar] [CrossRef] [PubMed] [Green Version]
  19. Steinberg, S.F. Structural basis of protein kinase C isoform function. Physiol. Rev. 2008, 88, 1341–1378. [Google Scholar] [CrossRef] [PubMed] [Green Version]
  20. Misuth, M.; Joniova, J.; Horvath, D.; Dzurova, L.; Nichtova, Z.; Novotova, M.; Miskovsky, P.; Stroffekova, K.; Huntosova, V. The flashlights on a distinct role of protein kinase C δ: Phosphorylation of regulatory and catalytic domain upon oxidative stress in glioma cells. Cell. Signal. 2017, 34. [Google Scholar] [CrossRef] [PubMed]
  21. Dzurová, L.; Petrovajova, D.; Nadova, Z.; Huntosova, V.; Miskovsky, P.; Stroffekova, K. The role of anti-apoptotic protein kinase Cα in response to hypericin photodynamic therapy in U-87 MG cells. Photodiagnosis Photodyn. Ther. 2014, 11. [Google Scholar] [CrossRef] [PubMed]
  22. Huntosova, V.; Stroffekova, K. Hypericin in the dark: Foe or ally in photodynamic therapy? Cancers 2016, 8, 93. [Google Scholar] [CrossRef] [Green Version]
  23. Nakashima, S. Protein Kinase C{alpha} (PKC{alpha}): Regulation and Biological Function. J. Biochem. 2002, 132, 669–675. [Google Scholar] [CrossRef] [PubMed]
  24. Bornancin, F.; Parker, P.J. Phosphorylation of protein kinase C-α on serine 657 controls the accumulation of active enzyme and contributes to its phosphatase-resistant state. J. Biol. Chem. 1997, 272. [Google Scholar] [CrossRef] [Green Version]
  25. Rezk, C. A model for the homotopy theory of homotopy theory. Trans. Am. Math. Soc. 2000, 353. [Google Scholar] [CrossRef] [Green Version]
  26. Bergner, J.E. Three models for the homotopy theory of homotopy theories. Topology 2007, 46. [Google Scholar] [CrossRef] [Green Version]
  27. Awodey, S. Natural models of homotopy type theory. Math. Struct. Comput. Sci. 2018, 28. [Google Scholar] [CrossRef] [Green Version]
  28. Shen, H.C.; Bie, C.Y.C.; Chiu, D.K.Y. A texture-based distance measure for classification. Pattern Recognit. 1993, 26. [Google Scholar] [CrossRef]
  29. Horvath, D.; Ulicny, J.; Brutovsky, B. Self-organised manifold learning and heuristic charting via adaptive metrics. Conn. Sci. 2016, 28. [Google Scholar] [CrossRef]
  30. Angerer, T.B.; Magnusson, Y.; Landberg, G.; Fletcher, J.S. Lipid heterogeneity resulting from fatty acid processing in the human breast cancer microenvironment identified by GCIB-ToFSIMS imaging. Anal. Chem. 2016, 88. [Google Scholar] [CrossRef] [PubMed]
  31. Long, J.; Zhang, C.-J.; Zhu, N.; Du, K.; Yin, Y.-F.; Tan, X.; Liao, D.-F.; Qin, L. Lipid metabolism and carcinogenesis, cancer development. Am. J. Cancer Res. 2018, 8, 778. [Google Scholar]
  32. Deisboeck, T.S.; Wang, Z.; MacKlin, P.; Cristini, V. Multiscale cancer modeling. Annu. Rev. Biomed. Eng. 2011, 13. [Google Scholar] [CrossRef] [Green Version]
  33. Wang, Z.; Bordas, V.; Deisboeck, T.S. Discovering molecular targets in cancer with multiscale modeling. Drug Dev. Res. 2011, 72. [Google Scholar] [CrossRef] [PubMed] [Green Version]
  34. Horvath, D.; Brutovsky, B. Toward understanding of the role of reversibility of phenotypic switching in the evolution of resistance to therapy. Phys. Lett. A 2018, 382, 1586–1600. [Google Scholar] [CrossRef] [Green Version]
  35. Huntosova, V.; Wagnieres, G. CHAPTER 15: pO2 Measurements in Biological Tissues by Luminescence Lifetime Spectroscopy: Strategies to Exploit or Minimize Phototoxic Effects in Tumors. In Quenched-Phosphorescence Detection of Molecular Oxygen; Royal Society of Chemistry: London, UK, 2018. [Google Scholar]
  36. Boneh, A.; Mandla, S.; Tenenhouse, H.S. Phorbol myristate acetate activates protein kinase C, stimulates the phosphorylation of endogenous proteins and inhibits phosphate transport in mouse renal tubules. Biochim. Biophys. Acta Mol. Cell Res. 1989, 1012. [Google Scholar] [CrossRef]
  37. Misuth, M.; Joniova, J.; Belej, D.; Hrivnak, S.; Horvath, D.; Huntosova, V. Estimation of PKCδ autophosphorylation in U87 MG glioma cells: Combination of experimental, conceptual and numerical approaches. J. Biophotonics 2017, 10. [Google Scholar] [CrossRef] [PubMed]
  38. Tomkova, S.; Misuth, M.; Lenkavska, L.; Miskovsky, P.; Huntosova, V. In vitro identification of mitochondrial oxidative stress production by time-resolved fluorescence imaging of glioma cells. Biochim. Biophys. Acta Mol. Cell Res. 2018, 1865. [Google Scholar] [CrossRef]
  39. Grimm, S. Respiratory chain complex II as general sensor for apoptosis. Biochim. Biophys. Acta Bioenerg. 2013, 1827, 565–572. [Google Scholar] [CrossRef] [PubMed] [Green Version]
  40. Zhao, R.Z.; Jiang, S.; Zhang, L.; Yu, Z. Bin Mitochondrial electron transport chain, ROS generation and uncoupling (Review). Int. J. Mol. Med. 2019, 44, 3–15. [Google Scholar]
  41. Ighodaro, O.M.; Akinloye, O.A. First line defence antioxidants-superoxide dismutase (SOD), catalase (CAT) and glutathione peroxidase (GPX): Their fundamental role in the entire antioxidant defence grid. Alex. J. Med. 2018, 54. [Google Scholar] [CrossRef] [Green Version]
  42. Ferrall-Fairbanks, M.C.; Ball, M.; Padron, E.; Altrock, P.M. Leveraging Single-Cell RNA Sequencing Experiments to Model Intratumor Heterogeneity. JCO Clin. Cancer Inform. 2019. [Google Scholar] [CrossRef]
  43. Papandreou, I.; Cairns, R.A.; Fontana, L.; Lim, A.L.; Denko, N.C. HIF-1 mediates adaptation to hypoxia by actively downregulating mitochondrial oxygen consumption. Cell Metab. 2006, 3. [Google Scholar] [CrossRef] [PubMed] [Green Version]
  44. Semenza, G.L.; Jiang, B.H.; Leung, S.W.; Passantino, R.; Concordat, J.P.; Maire, P.; Giallongo, A. Hypoxia response elements in the aldolase A, enolase 1, and lactate dehydrogenase a gene promoters contain essential binding sites for hypoxia-inducible factor 1. J. Biol. Chem. 1996, 271. [Google Scholar] [CrossRef] [PubMed] [Green Version]
  45. Huntosova, V.; Novotova, M.; Nichtova, Z.; Balogova, L.; Maslanakova, M.; Petrovajova, D.; Stroffekova, K. Assessing light-independent effects of hypericin on cell viability, ultrastructure and metabolism in human glioma and endothelial cells. Toxicol. Vitr. 2017, 40. [Google Scholar] [CrossRef] [PubMed]
  46. Berridge, M.V.; Tan, A.S. Characterization of the Cellular Reduction of 3-(4,5-dimethylthiazol-2-yl)-2,5-diphenyltetrazolium bromide (MTT): Subcellular Localization, Substrate Dependence, and Involvement of Mitochondrial Electron Transport in MTT Reduction. Arch. Biochem. Biophys. 1993, 303. [Google Scholar] [CrossRef] [PubMed]
Figure 1. Chemical structures of Gö 6976, PMA, rottlerin, and hypericin (top row). Spider diagram showing the parameters obtained by the evaluation procedure from the parameters in Table 2 in the presence (blue) and absence of lipids (yellow); the overlap is green. LDLr—increase in LDL receptors, pPKCα(S657/Y658)—phosphorylation of PKCα catalytic domain, PKCα—increase in PKCα, SGPP1—increase in sphingosine-1-phosphatase, pPKCδ(Y311)—phosphorylation of PKCδ regulatory domain, pPKCδ(S645)—phosphorylation of PKCδ catalytic domain, and PKCδ—increase in PKCδ.
Biophysica 01 00017 g001
Figure 2. Distances between pairs of measured data patterns. The p parameter is a free parameter used to intentionally modify the distance definition.
Biophysica 01 00017 g002
Figure 3. Distances between pairs of measured data patterns. The parameter p is a free parameter that can be used to deliberately change the distance definition. The values p = 1 and p = 2 are considered as exceptions. ρF is the homotopy parameter that controls the normalized lipid content.
Biophysica 01 00017 g003
Figure 4. Representative brightfield (top left) and hypericin fluorescence (top right) images of BT 474 cancer cell spheroid. The spheroid was acquired in Z-stack (bottom left) and reconstructed in 3D (bottom right). The depth of hypericin fluorescence in the spheroid is color coded.
Biophysica 01 00017 g004
Figure 5. Western blot analysis of OXPHOS (V-ATP5A, III-UQCRC2, II-SDHB, IV-COX II, I-NDUFB8), oxidative stress defense (catalase, smooth muscle actin, SOD1, TRX), PKCα, and PKCδ levels in U87 MG monolayers grown in 10% FBS and 2% UG. The cells were exposed to 0.5 µM Gö 6976, 0.5 µM PMA (orange columns in histograms), 10 µM rottlerin, and 0.5 µM hypericin (yellow columns in histograms). The V-ATP5A complex can be considered here as a loading control. Only proteins with significant changes are plotted in histograms. Optical densities normalized with V-ATP5A are plotted in histograms. * p < 0.05 and *** p < 0.001.
Biophysica 01 00017 g005
Figure 6. Western blot analysis of OXPHOS (V-ATP5A, III-UQCRC2, II-SDHB, IV-COX II, I-NDUFB8), oxidative stress defense (catalase, smooth muscle actin, SOD1, TRX), PKCα, and PKCδ levels in U87 MG spheroids grown in 10% FBS. The cells were treated with 0.5 µM Gö 6976, 0.5 µM PMA, 10 µM rottlerin, and 0.5 µM hypericin. The V-ATP5A complex can be considered as a loading control. The optical densities normalized with V-ATP5A are plotted in histograms. * p < 0.05 and *** p < 0.001.
Biophysica 01 00017 g006
Figure 7. Metabolic activity of U87 MG cells exposed to hypericin and respiratory chain regulators: FCCP, oligomycin, antimycin A, rotenone, and catalase. Cells were treated with the studied molecules in the dark and after irradiation with orange light at 1 and 4 J/cm2. The error bars represent the standard deviation from the mean values. The degree of significant difference from the untreated control (gray asterisks), from the hypericin-treated cells (orange asterisks), between samples in the dark and after irradiation of 1 J/cm2 (yellow asterisks) and 4 J/cm2 (black asterisks), and between both irradiation groups (green asterisks) was evaluated using one-way ANOVA test: * p < 0.01 and *** p < 10−6.
Biophysica 01 00017 g007
Figure 8. Metabolic activity of U87 MG cells exposed to hypericin and respiratory chain regulators: oligomycin, antimycin A, and rotenone. Histogram bars represent cells treated with each regulator (white) and in combination with hypericin (yellow). The error bars represent the standard deviation from the mean values. The level of significant difference was evaluated using one-way ANOVA test *** p < 10−6.
Biophysica 01 00017 g008
Table 1. Categorical values of parameters 1–11 (features, characteristics) related to metabolism, endocytosis, and respiration (see Section 2.5) of the cells. 1—base level (control cells), 0—stabilization (related to cell survival), 2—disintegration of the system. This table was compiled from the results of previously reported studies (see Ref. in Section 2.5).
MoleculeMetabolismEndocytosisRespiration
(1)(2)(3)(4)(5)(6)(7)(8)(9)(10)(11)
-1, 1, 1, 11, 1, 1,1, 1, 1, 1
Gö69760, 2, 2, 11, 1, 11, 1, 1, 1
PMA0, 2, 2, 10, 0, 21, 1, 2, 2
rottlerin2, 0, 0, 12, 2, 22, 2, 2, 2
hypericin1, 0, 0, 01, 0, 00, 1, 1, 1
Table 2. Categorical values of features 1–7 related to the regulation of cell death (see Section 2.5) estimated at different levels of lipids in the cultivation media: lipid enrichment (10% FBS) and lipid deficiency (2% UG). 1—base level (control cells), 0—pro-apoptotic, 2—prosurvival stimuli. This table was compiled from the results of previously reported studies (see Ref. Section 2.5).
Moleculein 10% FBSin 2% UG
(1)(2)(3)(4)(5)(6)(7)(1)(2)(3)(4)(5)(6)(7)
-1, 1, 1, 1, 1, 1, 11, 1, 1, 1, 1, 1, 1
Gö69761, 1, 2, 1, 0, 2, 11, 1, 2, 0, 0, 2, 1
PMA1, 0, 1, 0, 0, 0, 10, 0, 1, 0, 0, 1, 0
rottlerin2, 1, 2, 1, 2, 0, 22, 1, 2, 0, 2, 2, 1
hypericin2, 0, 2, 1, 2, 0, 02, 0, 2, 2, 2, 0, 1
Table 3. Probability of pro-apoptotic and prosurvival stimuli in U87 MG cells after Gö 6976, PMA, rottlerin, and hypericin application. The probabilities were derived from the categorical parameters based on relative abundances presented in Figure 1.
ParameterPro-ApoptoticProsurvival
10% FBS2% UG10% FBS2% UG
Gö 697628282828
PMA577100
rottlerin14145771
hypericin28284257
Publisher’s Note: MDPI stays neutral with regard to jurisdictional claims in published maps and institutional affiliations.

