Article

Role of the Sulphur Source in the Solvothermal Synthesis of Ag-CdS Photocatalysts: Effects on the Structure and Photoactivity for Hydrogen Production

by
Erika Soto Morillo
,
Noelia Mota Toledo
,
Jose Luisa García Fierro
and
Rufino M. Navarro Yerga
*
Instituto de Catálisis y Petroleoquímica (CSIC), C/Marie Curie 2, 28049 Madrid, Spain
*
Author to whom correspondence should be addressed.
Submission received: 6 November 2020 / Revised: 9 December 2020 / Accepted: 18 December 2020 / Published: 19 December 2020

Abstract

:
The aim of this work is to study the influence of the sulphur source (elemental sulphur, thiourea and L-cysteine) in the solvothermal synthesis of Ag-CdS over its growth, structuration and state of Ag and how these changes influence on its photoactivity. The differences in the generation rate of the S2− from the sulphur sources during the solvothermal synthesis determine the nucleation and growth pathways of CdS affecting to the silver state and its incorporation into the CdS lattice. The hydrogen production on Ag-CdS photocatalysts decreases according the sequence: thiourea > elemental sulphur >> L-cysteine. The changes in the photoactivity of Ag-CdS samples are analysed in terms of the differences in the insertion of Ag+ into the CdS lattice, the formation of composites between CdS and Ag2S and the formation of CdS crystalline domains with strong confinement effect derived from the different sulphur source used in the solvothermal synthesis.

Graphical Abstract

1. Introduction

The use of hydrogen, both as a fuel and as an energy carrier, is one of the most feasible alternatives to decarbonise the energy production system, thus, decreasing the greenhouse gas emissions that accelerate the global warming. The interest about the use of hydrogen as energy carrier is based on its ability to be produced from any renewable source, allowing a high energy density per mass unit to be stored, and thus, it can easily connect its generation from renewable sources to the consumption through distribution networks [1].
Currently the industrial processes for hydrogen production are based on thermochemical processes (steam reforming, partial oxidation or autothermal reforming) using fossil fuels (mainly methane) [2]. However in the near future, the renewable resources must be used for hydrogen production as a way to decouple it from the carbon cycle [3,4,5] Among the renewable ways to produce hydrogen, those that use water and solar light are the most interesting, especially those based on photocatalytic processes. The photocatalytic production of hydrogen has raised great interest over the past decades because of its simplicity and because it uses two of the most abundant renewable resources: water and solar light. This process requires the use of efficient photocatalysts active under solar light, and thus, several semiconductor materials based on oxides, sulphides, nitrides, oxynitrides or phosphides have been studied and developed [6,7]. However, in spite of the intense research in this field, the increase of their efficiency to reach 10% required for practical applications still remains as the main challenge.
The sulphide-based chalcogenides have been widely used as photocatalysts because of its efficiency for the absorption of the visible range of solar spectrum. This fact is derived from the position of the valence band, constituted by S 2p orbitals whose potential is more negative than those of O 1s orbitals in the case of the oxides. It means that sulphides show a lower value of band gap and hence, a better absorption ability in the visible range of solar light. However, the main disadvantage of sulphide-based materials is associated with the potential at which the valence band is located, that facilitates photocorrosion processes because it is more feasible the oxidation of sulphides rather than water. Therefore, the use of sacrificial reagents is required to avoid the sulphide photoetching.
Among the studied sulphides, the CdS is a promising photocatalyst because it presents a narrow band gap (2.4 eV) and its valence and conduction bands are located at adequate potentials to produce the water oxidation-reduction reactions [8,9]. In spite of this, intensive studies have been carried out in the literature to improve the intrinsic activity of bare CdS for its application in hydrogen production [8,10,11]. However the quantum efficiency reported for CdS is still low due to the limited efficiency in the generation and use of the charge carriers [6,12]. There exists several strategies to improve the efficiency of the CdS photocatalysts, such as the definition of the nanostructure and nanomorphology through the control of the variables and methods used in the nanosynthesis [13,14,15], the hybridization with highly conductive materials [16,17,18,19], the band engineering through the formation of solid solutions or doping [20,21,22] and, the use of metals or oxides as co-catalysts [23,24]. Each of these strategies affects the physicochemical properties of CdS that are responsible for the different stages involved in the photocatalytic process: (i) The absorption of solar light and generation of charge carriers, (ii) the separation and transport of charge carriers and, (iv) the kinetics of the charge carriers redox reactions on the surface.
Among the different existing methodologies of nanosynthesis [25,26,27,28], we have studied in detail the solvothermal method because it is a simple one-pot process performed at low temperature that allows the preparation of well-crystallized materials. This methodology allows the control of the physicochemical properties and nanmorphology through the modification of the syntheses parameters described by Demazeau et al. [29]. Solvothermal synthesis is a versatile methodology that has been succesfully applied for the obtention of oxides, nitrides, phosphides and even heterostructures for different photocatalytic applications [30,31,32,33]. In our case, we have applied the solvothermal synthesis to produce CdS photocatalysts with specific size and morphology as well as defined structural and optical properties.
The growth, nanomorphology and crystal structure of the CdS prepared by solvothermal method depend on the time, temperature [34,35,36,37], solvent [38,39] and precursors [40,41,42,43] used in the synthesis. In our previous work, Vaquero et al. [38,39] proposed a systematic study employing different solvents, and it was found that ethylenediamine is an optimal solvent to control the growth, morphology and crystal structure of the CdS. Another important parameter in the control of the nanostructure is the solvothermal temperature of synthesis. Most of the published works found the direct relationship between the crystallinity and photoactivity in the CdS nanostructures [34,35]. However, in recent studies we have demonstrated [29,30] the best photoactivity results for CdS nanostructures obtained at low solvothermal temperatures, associated with the formation of small crystalline CdS structures with quantum confinement effect (QD).
The interstitial or substitutional replacement of Cd2+ atoms with other transition metals (Zn2+, Ag+, Ni2+, …) is a way to produce modifications in the electronic band structure of CdS to improve its ability to absorb visible light [20,21]. We found that CdS modified with Ag prepared by solvothermal method leads to the incorporation of Ag+ in the CdS lattice and/or as Ag2S heterojunctions depending on the conditions used in the solvothermal synthesis [44]. The resulting CdS-Ag photocatalysts showed improved efficiency respect to the bare CdS depending on the relative incorporation/segregation of Ag+/Ag2S into/on the CdS. This improvement is in line with previous works that show the positive effect of silver as dopant and/or co-catalysts in semiconductor materials [45,46,47]. The insertion of Ag+ into the CdS lattice can promote intermediate energy levels near the valence band diminishing the band gap, meanwhile segregated phases of Ag (Ag0 or Ag2S) can improve the spatial separation of the charge carriers, diminishing the recombination processes [48,49].
In the solvothermal synthesis, the sulphur source plays an important role in the definition of the final physicochemical properties of the CdS based photocatalysts because it controls the concentration of S2− in the synthesis medium and, this parameter has strong influence on the kinetics of the CdS crystal growth. The effect of the sulphur source on the nanomorphology of CdS was studied by Dalvand et al. [50] who employed elemental sulphur and thiourea and they found that the delivery rate of S2− ions directly affects to the aspect ratio of the CdS nanobars. Similarly, Li et al. [43] used Na2S as sulphur precursor that led to the formation of spherical structures derived from the high concentration of S2− anions that favour a fast and symmetrical growth of the CdS primary nuclei. Phuruangrat et al. [51] focused their study on the use of organic precursors such as ammonic sulphur, thiocacetamide, thiourea and thiosemicarbazide in the solvothermal synthesis of CdS, observing differences in the nanobars length attributed to the difference in the decomposition rate of the sulphur source. Other sulphur precursor such as L-cysteine has been also studied [52]. In this case, the precursor plays a dual role; it acts both as sulphur source and structure director agent during the growth of CdS, resulting in the generation of different mono- and three-dimensional CdS nanomorphologies.
With this background, in this work we propose the solvothermal synthesis for the preparation of CdS modified with Ag, by using different sulphur source as innovative tool for the control of the crystal growth, incorporation/segregation of Ag and nanomorphology of the samples. The sulphur precursors employed in this study (elemental sulphur, thiourea and L-cysteine) were selected based on their different rate for the S2− ions supply in the solvothermal medium. Depending on the sulphur source, the delivery rate of the S2− ions during the solvothermal synthesis can significantly vary, affecting the nucleation step and crystal growth of the Ag and CdS nanostructures, and therefore, it will change the final physicochemical and photocatalytic properties of the samples based on CdS modified with Ag.

2. Materials and Methods

2.1. Synthesis of Photocatalysts

The effect of the sulphur source over the nanostructuration of Ag-modified CdS photocatalysts (AgCdS) was studied using three different precursors: Elemental sulphur (S), L-cysteine (L) and Thiourea (T). In the solvothermal synthesis, ethylenediamine (EDA) was employed as solvent to prepare the AgCdS-X (X = S, L and T) photocatalyst series. In a typical procedure of synthesis, cadmium chloride (CdCl2) and silver acetate (Ag(CH3COO)) were dissolved in a molar ratio Cd/Ag = 0.05 within 75 mL of EDA under vigorous stirring. The sulphur precursor (in a molar ratio S/Cd = 2) and 25 mL of EDA were finally added to the former. This solution was transferred in a Teflon-lined stainless steel autoclave (filled to the 80% of its capacity) and maintained for 12 h at 120 °C. The yellowish solid obtained was thoroughly washed with distilled water and ethanol several times and separated by centrifugation. The washing methodology was optimized (3 washing steps with distilled water and 3 additional washing steps with ethanol (150 mL each one under strirring during 10 min and solid separation by centrifugation)), in order to eliminate organic and inorganic residues from the surface of the photocatalysts such as chlorides or amino groups coming from EDA or thiourea. Finally, all of the samples were vacuum dried for 2 h at 70 °C. For comparison, a reference series of pure CdS, labelled as CdS-X, was synthesized according to the methodology previously described. Table 1 summarizes the nomenclature of all prepared samples.

2.2. Physicochemical Characterization

The total X-ray fluorescence analysis (TXRF) was performed in a benchtop S2 PicoFox TXRF spectrometer (Bruker Nano GmbH, Berlin, Germany) to analyse the chemical composition of CdS-X and AgCdS-X samples. In order to homogenize the samples and obtain representative results, the samples were dispersed in ultrapure water and sonicated under ultrasound following the protocol described by Fernandez-Ruiz et al. [53]. Finally the samples were deposited over a flat quartz polished carrier. The spectra were acquired applying an acquisition time of 500 s and taking Cd as the internal standard. The standard deviation of the concentration of Cd, S and Ag determined by TXRF were included as SI (Table S1). N2 adsorption/desorption isotherms measured at −196 °C on a Micromeritics TRISTAR 3000 instrument were obtained for the determination of the textural properties of all the samples previously degassed under vacuum at 70 °C for 2 h. BET method was applied for the calculation of the surface area within the relative pressure 0.05 < P/Po < 0.30. Crystal structure of the CdS-X and AgCdS-X samples was studied by X-ray Powder Diffraction (XRD) using an X’Pert Pro PANalytical polycrystal diffractometer, with a X’Celerator RTMS detector and nickel-filtered Cu Kα radiation (=0.15406 nm, 45 kV, 40 mA). The Bragg angle range was established between 20–90° (2θ) with step size 0.03355. The XRD profiles were treated with the X’Pert HighScore Plus software (version 2.2a, PANalytical B.V.,Almelo, The Netherlands) to estimate the peak positions, intensity and area and broadening effects. In the peak broadening analysis, the software differentiated between size and strain effect (deconvoluted taking into account that crystallite size broadening has as Lorentzian shape and that microstrain broadening has a Gaussian shape, Figure S1). The instrumental broadening effect was not analysed because the XRD instrument does not have the calibration standard to determine the instrumental profile. In any case, all samples were measured in the same instrument and for small crystallite size the specimen broadening dominates over instrumental and therefore we consider that the calculated crystalline size could be valid only for comparative purposes among them. Comparative variation of the crystallite size (Dp) of the CdS in the samples was calculated by applying the Scherrer equation to crystalline size broadening component in the direction perpendicular to the (002) planes of CdS. For the determination of the crystal strains, Williamson-Hall plot method (Equation (1)) was applied to determine the ε factor according to the three main reflections of the hexagonal CdS,
c o s θ   =   K λ D p + 4 ε · s i n θ β
where β is the broadening of the diffracted peak, K is a shape factor close to unity, λ is the X-ray wavelength, D is the crystallite size and ε is the slope of the linear fit of the plot.
The surface chemical state and composition of the AgCdS-X samples were investigated using the X-ray photoelectron spectroscopy technique (XPS). The powdered samples were degassed prior to the analysis in the vacuum chamber (working at pressure lower than 5 × 10⁻⁶ Pa). The instrument employed was VG ESCALAB 200R spectrometer equipped with a double anode X-Ray source (Mg-Kα = 1253 eV and Al-Kα = 1486.6 eV) working at 12 kV and 10 mA and with hemispherical analizer with five channeltron-type detectors. The spectra of Cd 3d, S 2p and Ag 3d core-levels were acquired in the energy range 10–20 eV. The atomic percentages of surface atoms were calculated from the area of the XPS peaks and the application of the corresponding sensitivity factors.
A TEM/STEM JEOL 2100F electron microscope was employed to study the nanomorphology of the CdS-X and AgCdS-X samples. The microscope operates at an accelerating voltage near to 200 kV equipped with a Field Emission Gun (FEG) and a point resolution of 0.19 nm.
The absorption profile and the optical band gap of all the photocatalysts were calculated from the UV-Vis spectra, acquired with a UV-Vis-NIR Varian Cary 5000 spectrometer consistent in a double beam and double shutter synchronized electronically. The absorption profile was obtained from the Kubelka-Munk function (F(R) and the band gap size was analytically estimated through the Tauc plot representation ((F(R) × )2 vs. ) by tracing the tangent line parallel to the slope of the plot according to Eph = hc/λ, where Eph is the photonic energy, h is the Planck constant, c the speed of light, and λ the photon wavelength. In addition, the tailing effect was calculated for all the samples according to the Urbach law, described by the Equation (2),
ln ( F ( R ) )   =   A + ( 1 E u )   ×   h v
where: Eu (meV) is the Urbach parameter related with the density of defects near the band edge as a consequence of the modification of the electronic band structure.
For the estimation of the recombination rate between electron and holes, photoluminescence analysis of the CdS-X and AgCdS-X samples was carried out. The measurements were performed in aqueous suspension at room temperature using a Varian Cary Eclipse fluorescence spectrophotometer (Agilent, Santa Clara, CA, USA) applying an excitation wavelength equal to 375 nm.

2.3. Photocatalytic Activity Tests

The experimental installation to measure the photoactivity of the CdS-X and AgCdS-X samples (Figure S2) consists in a Xe arc lamp (150 W, ozone Free, LOT-Oriel GmbH & Co. KG, Darmstadt, Germany), irradiance spectra in Figure S3 (spectroradiometer model ILT550 LOT-Oriel GmbH & Co. KG) and a closed Pyrex glass reactor containing 150 mL of an aqueous sacrificial reagent solution (0.05 M Na2S and 0.02 M Na2SO3) magnetically stirred to maintain 50 mg of the photocatalyst powder in suspension. The test is carried out under inert gas (Ar) and ambient temperature and pressure for 5 h. The photocatalytic hydrogen production takes place according to the following reaction steps:
C d S   h υ   e ( C B ) +   h +   ( V B )
2 H 2 O 2 e ( C B ) H 2 +   2 O H
S O 3 2 +   H 2 O 2 h + ( V B )   S O 4 2 +   2 H +
2 S 2 2 h + ( V B ) S 2 2
S 2 2 + S O 3 2   S 2 O 3 2 + S 2
S O 3 2 + S 2 2 h + ( V B ) S 2 O 3 2
Samples of the evolved gases were extracted with a gas tight syringe (model Hamilton Gastight® 1005 SL 5 mL SYR 22/2″/2) taking 0.5 mL every hour to quantify the hydrogen produced by gas chromatography (Star 3400 CX chromatograph, Varian, a TCD detector (Varian, Santa Clara, CA, USA) and a 5 Å molecular sieve, example of a typical chromatogram is shown in Figure S4). The gas chromatograph was conveniently calibrated for the measurement of H2 concentrations up to 3 vol%. In the Supplementary Information it is shown that measured chromatographic areas fit well with the calibration H2 curve (Figure S5).

3. Results

3.1. Physicochemical Characterization

3.1.1. Chemical and Textural Analysis

Table 2 summarizes the chemical surface composition of the CdS-X and AgCdS-X photocatalysts analysed by TXRF. All the CdS-X and specially the AgCdS-X samples showed some cadmium defect in its surface composition except for the CdS-L sample that showed a quasi-stoichiometric Cd/S surface ratio. The surface cadmium defects can be attributed to the residual ethylenediamine molecules bound to surface Cd2+ ions [54]. These residual ethylenediamine molecules do not significantly affect the photocatalytic behavior of the CdS based photocatalysts as it was demonstrated in our previous works [37]. With regards to the silver concentration on the AgCdS-X samples, it was also observed important differences in its surface concentration according to the sequence: AgCdS-T > AgCdS-L > AgCdS-S.
The textural properties of the CdS-X and AgCdS-X samples derived from its N2 adsorption/desorption isotherms (BET surface area and average pore size) showed important differences (Table 2) attending to the sulphur source employed in its synthesis. Figure 1 displays the N2 adsorption/desorption isotherms and the pore size distribution obtained for both CdS-X and AgCdS-X series. The adsorption isotherms of the CdS-X and AgCdS-X samples are similar, but it was observed that clear differences within the series existed, depending on the sulphur source employed in the synthesis. The samples prepared with elemental sulphur (CdS-S and AgCdS-S, Figure 1) exhibited a type II isotherm with hysteresis loop H1 (Figure 1a,b) typical of narrow and homogeneous pore size distribution in the range of the macropores (about 56 nm, Figure 1c,d, Table 2). For the samples prepared with L-cysteine (CdS-L and AgCdS-L, Figure 1), the isotherm profile matches well with type IV isotherms (Figure 1a,b) and H1 hysteresis loop in the range of the mesopores (about 13 nm, Figure 1c,d, Table 2). When thiourea is employed as sulphur source (CdS-T and AgCdS-T, Figure 1) the adsorption isotherms are type II, with hysteresis loop H3 (Figure 1a,b), but opposite to the samples prepared with elemental sulphur, the average pore size is in the range of the mesopores (41 nm, Figure 1c,d, Table 2) with a slight contribution in the range of macropores. The surface area in the CdS-X samples (Table 2) changes with the sulphur source employed in the solvothermal synthesis. The use of L-cysteine generates structures with higher surface area (115.7 m2/g) than that generated using thiourea and elemental sulphur (73.7 y 42.8 m2/g, respectively). In contrast, the effect of the sulphur source on the surface area of the AgCdS-X samples is different from that observed in the CdS-X series probably due to the presence of Ag ions that affects the precipitation of CdS in the solvothermal medium. In the AgCdS-X series, the samples prepared with elemental sulphur and L-cysteine showed lower surface area (17.7 y 75.7 m2/g, respectively) respect to the CdS-X counterparts, while the sample prepared with thiourea (AgCdS-T) exhibited higher surface area (82.4 m2/g) than that obtained for the CdS-T counterpart.

3.1.2. Powder X-ray Diffraction (XRD)

The XRD diffraction patterns of the CdS-X and AgCdS-X samples, displayed in Figure 2, show in all cases the main reflections ascribed to the hexagonal phase of CdS (JCPDS:01-077-2306). A small component around 28° was observed on the CdS-S and CdS-T samples that correspond to a small contribution of the (200) planes of the cubic phase of CdS (JCPDS: 89-0440). For the AgCdS-L and AgCdS-T samples it was also found diffraction peaks related with the monoclinic phase of Ag2S (JCPDS: 00-014-0072). All the samples showed a preferential growth of CdS along (002) direction, except for the sample AgCdS-S that exhibited an increase of the crystallinity along (101) direction.
As observed in Figure 3, the main reflections of CdS in the AgCdS-X samples are shifted to lower diffraction angle respect to the CdS-X counterparts. This shift indicated expansion of the CdS lattice that is attributed to the partial substitution of Ag ions into the CdS lattice [55] in agreement with the higher ionic radii of Ag+ (1.05 Å) respect to that of Cd2+ (0.95 Å) that produces the expansion of the CdS lattice. According to the different shift observed in the AgCdS-X samples, the insertion of Ag in the CdS lattice varies according the following sequence: AgCdS-L > AgCdS-S > AgCdS-T (Figure 3). The insertion of Ag ions may modify the internal strains of CdS. The degree of internal strains in CdS was quantified through the ε parameter (summarized in Table 3 and calculated from the slope of the linear fit applied to the Williamsom-Hall plot (Figure S6). For the sample AgCdS-T it was not possible to apply this calculation method because of its nonlinear behavior that may be a consequence of the anisotropic distribution of the strains in this sample promoted by the segregation of Ag2S that could limit the growth of the CdS. For all samples the strain parameter (ε) showed a negative slope related with compressive strains. CdS-X samples showed a higher compressive strain respect to their AgCdS-X counterparts, which may indicate that insertion of Ag ions generates vacancies that can equilibrate the compressive lattice strains of CdS, especially in the samples AgCdS-S and AgCdS-L. This fact is in contrast with the work of Dey et al. [56], who reported the increase of the lattice strains of CdS because of the insertion of Ag+ ions.
Comparative variation of the crystallite size (Dp) of the hexagonal CdS phase in the direction perpendicular to the (002) calculated by applying the Scherrer equation is presented in Table 3. In all cases, the crystalline size of CdS along the (002) plane in the CdS-X samples was lower than in the case of the AgCdS-X counterparts, which suggests that silver promotes the crystal growth of CdS. In addition, the sulphur source also influences on the growth of the CdS nanostructures since it was observed remarkable differences in the size depending on the source employed. Both AgCdS-L and AgCdS-T showed the lower crystal growth and the higher crystal strain in the CdS structures (ε, Table 3) while the sample prepared with elemental sulphur (AgCdS-S) produces larger CdS crystalline structures with reduced strain effects.

3.1.3. Scanning Electron Microscopy (SEM)

The nanomorphology of the CdS-X and AgCdS-X photocatalysts analysed by Scanning Electron Microscopy, showed evident differences in their morphology derived from the sulphur source employed in its preparation (Figure 4).
The nanomorphology of the samples, prepared with elemental sulphur (Figure 4a,b), showed homogeneous rod-like structures that are well-dispersed and crystallized, in line with the XRD results (Figure 2). The high aspect ratio of these structures also justifies the macroporosity observed in its textural analysis (Figure 1, Table 2). For the AgCdS-S it was also observed irregular structures (dotted lines in Figure 4b) at the base of the nanobars. The use of L-cysteine leads to spherical-like structures forming globular aggregates both in CdS-L and AgCdS-L photocatalysts (Figure 4c,d) in line with the results presented by Chowdhury et al. [57]. These results are also in accordance with the large surface area and mesoporosity shown by these samples (Table 2). For the AgCdS-L sample it was observed a slight improvement in its structuration as it was previously detected by XRD (Figure 2). The samples prepared with thiourea (Figure 4e,f) showed irregular morphology and structure development. These samples are mainly composed by filamentous structures (dotted lines in Figure 4e,f) and lamellar aggregates (denoted by arrows in Figure 4e,f). For the AgCdS-T sample, it was found a lower proportion of filamentous structures respect to the CdS-T counterpart, as noted by XRD that may be attributed to the effects of Ag ions during the nucleation and growth steps in the solvothermal synthesis of CdS.

3.1.4. X-ray Photoelectron Spectroscopy (XPS)

The composition and oxidation state of the elements present on the surface of AgCdS-X samples were determined from the XPS analyses. The XPS spectra of the Cd 3d, S 2p and Ag 3d core levels were recorded (Figure 5) and their binding energies are collected in Table 4.
The binding energy of the Cd 3d 5/2 level was located in all samples at 404.6 eV indicative of the existence of Cd2+ species coordinated with S2− in CdS [58]. The AgCdS-S sample shows an additional component located at 403.3 eV associated to Cd2+ cations in oxidized species [59]. In all AgCdS-X samples, the S 2p spectra appears at 161.2 eV indicating the presence of S2− anions as expected in an CdS environment [60]. The Ag 3d5/2 level in AgCdS-S and AgCdS-T samples was located at 367.2 eV revealing the presence of Ag+ species in Ag2S [60]. For the AgCdS-L sample, the Ag 3d5/2 level was shifted to higher binding energy (367.8 eV). This shift is probably due to the size effects of the Ag2S particles and/or the confinement linked to L-cysteine and ligand effect that alters the electronic environment of Ag+ ions in Ag2S.
The surface atomic percentages of Cd, S and Ag in the AgCdS-X photocatalysts were calculated from the areas of the XPS spectra applying the corresponding sensitivity factors and the results are collected in Table 4. In all AgCdS-X samples, it is observed sulphur impoverishment at surface level in line with previous TXRF analyses that points out to the coordination of ethylenediamine with surface Cd ions. This is particularly important in the case of the sample prepared with thiourea (AgCdS-T) in which the impoverishment in sulphur could be also related to the nitrogen from thiourea that can act as a cation sequestering binding to the Cd2+ ions on the surface [54]. In this sense, the XPS surface analysis reveals slight differences in the Cd exposition at surface level, increasing according to the sequence: AgCdS-L < AgCdS-S < AgCdS-T. The surface concentration of Ag in the AgCdS-X photocatalysts shows slight modifications among the samples, showing the sample prepared with thiourea the higher concentration of Ag on the surface.

3.1.5. Electron Transmission Microscopy (TEM)

The TEM and HR-TEM images (Figure 6) corresponding to the CdS-X (a, b and c) and AgCdS-X (d, e and f) photocatalysts show important nanomorphological differences between them.
The samples prepared with elemental sulphur (CdS-S and AgCdS-S, Figure 6a,b) showed well developed structures with high aspect ratio (>4 nm, Table 5). The sample AgCdS-S (Figure 6a) exhibited well-defined nanorods structures anchored to irregular aggregates that seem to be acting as nucleating platforms. Regions I and II depicted in Figure 6b were analysed by Fast Fourier Transformed (FFT) (Figure S7) to obtain the digital diffraction patterns (DDP). FFT in region I (Figure S7b) showed the characteristic (002) interplanar distance (0.334 nm) of the hexagonal phase of CdS. The FFT in region II (Figure S7c) showed a slight increase of the (002) interplanar distance, probably as a consequence of the Ag insertion into the CdS lattice, producing the crystal expansion because of the higher ionic radii of Ag+ atoms respect to that of Cd2+. From these observations it seems that Ag is located in the irregular structures of CdS from which it grows the hexagonal CdS nanorods [61,62].
The use of L-cysteine (Figure 6b,e) produces CdS with less developed nanorod nanomorphology (lower aspect ratio, Table 5) than in the case of the elemental sulphur. The interplanar distances of the CdS nanostructures in the AgCdS-L sample showed the expected values for the (002) plane of the hexagonal phase of CdS (d002 = 0.337nm). Whereas, a slight increase of the interplanar distances of the (001) plane (0.362 nm, Figure 6e) were observed that were compatible with the Ag insertion into the CdS lattice, as it was previously observed by XRD. In addition to this, AgCdS-L also showed regions where Ag exists in the form of segregated Ag2S (d111 = 0.347 nm, inset in Figure 6e).
The nanomorphology of the CdS particles prepared with thiourea was markedly different from the AgCdS-X samples described above (Figure 6c,f). Due to the structural irregularity of the CdS-T and AgCdS-T samples it was not possible to measure the average length and width, however the structure development is comparable to that obtained in the samples prepared with elemental sulphur. For the AgCdS-T sample it was observed three main nanostructures. The first corresponded to CdS in the form of lamellar arrangements (dotted line, Figure 6c) that originates filamentous structures similar to nanobars with interplanar distances close to that expected for the hexagonal CdS (d002 = 0.337 nm). Together with these structures, small crystal domains of CdS were also observed in the AgCdS-T sample. The presence of small nanostructures in the AgCdS-T sample deposited over the lamellar and CdS nanorods (arrows in Figure 6f) were observed and identified as Ag2S nanoparticles from its interplanar distance ((111) = 0.308 nm).

3.1.6. UV-Vis Spectra

Figure 7 collects the UV-Vis spectra, displayed according to the Kubelka-Munk function, of the CdS-X and AgCdS-X photocatalysts.
The CdS samples prepared with L-cysteine and elemental sulphur show similar and well defined absorption edges in accordance with the high crystallinity of the samples detected by XRD (Figure 2). The absorption edge position on CdS-X samples shifts to higher wavelengths according to the sequence: Thiourea (T) > L-cysteine (L) > Elemental sulphur (S). The AgCdS-X photocatalysts also show variations in the absorption edge position, showing the sample prepared with thiourea the absorption edge at lower wavelength. It is worth noting that both samples prepared with thiourea, CdS-T and Ag-CdSX, exhibited an excitonic peak located at 370 nm corresponding to the presence of very small crystalline domains with strong confinement effect (quantum dots). In addition to this, the AgCdS-X samples also showed a second absorption edge at 1250 nm (insertion Figure 7) ascribed to the presence of Ag2S segregated species. The intensity of this shoulder is in accordance with the segregation degree of Ag2S, which as observed by XRD was higher for AgCdS-T than that of the samples AgCdS-L and AgCdS-S.
The band gap of photocatalysts was calculated from the intersection of the tangent line to the slope of the Tauc Plot and collected in Table 6. For the CdS-X photocatalysts, the sample prepared with elemental sulphur (CdS-S) showed lower bang gap energy (2.46 eV) than that of the CdS-L and CdS-T (2.54 eV) counterparts. The same sequence for the band gap energy respect to the sulphur source was observed in the AgCdS-X samples (AgCdS-S < AgCdS-L < AgCdS-T). The differences in the band gap energy can be derived from changes in the crystallinity of CdS and, in the case of AgCdS-X samples, by the insertion of Ag ions into the CdS lattice that can promote the apparition of new electronic states near the valence band of CdS, narrowing the band gap.
There is a direct relationship between crystallinity and optical properties of the CdS-X and AgCdS-X photocatalysts that can be analysed through the Urbach energy parameter (Eu, Table 6). For both photocatalysts series this parameter varies following the sequence: Elemental sulphur < L-cysteine < thiourea, in line with the crystallinity degree derived from the XRD results. The Eu parameter is higher for the AgCdS-X samples respect to that of the CdS-X references due to the disturbance of the electronic states near the valence band of CdS promoted by the presence of Ag+ ions. From the Urbach tails (Figure S8) it can be observed that the AgCdS-S and AgCdS-L photocatalyts exhibited a parallel profile respect to the CdS-X references with a slight tail effect due to the Ag+ insertion into the CdS lattice. In the case of the Urbach tails of the AgCdS-T sample it is interesting to note the prominent shoulder observed in the figure (Figure S8) and ascribed to Ag2S segregation.

3.1.7. Photoluminescence Analysis (PL)

Figure 8 shows the PL spectra of the CdS-X and AgCdS-X photocatalysts measured in aqueous suspension at room temperature applying 375 nm as excitation wavelength.
All the CdS-X and AgCdS-X photocatalysts present a PL emission band between 480–530 nm related with band to band transitions near the band gap of CdS. In general, the AgCdS-X samples (Figure 8b,d,f) exhibited lower PL intensity respect to the CdS-X samples (Figure 8a,c,e), indicating that Ag ions play an active role to avoid the recombination processes. For both CdS-X and AgCdS-X samples it is observed an increase in the PL quenching effect in the following order: thiourea > L-cysteine > elemental sulphur. This order is in accordance with the differences in the crystallinity of the CdS entities previously observed by XRD.
The samples prepared with elemental sulphur (CdS-S and AgCdS-S, Figure 8a,b) exhibited a PL band comprised of the band gap electronic transitions (528 nm) and the surface defects related with both cadmium (554 and 558 nm) and sulphur (594 nm and 660 nm) vacancies [63]. In the AgCdS-S samples, the band ascribed to sulphur vacancies was more intense, due to the insertion of Ag ions into the CdS lattice that promotes the apparition of acceptor levels near the valence band [49].
The PL spectra of samples prepared with L-cysteine (CdS-L and AgCdS-L, Figure 8c,d) show differences in the band to band PL emissions, being higher for the sample AgCdS-L (527 nm) respect to the CdS-L (522 nm), as consequence of the differences in the band gap of both samples. An additional PL emissions below 500 nm was observed in these samples due to residual L-cysteine species adsorbed on the Cd surface atoms [64,65]. In the case of the samples prepared using thiourea (CdS-T and AgCdS-T, Figure 8e,f), the PL band ascribed to the electronic transition between the valence band and the conduction band is shifted to lower wavelength in the AgCdS-T sample respect to the CdS-T counterpart. The red and orange emissions for CdS-T and AgCdS-T respectively, are originated from the same donor level (interstitial cadmium). However, for CdS-T (629 nm) the acceptor level are sulphur vacancies (Vs) meanwhile for AgCdS-T it was observed the intensification of this band (596 nm), related with the presence of silver that acts as impurity level [63,66]. Both samples exhibited several sub-band gap PL emissions (below 500 nm), however in this case are attributed to the presence of QD structures with different crystal size.

3.2. Photocatalytic Tests

Figure 9 depicts the photoproduction of hydrogen (µmol) obtained of the CdS-X and AgCdS-X photocatalysts in aqueous solutions containing Na2S and Na2SO3 as sacrificial reagents. As shown in Figure 9 the activity shows important differences in both series of photocatalysts, CdS-X and AgCdS-X. For the CdS-X series, the most active sample was that prepared with thiourea (CdS-T, 7.99 μmol) followed by that prepared with L-cysteine (CdS-L, 2.7 μmol) and finally, the least active was the one prepared with elemental sulphur (CdS-S, 0.39 μmol). Comparison of photoactivity of CdS-X and AgCdS-X series demonstrates the improvement in photoactivity in the samples modified with Ag. The sequence in photoactivity in the AgCdS-X samples respect to the sulphur source is the same than that previously described for the CdS-X series: AgCdS-T (36.87 μmol) > AgCdS-L (10.65 μmol) > AgCdS-S (5.6 μmol).

4. Discussion

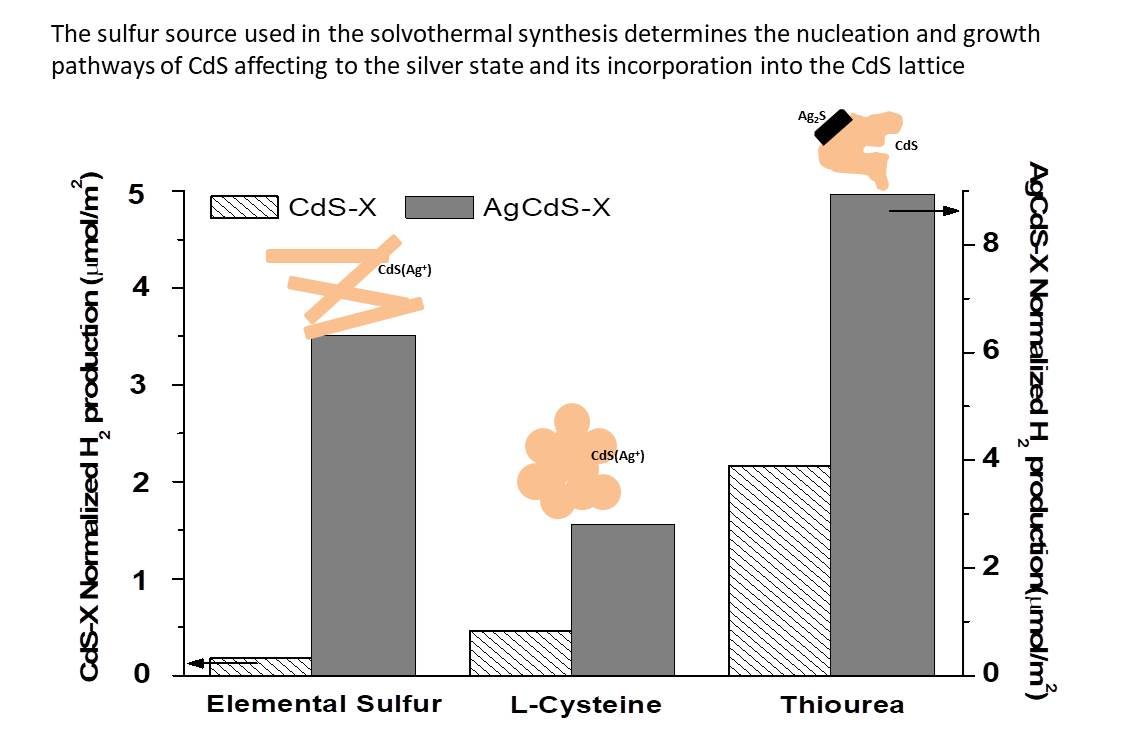
4.1. Influence of the Sulphur Source on the Structuration of AgCdS Photocatalysts

The physicochemical characterization of the CdS-X and AgCdS-X photocatalysts has revealed the strong impact of the sulphur source over the structure and photoactivity of the photocatalysts. It is well-known that the formation of CdS nanostructures under solvothermal conditions follows the solvent coordination molecular template (SCMT) model [38,39,44] in which the ethylenediamine acts as solvent and structure director agent. According to this model the changes in the morphology and structure of the CdS particles are related with the metal (Cd2+ and Ag+) complexation [67,68,69,70] and the S2−generation rate because both factors determine the nucleation and crystallization of the final nanostructures of CdS [43,51,71]. In the solvothermal synthesis using ethylenediamine as solvent, the complexation of Cd and Ag take place in the first step according to its different complex stability constants (see Table S2):
Cd 2 +   +   nEDA   [ Cd ( EDA ) n ] 2 +
Ag +   +   nEDA   [ Ag ( EDA ) n ] +
The lower stability of the [Ag(EDA)2]+ complex (K = 104.7) respect to that of [Cd(EDA)2]2+ (K = 1010.1) and the low solubility of Ag2S (Ksp = 6.3 × 10−50) respect to CdS (Ksp = 8 × 10⁻²⁷) leads to the fractionated precipitation of the sulphides whose contact and growth depend on the sulphide and metal concentrations. The first precipitation of Ag2S particles could act as a nucleating platform to form the first lamellar CdS structures without excluding some insertion of Ag+ ions into the CdS during the nucleation step, taking into account the high mobility of Ag+ in the Ag2S lattice [61]. In the last steps of the solvothermal mechanism, the lamellar CdS structures transform into nanobars by means of the rolling mechanism [35] and subsequently, they can growth to nanobars by aggregation following an Ostwald mechanism [72]. In such a way that the sulphur source used in the solvothermal synthesis produces important changes in the crystallinity and contacts between the CdS and Ag2S as consequence of the changes in the metal (Cd2+ and Ag+) complexation and the S2− generation rate that modifies the nucleation and kinetics of crystallization and growth. The S2− generation from the elemental sulphur is produced by the nucleophilic attack of ethylenediamine to the Sulphur, leading to sulphide ions and polianions [73]. The generation of S2− is slow and it results in the growth of Ag2S and CdS nuclei of small size. The precipitation of Ag2S particles could act as nucleating platforms to form the first lamellar CdS structures without excluding some insertion of Ag+ ions into the CdS during its nucleation [61]. The slow generation of S2− allows the evolution of the lamellar CdS structures into nanobars by means of the rolling mechanism [35] and subsequently they can grow to nanobars by aggregation following the Ostwald mechanism [72]. The use of L-cysteine can modify both the nucleation and growth steps of CdS because of the dual nature of L-cysteine acting as a complexing agent and sulphur source. In this case, the Cd2+ and Ag+ ions could complex with ethylenediamine and L-cysteine taking into account the relative stability of the complexes [67]. As the temperature increases, the L-cysteine complexes lose their stability and Cd(Ag)-S bonds are obtained forming the initial sulphide nuclei:
[ Cd   ( L - Cys ) 2 ] 2 +   +   [ Ag ( L - Cys ) ] +     Ag - CdS   ( L - Cys ) n .
Once the L-cysteine complexes decompose, the Cd-EDA complexes contribute to the growth of the small particles Ag-CdS L-cysteine:
Ag - CdS   ( L - Cys ) n   +   [ Cd   ( EDA ) 2 ] 2 +   Δ T   Ag - CdS   ( L - Cys ) +   n   EDA .
The steric effects produced by the L-cysteine adsorbed on the CdS nuclei impedes the evolution of Ag-CdS into nanobars by means of the rolling mechanism [35], obtaining the observed globular morphology. The use of thiourea can also modify both the nucleation and growth steps of CdS because the thiourea could act as both complexing agent and sulphur source. In this case, the thiourea forms stable complexes with the Ag+ ions while the ethylenediamine is coordinated with the Cd2+ ions according to the relative stability of the complexes [67]. As the temperature increases, the hydrolysis of thiourea takes place to quickly produce the S2− anions. At the same time, the Ag-Tu complex is decomposed and this factor, together with the high availability of S2− ions formed from thiourea, leads to the initial fast nucleation and growth of the Ag2S precipitates. The nucleation of CdS from Cd-EDA complexes takes place subsequently forming a high number of small CdS nuclei in contact with Ag2S particles without excluding some insertion of Ag+ ions in the CdS during this nucleation step. The subsequent growth step of CdS after the nucleation to form bidimensional structures (by Ostwald ripening) and the formation of nanorods by rolling mechanism are kinetically limited because of the low availability of S2− after the quick hydrolysis of thiourea that results in low crystalline CdS nanostructures.

4.2. Nanostructuration of AgCdS and Its Relationship with Photoactivity

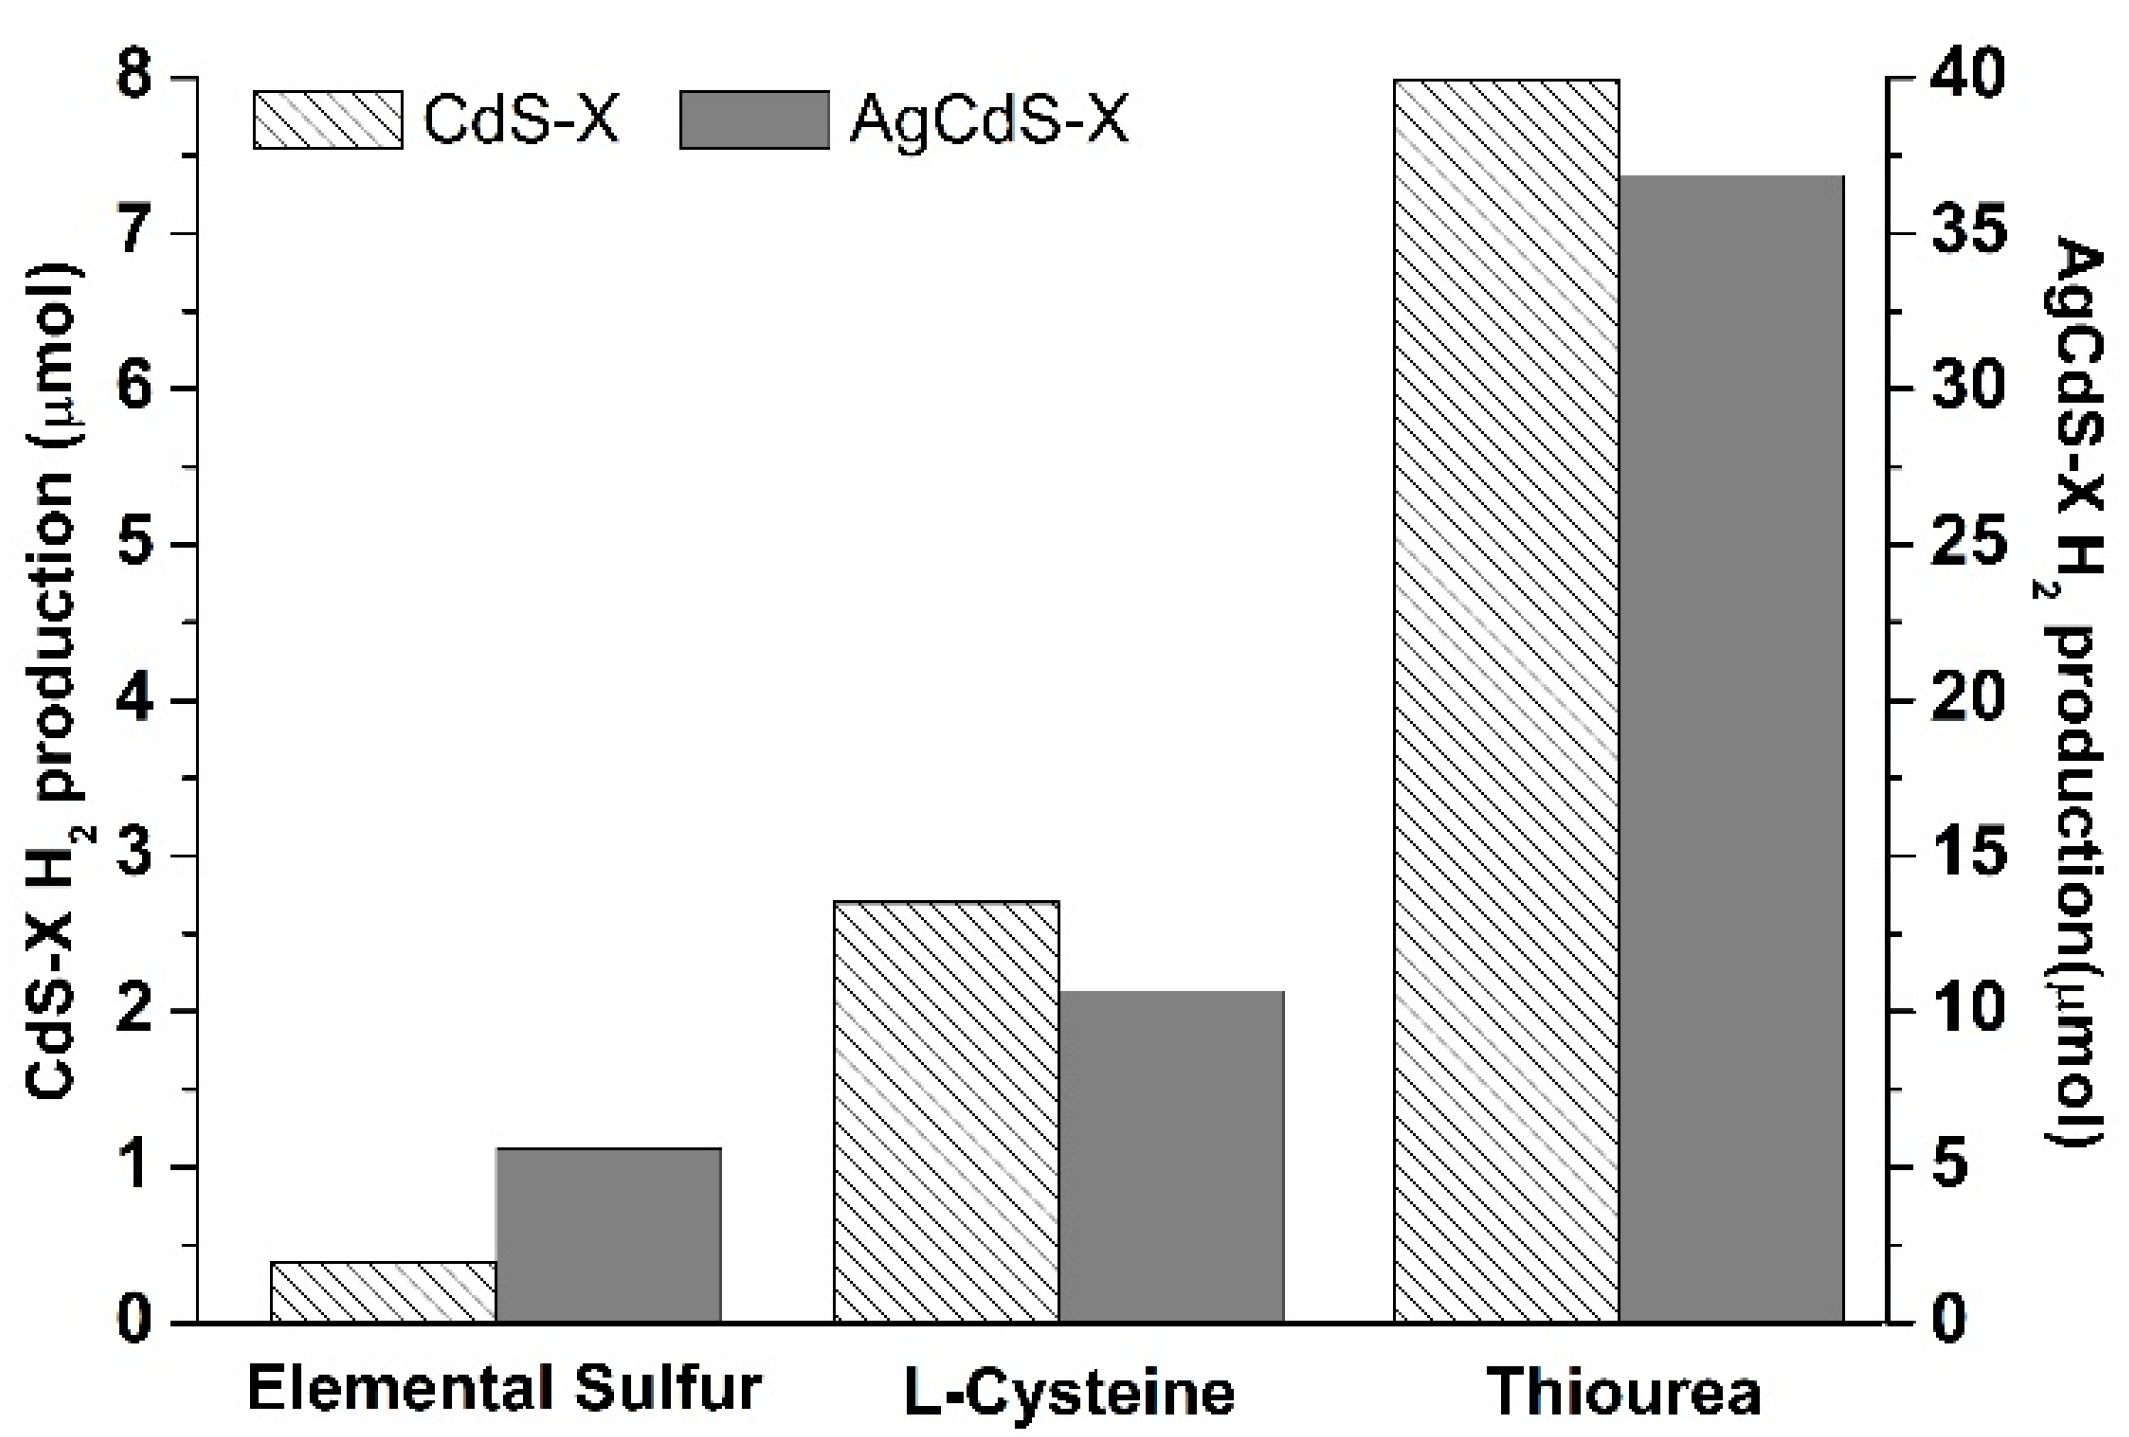
The differences in the photoactivity of the CdS-X and AgCdS-X samples must be discussed according to their different photophysical properties. Such properties have been strongly influenced by the nature of the sulphur source, affecting the photocatalytic stages from the light absorption to generate electron and holes, their transport and/or recombination and the redox reactions promoted by those electrons able to reach the surface of the photocatalyst.
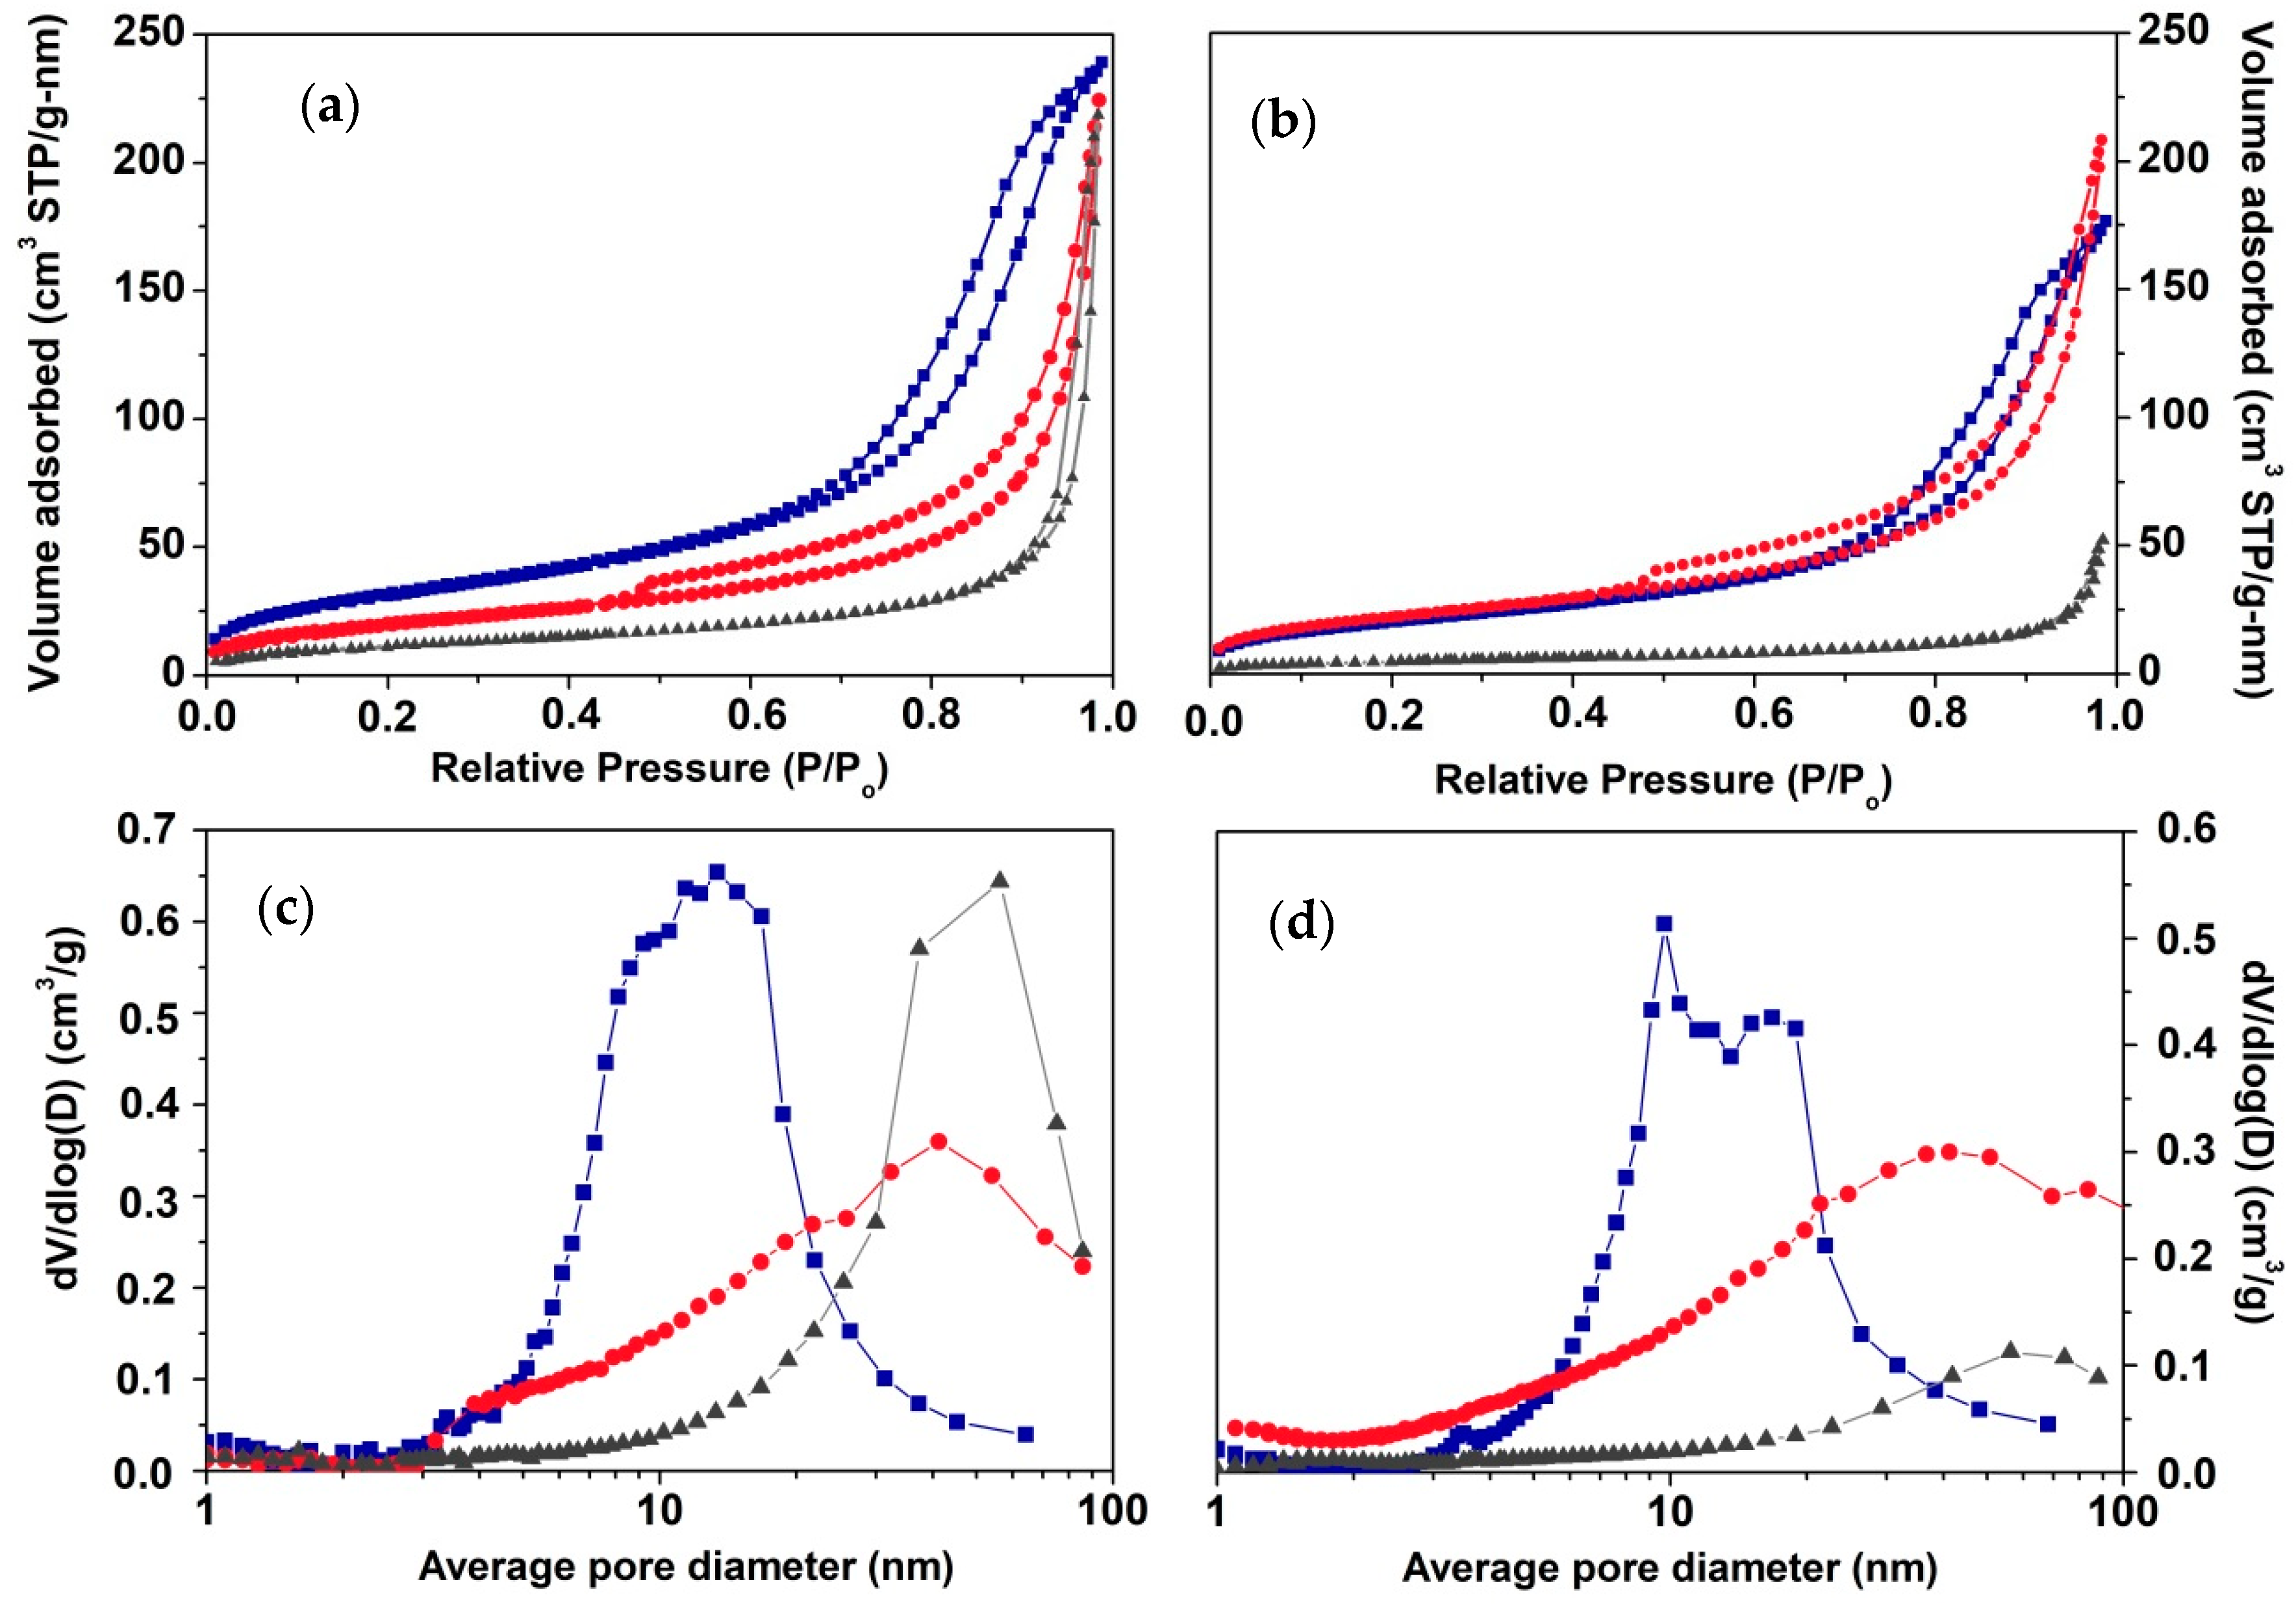
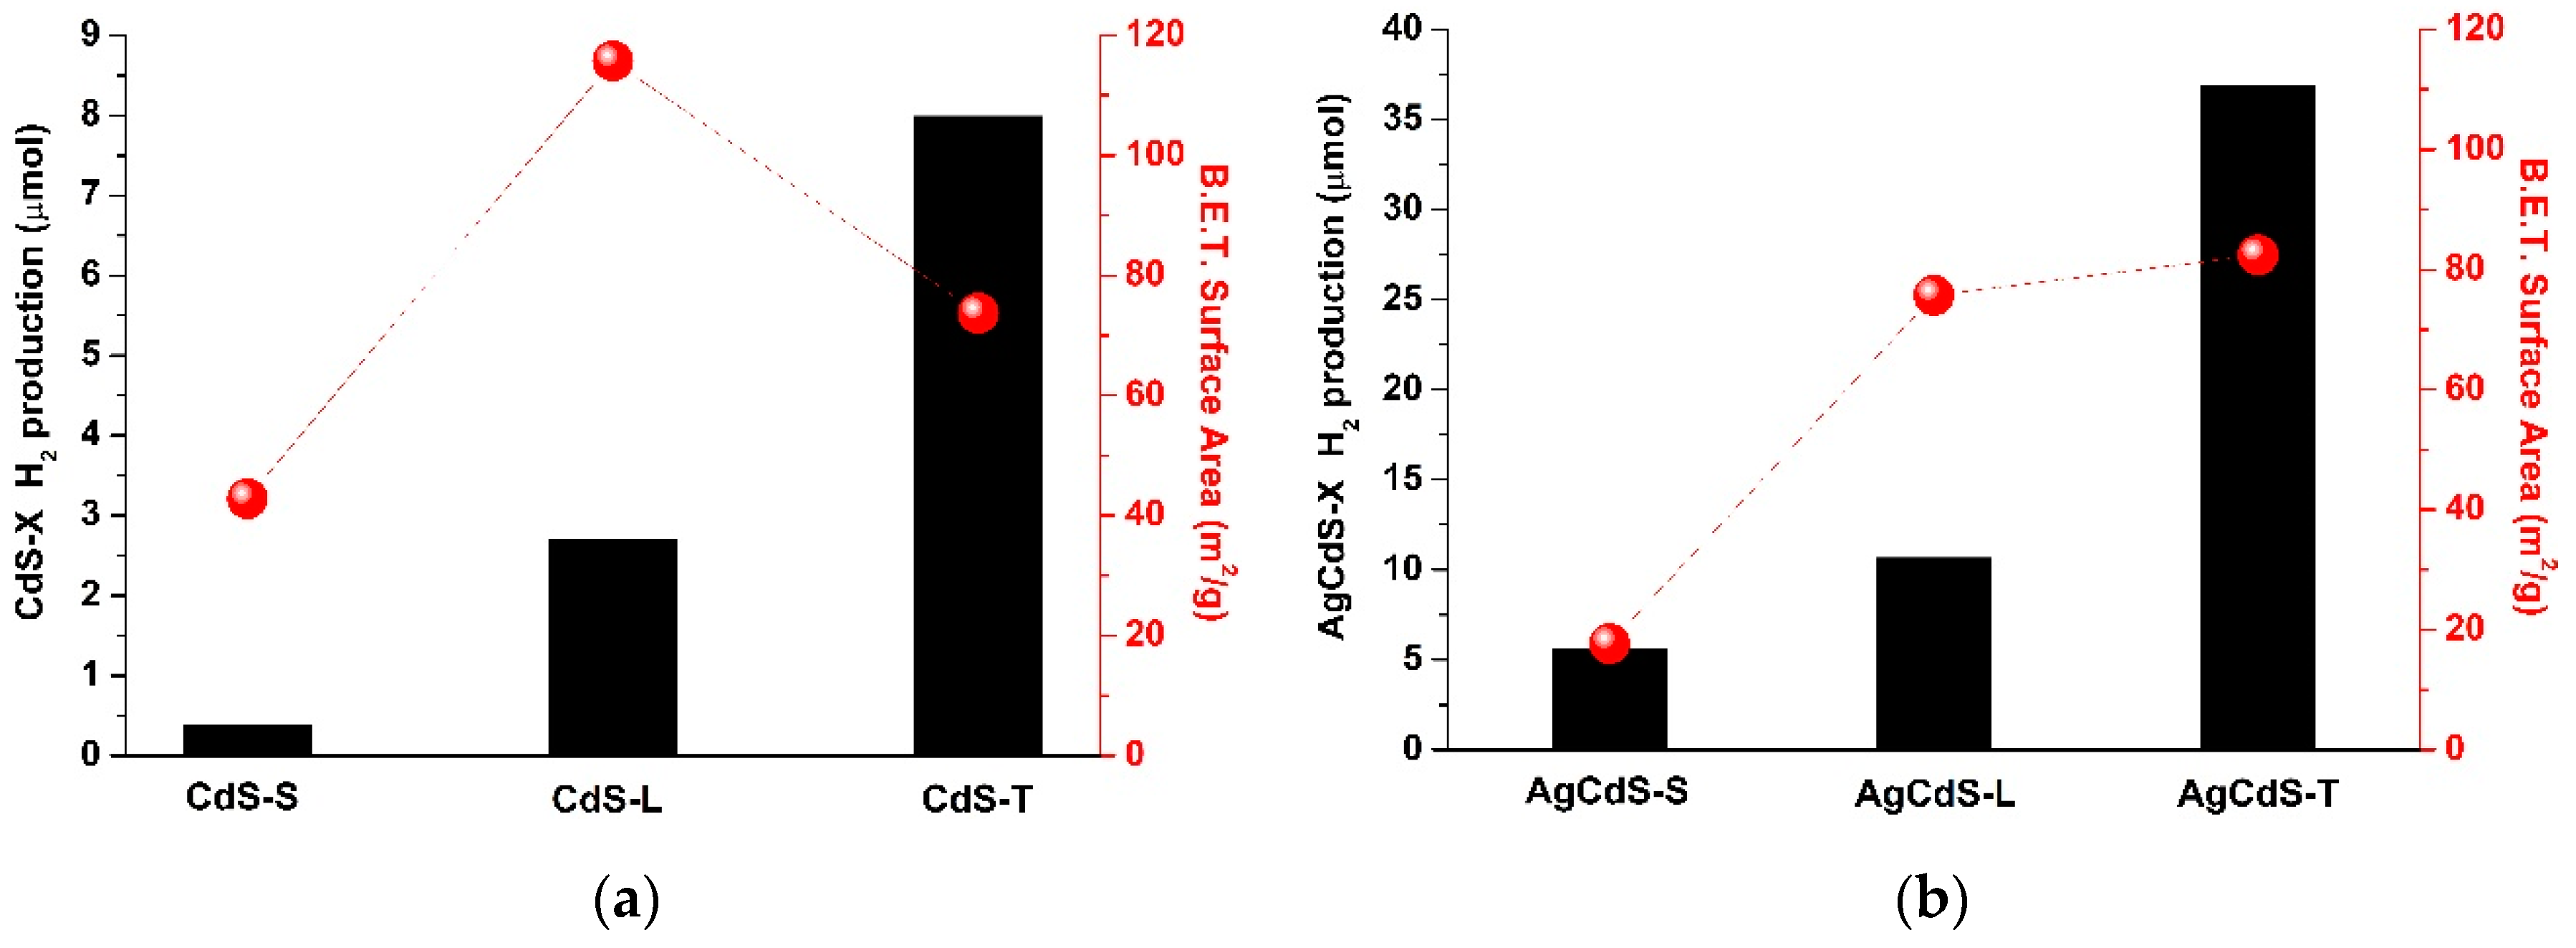
One of the most important parameters involved in the light absorption ability of the photocatalysts is related with the surface area exposed to irradiation. The Figure 10 shows the evolution of the hydrogen production (µmol) respect to the surface area in the CdS-X and AgCdS-X series. For both photocatalyst series it was found that the photoactivity does not evolve in parallel with the surface area (Figure 10), which indicates that there are additional factors to the surface area to justify the differences in the photoactivity of the CdS-X and AgCdS samples.
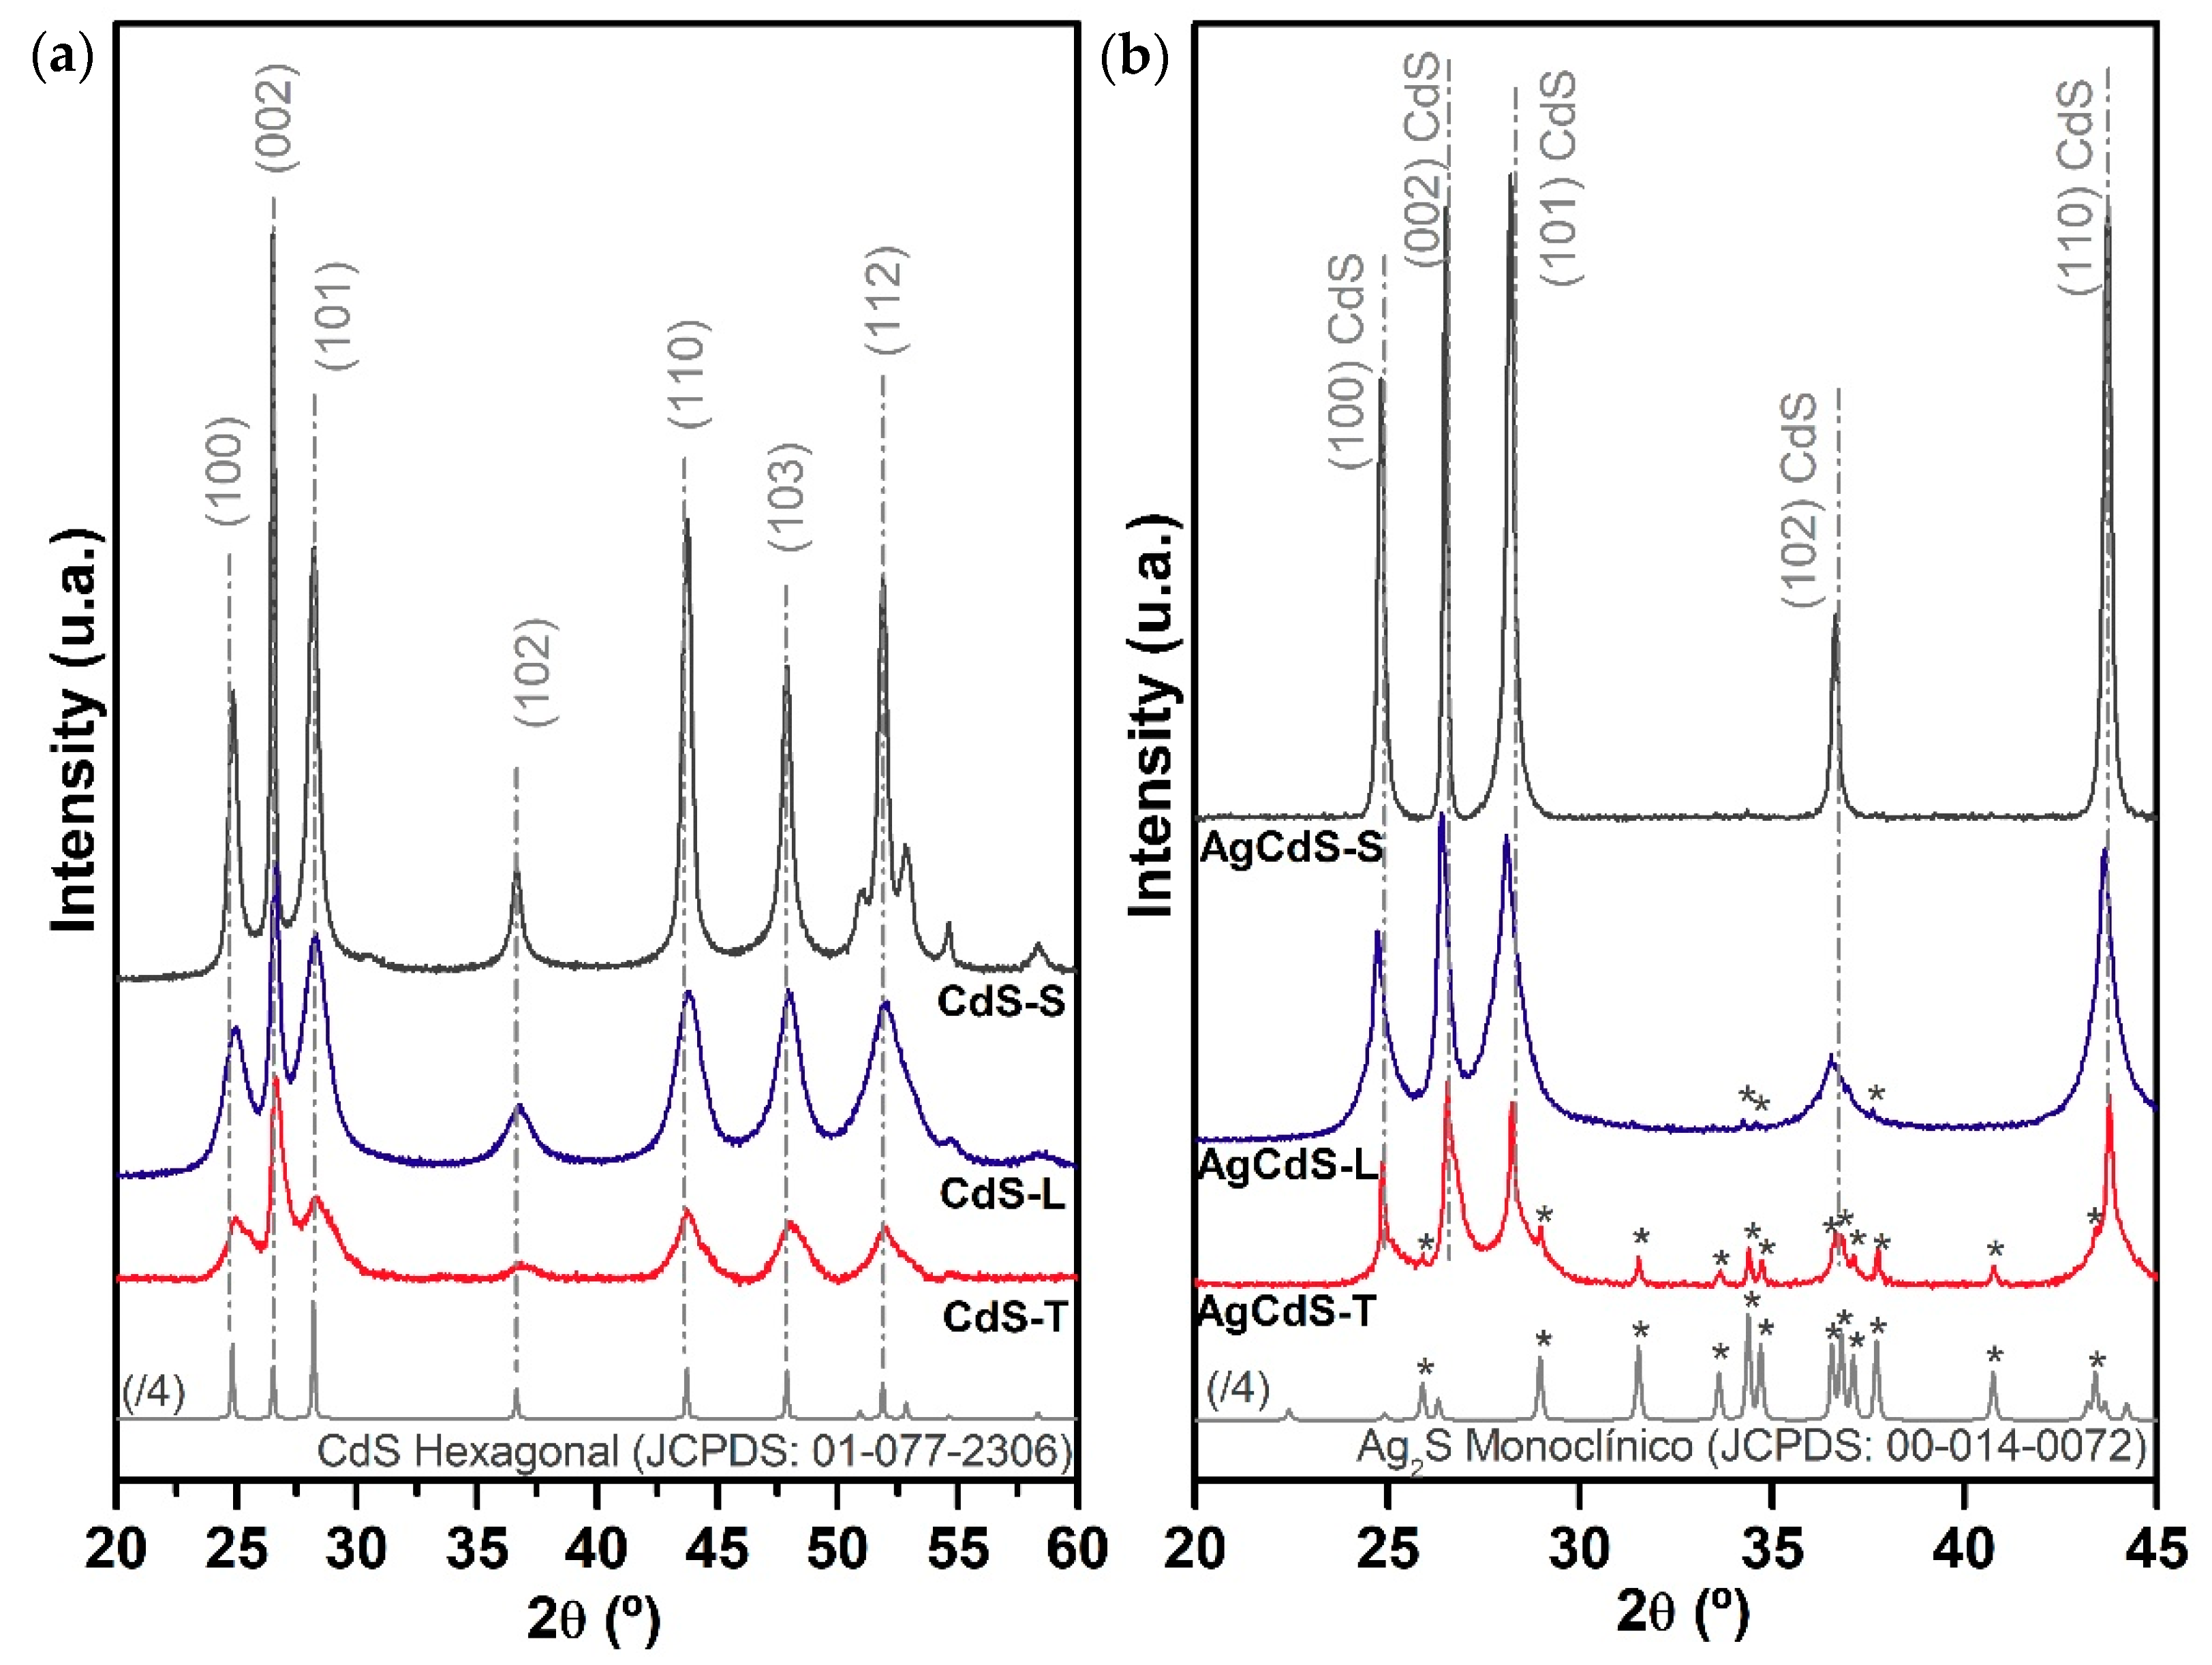
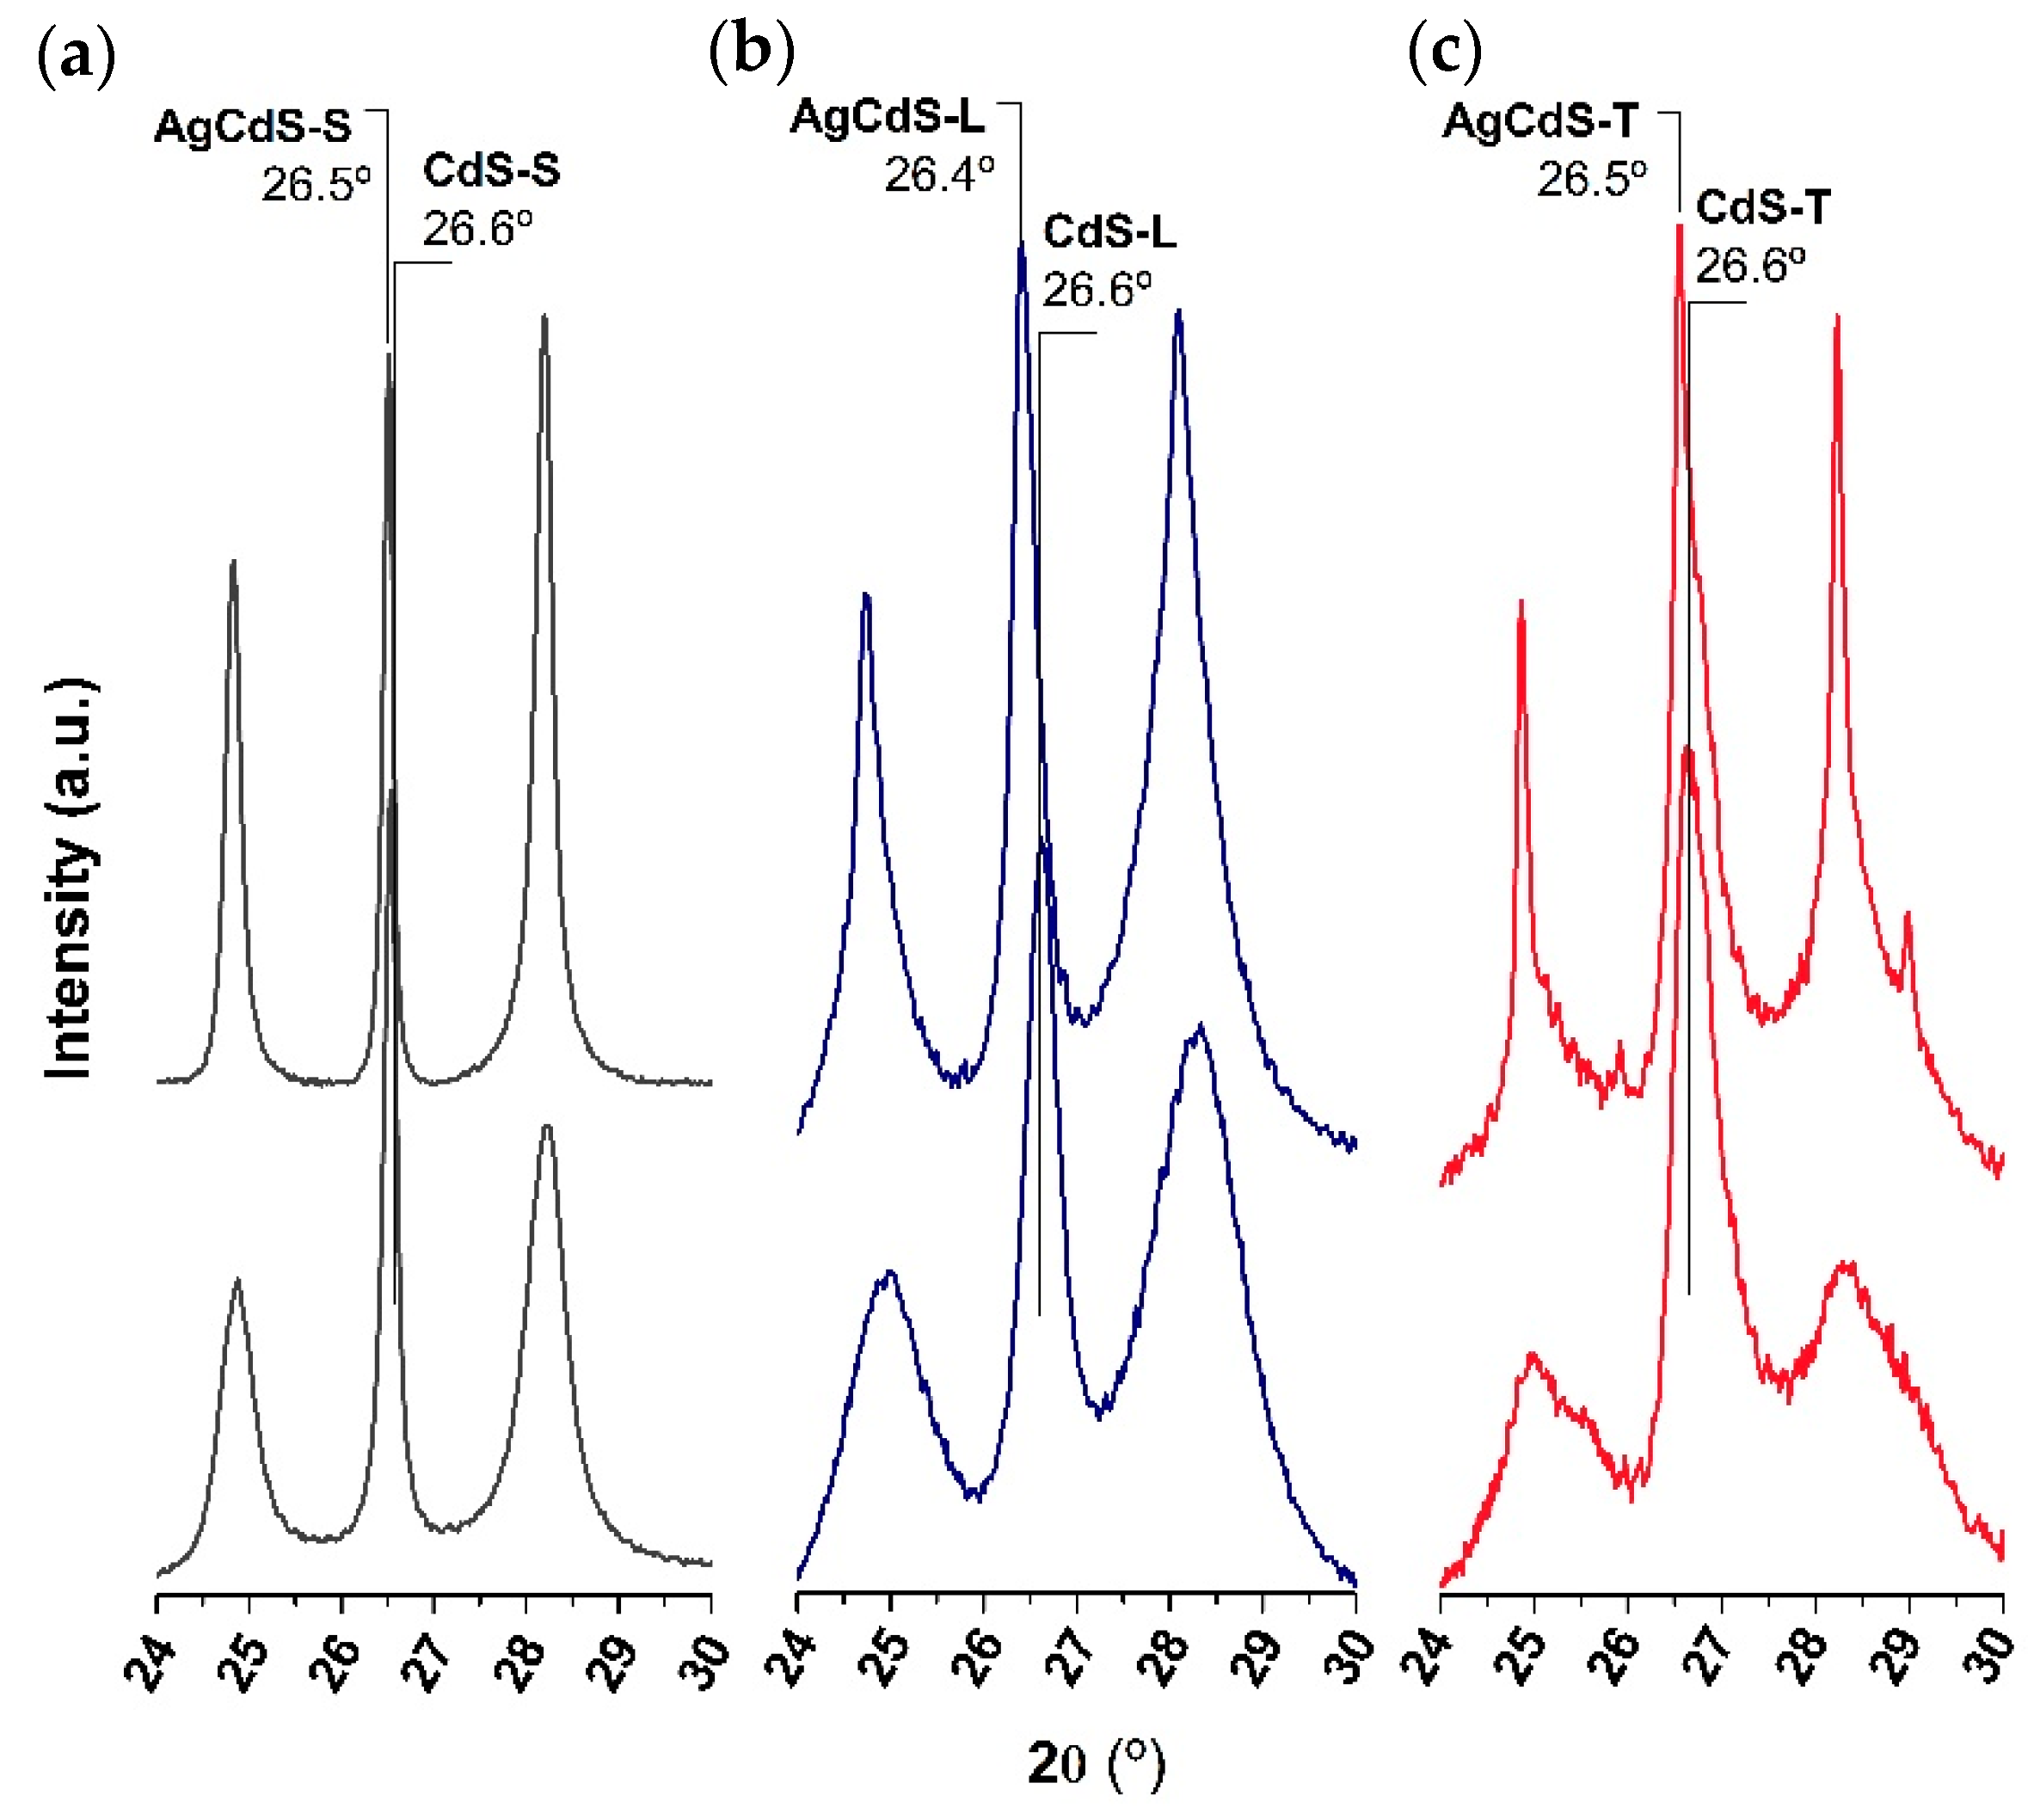
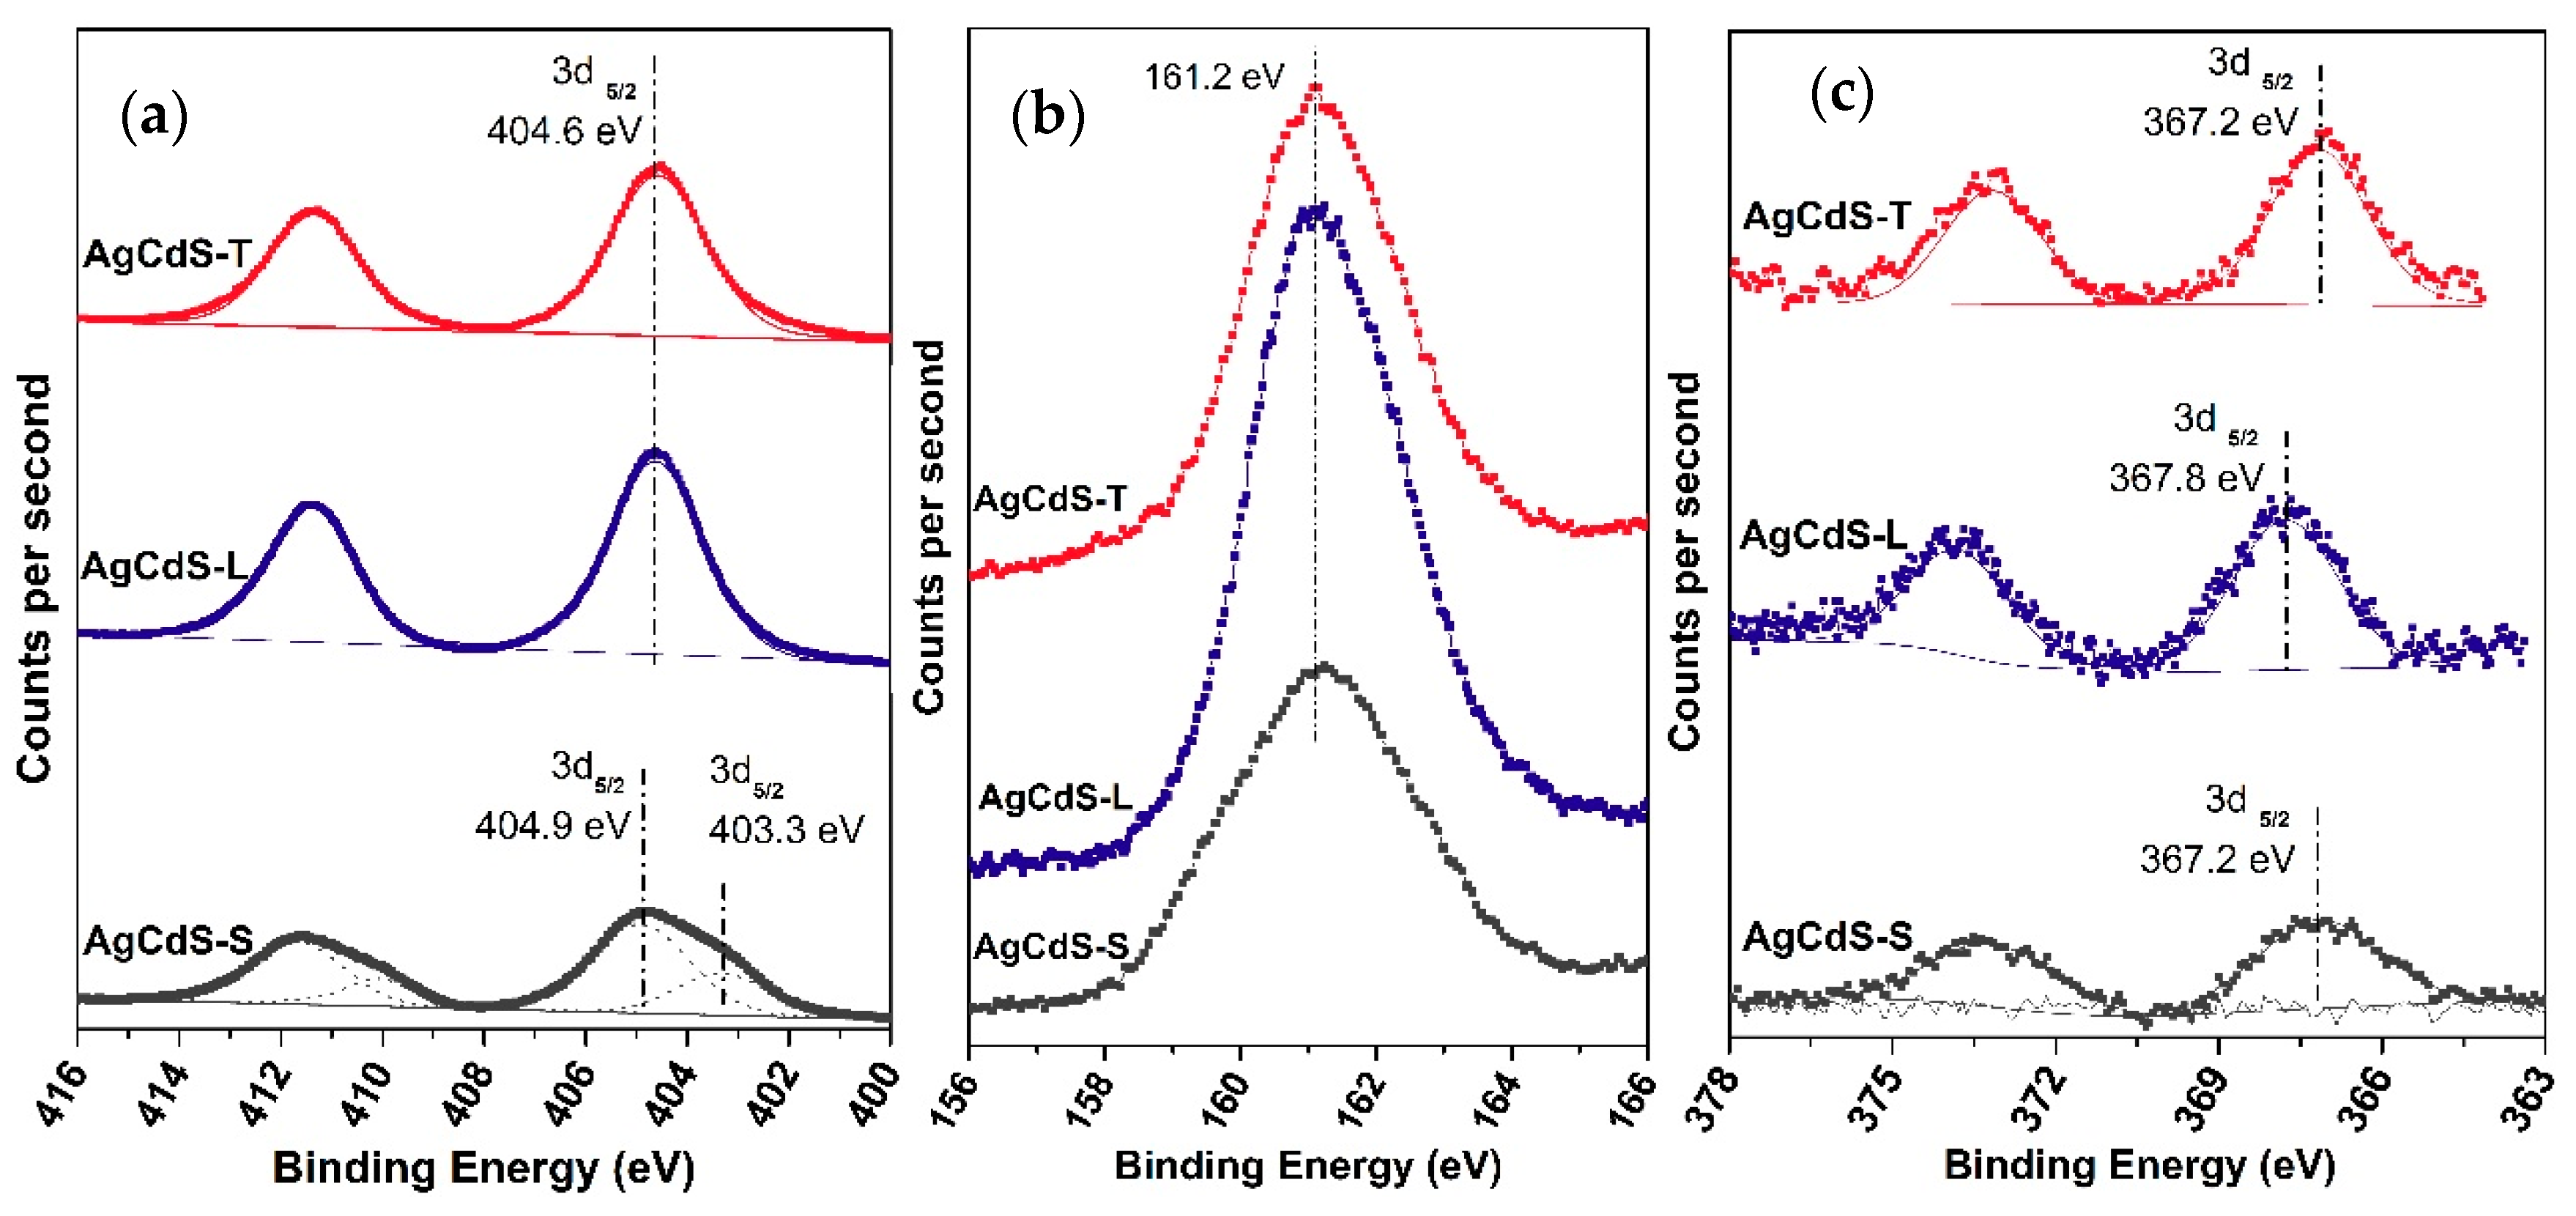
The capacity to generate electrons and holes is another important parameter related with the photoactivity. This fact is governed by the energy of the bandgap, because it determines the effective photons that are able to excite electrons from the valence band to the conduction band. The lower bandgap, the higher range of photons can be harnessed to generate electrons and holes. The energy gap of the AgCdS-X photocatalysts decreases respect to the CdS-X samples in the case of the samples prepared with elemental sulphur and L-cysteine (AgCdS-S and AgCdS-L). For these samples, the Ag+ insertion into the CdS lattice, demonstrated by XRD and TEM, generated new electronic states near the valence band of the CdS, decreasing its band gap respect the CdS-X samples (Table 6).
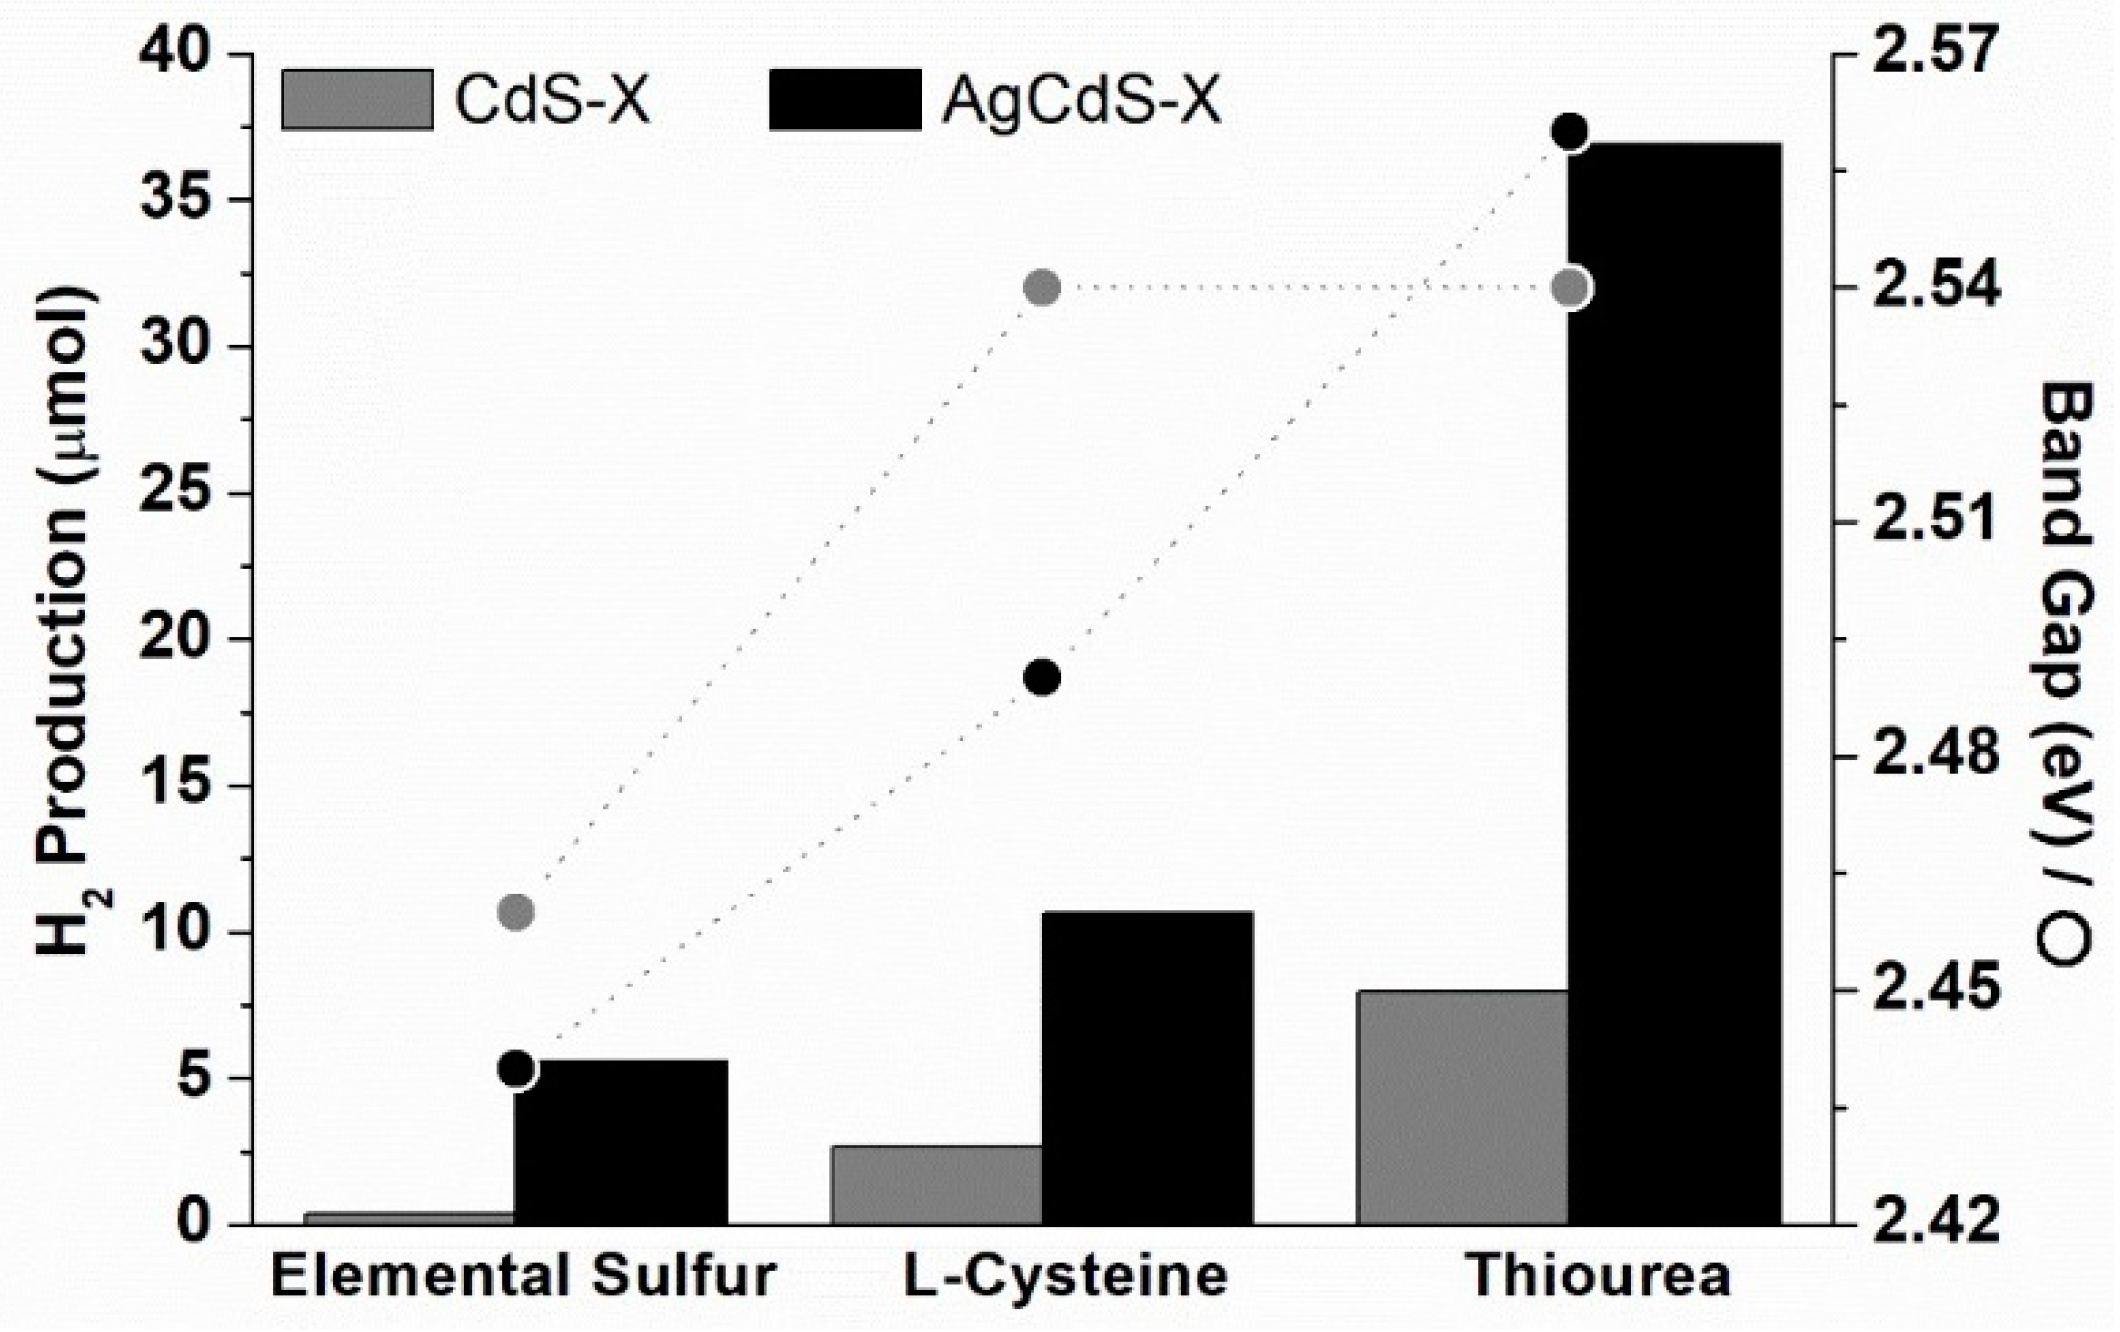
The comparison between the bandgap energy of the CdS-X and AgCdS-X samples and its photoactivity is shown in 
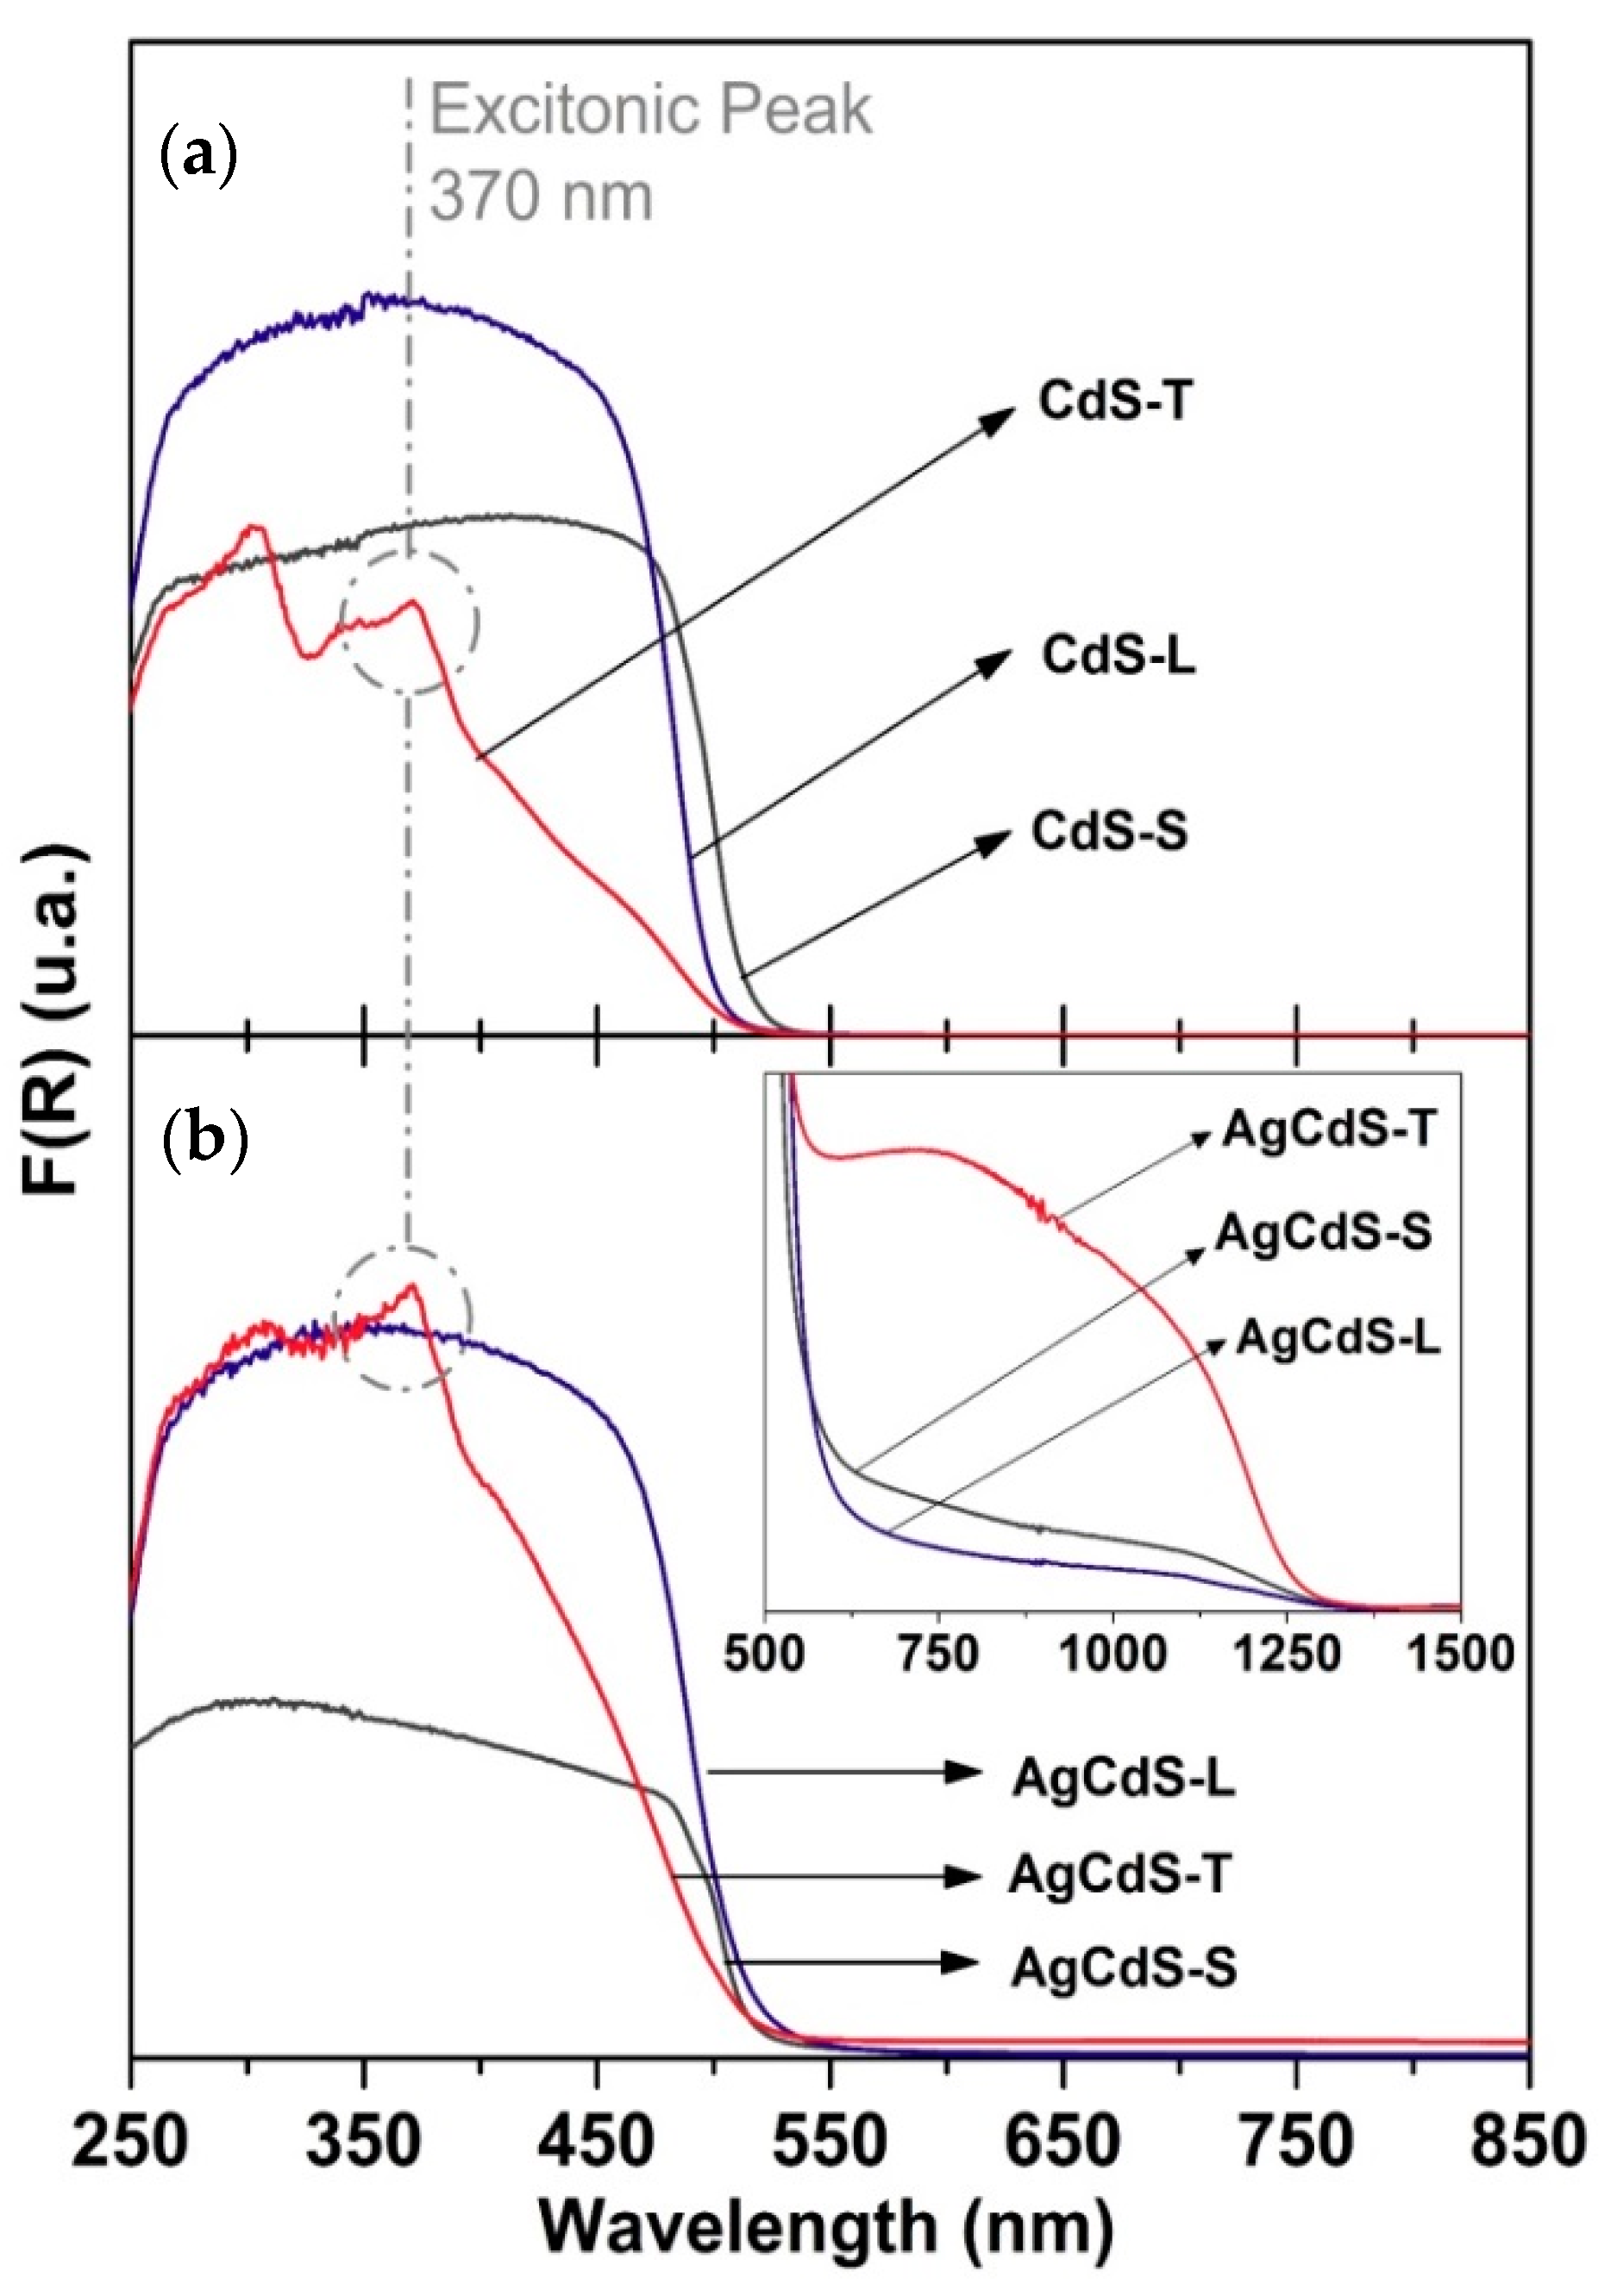
Figure 11. It is observed an improvement in the photoactivity of the AgCdS-X respect to bare CdS-X counterparts only for the samples prepared with elemental sulphur and L-cysteine (AgCdS-S and AgCdS-L). This improvement is parallel to the band gap narrowing observed for the AgCdS-S and AgCdS-L samples. However, for the samples prepared with thiourea (CdS-T and AgCdS-T), a different trend was observed, showing the AgCdS-T higher photoactivity in spite of the increase in the energy gap observed for this sample respect to those prepared with elemental sulphur and L-cysteine. The better photoactivity of the AgCdS-T photocatalyst in spite of its higher energy gap could be related with additional factors related, with the presence of small crystalline structures (quantum dots), as the UV-vis spectra showed (Figure 7). The origin of these quantum dots is associated to the fast nucleation of sulphides derived from the use of thiourea. Due to the extremely fast nucleation stage, there exist a large number of nuclei, which aggregation and growth through the Ostwald mechanism was hindered, remaining as small crystalline domains. These small nanostructures generate quantum confinement effects that have been reported to strongly improve the photoactivity of CdS because they are able to absorb solar light, enhancing the surface amplitude of electrons and holes facilitating their interfacial reactions [39].
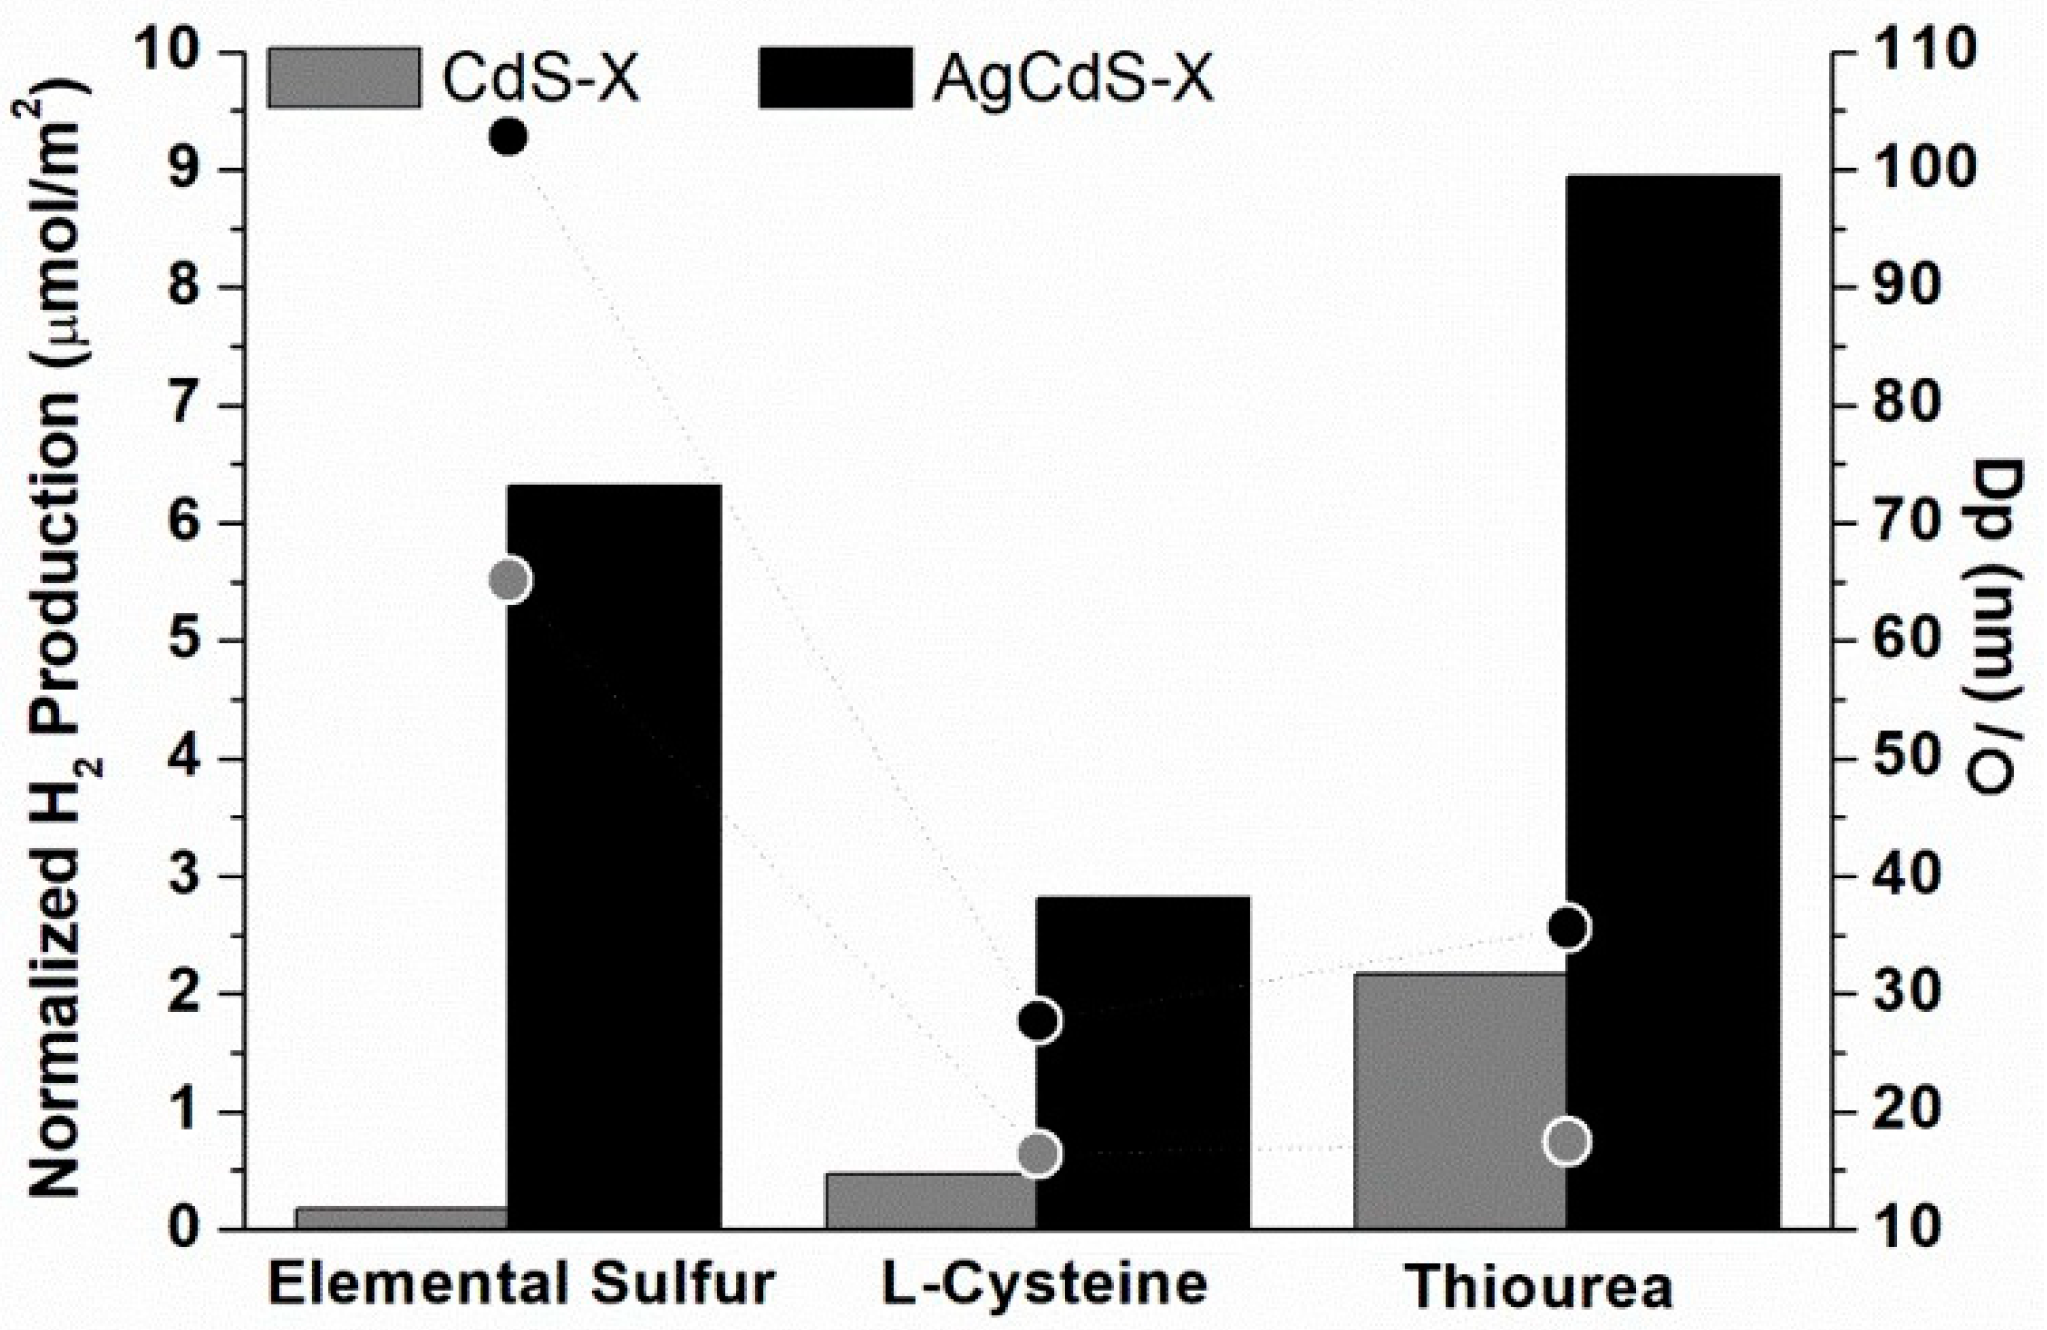
From the XRD analysis it was found differences in crystallinity and size of CdS-X and AgCdS-X photocatalysts, and thus, these parameters must be analysed because it is known that crystallinity and size are involved in the effectiveness of the mobility of electron and holes to achieve the photocatalytic surfaces. In this sense the effectiveness of the carrier mobility can be improved in CdS structures of low size and high crystallinity because they decrease the distance to reach the surface and the number of grain boundaries, which act as recombination sites. Figure 12 compares the intrinsic photoactivity (µmol/m2) of the AgCdS-X and CdS-X samples respect to the crystallite size (Dp) calculated from XRD. As shown in Figure 12 there is not a clear correlation between photocatalytic activity and crystallite size. The effectiveness of the transport of electron and holes to achieve the surface of the photocatalysts can also be determined by the presence of Ag2S on the surface that can act as co-catalysts facilitating the transport of the energy carriers. According to this argument, the different intensities of the PL spectra (Figure 8) indicate that Ag2S species on surface play an active role to avoid the recombination processes.
The effect of residual nitrogen on surface of the samples prepared with thiourea could also be responsible of the high photoactivity observed on these samples because nitrogen linked to the surface Cd2+ ions can create surface states that promotes the transference of the photogenerated electrons to the protons to produce hydrogen [74].
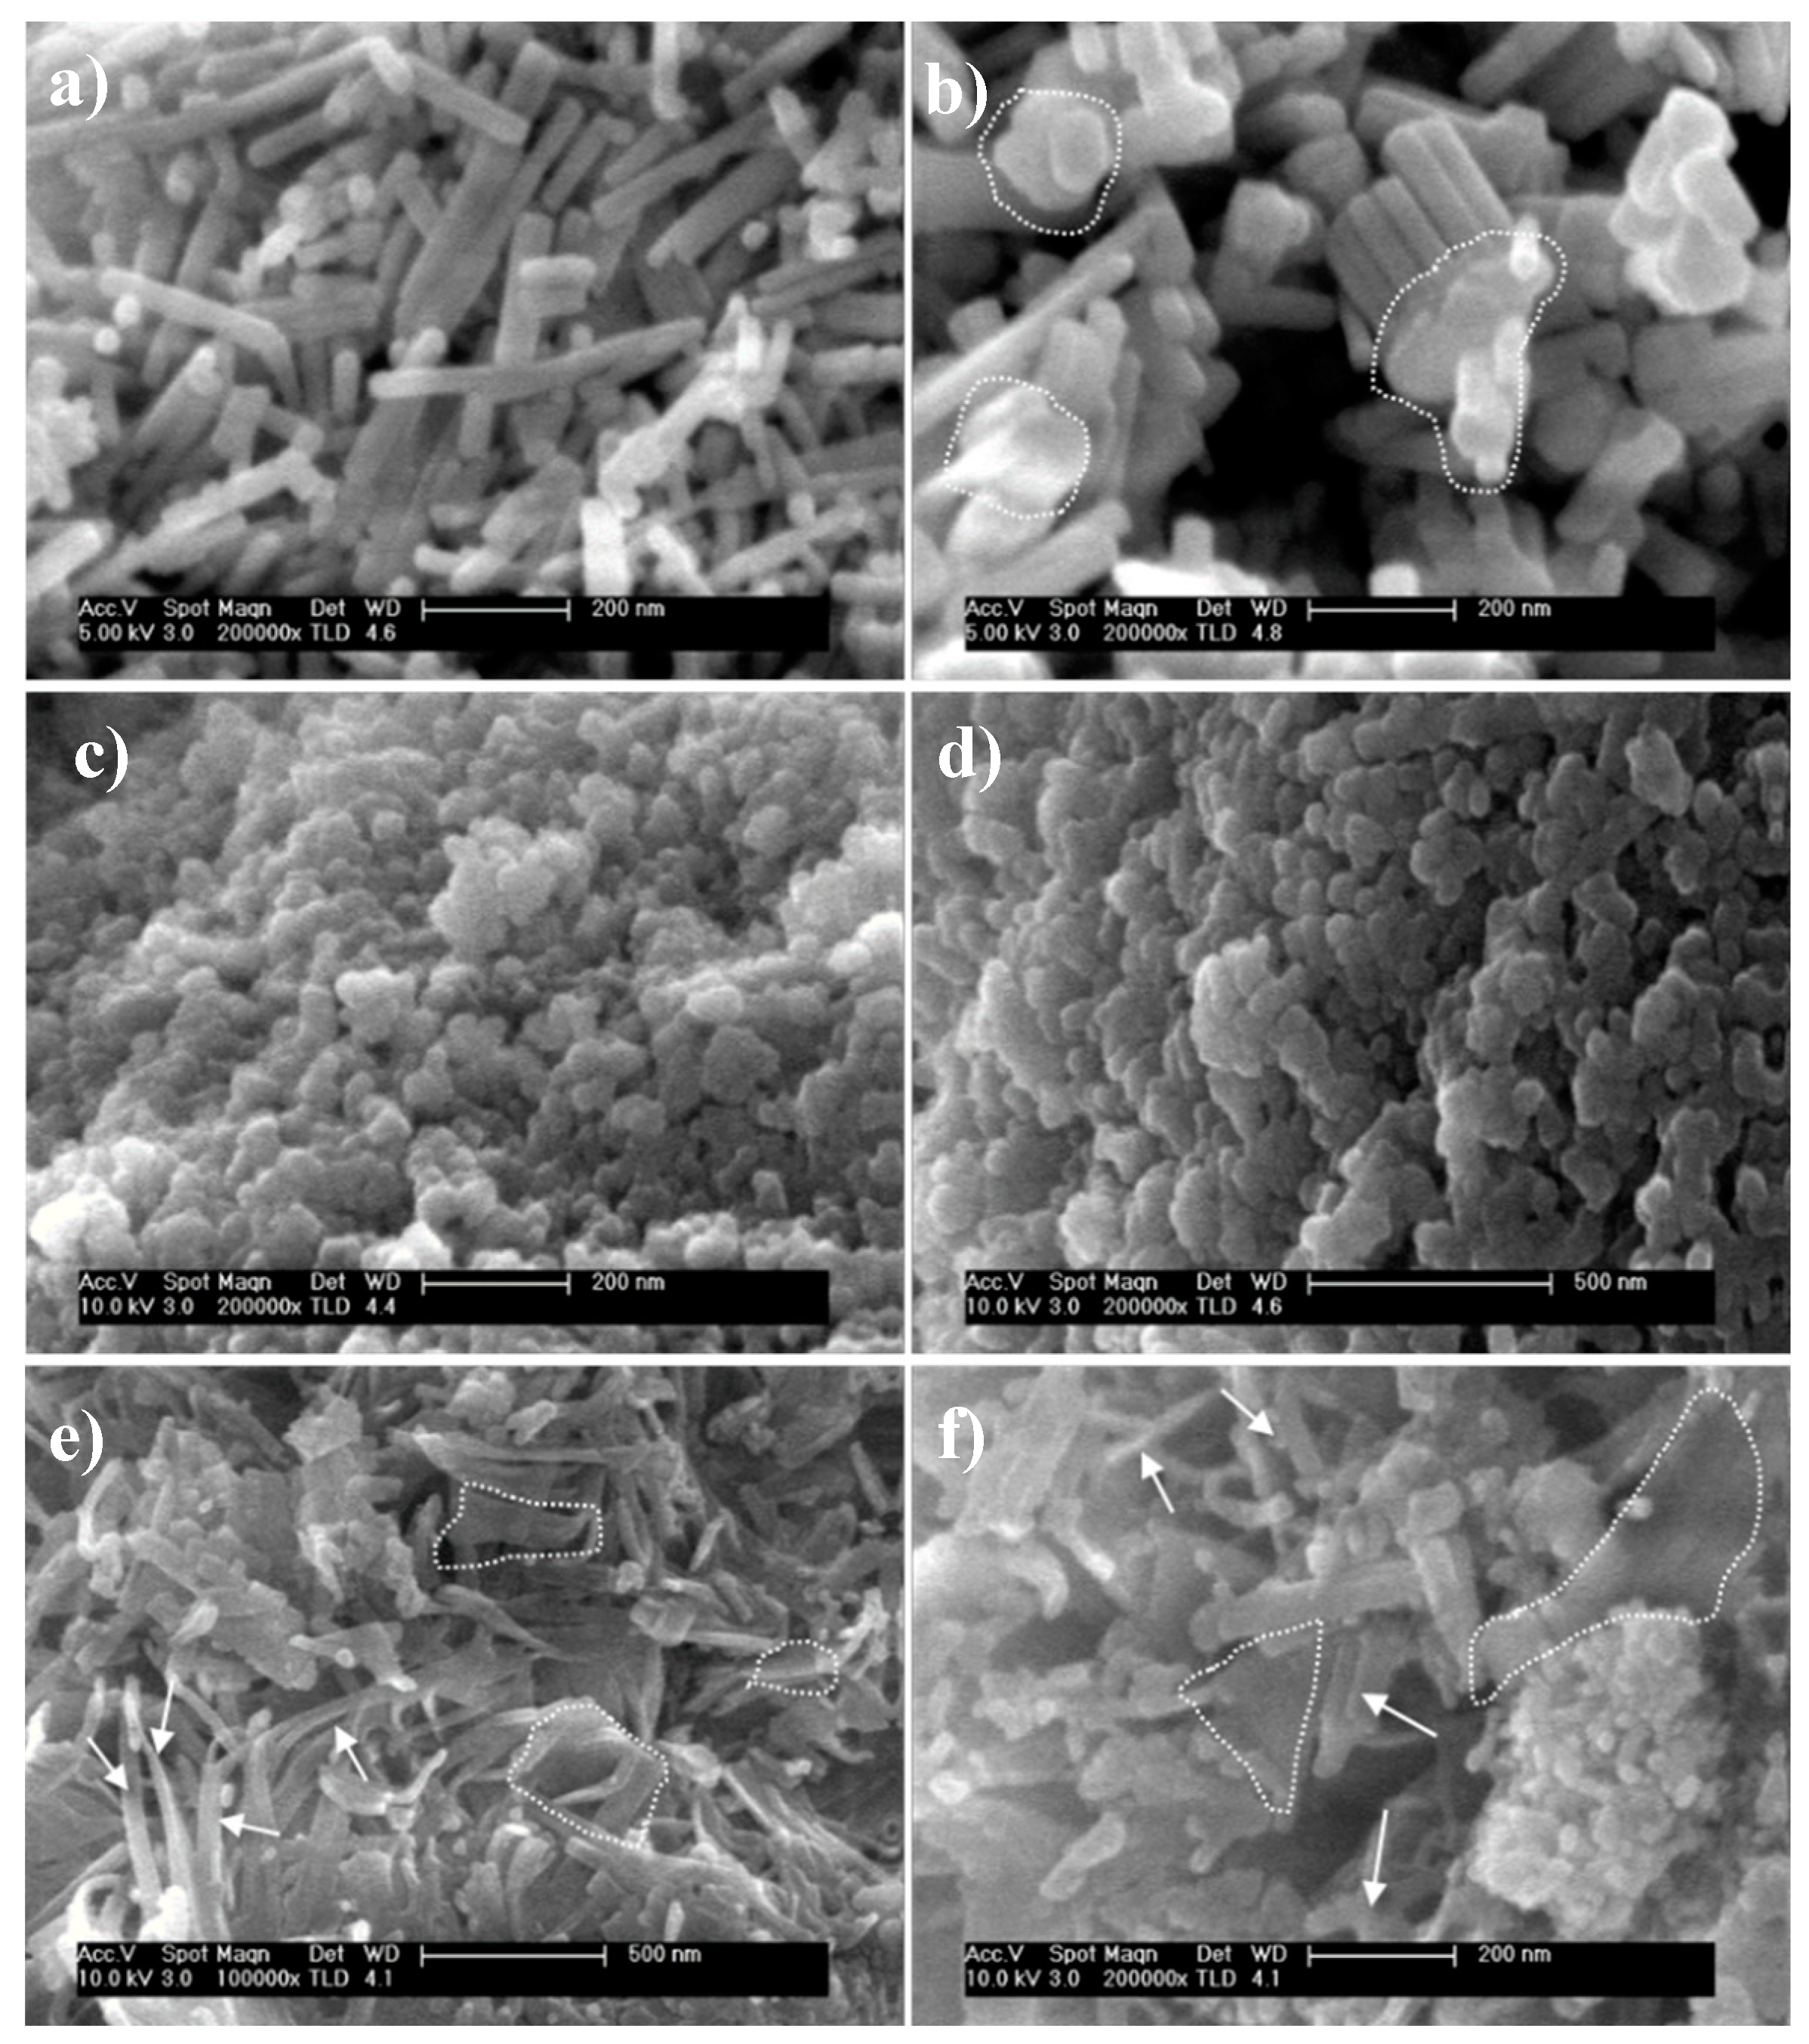
The differences in the crystallite size, crystallinity and textural properties described above are translated into different morphologies depending on the sulphur source employed (SEM analysis, Figure 4). However, none of these parameters showed a direct relationship with the photoactivity, and therefore it seems that the photoactivity of the AgCdS-X samples is linked to a combination of these factors together with the insertion of Ag+ in the CdS or the segregation of Ag2S on CdS.
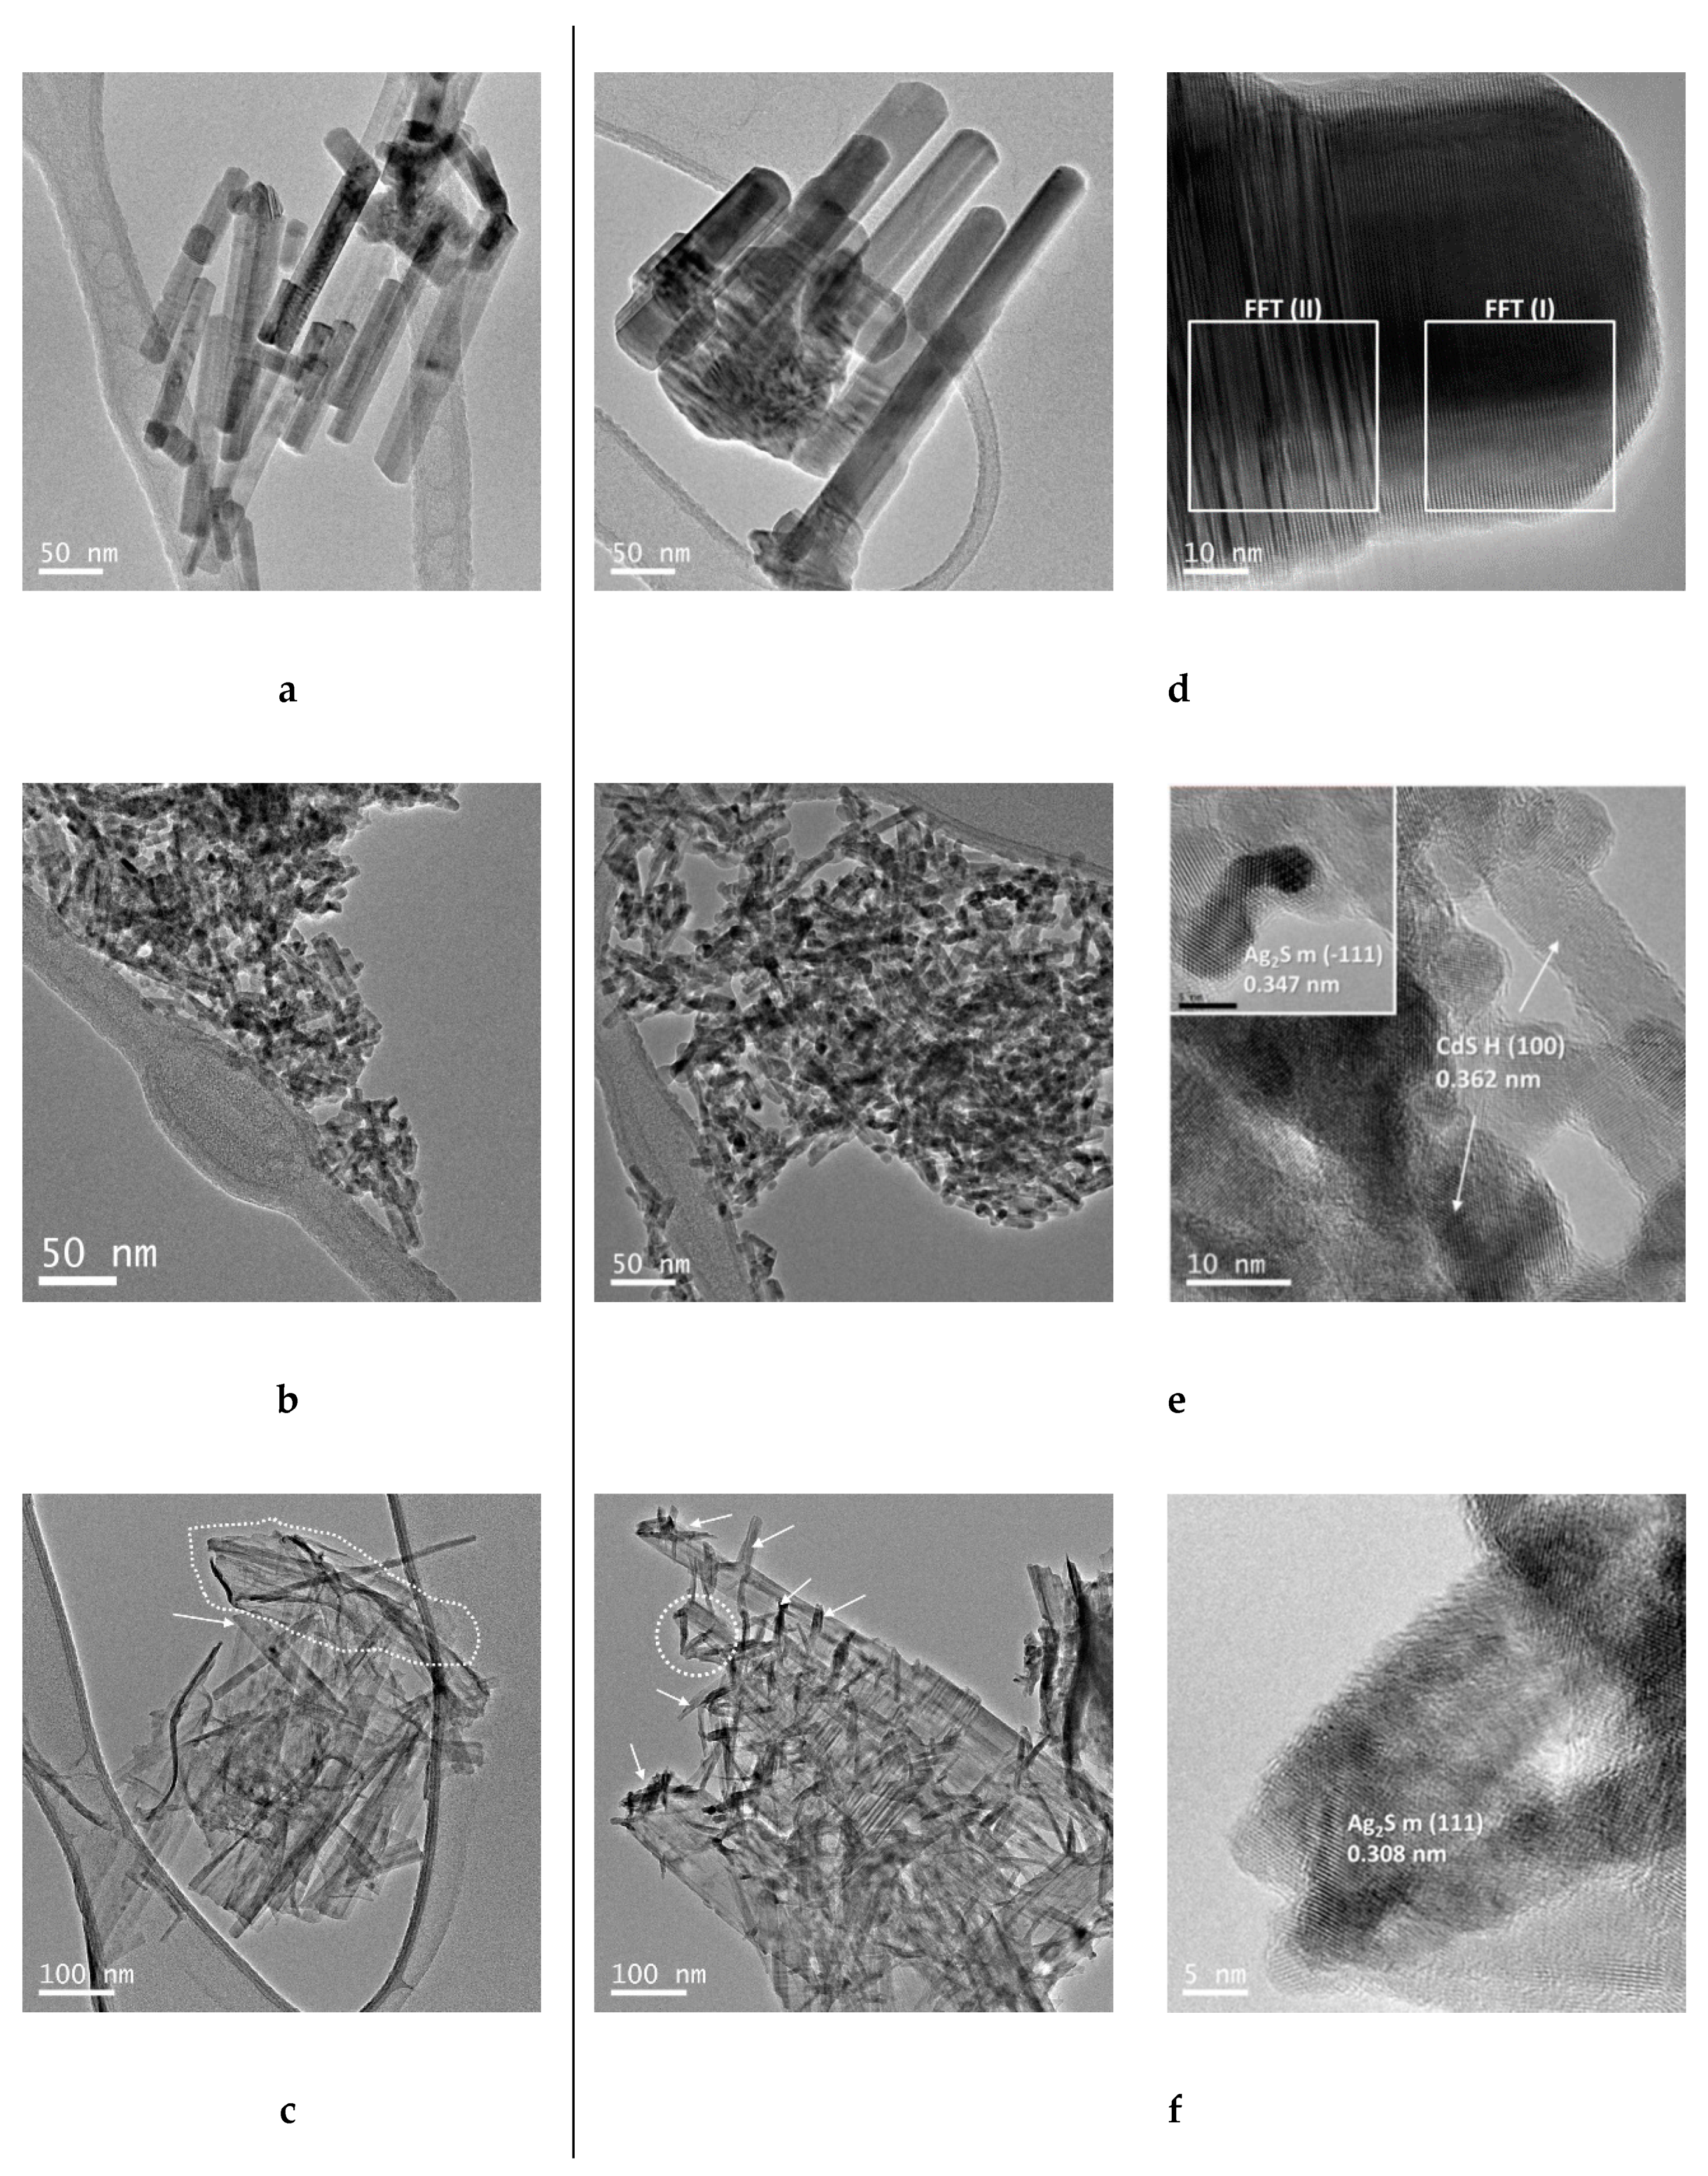
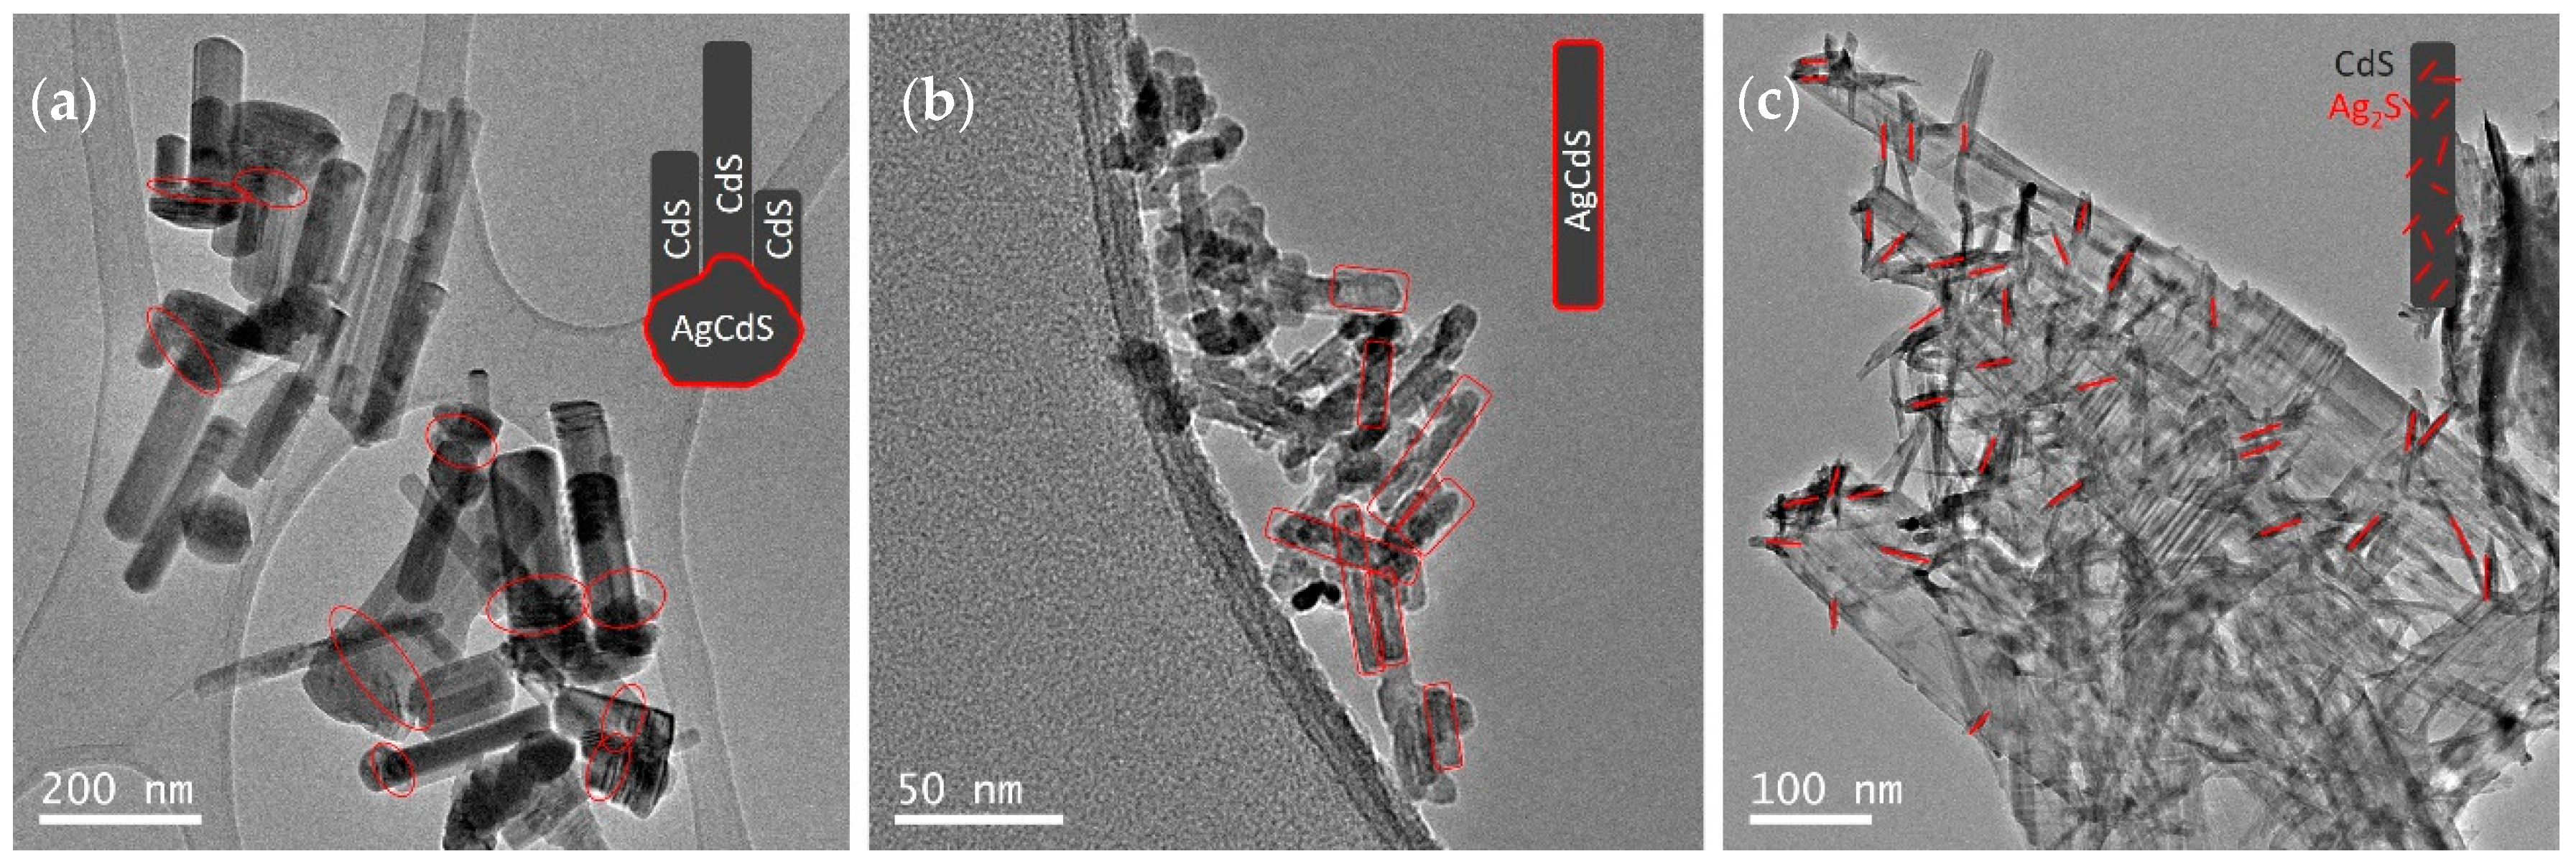
In the case of the sample, prepared with elemental sulphur (AgCdS-S, Figure 13a), highly crystalline CdS nanobars, in poor contact with AgCdS particles of high size, were obtained. The improvement in the photoactivity of the AgCdS-S sample respect its CdS-S counterpart lies in the formation of AgCdS particles whose band gap allows the absorption of a wider range of the solar spectrum. The improvement in the photoactivity of the AgCdS-S sample is limited by the formation of AgCdS particles in scarce number and with high size. For the sample prepared with L-Cysteine (AgCdS-L, Figure 13b), the insertion of silver was extended to the whole CdS structures and the size of the AgCdS particles was lower than in the previous case prepared with elemental sulphur. Therefore, the better development of AgCdS particles with lower size obtained in this AgCdS-L sample justifies its improvement in photoactivity respect to that obtained for the sample prepared with elemental sulphur. The sample prepared with thiourea (AgCdS-T, Figure 13c), shows the combination of CdS, Ag2S and small crystalline structures of CdS (quantum dots). These three components contribute to the improvement of the photoactivity observed in the AgCdS-T sample. Part of the improvement in photoactivity is related to the existence of small crystalline domains (QD) with strong confinement effect because these nanostructures are able to absorb solar light and quickly generate surface electrons and holes, and also because these nanostructures significantly enhance the surface amplitude of electrons and holes facilitating their interfacial reactions. In addition to this, the segregation of Ag2S and its junction with CdS allows the absorption of a wider range of the solar spectrum. Nevertheless, the effective management of the charge carriers to produce the redox reactions strongly depends on the relative position of the valence band and conduction band. The relative position of the valence and conduction band of CdS and Ag2S in the sample AgCdS-T has been calculated theoretically (see Materials and Methods section in Supplementary Info) and the results are collected in Table 7 [75,76,77,78].
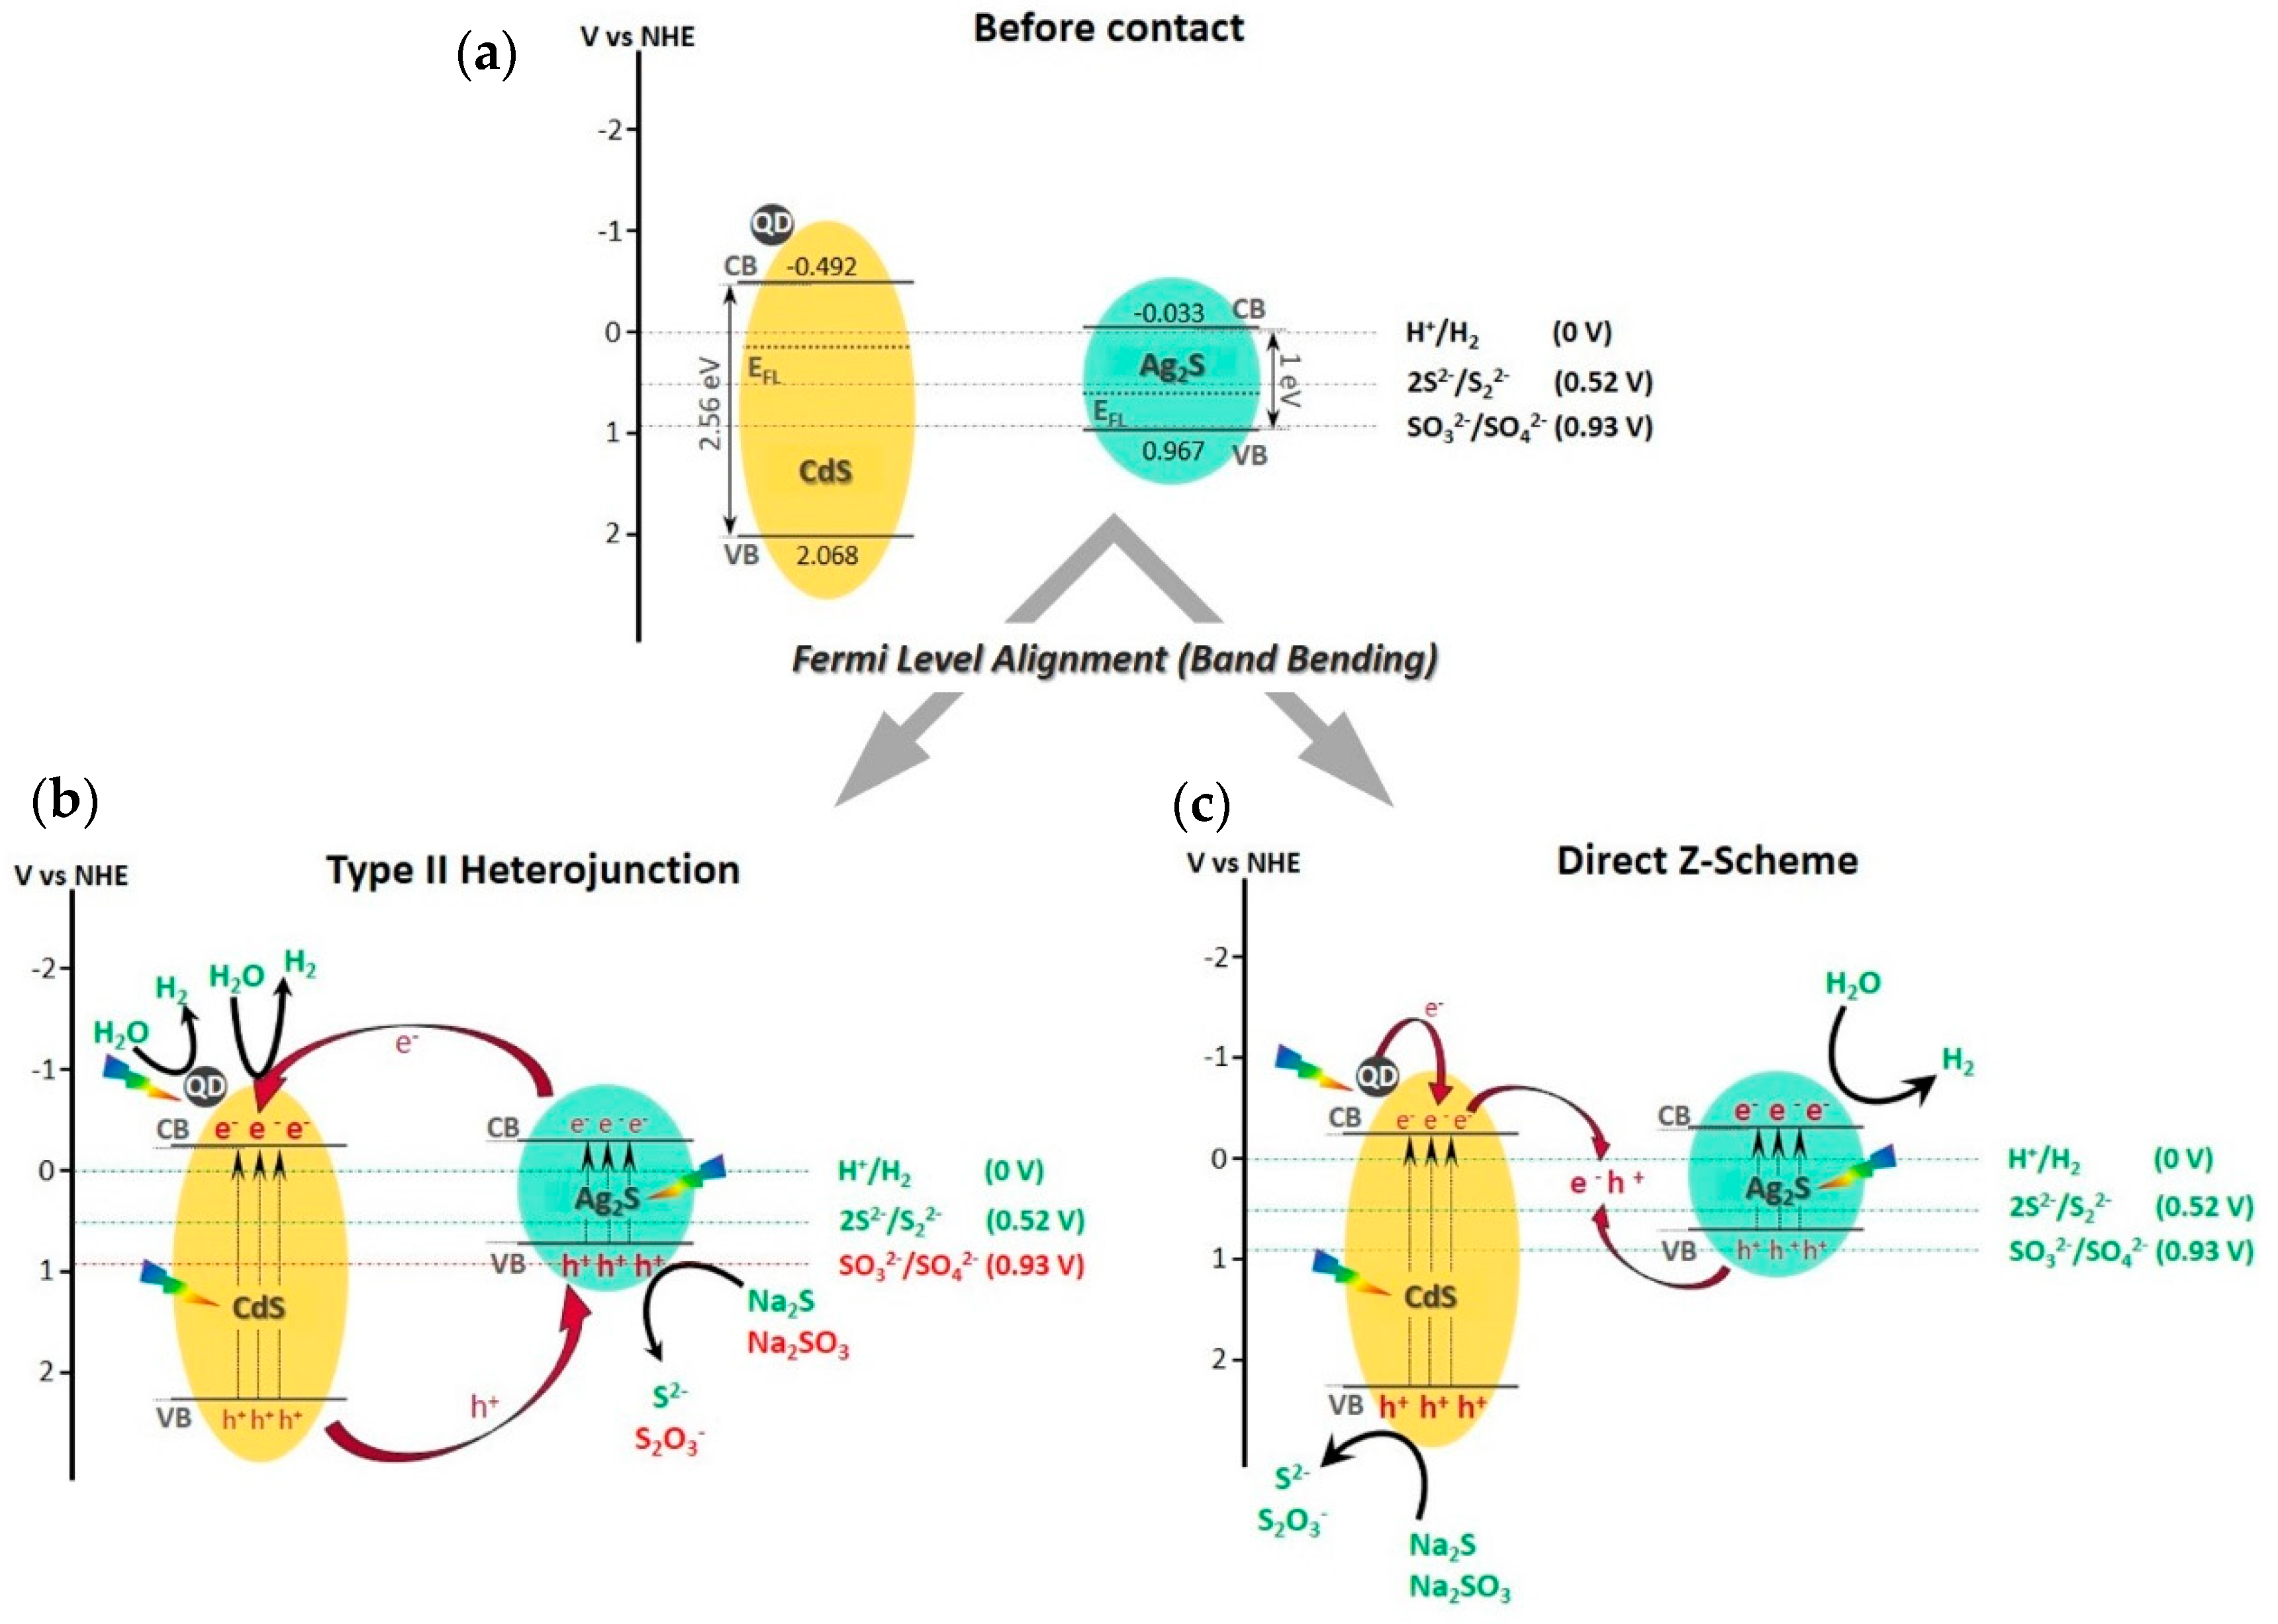
As it is depicted in Figure 14a, the CdS acts as a n-type semiconductor while the Ag2S is a p-type material, therefore the Fermi level (EFL) for CdS is near the conduction band and for Ag2S is near the valence band [79]. The close contact between CdS and Ag2S in the AgCdS-T sample promotes the Fermi level alignment through the flow of electrons from the CdS conduction band to that of Ag2S, leading to the band bending of both semiconductors, as it is shown in Figure 14b,c.
After the band bending, the electronic transfer mechanism between CdS and Ag2S can be produced in two different ways, forming a p-n heterojunction or a direct Z-scheme (Figure 14b,c). In the p-n heterojunction, the conduction band of Ag2S is located at higher potential respect to that of CdS, so it favors the flow of electrons from Ag2S to CdS, and on the contrary, the holes moves from the valence band of CdS to the valence band of Ag2S [80]. In this case, the quantum dots contributed to both improve the light absorption and to enhance the surface amplitude of electrons and holes facilitating their interfacial reactions. However, this p-n scheme showed two main disadvantages that should be take into account. On one hand, and according to the work of Di et al. [81], from the kinetic point of view the electrostatic repulsions in the conduction band could avoid the electron transfer to produce hydrogen, and thus, the hole transfer between the valence bands was also limited. While, on the other hand, the effectiveness of the p-n heterojunction also resides in the redox ability to carry out the desired oxidation/reduction reactions. In this sense, the Figure 14a shows that the oxidation of SO32− in the valence band of Ag2S is not possible due to the redox potential. According to the equilibrium reactions of the sacrificial reagents (see supplementary information, Figure S9) this fact can negatively affect the photoactivity due to the mismatch of the equilibrium balances of S2− and SO32− species, which could lead to an increase in disulphide species (S22−) that acts as an optical filter and therefore worsen the capacity to absorb light [82].
In the charge transfer route of a direct Z-scheme (Figure 14c), the electrons of the n-type semiconductor (CdS) together with the electrons injected by the quantum dots are directly recombined with the holes of the p-type semiconductor (Ag2S). Therefore, the most reductant electrons remain in Ag2S to produce hydrogen, and the most oxidant holes in the CdS oxidize the S2−/SO32− species. In this structure it is allowed a better spatial separation of the charge carriers together with the adequate location of the valence band and conduction band to carry out the oxidation/reduction processes. Based on this, it seems that in this scheme, the junction between CdS and Ag2S allows a better management of the energy carriers, and therefore it can be justified the improvement of the hydrogen production in the AgCdS-T sample.

5. Conclusions

In this work we studied the influence of the sulphur precursor used in the synthesis of Ag modified CdS photocatalysts over the morphology, particle size, crystallinity and silver incorporation into the CdS lattice. The physicochemical characterization of the CdS-X and AgCdS-X photocatalysts has revealed the strong impact of the different sulphur sources on the mechanism of synthesis and structuration of the AgCdS samples. The slow generation of sulphide anions from the elemental sulphur, favours the insertion of silver into the lattice of the initial CdS nuclei, modifying its electronic structure, and the growth of nanobars with a high aspect ratio. L-cysteine also shows a relatively slow release rate of sulphide ions, allowing the silver insertion into the CdS lattice and decreasing the band gap value. In this case globular-like structures were obtained due to steric impediments promoted by the surface L-cysteine molecules that act as capping agent. The use of thiourea as sulphur source produces high concentration of sulphide anions after its hydrolysis that produces the precipitation of silver in the form of Ag2S in close contact with a poorly crystallized CdS with existence of small crystalline domains with quantum confinement. This ternary combination CdS+Ag2S+QD improves the absorption of light, enhances the presence of electrons and holes at surface level and facilitates the interfacial reactions on the photocatalyst surface.

Supplementary Materials

The following are available online at https://0-www-mdpi-com.brum.beds.ac.uk/2673-4141/1/1/5/s1, Figure S1: Representative example of the peak broadening deconvolution analysis of the XRD profiles (AgCdS-T sample). Figure S2: Experimental setup used for the photocatalytic activity measurements. Figure S3: Irradiance spectra of the Xe arc lamp (150W, ozone Free, LOT Oriel GmbH & CO KG) measured with spectroradiometer (ILT550 LOT Oriel GmbH & Co. KG) at a focal distance equal to 26.5 cm. Figure S4: Representative chromatrogram (AgCdS-S sample) obtained in the GC Varian STAR CX3400 to quantify the produced H2 (peak at retention time 2.55 min). Figure S5: H2 calibration curve for the quantification of the hydrogen produced from the chromatographic areas and experimental fitting of the results obtained in the CdS-X and AgCdS-X samples. Figure S6: Williamsom-Hall plot linear fit for the CdS-X and AgCdS-X photocatalysts prepared with different sulphur source: (a) Elemental sulfur, (b) L-cysteine and (c) Thiourea. Figure S7: HR-TEM images of the FFT analysis for the determination of the crystalline planes of the (a) AgCdS-S for the region FFT I (b) and FFT II (c). Figure S8: Urbach tails linear fit of CdS-X and AgCdS-X photocatalysts prepared with different sulphur sources: (a) Elemental sulfur (b) L-cysteine and (d) thiourea. Figure S9: Sacrificial reagents equilibrium reactions [5]. Table S1: Standard deviation of the concentration (umr.) of Cd, S and Ag determined by TXRF for all the CdS-X and AgCdS-X samples. Table S2: Complex stability constants extracted from reference [4]. Table S3: Electronegativity of Cd, Ag and S calculated from EIE and EA, extracted from reference.

Author Contributions

Conceptualization, R.M.N.Y. and J.L.G.F.; formal analysis, R.M.N.Y.; investigation, N.M.T. and J.L.G.F.; methodology, R.M.N.Y., E.S.M. and N.M.T.; writing—original draft, R.M.N.Y. and E.S.M.; Writing—review and editing, R.M.N.Y. and E.S.M. All authors have read and agreed to the published version of the manuscript.

Funding

The present work was performed within the research program supported by MINECO (Spain) under the projects CTQ2016-76505-C3-1-R and PID2019-1112119RB-100 and CAM within the BIOTRES-CM (S2018/EMT-4344) project. E. Soto would like to acknowledge MINECO for the FPI research grant.

Conflicts of Interest

The authors declare no conflict of interest.

References

  1. International Energy Agency (IEA). Available online: https://www.iea.org/topics/system-integration-of-renewables (accessed on 18 December 2020).
  2. Nikolaidis, P.; Poullikkas, A. A comparative overview of hydrogen production processes. Renew. Sustain. Energy Rev. 2017, 67, 597–611. [Google Scholar] [CrossRef]
  3. Kohtari, R.; Buddhi, D.; Sawhney, R. Comparison of environmental and economic aspects of various hydrogen production methods. Renew. Sustain. Energy Rev. 2008, 12, 553–563. [Google Scholar] [CrossRef]
  4. Dincer, I.; Acar, C. Review and evaluation of hydrogen production methods for better sustainability. Int. J. Hydrogen Energy 2015, 34, 11094–11111. [Google Scholar] [CrossRef]
  5. Hosseini, S.E.; Wahid, M.A. Hydrogen production from renewable and sustainable energy resources: Promising green energy carrier for clean development. Renew. Sustain. Energy Rev. 2016, 57, 850–866. [Google Scholar] [CrossRef]
  6. Chen, X.; Shen, S.; Guo, L.; Mao, S.S. Semiconductor-based photocatalytic hydrogen generation. Chem. Rev. 2010, 110, 6503–6570. [Google Scholar] [CrossRef]
  7. Osterloh, F.E. Inorganic Materials as Catalysts for Photochemical Splitting of Water. Chem. Mater. 2008, 20, 35–54. [Google Scholar] [CrossRef]
  8. Cheng, L.; Xiang, Q.; Liao, Y.; Zhang, H. CdS-based photocatalysts. Energy Environ. Sci. 2018, 11, 1362–1391. [Google Scholar] [CrossRef]
  9. Yuan, Y.-J.; Chen, D. Cadmium sulphide-based nanomaterilas for photocatalytic hydrogen production. J. Mater. Chem. A 2018, 6, 11606. [Google Scholar] [CrossRef]
  10. Liu, Y.; Ma, Y.; Liu, W.; Shang, Y.; Zhu, A.; Tan, P.; Xiong, X.; Pan, J. Facet and morphology dependent photocatalytic hydrogen evolution with CdS nanoflowers using a novel mixed solvothermal strategy. J. Colloid Interface Sci. 2018, 513, 222–230. [Google Scholar] [CrossRef]
  11. Yu, J.; Yu, Y.; Cheng, B. Enhanced visible-light photocatalytic H2-production performance of multi-armed CdS nanorods. Rsc Adv. 2012, 2, 11829–11835. [Google Scholar] [CrossRef]
  12. Navarro, R.M.; del Valle, F.; de la Mano, J.V.; Álvarez-Galván, M.C.; Fierro, J.L.G. Photocatalytic water splitting under visible light: Concept and catalysis development. Adv. Chem. Eng. 2009, 36, 111–143. [Google Scholar]
  13. Zhai, T.; Fang, X.; Li, L.; Bando, Y.; Goldberg, D. One-dimensional CdS nanostructures: Synthesis, properties, and applications. Nanoscale 2010, 2, 168. [Google Scholar] [CrossRef] [PubMed]
  14. Fu, Y. Morphology and Size-Controlled Fabrication of CdS from Flower-Like to Spherical Structures and their Application for High-Performance Photoactivity. Eur. J. Inorg. Chem. 2019, 2019, 2086–2092. [Google Scholar] [CrossRef] [Green Version]
  15. Yao, W.-T.; Yu, S.-H.; Liu, S.-J.; Chen, J.-P.; Liu, X.-M.; Li, F.-Q. Architectural Control Syntheses of CdS and CdSe Nanoflowers, Branched Nanowires, and Nanotrees via a Solvothermal Approach in a Mixed Solution and Their Photocatalytic Property. J. Phys. Chem. B 2006, 110, 11704–11710. [Google Scholar] [CrossRef] [PubMed]
  16. Xiang, Q.; Yu, J.; Jaroniec, M. Graphene-based semiconductor photocatalysts. Chem. Soc. Rev. 2012, 41, 782–796. [Google Scholar] [CrossRef] [PubMed]
  17. Zhang, N.; Yang, M.-Q.; Tang, Z.-R.; Xu, Y.-J. CdS-graphene nanocomposites as visible light photocatalyst for redox reactions in water: A green route for selective transformation and environmental remediation. J. Catlaysis 2013, 303, 60–69. [Google Scholar] [CrossRef]
  18. Murillo Leo, I.; Soto, E.; Vaquero, F.; Mota, N.; Navarro, R.M.; Fierro, J.L.G. Influence of the reduction of graphene oxide (rGO) on the structure and photoactivity of CdS-rGO hybrid systems. Int. J. Hydrogen Energy 2017, 42, 13691–13703. [Google Scholar] [CrossRef]
  19. Murillo Leo, I.; Soto, E.; Vaquero, F.; Mota, N.; Garcia, B.; Liuzzi, D.; Guil-López, R.; Navarro, R.M.; Fierro, J.L.G. Influence of the Reduction of Graphene Oxide with Hydroiodic Acid on the Structure and Photoactivity of CdS–rGO Hybrids. Top. Catal. 2017, 60, 1183–1195. [Google Scholar]
  20. Huang, H.-B.; Fang, Z.-B.; Yu, K.; Lu, J.; Cao, R. Visible light driven photocatalytic H2 evolution over CdZnS nanocrystal solid solutions: Interplay of twin structures, sulphur vacancies and sacrificial agents. J. Mater. Chem. A 2020, 8, 3882. [Google Scholar] [CrossRef]
  21. Li, H.; Wang, Z.; He, Y.; Meng, S.; Xu, Y.; Chen, S.; Fu, X. Rational synthesis of MnxCd1-xS for enhanced photocatalytic H2 evolution: Effects of S precursors and the feed ratio of Mn/Cd on its structure and performance. J. Colloid Interface Sci. 2019, 535, 469–480. [Google Scholar]
  22. Suo, Z.; Daia, J.; Gao, S.; Gao, H. Effect of transition metals (Sc, Ti, V, Cr and Mn) doping on electronic structure and optical properties of CdS. Results Phys. 2020, 17, 103058. [Google Scholar] [CrossRef]
  23. Cebada, S.; Soto, E.; Mota, N.; García Fierro, J.L.; Navarro, R.M. Effect of photodeposition conditions on NiCdSphotocatalysts and its role in the photoactivity for H2 production from ethanolic solutions. Int. J. Hydrogen Energy 2020, in press. [Google Scholar] [CrossRef]
  24. Yan, H.; Yang, J.; Ma, G.; Wu, G.; Zong, X.; Lei, Z.; Shi, J.; Li, C. Visible-light-driven hydrogen production with extremely high quantum efficiency on Pt–PdS/CdS photocatalyst. J. Catal. 2009, 266, 165–168. [Google Scholar] [CrossRef]
  25. Mo, D.; Liu, J.; Yao, H.J.; Duan, J.L.; Hou, M.D.; Sun, Y.M.; Chen, Y.F.; Xue, Z.H.; Zhang, L. Preparation and characterization of CdS nanotubes and nanowires by electrochemical synthesis in ion track templates. J. Cryst. Growth 2008, 310, 612–616. [Google Scholar] [CrossRef]
  26. Dongre, J.K.; Nogriya, V.; Ramrakhiani, M. Structural, optical and photoelectrochemical characterization of CdS nanowire synthesized by chemical bath deposition and wet chemical etching. Appl. Surf. Sci. 2009, 255, 6115–6120. [Google Scholar] [CrossRef]
  27. Ouyang, L.; Maher, K.N.; Yu, C.L.; McCarty, J.; Park, H. Catalyst-Assisted Solution-Liquid-Solid Synthesis ofCdS/CdSe Nanorod Heterostructures. J. Am. Chem. Soc. 2007, 129, 133–138. [Google Scholar]
  28. Gao, T.; Wang, T. Catalyst-Assisted Vapor-Liquid-Solid Growth of Single-Crystal CdS Nanobelts and Their Luminescence Properties. J. Phys. Chem. B 2004, 108, 20045–20049. [Google Scholar] [CrossRef]
  29. Demazeau, G.; Largeteau, A. Hydrothermal/Solvothermal Crystal Growth: An Old but Adaptable Process. Z. Anorg. Allg. Chem. 2015, 641, 159–163. [Google Scholar] [CrossRef]
  30. Kamble, G.S.; Ling, Y.-L. Solvothermal synthesis of facet-dependent BiVO4 photocatalyst with enhanced visible-light-driven photocatalytic degradation of organic pollutant: Assessment of toxicity by zebrafish embryo. Sci. Rep. 2020, 10, 12993. [Google Scholar] [CrossRef]
  31. Sun, W.; Fu, Z.; Shi, H.; Jin, C.; Liu, E.; Zhang, X.; Fan, J. Cu3P and Ni2P co-modified g-C3N4 nanosheet with excellent photocatalytic H2 evolution activities. J. Chem. Technol. Biotechnol. 2020, 95, 3117–3125. [Google Scholar] [CrossRef]
  32. Zhang, B.; Shi, H.; Yan, Y.; Liu, C.; Hu, X.; Liu, E.; Fan, J. A novel S-scheme 1D/2D Bi2S3/g-C3N4 heterojunctions with enhanced H2 evolution activity. Colloids Surf. A 2021, 608, 125598. [Google Scholar] [CrossRef]
  33. Ye, C.; Wang, R.; Wang, H.; Jiang, F. The high photocatalytic efficiency and stability of LaNiO3/g-C3N4 heterojunction nanocomposites for photocatalytic water splitting to hydrogen. Chang. BMC Chem. 2020, 14, 65. [Google Scholar] [CrossRef] [PubMed]
  34. Jang, J.S.; Joshi, U.A.; Lee, J.S. Solvothermal Synthesis of CdS Nanowires for Photocatalytic Hydrogen and Electricity Production. J. Phys. Chem. C 2007, 111, 13280–13287. [Google Scholar] [CrossRef]
  35. Mahdi, M.A.; Hassan, J.J.; Ng, S.S.; Hassan, Z. Growth of CdS nanosheets and nanowires through the solvothermal method. J. Cryst. Growth 2012, 359, 43–48. [Google Scholar] [CrossRef]
  36. Vaquero, F.; Navarro, R.M.; Fierro, J.L.G. Evolution of the nanostructure of CdS using solvothermal synthesis at different temperature and its influence on the photoactivity for hydrogen production. Int. J. Hydrogen Energy 2016, 41, 11558–11567. [Google Scholar]
  37. Soto, E.; Vaquero, F.; Mota, N.; Navarro, R.M.; Fierro, J.L.G. CdS Photocatalysts Modified with Ag: Effect of the Solvothermal Temperature on the Structure and Photoactivity for Hydrogen Production. Catalysts 2019, 9, 110. [Google Scholar] [CrossRef] [Green Version]
  38. Vaquero, F.; Fierro, J.L.G.; Navarro Yerga, R.M. From Nanorods to Nanowires of CdS Synthesized by a Solvothermal Method: Influence of the Morphology on the Photoactivity for Hydrogen Evolution from Water. Molecules 2016, 21, 401. [Google Scholar] [CrossRef] [Green Version]
  39. Vaquero, F.; Navarro, R.M.; Fierro, J.L.G. Influence of the solvent on the structure, morphology and performance for H2 evolution of CdS photocatalysts prepared by solvothermal method. Appl. Catal. B Environ. 2017, 203, 753–767. [Google Scholar] [CrossRef]
  40. Li, H.; Liu, L.; Wang, Z.; Zheng, X.; Meng, S.; Chen, S.; Fu, X. Optimizing the precursor of sulphur source for hydrothermal synthesis of high performance CdS for photocatalytic hydrogen production. Rsc Adv. 2018, 8, 11489–11497. [Google Scholar]
  41. Gaur, R.; Jeevanandam, P. Effect of anions on the morphology of CdS nanoparticles prepared via thermal decomposition of different Cadmium Thiourea complexes in a solvent and in the solid state. New J. Chem. 2015, 39, 9442–9453. [Google Scholar] [CrossRef]
  42. Maseko, N.N.; Revaprasadu, N.; Rajasekhar Pullabhotla, V.S.R.; Karthik, R.; O’Brien, P. The influence of the cadmium source on the shape of CdSe nanoparticles. Mater. Lett. 2010, 64, 1037–1040. [Google Scholar] [CrossRef]
  43. Li, F.; Bi, W.; Kong, T.; Wang, C.; Li, Z.; Huang, X. Effect of sulphur sources on the crystal structure, morphology and luminescence of CdS nanocrystals prepared by a solvothermal method. J. Alloy. Compd. 2009, 479, 707–710. [Google Scholar] [CrossRef]
  44. Soto, E.; Vaquero, F.; Mota, N.; Fateixa, S.; Trindade, T.; Navarro, R.M.; Fierro, J.L.G. Structure and photoactivity for hydrogen production of CdS nanorods modified with In, Ga, Ag-In and Ag-Ga and prepared by solvothermal method. Mater. Today Energy 2018, 9, 345–358. [Google Scholar] [CrossRef]
  45. Hosseini, M.; Abdolhosseini Sarsari, I.; Kameli, P.; Salamati, H. Effect of Ag doping on structural, optical, and photocatalytic properties of ZnO nanoparticles. J. Alloy. Compd. 2015, 640, 408–415. [Google Scholar] [CrossRef] [Green Version]
  46. Sobana, N.; Muruganadham, M.; Swaminathan, M. Nano-Ag particles doped TiO2 for efficient photodegradation of direct azo dyes. J. Mol. Catal. A Chem. 2006, 258, 124–132. [Google Scholar] [CrossRef]
  47. Iqbal, T.; Ara, G.; Khalid, N.R.; Ijaz, M. Simple synthesis of Ag-doped CdS nanostructure material with excellent properties. Appl. Nanosci. 2020, 10, 23–28. [Google Scholar] [CrossRef]
  48. Morgan, D.; Kelley, D.F. Role of Surface States in Silver-Doped CdSe and CdSe/CdS Quantum Dots. J. Phys. Chem. C 2018, 122, 10627–10636. [Google Scholar] [CrossRef]
  49. Jian, W.; Zhuang, J.; Zhang, D.; Dai, J.; Yang, W.; Bai, Y. Synthesis of highly luminescent and photostable ZnS:Ag nanocrystals under microwave irradiation. Mater. Chem. Phys. 2006, 99, 494–497. [Google Scholar] [CrossRef]
  50. Dalvand, P.; Mohammadi, M.R. Controlling morphology and structure of nanocrystalline cadmium sulphide (CdS) by tailoring solvothermal processing parameters. J. Nanoparticle Res. 2011, 13, 3011–3018. [Google Scholar]
  51. Phuruangrat, A.; Thongtem, T.; Thongtem, S. Effect of Cd and S sources on the morphologies of CdS synthesized by solvothermal reactions in mixed solvents. Curr. Appl. Phys. 2009, 9, S201–S204. [Google Scholar] [CrossRef]
  52. Xiong, S.; Xi, B.; Wang, C.; Zou, G.; Fei, L.; Wang, W.; Qian, Y. Shape-controlled synthesis of 3D and 1D structures of CdS in a binary solution with L-cysteine’s assistance. Chemistry 2007, 13, 3076–3081. [Google Scholar] [CrossRef] [PubMed]
  53. Fernández-Ruiz, R.; Cabañero, J.P.; Hernandez, E.; León, M. Determination of the stoichiometry of the CuxInySez by Total-reflection XRF. Analyst 2001, 126, 1797–1799. [Google Scholar] [CrossRef]
  54. Ma, X.; Xu, F.; Liu, Y.; Liu, X.; Zhang, Z.; Qian, Y. Double-dentate solvent-directed growth of multi-armed CdS nanorod-based semiconductors. Mater. Res. Bull. 2005, 40, 2180–2188. [Google Scholar] [CrossRef]
  55. Huang, S.; Lin, Y.; Yang, J.; Li, X.; Zhang, J.; Yu, J.; Shi, H.; Wang, W.; Yu, Y. Enhanced photocatalytic activity and stability of semiconductor by Ag doping and simultaneous deposition: The case of CdS. RSC Adv. 2013, 3, 20782. [Google Scholar] [CrossRef]
  56. Dey, P.C.; Das, R. Effect of silver doping on the elastic properties of CdS nanoparticles. Indian J. Phys. 2018, 92, 1099–1108. [Google Scholar] [CrossRef]
  57. Chowdhury, P.S.; Ghosh, P.; Patra, A. Study of photophysical properties of capped CdS nanocrystals. J. Lumin. 2007, 124, 327–332. [Google Scholar] [CrossRef]
  58. Thakur, P.; Joshia, S.S.; Patilb, K.R. Investigations of CdS and Ag–CdS nanoparticles by X-Ray photoelectron spectroscopy. Appl. Surf. Sci. 2010, 257, 1390–1394. [Google Scholar]
  59. Wagner, C.D.; Naumkin, A.V.; Kraut-Vass, A.; Allison, J.W.; Powell, C.J.; Rumble, J.R., Jr. NIST Standard Reference Database 20, Version 3.4 (Web Version) 2003. Available online: http:/srdata.nist.gov/xps/ (accessed on 18 December 2020).
  60. Kaushik, V.K. XPS core level spectra and Auger parameters for some silver compounds. J. Electron Spectrosc. Relat. Phenom. 1991, 56, 273–277. [Google Scholar] [CrossRef]
  61. Wu, P.J.; Yu, J.W.; Chao, H.J.; Chang, J.Y. Silver-based metal sulphide heterostructures: Synthetic approaches, characterization and application prospects. Chem. Mater. 2014, 26, 3485–3494. [Google Scholar] [CrossRef]
  62. Zhu, G.; Xu, Z. Controllable growth of semiconductor heterostructures mediated by bifunctional Ag2S nanocrystals as catalyst or source-host. J. Am. Chem. Soc. 2011, 133, 148–157. [Google Scholar] [CrossRef]
  63. Lozada-Morales, R.; Zelaya-Angel, O.; Torres-Delgado, G. On the yellow-band emission in CdS film. Appl. Phys. A 2001, 73, 61–65. [Google Scholar] [CrossRef]
  64. Tiwari, A.; Dhoble, S.J.; Kher, R.S. Influence of thiol capping on the photoluminescence properties of L-cysteine-, mercaptoethanol- and mercaptopropionic acid-capped ZnS nanopoarticles. Luminescence 2015, 30, 1148–1152. [Google Scholar] [CrossRef]
  65. Boonmee, C.; Noipa, T.; Tuntulani, T.; Ngeontae, W. Cysteamine capped CdS quantum dots as a fluorescence sensor for the determination of copper ion exploiting fluorescence enhancement and long-wave spectral shifts. Spectrochim. Acta A: Mol. Biomol. Spectrosc. 2016, 169, 161–168. [Google Scholar] [CrossRef]
  66. Ramsden, J.J.; Gratzel, M. Photoluminescence of small cadmium sulphide particles. J. Chem. Soc. Faraday Trans. 1984, 80, 919–933. [Google Scholar] [CrossRef]
  67. Dean, J.A. Lange’s Handbook of Chemistry, 5th ed.; McGraw-Hill: New York, NY, USA, 1992; ISBN 0-07-016384-7. [Google Scholar]
  68. Alekseev, V.G.; Semenov, A.N.; Pakhomov, P.M. Complexation of Ag+ ions with L-cysteine. Russ. J. Inorg. Chem. 2012, 57, 1041–1044. [Google Scholar] [CrossRef]
  69. Ramani, S.; Raspor, B.; Arbneshi, T. Electrochemical study of Cadmium (II) complexation with Cysteine. Am. J. Anal. Chem. 2013, 4, 577–583. [Google Scholar] [CrossRef] [Green Version]
  70. Chen, M.; Xie, Y.; Chen, H.; Qiao, Z.; Qian, Y. Preparation and characterization ofmetal sulphides in ethylenediamine under ambient conditions through a gamma irradiation route. J. Colloid Interface Sci. 2001, 237, 47–53. [Google Scholar] [CrossRef]
  71. Nie, Q.-L.; Xu, Z.-D.; Yuan, Q.-L.; Li, G.-H. Chemical control synthesis of CdS nanorods with different diameter. Mater. Chem. Phys. 2003, 82, 808–811. [Google Scholar] [CrossRef]
  72. Lee Penn, R. Kinetics of oriented aggregation. J. Phys. Chem. B 2004, 108, 12707–12712. [Google Scholar]
  73. Bao, C.; Zhu, G.; Yang, J.; Liu, M.; Zhang, R.; She, X. Small molecular amine mediated synthesis of hydrophilic CdS nanorods and their photoelectrochemical water splitting performance. Dalton Trans. 2015, 44, 1465. [Google Scholar] [CrossRef]
  74. Hernández-Gordillo, A.; Oros-Ruiz, S.; Gómez, R. Preparation of efficient cadmium sulfide nanofibers for hydrogen production using ethylenediamine (NH2CH2CH2NH2) as template. J. Colloid Interface Sci. 2015, 451, 40–45. [Google Scholar] [CrossRef] [PubMed]
  75. Kumar, S.; Singh, A.P.; Yadav, N.; Thirumal, M.; Mehta, B.R.; Ganguli, A.K. Fabrication of TiO2/CdS/Ag2S Nano-Heterostructured Photoanode for Enhancing Photoelectrochemical and Photocatalytic Activity under Visible Light. Chem. Sel. 2016, 1, 4891–4900. [Google Scholar] [CrossRef]
  76. Habibi-Yangjeh, A.; Shekofteh-Gohari, M. Novel magnetic Fe3O4/ZnO/NiWO4 nanocomposites: Enhanced visible-light photocatalytic performance through p-n heterojunctions. Sep. Purif. Technol. 2017, 184, 334–346. [Google Scholar] [CrossRef]
  77. Lide, D.R. Handbook of Chemistry and Physics, 84th ed.; CRC Press: Boca Raton, FL, USA, 2003. [Google Scholar]
  78. Nethercot, A.H., Jr. Prediction of Fermi Energies and Photoelectric Thresholds Based on Electronegativity Concepts. Phys. Rev. Lett. 1974, 33, 1088. [Google Scholar] [CrossRef]
  79. Xu, Y.; Schoonen, M.A.A. The absolute energy positions of conduction and valence bands of selected semiconducting minerals. Am. Mineral. 2000, 85, 543–556. [Google Scholar] [CrossRef]
  80. Shen, S.; Guo, L.; Chen, X.; Ren, F.; Mao, S.S. Effect of Ag2S on solar-driven photocatalytic hydrogen evolution of nanostructured CdS. Int. J. Hydrogen Energy 2010, 35, 7110–7115. [Google Scholar] [CrossRef]
  81. Di, T.M.; Xu, Q.L.; Ho, W.K.; Tang, H.; Xiang, Q.J.; Yu, J.G. Review on Metal Sulphide-based Z-scheme Photocatalysts. ChemCatChem 2019, 11, 1394–1411. [Google Scholar] [CrossRef]
  82. Reber, J.F.; Meier, K. Photochemical production of hydrogen with zinc sulfide suspensions. J. Phys. Chem. 1984, 88, 5903–5913. [Google Scholar] [CrossRef]
Figure 1. N2 adsorption/desorption isotherms (a,b) and pore size distribution (c,d) obtained for CdS-X and Ag-CdSX photocatalysts: X = S (grey), X = L (blue) and X = T (red).
Hydrogen 01 00005 g001
Figure 2. XRD profiles of the CdS-X (a) and AgCdS-X (b) photocatalysts (* Ag2S monoclinic phase).
Hydrogen 01 00005 g002
Figure 3. Relative shift of the (002) diffraction peaks of the hexagonal phase of CdS; (a) CdS-S/AgCdS-S, (b) CdS-S/AgCdS-L and (c) CdS-L/AgCdS-T photocatalysts.
Hydrogen 01 00005 g003
Figure 4. Scanning Electron Microscopy images of the CdS-X and AgCdS-X photocatalysts: (a) CdS-S, (b) AgCdS-S, (c) CdS-L, (d) AgCdS-L, (e) CdS-T and (f) AgCdS-T.
Hydrogen 01 00005 g004
Figure 5. XPS spectra of the Cd 3d (a), S 2p (b) and Ag 3d (c) core levels of the AgCdS-X photocatalysts.
Hydrogen 01 00005 g005
Figure 6. TEM and HR-TEM images corresponding to the CdS-X and AgCdS-X photocatalysts prepared with elemental sulphur ((a): CdS, (d): AgCdS), L-cysteine ((b): CdS, (e): AgCdS) and thiourea ((c): CdS, (f): AgCdS).
Hydrogen 01 00005 g006
Figure 7. UV-Vis spectra for the CdS-X (a) and AgCdS-X (b) photocatalysts.
Hydrogen 01 00005 g007
Figure 8. PL spectra of: (a) CdS-S, (b) AgCdS-S, (c) CdS-L, (d) AgCdS-L, (e) CdS-T and (f) AgCdS-T photocatalysts.
Hydrogen 01 00005 g008
Figure 9. Hydrogen production (µmol) on the CdS-X and AgCdS-X photocatalysts.
Hydrogen 01 00005 g009
Figure 10. Comparison between photoactivity and surface area for the CdS-X (a) and AgCdS-X (b).
Hydrogen 01 00005 g010
Figure 11. Comparison between photoactivity (columns) and band gap energy (circles) of the CdS-X and AgCdS-X photocatalysts.
Hydrogen 01 00005 g011
Figure 12. Comparison between photoactivity (columns) and crystallite size –Dp- (circles) of the CdS-X (grey) and AgCdS-X (black) photocatalysts.
Hydrogen 01 00005 g012
Figure 13. Dispersion of the active sites for the AgCdS-S (a), AgCdS-L (b) and AgCdS-T (c) samples.
Hydrogen 01 00005 g013
Figure 14. Schematic band diagram of the Ag2S and CdS before contact (a) the p-n heterojunction in AgCdS-T (b) and a direct Z-Scheme (c) after band bending to align Fermi level.
Hydrogen 01 00005 g014
Table 1. Nomenclature of CdS-X and AgCdS-X photocatalysts prepared by solvothermal methodology.
Sulphur SourceCdS-X SeriesAgCdS-X Series
Elemental sulphur (S)CdS-SAgCdS-S
L-cysteine (L)CdS-LAgCdS-L
Thiourea (T)CdS-TAgCdS-T
Table 2. Chemical surface composition (atomic %) and textural properties of CdS-X and AgCdS-X photocatalysts determined from TXRF and N2 adsorption/desorption isotherms.
Atomic %Atomic RatioBET Surface AreaAverage Pore Size
CdSAgCd/SAg/Sm2/gnm
CdS-S47.952.1-0.92-42.856.4
AgCdS-S47.851.80.40.920.00817.756.3
CdS-L49.750.3-0.99-115.713.4
AgCdS-L47.551.70.80.920.01575.713.6
CdS-T47.952.1-0.92-73.741.3
AgCdS-T46.050.53.50.910.06982.441.3
Table 3. Crystallite size (Dp, perpendicular to (002) plane), relative intensity of main diffraction peaks and lattice strain of the CdS hexagonal phase in CdS-X and AgCdS-X photocatalysts.
Dp (nm)Relative IntensityLattice Strain
002I100/I002I101/I002ε × (10−3)
CdS-S630.380.56−1.6
AgCdS-S>1000.721.05−0.6
CdS-L160.550.81−5.4
AgCdS-L300.680.94−1.8
CdS-T170.300.41−4.7
AgCdS-T220.590.87-
Table 4. XPS binding energies (eV) of core levels and atomic surface composition of AgCdS-X photocatalysts calculated from XPS analysis.
Binding Energy (eV)Atomic Percentages (%)Atomic Ratios
Cd 3d 5/2S 2pAg 3d 5/2CdSAgCd/S(Cd+Ag)/S
AgCdS-S404.9403.3161.2367.253.845.60.61.181.19
AgCdS-L404.6161.2367.852.247.30.51.101.11
AgCdS-T404.6161.2367.255.044.40.71.241.25
Table 5. Average length, width and aspect ratio of the nanostructures present in the CdS-X and AgCdS-X photocatalysts measured from TEM.
Average Length (nm)Average Width (nm)Aspect Ratio
CdS-S91204.5
AgCdS-S178434.1
CdS-L2363.8
AgCdS-L216.43.3
Table 6. Band gap (eV) and Urbach energy (meV) of CdS-X and AgCdS-X photocatalysts calculated from UV-Vis spectra.
Band Gap (eV)Eu (meV)
CdS-S2.4638.6
AgCdS-S2.4464.9
CdS-L2.5444.6
AgCdS-L2.4982.2
CdS-T2.5454.9
AgCdS-T2.56108.5
Table 7. Calculation of the ECB, EVB of CdS and Ag2S.
BG (eV)Χ (eV)ECB (eV)EVB (eV)
CdS2.565.2881−0.49192.0681
Ag2S1.04.9669−0.03310.9669
Publisher’s Note: MDPI stays neutral with regard to jurisdictional claims in published maps and institutional affiliations.

