Article

Removal of Iron, Manganese, Cadmium, and Nickel Ions Using Brewers’ Spent Grain

1
Leibniz-Institut für Polymerforschung Dresden e.V., Hohe Str. 6, 01069 Dresden, Germany
2
Chair of Food Chemistry and Molecular Sensory Science, Water Systems Engineering, TUM School of Life Sciences, Technical University of Munich, Maximus-von-Imhof-Forum 2, 85354 Freising, Germany
*
Author to whom correspondence should be addressed.
These authors contributed equally to this work.
Submission received: 31 January 2022 / Revised: 13 March 2022 / Accepted: 1 April 2022 / Published: 26 April 2022

Abstract

:
The human-made pollution of surface and ground waters is becoming an inevitable and persistently urgent problem for humankind and life in general, as these pollutants are also distributed by their natural circulation. For example, from mining activities and metallurgy, toxic heavy metals pollute the environment and present material risk for human health and the environment. Bioadsorbers are an intriguing way to efficiently capture and eliminate these hazards, as they are environmentally friendly, cheap, abundant, and efficient. In this study, we present brewers’ spent grain (BSG) as an efficient adsorber for toxic heavy metal ions, based on the examples of iron, manganese, cadmium, and nickel ions. We uncover the adsorption properties of two different BSGs and investigate thoroughly their chemical and physical properties as well as their efficiency as adsorbers for simulated and real surface waters. As a result, we found that the adsorption behavior of BSG types differs despite almost identical chemistry. Elemental mapping reveals that all components of BSG contribute to the adsorption. Further, both types are not only able to purify water to reach acceptable levels of cleanness, but also yield outstanding adsorption performance for iron ions of 0.2 mmol/g and for manganese, cadmium, and nickel ions of 0.1 mmol/g.

1. Introduction

Surface and ground water are an extremely important resource for humans and any kind of living organism as a continuous and finite resource for drinking water and natural habitat. Thus, this water needs to be protected and handled with care. Many surface and ground water sources all over the world are in great danger due to them exceeding limits of anions such as sulfate or heavy metal ions by multiple times [1,2,3]. Mining regions are especially at risk due to their high concentrations of ores and toxic metals but also agriculture and overfertilization can be a cause for environmental pollution [1,3,4]. For example, the presence of iron or manganese impairs organoleptic properties and thus the adequacy of drinking water, long before health concerning levels are reached [5]. To overcome these issues, the development of efficient adsorber materials is inevitable and within those, low-cost regenerative biosorbents are an emerging technology [3,6]. Additionally, by using bio-waste as adsorber material sustainability and circular-economy can be achieved [7]. In comparison to other techniques such as membranes, adsorption on particles is a cost-efficient and a commonly used method to remove pollutants [1,3,6]. To purify the surface water in a safe procedure, bioadsorber materials have promising characteristics to avoid secondary pollution due to the disposal of exhausted adsorbents [8,9]. Besides the warranty of using an environmentally friendly material, the green production of these bioadsorbers is also guaranteed.
Multiple diverse bioadsorbers, such as lignocellulosic/plant materials such as rice husk, nut shells, potato peels, starch and olive stones have already been investigated [10,11,12,13,14,15,16,17]. An extremely efficient adsorber and flocculant for acidic water polluted with FeSO4(aq) is the biopolymer chitosan. Chitosan possesses the potential to adsorb iron and sulfate ions in high quantities due to its amino group [18,19]. However, chitosan is, in comparison to BSG, relatively expensive. Brewers’ spent grain (BSG) is a natural material originating from leached grains left after wort filtration, consequently featuring a high amount of oxygen containing functional groups and negative surface charge making it a potential candidate as an adsorber for toxic heavy metals [9,20,21]. In Germany as well as in many other countries in the world, BSG is a residual product from the brewing process of beer. Due to the large amount of beer production each year, [22] a huge amount of BSG is unused and wasted. Solely in Germany, for example, there are around 1400 breweries with a production volume of 9.5 GL per year yielding in 2 Mt wet BSG [23]. Thus, BSG is a renewable resource and a residual product produced in large quantities, [24,25,26,27,28], making it interesting as a potential natural adsorber for water treatment. Even more, by using residual products, cost reductions and “circular economy” or “cradle-to-cradle” concepts are followed.
In this study, BSGs of two traditional German beers were investigated towards their adsorption properties for FeSO4, NiSO4, CdSO4, and MnSO4. Here, we compare the adsorption properties of two different BSGs, one being Helles a style of pale lager and the other one a wheat beer, containing up to 50% wheat grains instead of barley malts. Hence, we aim to clarify whether BSGs from different sources behave significantly differently and whether all or just one type is able to efficiently purify water from heavy metal contaminations. Further, it will be investigated whether all components of the BSGs contribute to the adsorption process. In closing, we investigate if healthy water qualities can be reached in order to bridge the gap towards industrial application in future studies. Therefore, in the first step, the BSGs were thoroughly cleaned and characterized to find the potential differences between these two materials. Subsequently, batch sorption experiments were performed to determine the adsorption capacities and the adsorption efficiencies towards the four different metal salts. Finally, the adsorption performance in real surface water from a German mining region was investigated for the ions Fe2+/3+, Mn2+ and sulfate and the result was compared to local and international water quality regulations.

2. Materials and Methods

2.1. Materials

2.1.1. Brewers’ Spent Grain

Spent grains were donated by Weihenstephan Brewery, Freising, Germany originating from Hefeweißbier (WB-BSG) and Original Helles (H-BSG). First, 800 g BSG was suspended in 6 L of water for 10 min. Excess water was removed by decanting and mechanically compressing the BSG. The washing procedure was repeated five times. Subsequently, the BSG was dried at 60 °C for 24 h.

2.1.2. Heavy Metal Salts

Iron (II) heptahydrate (FeSO4∙(H2O)7) was obtained from Carl Roth GmbH + CO. KG, Karlsruhe, Germany. Manganese (II) sulfate monohydrate (MnSO4∙H2O) was purchased from Merck KGaA, Darmstadt, Germany. Cadmium (II) sulfate 8/3-hydrate (CdSO4∙8/3H2O) was purchased from Merck KGaA, Darmstadt, Germany. Nickel (II) sulfate hexahydrate (NiSO4∙6H2O) was purchased from Merck KGaA, Darmstadt, Germany.

2.1.3. Ultrapure Water

Ultrapure water (total organic carbon of 5 ppb, resistivity of 18.2 MΩ∙cm at 25 °C) was provided by a Milli-Q-Advantage A10 system from Merck Millipore, Darmstadt, Germany. If not specified otherwise, all solutions were prepared using this water.

2.1.4. pH Adjustment

The pH was adjusted with sodium hydroxide (≥98%, Honeywell, Offenbach, Germany) or sulphuric acid (96%, analytical reagent grade, Fisher Scientific, Loughborough, UK).

2.1.5. Real Water Samples

Water samples were taken from two drainage ditches from a former mining region in Germany. The water was collected in 10 L plastic canisters, transported to the lab; in case of sample one, sieved to remove crude biomass; and stored for analysis.

2.1.6. ICP-OES Standard Solutions and Nitric Acid

For the ICP-OES analyses, the following standard solutions were used: 9999 mg/L S (Sigma-Aldrich, München, Germany), 10,000 mg/Cd in 2 mol/L HNO3 from Bernd Kraft, 10,000 mg/L Fe in 2 mol/L HNO3 from Bernd Kraft, 10,000 mg/L Mn in 2 mol/L HNO3 from Bernd Kraft Duisburg, 10,000 mg/L Ni in 2 mol/L HNO3 from Bernd Kraft Germany and 1000 mg/L multi-element standard solution IV (23 elements in diluted nitric acid) from Sigma Aldrich. Nitric acid (65%, p.a.) was purchased from VWR, Darmstadt, Germany.

2.2. Characterization

2.2.1. pH Measurements

pH measurements were carried out with the device SevenExcellence pH/Ion/C/DO meter S975-K equipped with an InLAb Expert Pro-2m-ISM electrode, both from Mettler Toledo, Gießen, Germany.

2.2.2. Moisture Analysis

Moisture analysis of dry BSG was carried out at 110 °C with the Halogen Moisture Analyzer HX204 from Mettler Toledo, Gießen, Germany.

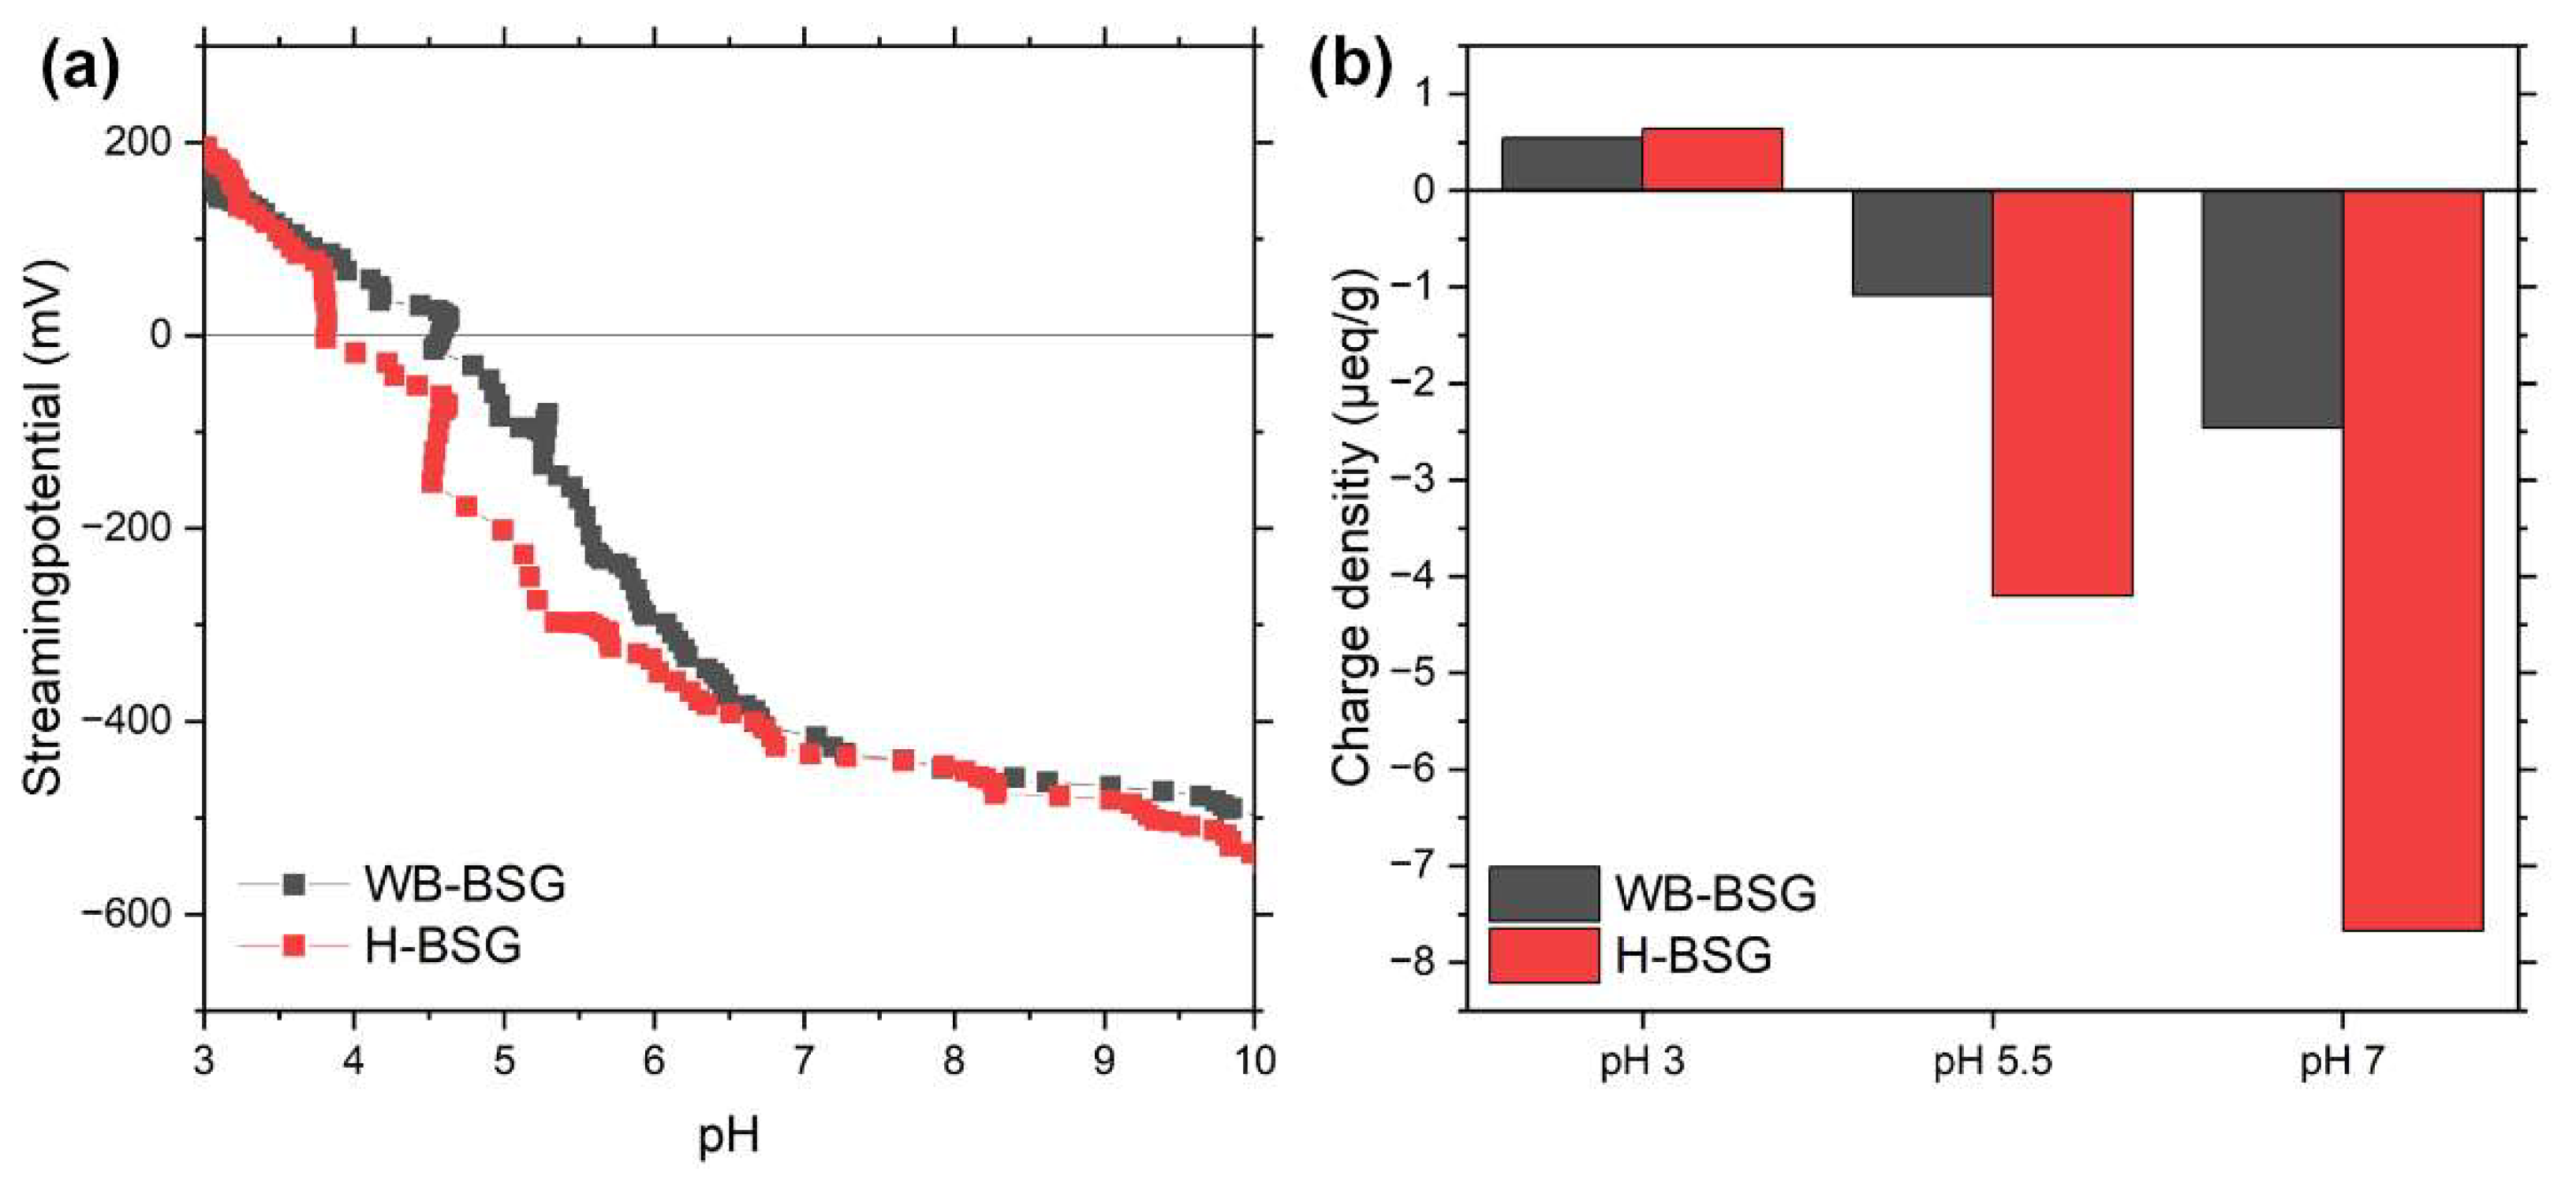
2.2.3. Streaming Potential vs. pH

Streaming potential vs. pH curves were measured from the BSG to determine the surface charge in dependence of the pH. The pH of the sample was adjusted to pH = 3. The titration was carried out to pH = 9 with the particle charge Mütek PCD-04 (BTG Instruments GmbH, Wessling, Germany) with respect to the state of charge. For this purpose, 0.1 g BSG was added to 15 mL of ultrapure water. After 5 min, the measurement was performed.

2.2.4. Charge Density

Charge density measurements were performed with the particle charge detector Mütek PCD-04 from BTG Instruments GmbH, Wessling, Germany. Therefore, 0.1 g BSG was added to 10 mL of ultrapure water. After 5 min, the sample was titrated against a poly(sodium ethylenesulfonate) (PES-Na) solution or poly(diallyldimethylammonium chloride) (PDADMAC) solution each with a concentration of 0.001 M until the point of zero charge was reached. The measurement was taken at the original pH of 5.5 and two adjusted pH values (pH = 3 and pH = 7).

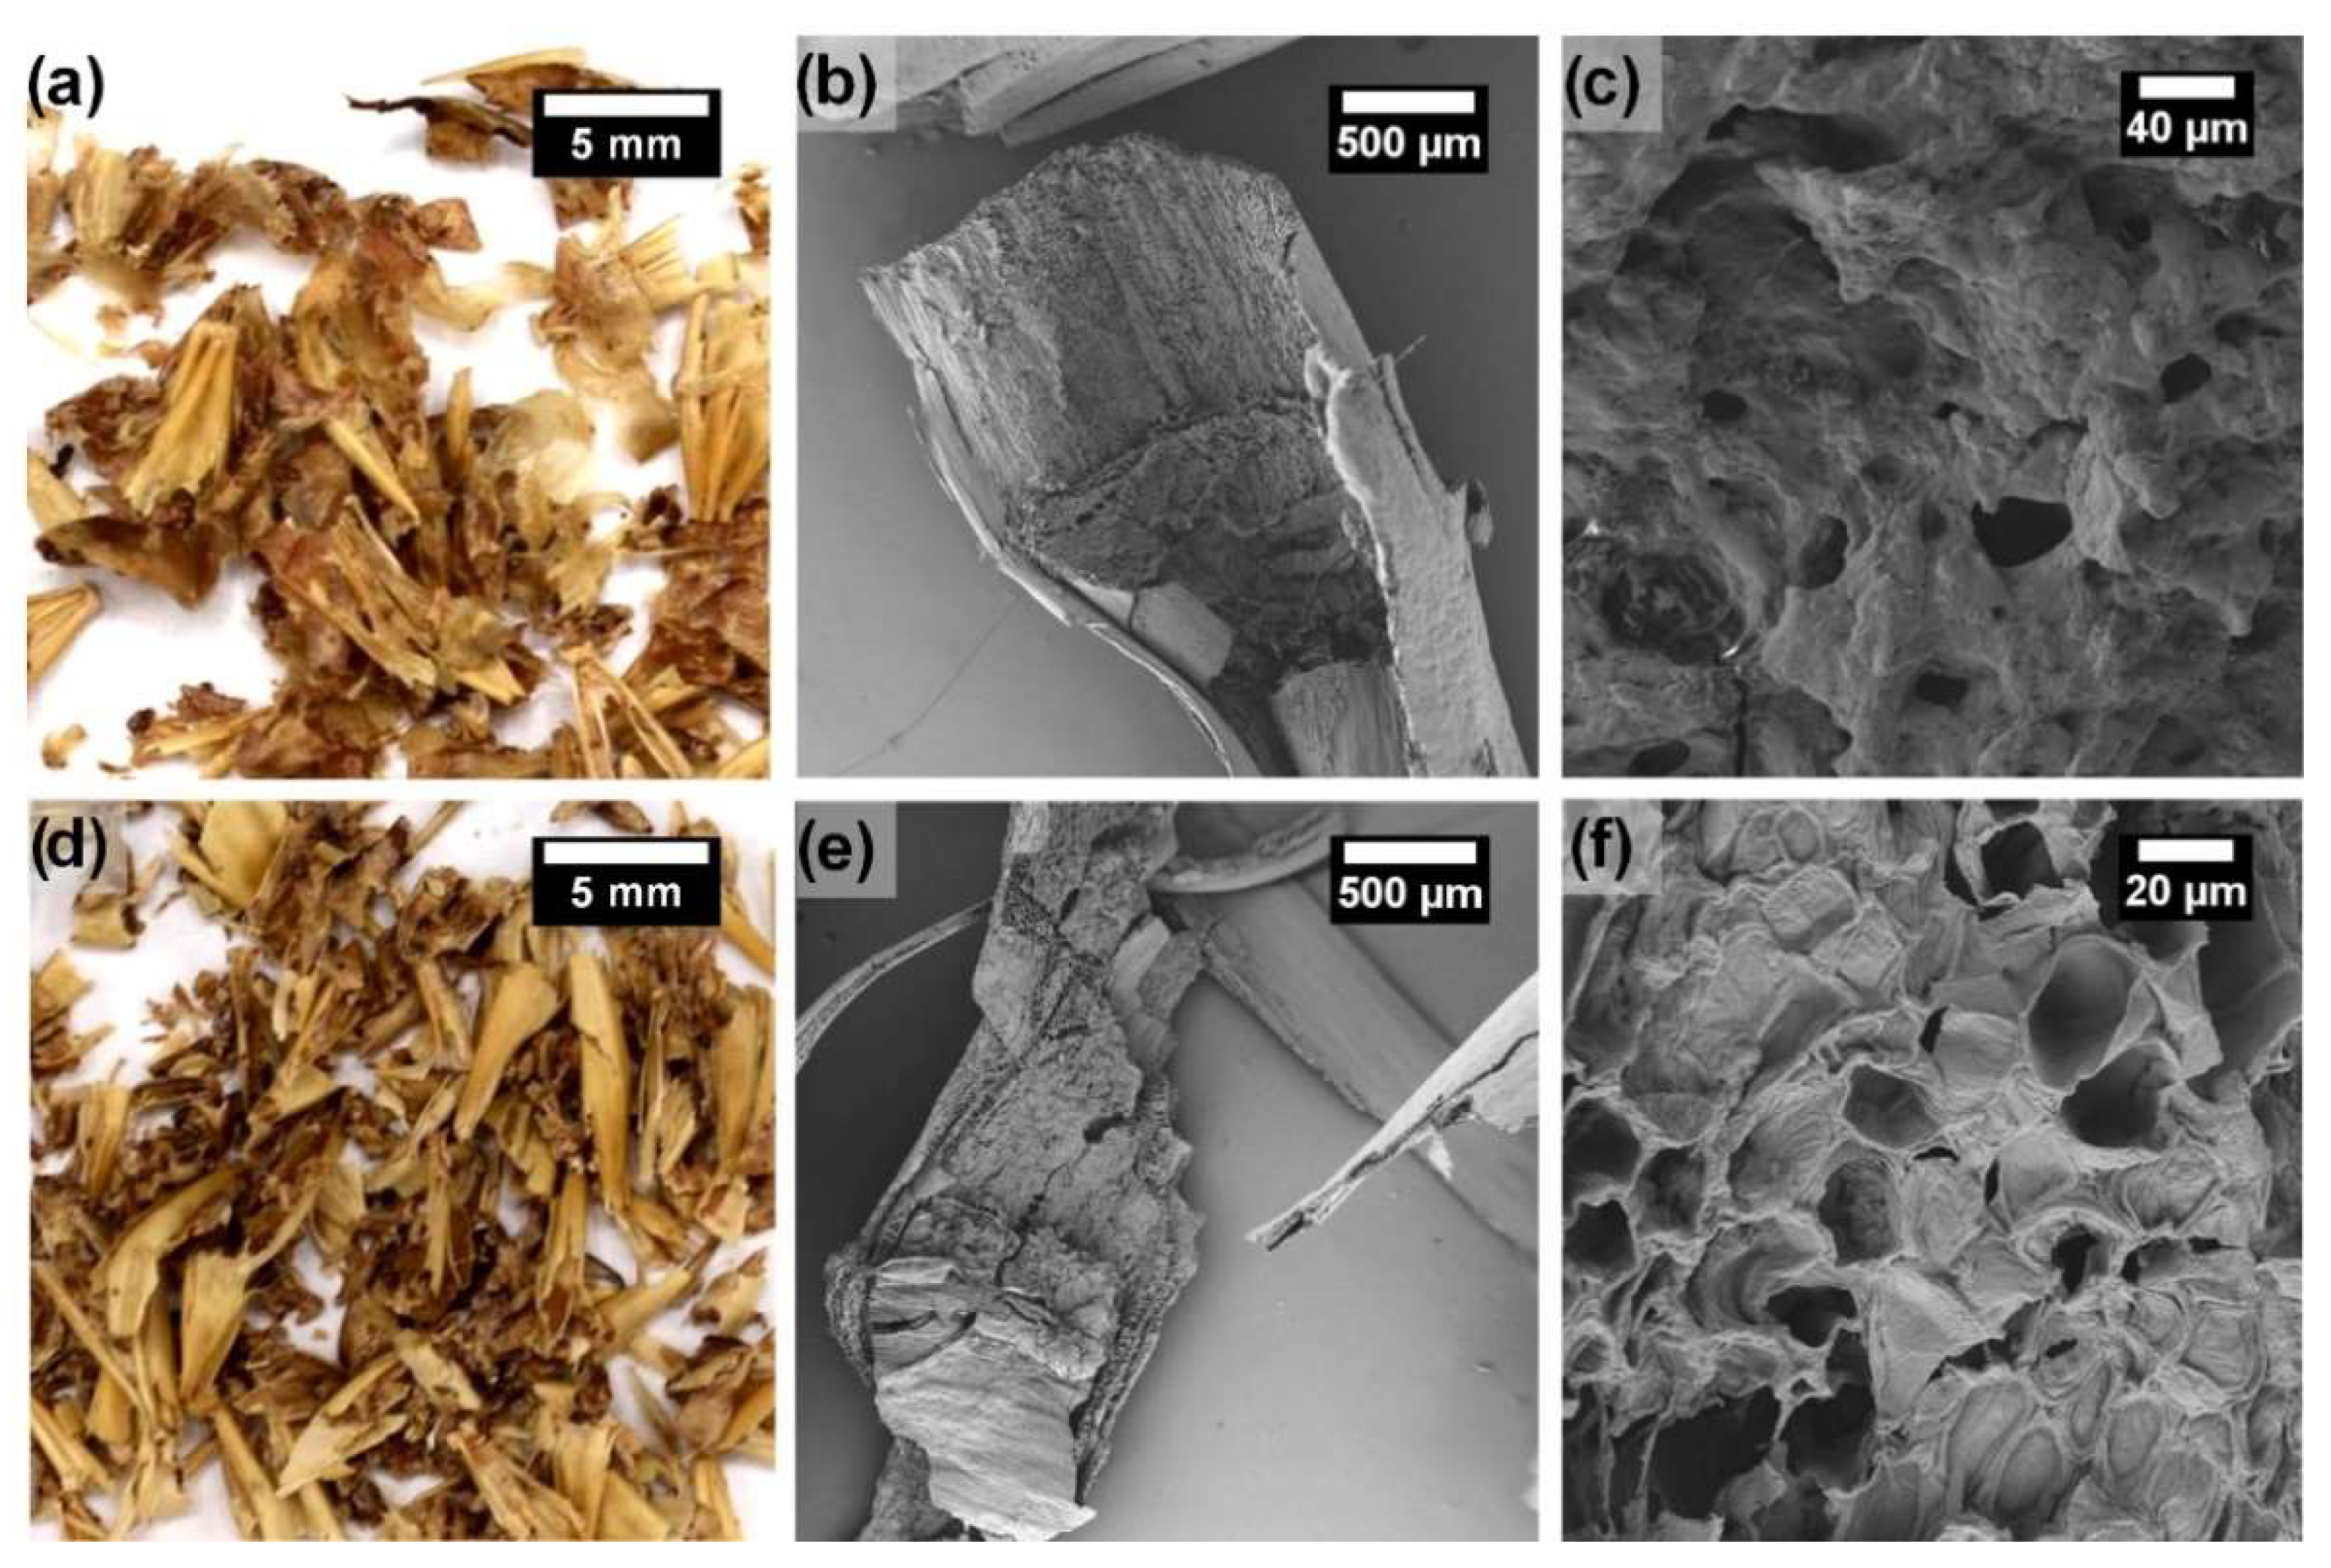
2.2.5. Scanning Electron Microscopy

Scanning electron microscopy (SEM) was used for brewers’ grain surface analysis at nanometric scale (SEM Ultra plus, Carl Zeiss Microscopy GmbH, Oberkochen, Germany) using a secondary electron detector (SE2). Before each analysis, the samples were attached to an aluminium pin sample tray with double-sided adhesive carbon tape and coated with 3 nm platinum to avoid electrostatic charging.

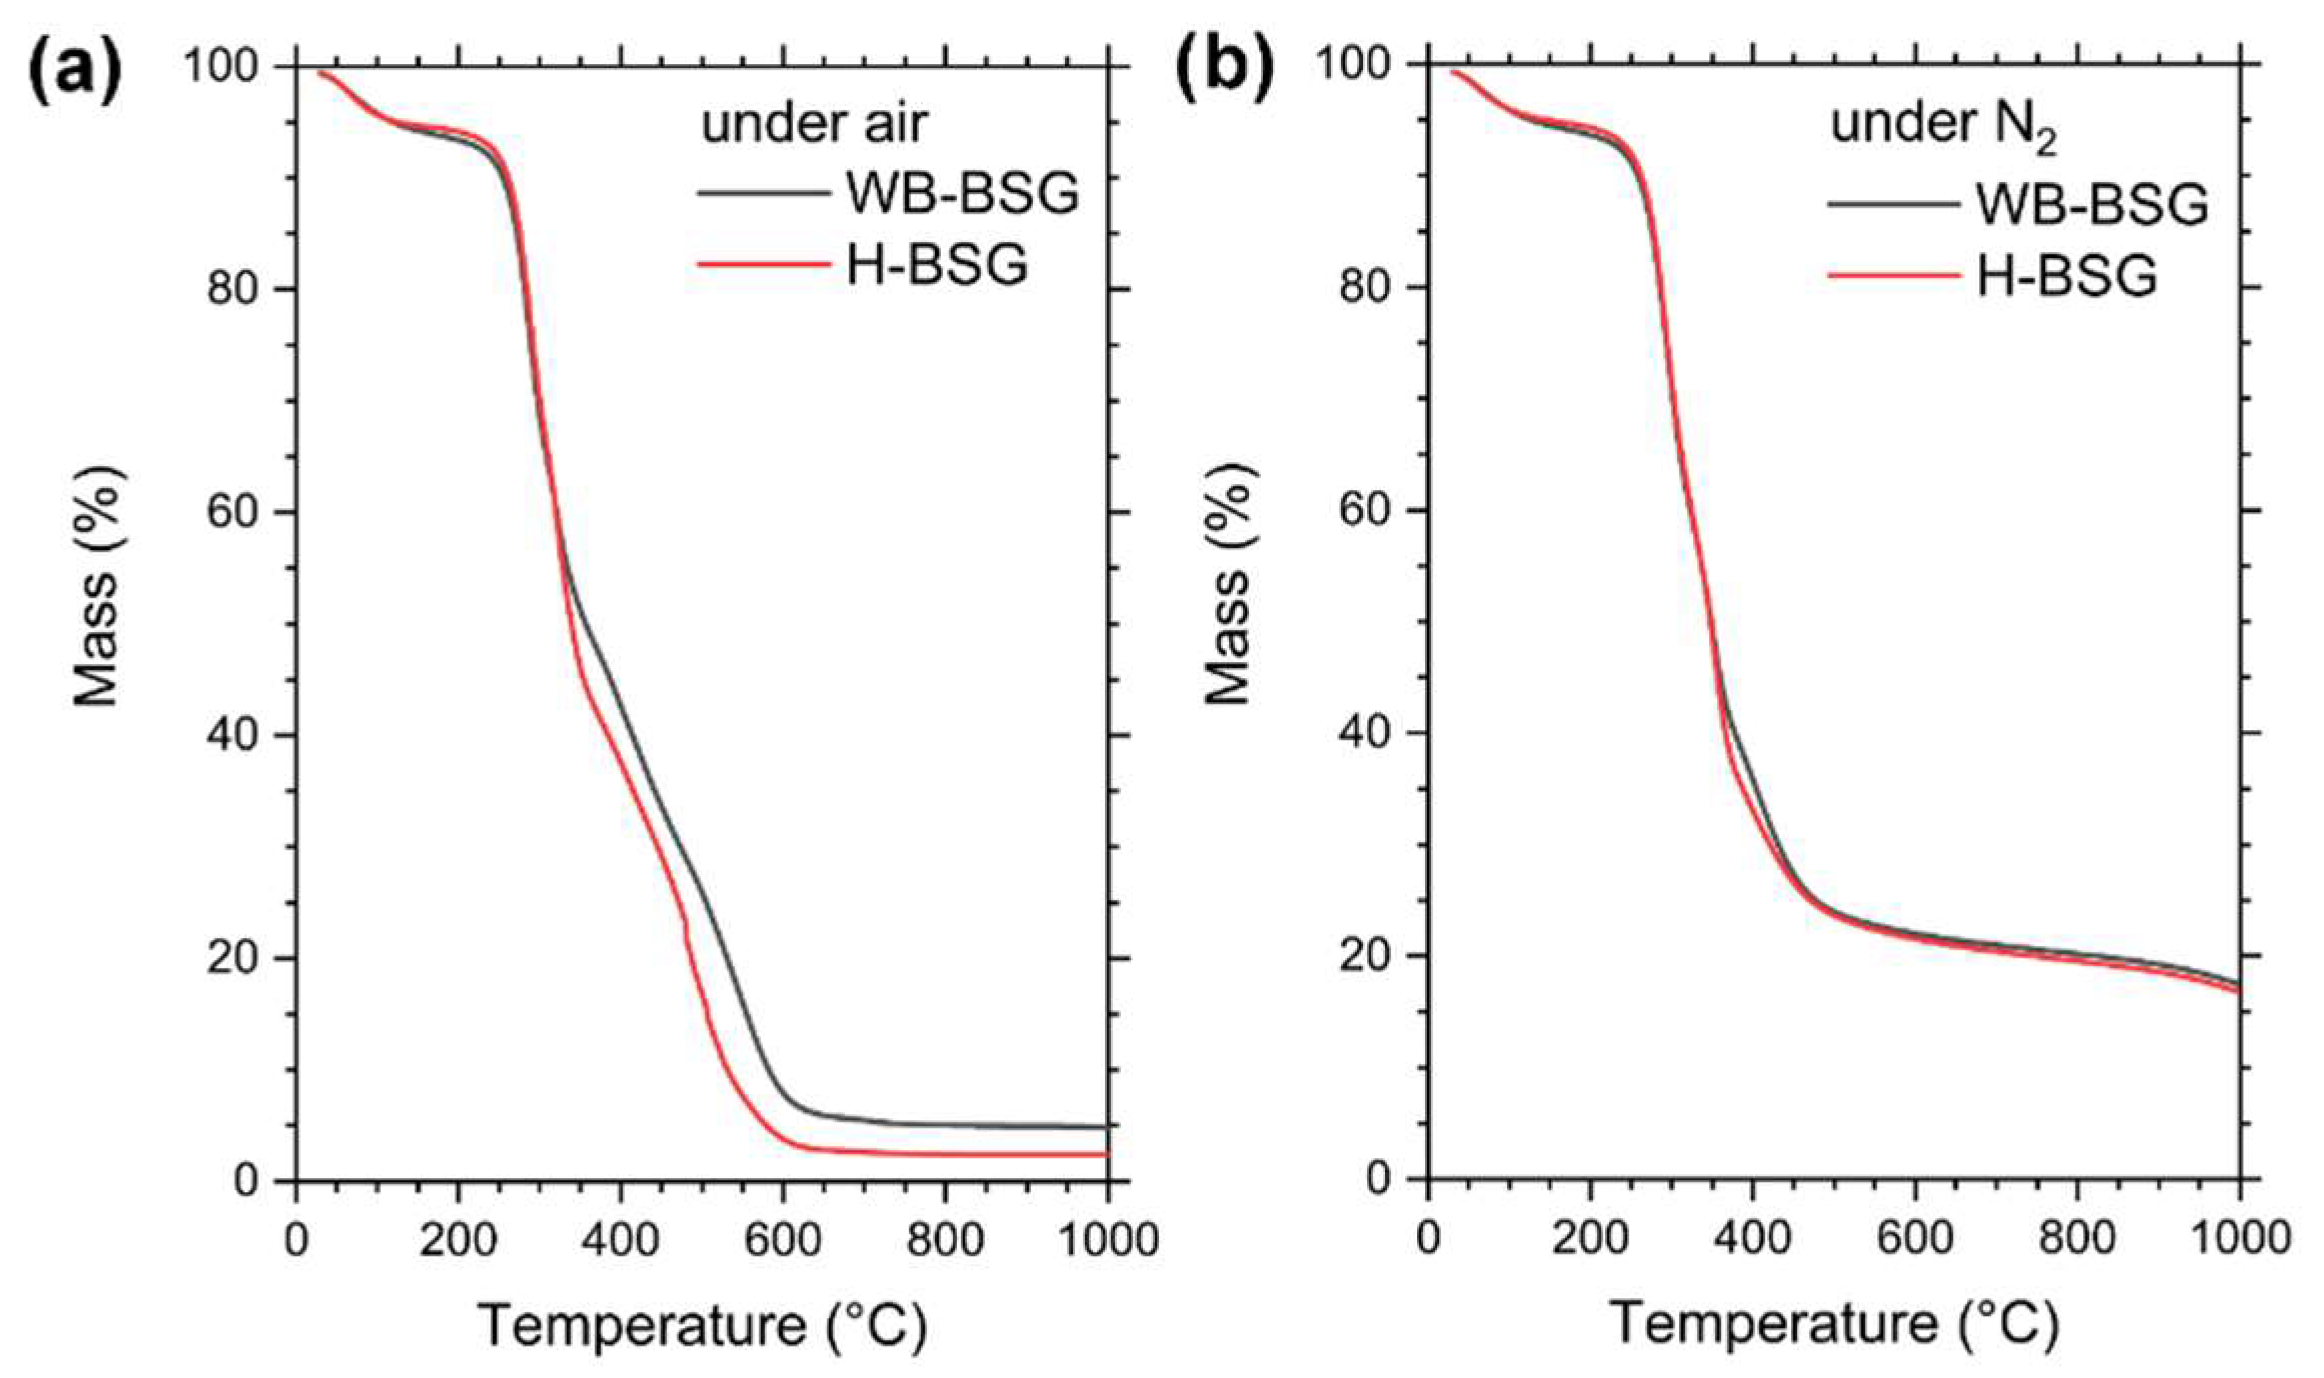
2.2.6. Thermogravimetric Analysis

Thermogravimetric analysis (TG) was performed by using the device 1 Star System from Mettler Toledo Gießen, Germany. The measurements were carried out with approximately 5 mg of BSG in a platinum crucible. The investigated temperature range was from 30 °C to 1000 °C with a heating rate of 10 °C/min under air atmosphere and also under N2 atmosphere, with a flow rate of 40 mL/min.

2.2.7. Nitrogen Sorption

Nitrogen sorption measurements were performed using the Autosorb iQ MP from Quantachrome Instruments. The samples were dried in a vacuum oven at 120 °C and were activated by degassing in vacuum (5 × 10⁻¹⁰ mbar) at 100 °C for 24 h. Approximately 70 mg of BSG were used for the measurement. The nitrogen sorption measurements were performed at 77 K.

2.2.8. Carbon Dioxide Sorption

Carbon dioxide sorption measurements were performed using the Autosorb iQ MP from Quantachrome Instruments. The samples were dried in a vacuum oven at 90 °C and activated by degassing in vacuum (5 × 10⁻¹⁰ mbar) at 100 °C for 24 h. Approximately 70 mg of BSG were used for the measurement. The carbon dioxide sorption measurements were performed at 273 K.

2.2.9. Inductively Coupled Plasma Optical Emission Spectrometry

Inductively coupled plasma optical emission spectrometry (ICP-OES) (iCAP 7400 from Thermo Scientific) was used to determine the heavy metal ion concentrations in simulated and real water. Thus, 8 standards were used: standard 1: Mn2+ (5 mg/L), Fe2+ (10 mg/L), Si (1 mg/L); standard 2: Mn2+ (200 mg/L), Fe2+ (200 mg/L), S (200 mg/L); standard 3: Ni2+ (2000 mg/L), S (2000 mg/L); standard 4: Cd2+ (300 mg/L), S (300 mg/L); standard 5: Ni2+ (100 mg/L), S(100 mg/L); standard 6: S (500 mg/L); standard 7: Fe2+ (500 mg/L), S (500 mg/L); standard 8: Mn2+ (500 mg/L), S (500 mg/L) and 2 mL 20 wt.% nitric acid was added prior to analysis to each sample (8 mL).

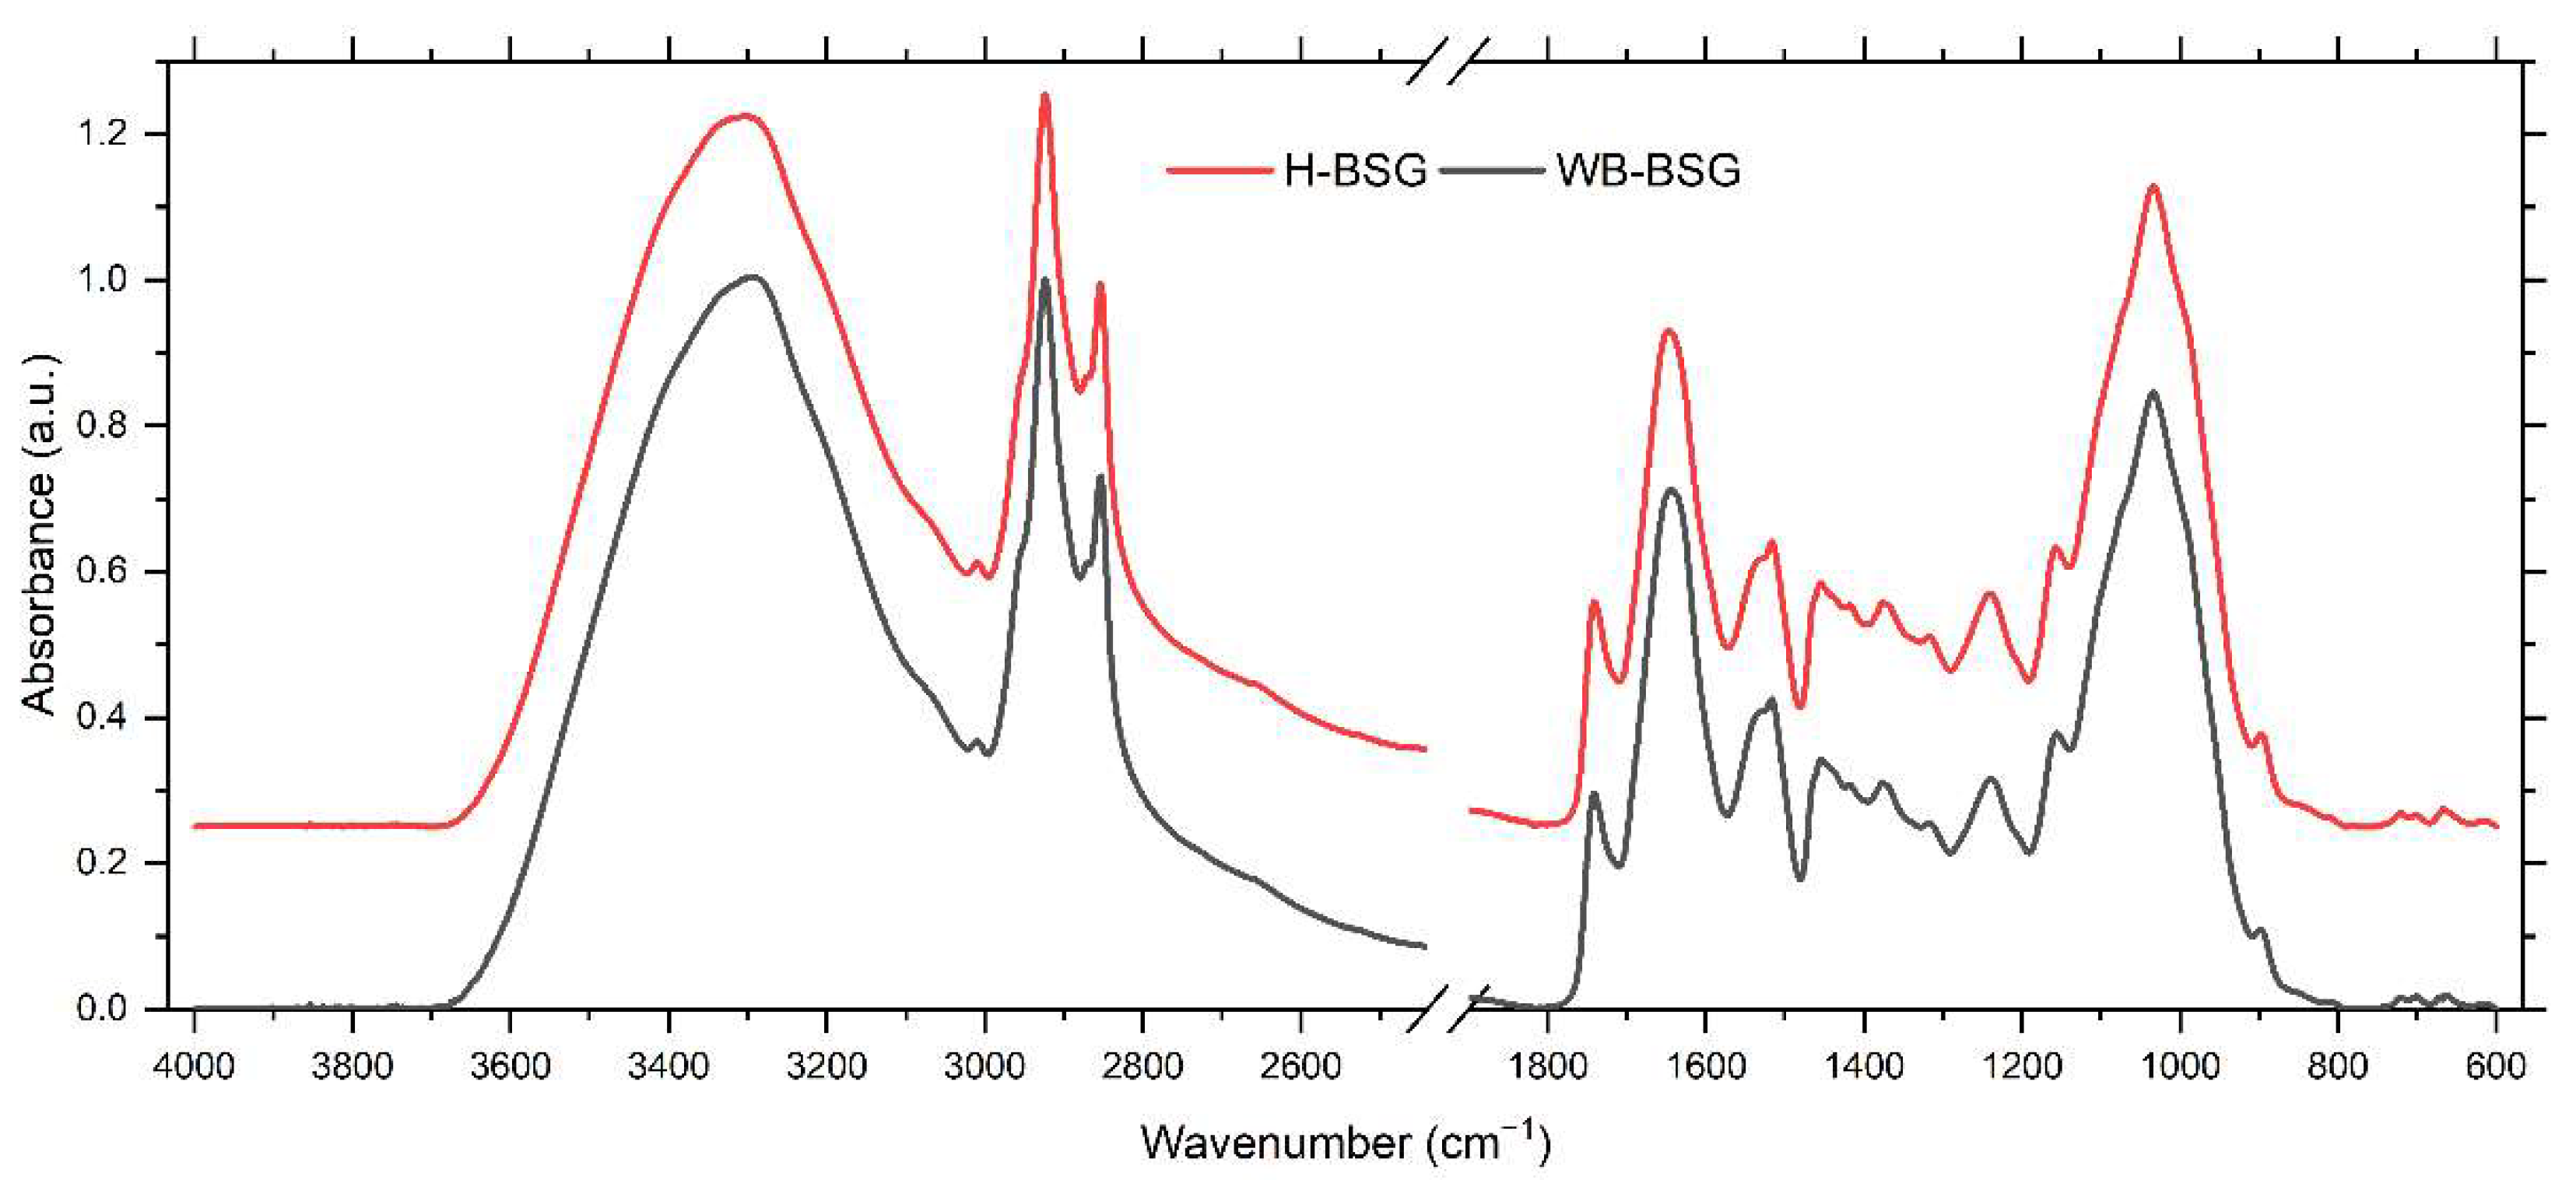
2.2.10. Attenuated Total Reflection Infrared Spectroscopy

Attenuated total reflection infrared spectroscopy (ATR-FTIR) measurements were performed using a Tensor 27 device equipped with a Platinum ATR module, both from Bruker Corporation, Billerica, MA, USA. All samples were measured in dry state, powdered using mortar and pestle with a resolution of 2 cm−1 and with 100 scans. The acquired spectra were subjected to an atmospheric compensation to remove the rotation bands of water.

2.2.11. Scanning Electron Microscope with Energy-Dispersive X-ray Spectroscopy

Scanning electron microscope with energy-dispersive X-ray spectroscopy (SEM-EDX): the elemental mapping of the samples after adsorptions was carried out using a Phenom XL Workstation from Thermo Scientific (Waltham, MA, USA) with an energy-dispersive X-ray spectroscopy detector (Silicon Drift Detector SDD, thermoelectrically cooled (LN2free), 25 mm2 detector active area). The samples were fixed on a double-sided adhesive carbon tape on an aluminium pin sample tray. The measurements were carried out in high vacuum mode (p = 0.1 Pa) with an acceleration voltage of 10 keV at different magnifications.

2.2.12. Elemental Analysis

Elemental analysis was carried out using a vario MICRO cube from the company Elementar, Langenselbold, Germany.

2.2.13. Elemental Content

The concentration of mineral elements (Ca, K, Na, Si, P, S, Se) and some heavy metals (Fe, Mn, Zn, Cu) in the BSG were determined using ICP-OES, following a procedure from Su and Böhm 2020 [24]. Briefly, 100 mg BSG was placed in a 35 mL reaction vial, 10 mL HNO3 (65%, p.a.) and stirred at room temperature for 15 min. Then the vial was placed in a microwave (CEM GmbH, Kamp-Lintfort, Discover) and heated up in a dynamic program. After reaching the set parameter of 210 °C or 17 bar, it was held for 15 min, followed by a cool down. The obtained solution was transferred into a 25 mL volumetric flask and filled to the exact volume with water prior to ICP-OES analysis.

2.2.14. Centrifugation

The adsorber materials were separated from their supernatants by centrifugation at 11,000 rpm at room temperature with the devices 5804 from Eppendorf (Leipzig, Germany) or 3-18KS from Sigma Laborzentrifugen (Osterode am Harz, Germany).

2.3. Adsorption Experiments

2.3.1. Batch Adsorption Experiments

Preliminary batch experiments and adsorption isotherms were carried out with various heavy metal salts. Stock solutions of each heavy metal salt were prepared in a 500 mL volumetric flask. Therefore, the salts were dissolved in water. The pH of the resulting solutions was not adjusted. A measure of 100 mg of each of the respective BSGs was placed into a 50 mL poly(propylene) centrifuge tube. Subsequently, 30 mL of the respective heavy metal salt solutions was added. The samples were stirred for 24 h at room temperature with a magnetic stirrer. After the centrifugation, the pH of the supernatant was analyzed. A sample of 8 mL of the supernatant was taken and mixed with 2 mL of 20 wt.% nitric acid for ICP-OES analysis.

2.3.2. Time-Dependent Adsorption Experiments

A stock solution of 20 mg/L of each heavy metal salt was prepared in a 500 mL volumetric flask. Therefore, the respective amount of heavy metal salt was dissolved in water. The pH of the resulting solutions was not adjusted. A measured 100 mg of each adsorber material was placed into a 50 mL poly(propylene) centrifuge tube. Subsequently, 30 mL of the respective heavy metal ion solutions was added. The samples were stirred for varying times from 5 min to 48 h with a magnetic stirrer. Subsequently, the samples were centrifuged and the pH of the supernatant was analyzed. A sample of 8 mL of the supernatant was taken and mixed with 2 mL of 20 wt.% nitric acid for ICP-OES analysis.

2.3.3. Adsorption Isotherms

A stock solution of 1500 mg/L of the respective heavy metal salt was prepared in a 250 mL volumetric flask by dissolving the salt in water. From this, a concentration series was prepared by dilution with water in 250 mL volumetric flasks.
The remaining solid was washed three times with water, by suspending it and discarding the supernatant after sedimentation, and then dried for 24 h at 60 °C.

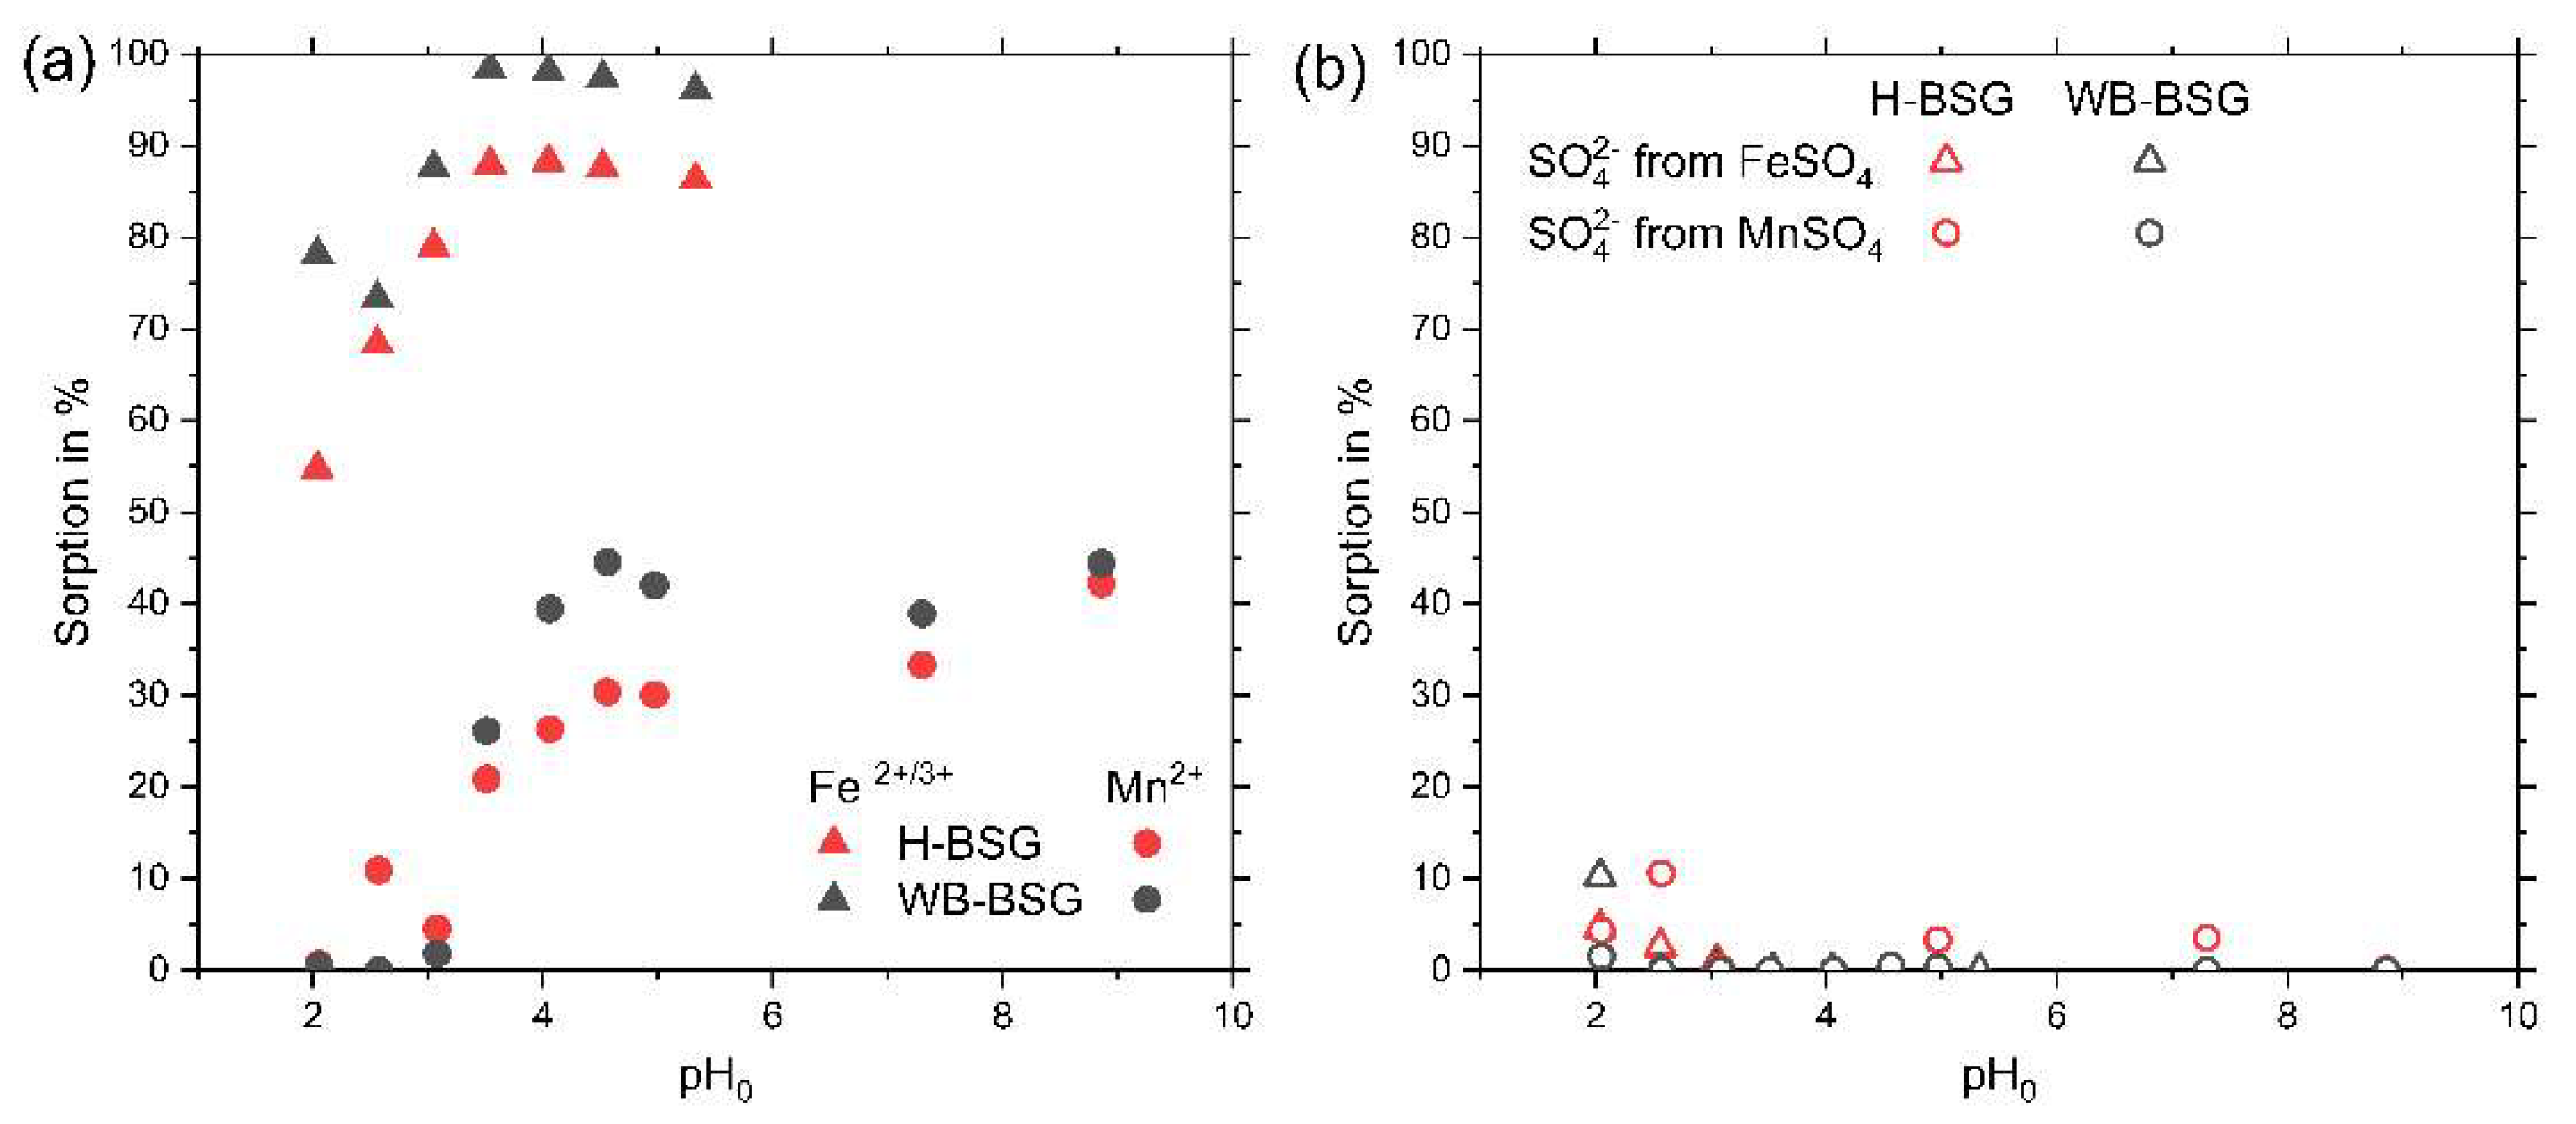
2.3.4. pH-Dependent Adsorption Experiments

Stock solutions of 0.5 mmol/L FeSO4 or MnSO4 were prepared from the salt. The pH of the solution was adjusted with sulfuric acid and sodium hydroxide to obtain initial pH values of 2.0, 2.5, 3.0, 3.5, 4.0, 4.5 and 5.0, for MnSO4 pH 7 and 8 were included as well. Adsorption was tested in batch experiments as described in Section 2.3.

2.3.5. Swelling-Dependent Adsorption Experiments

BSG was soaked for 24 h in 15 mL water, then 15 mL salt solution was added to reach concentrations of 1 mmol/L FeSO4 or 0.73 mmol/L MnSO4, respectively, then adsorption was studied as described in Section 2.3.1.

2.3.6. Real Water Adsorption Experiments

The adsorption was studied as specified in Section 2.4.1, with the difference that the BSG was placed in 30 mL of real water samples. The experiment was performed six times. The adsorption of Fe, Mn, Si, and sulfate was measured using ICP-OES.

2.4. Calculation and Theoretical Models

2.4.1. Sorption Efficiency and Sorption Capacity

The sorption efficiency of H-BSG and WB-BSG for the metal ions and SO42− in equilibrium was determined using Equation (1). The initial concentrations c0 and the concentration after reaching equilibrium ceq were detected by ICP-OES and the percentage removed calculated as follows:
adsorption   in   % = 100 % c 0 c eq c 0
The respective sorption capacity q in equilibrium was calculated through:
q eq   =   ( c 0 c eq ) V L m A
with VL referring to the given volume of the adsorptive solution and mA to the mass of the sorbent material used in the experiment.

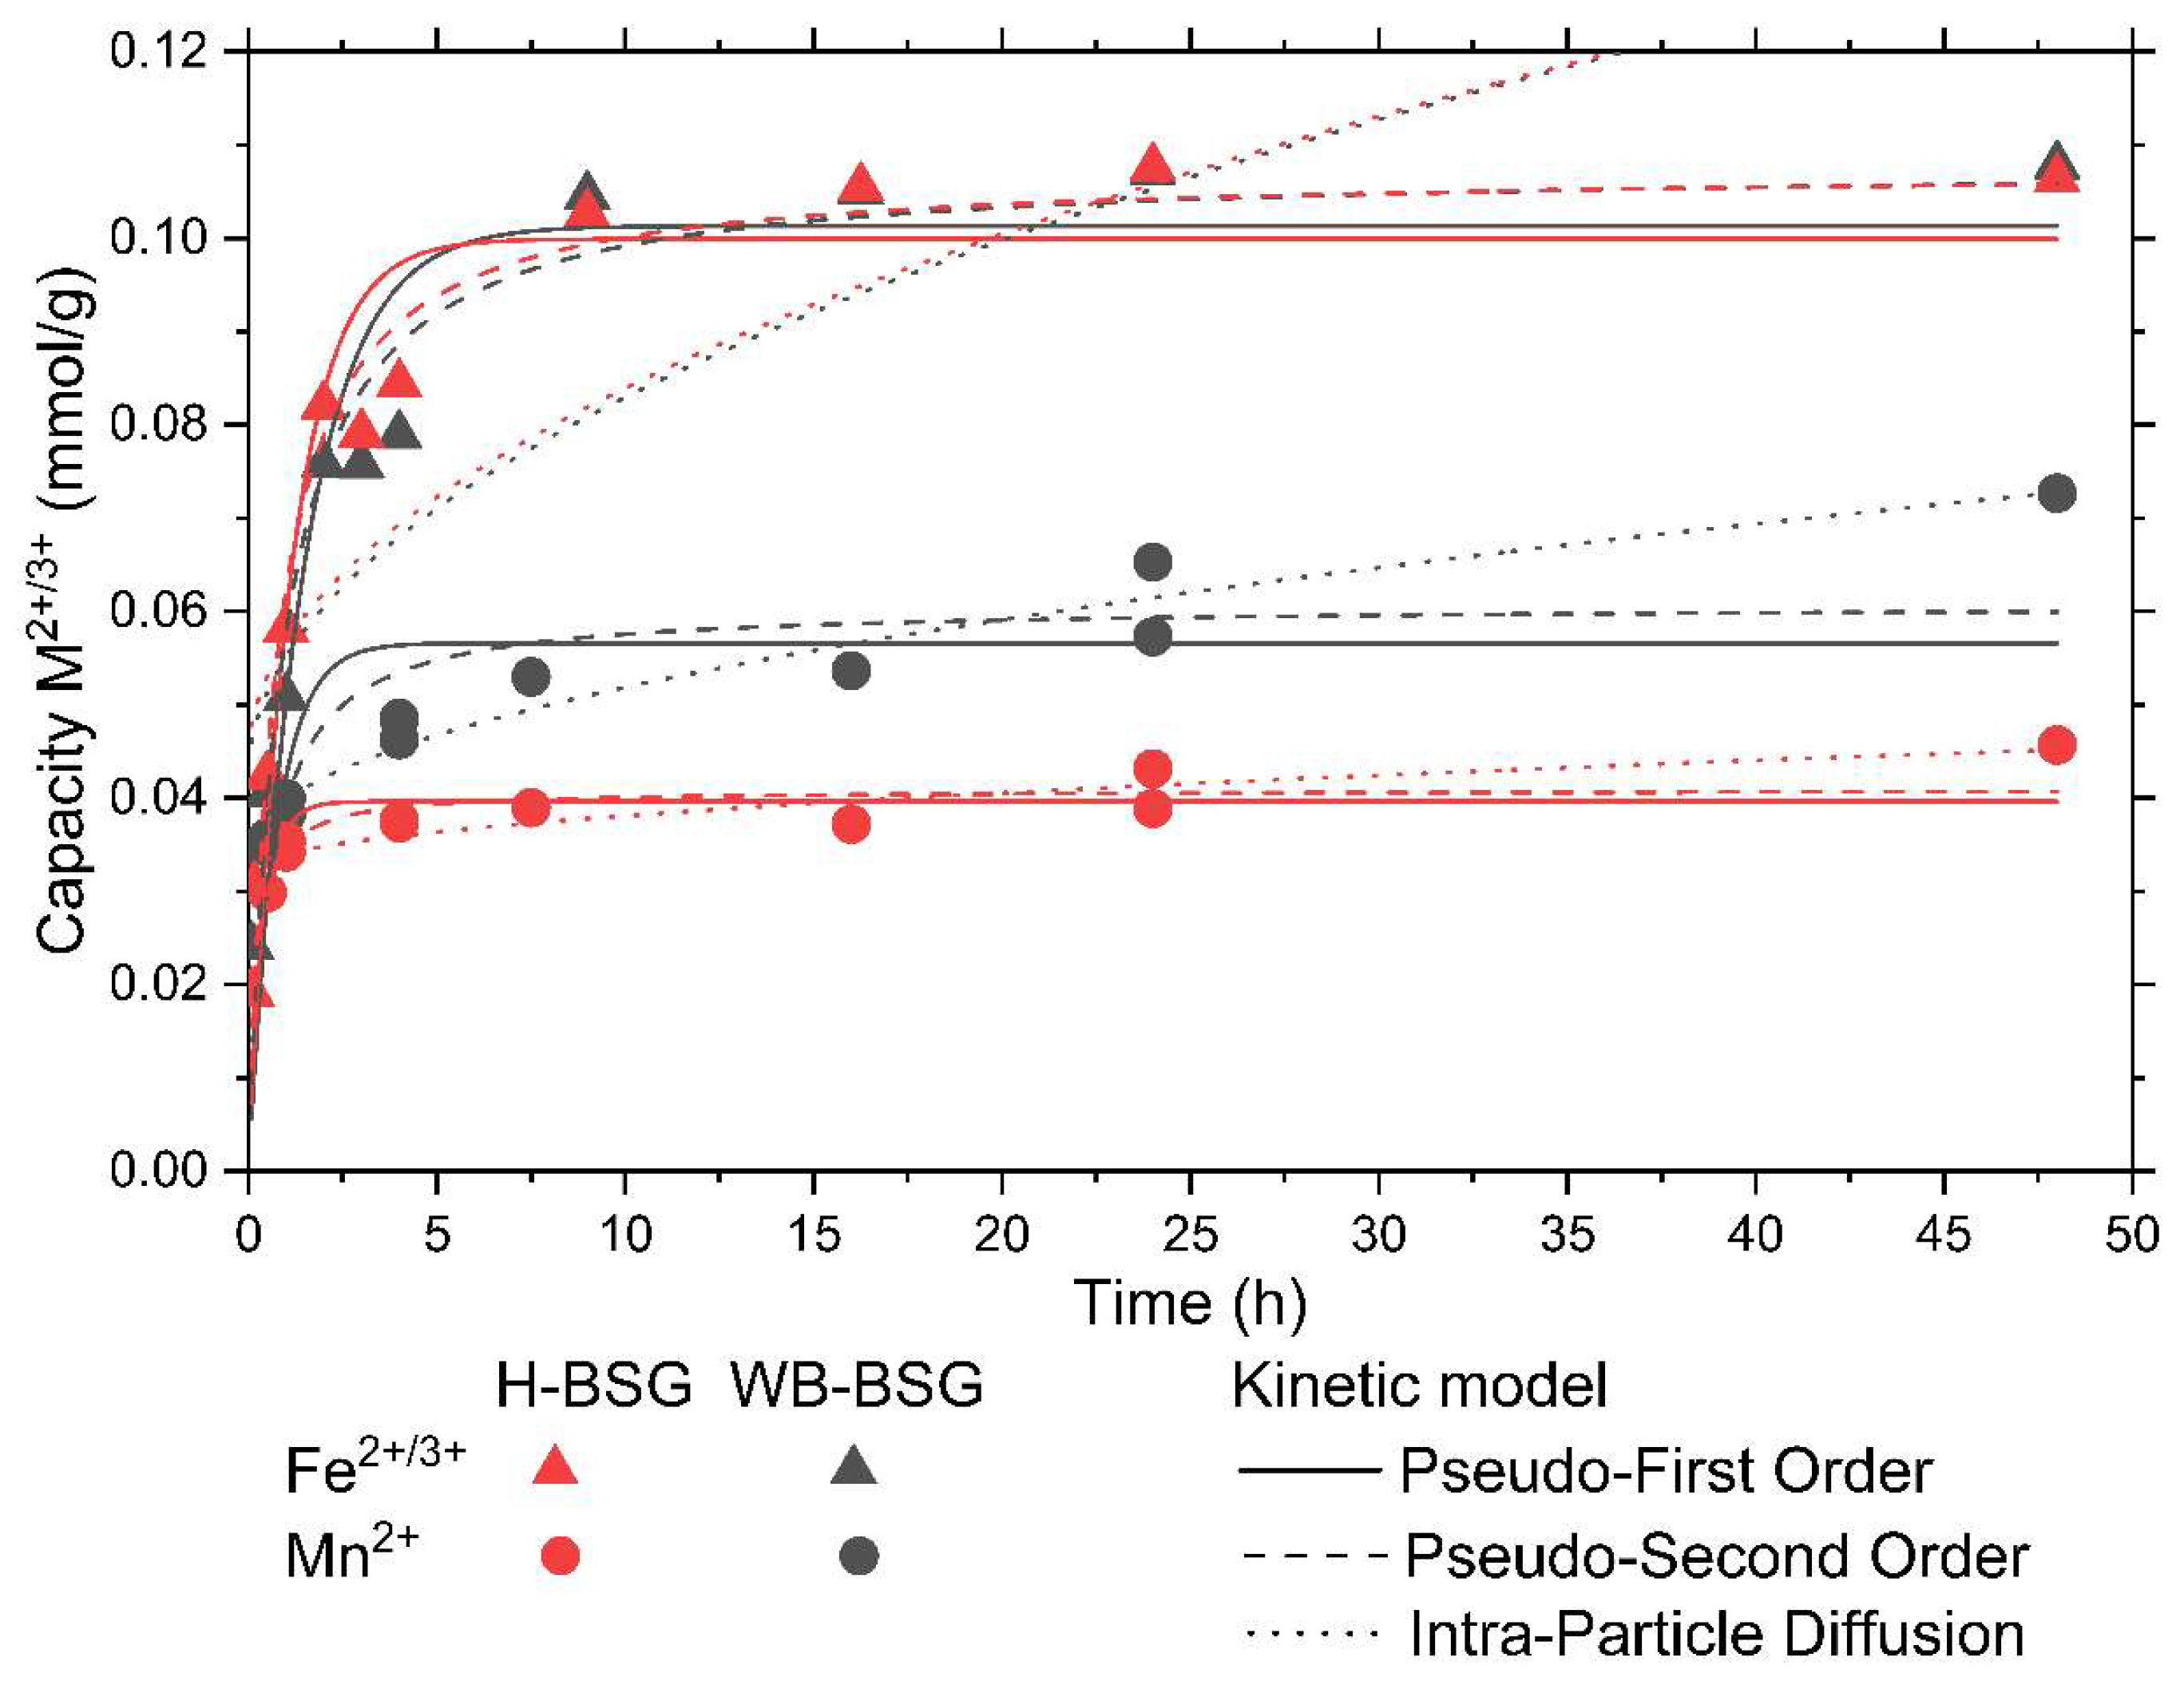
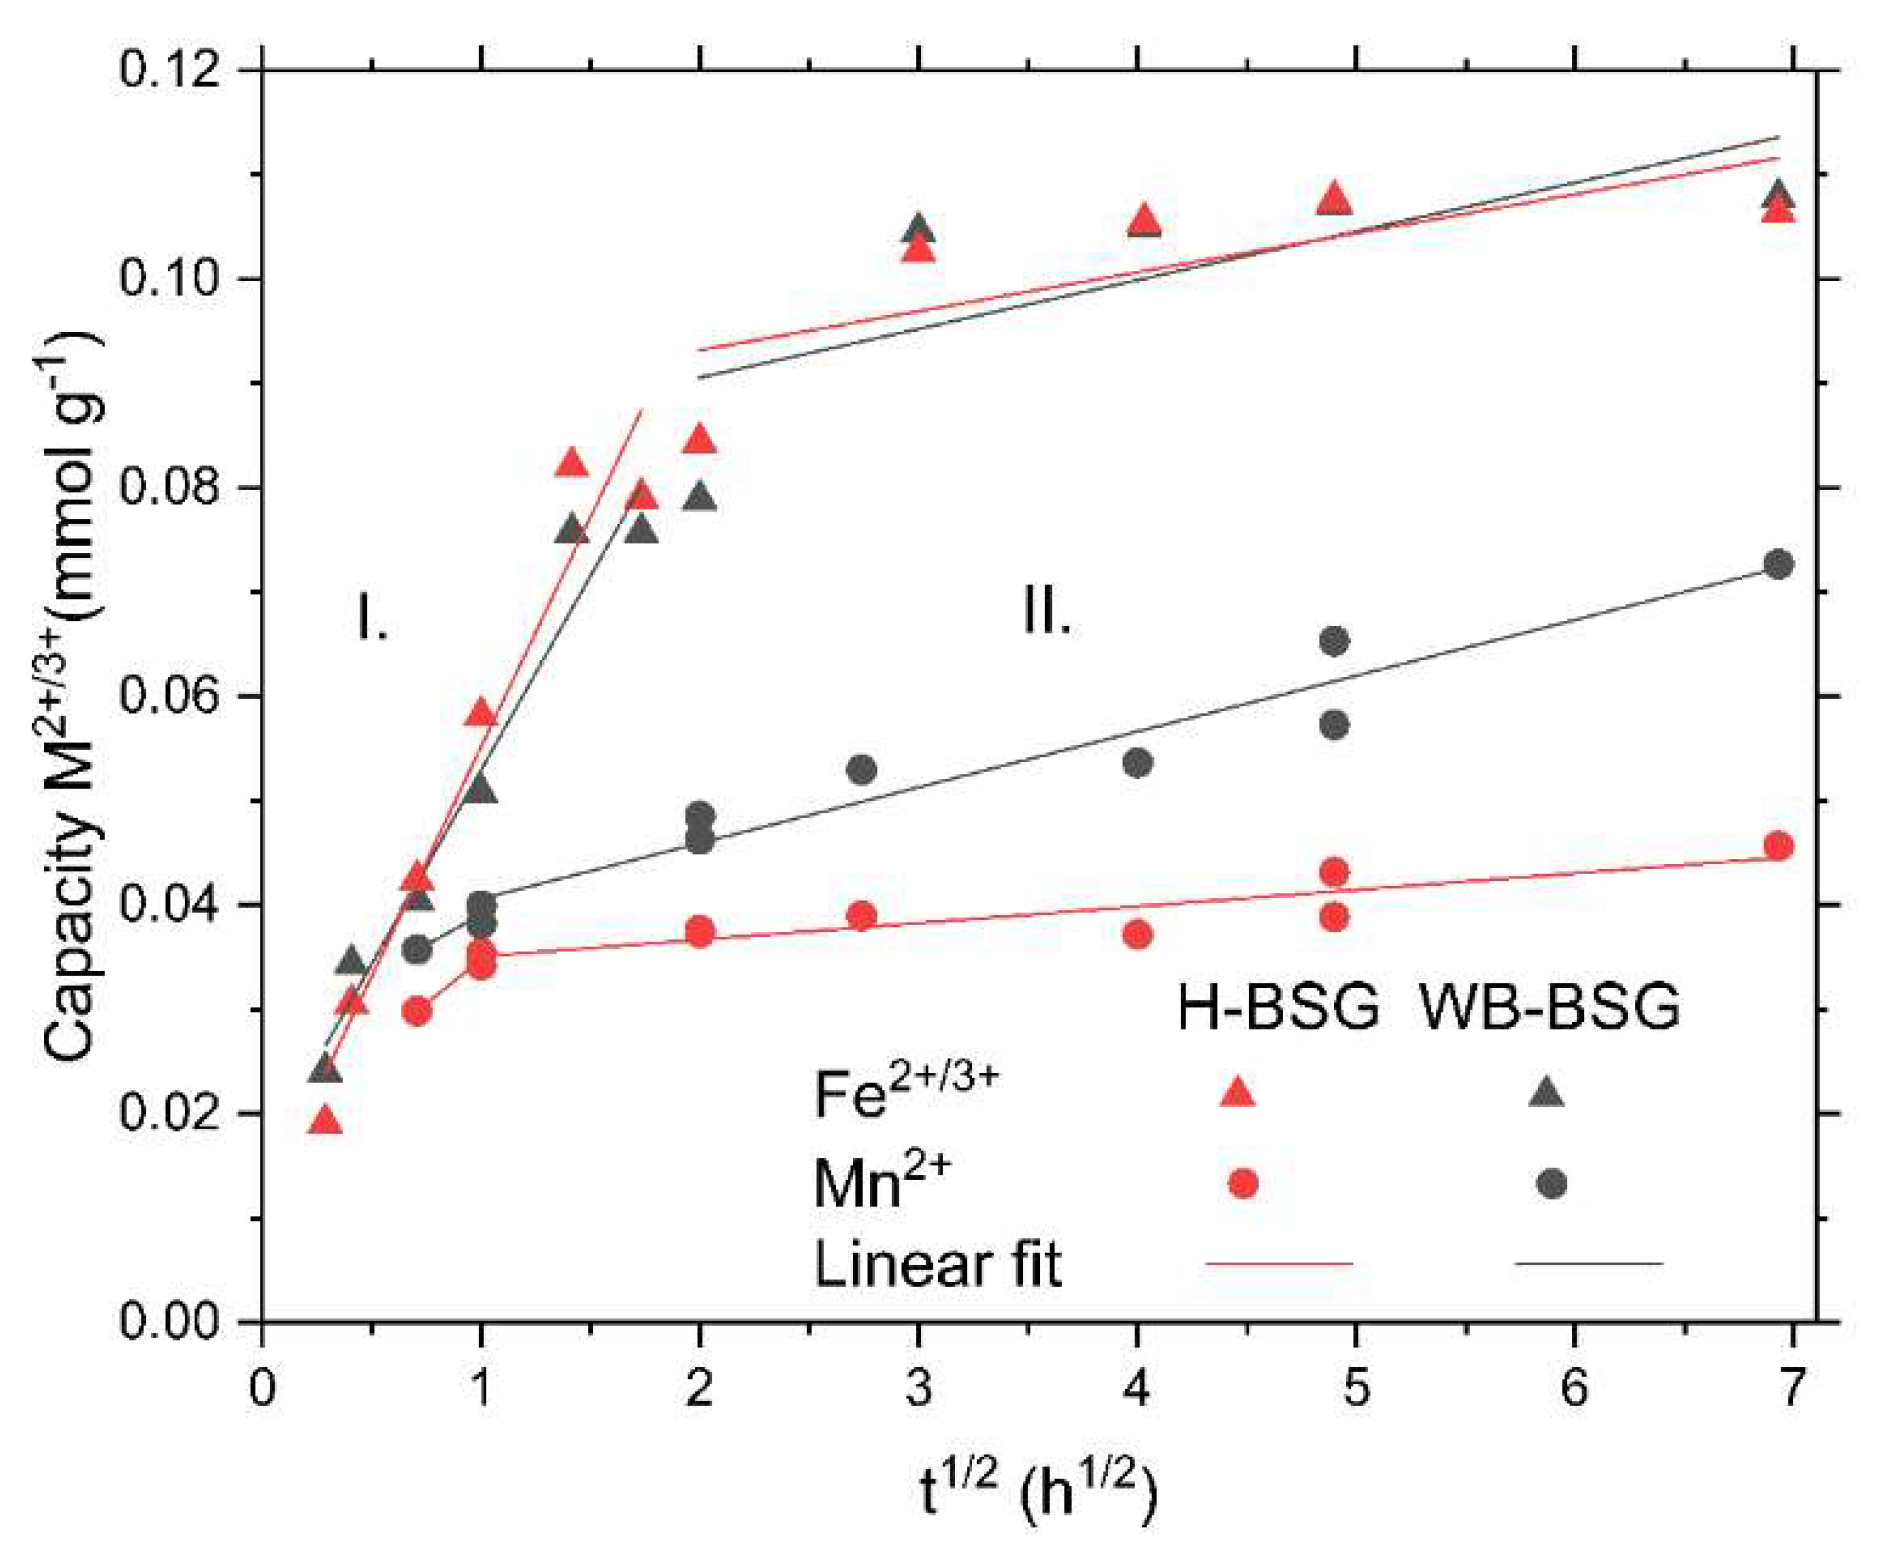
2.4.2. Kinetic Models

Kinetic models for pseudo-first-order (PFO), pseudo-second-order (PSO) and intraparticle diffusion (IPD) were applied in nonlinear fit. The individual equations are shown as nonlinear form, integrated under the condition q 0 = 0 , see Equations (3)–(5).
Pseudo-first-order (PFO) [29].
q t = q eq ( 1 e k 1 t )
Pseudo-second-order (PSO) [30].
q t = q eq 2 k 2 t 1 + q eq k 2 t
Intraparticle diffusion (IPD) by Weber and Morris [31].
qt is the adsorbent loading at a given time t, while qeq is the adsorption capacity at equilibrium. k1, k2 and kWM are the pseudo-first, pseudo-second, and IPD rate constants
q t = k WM t 1 / 2 + C
and C is a constant defined by Equation (5).

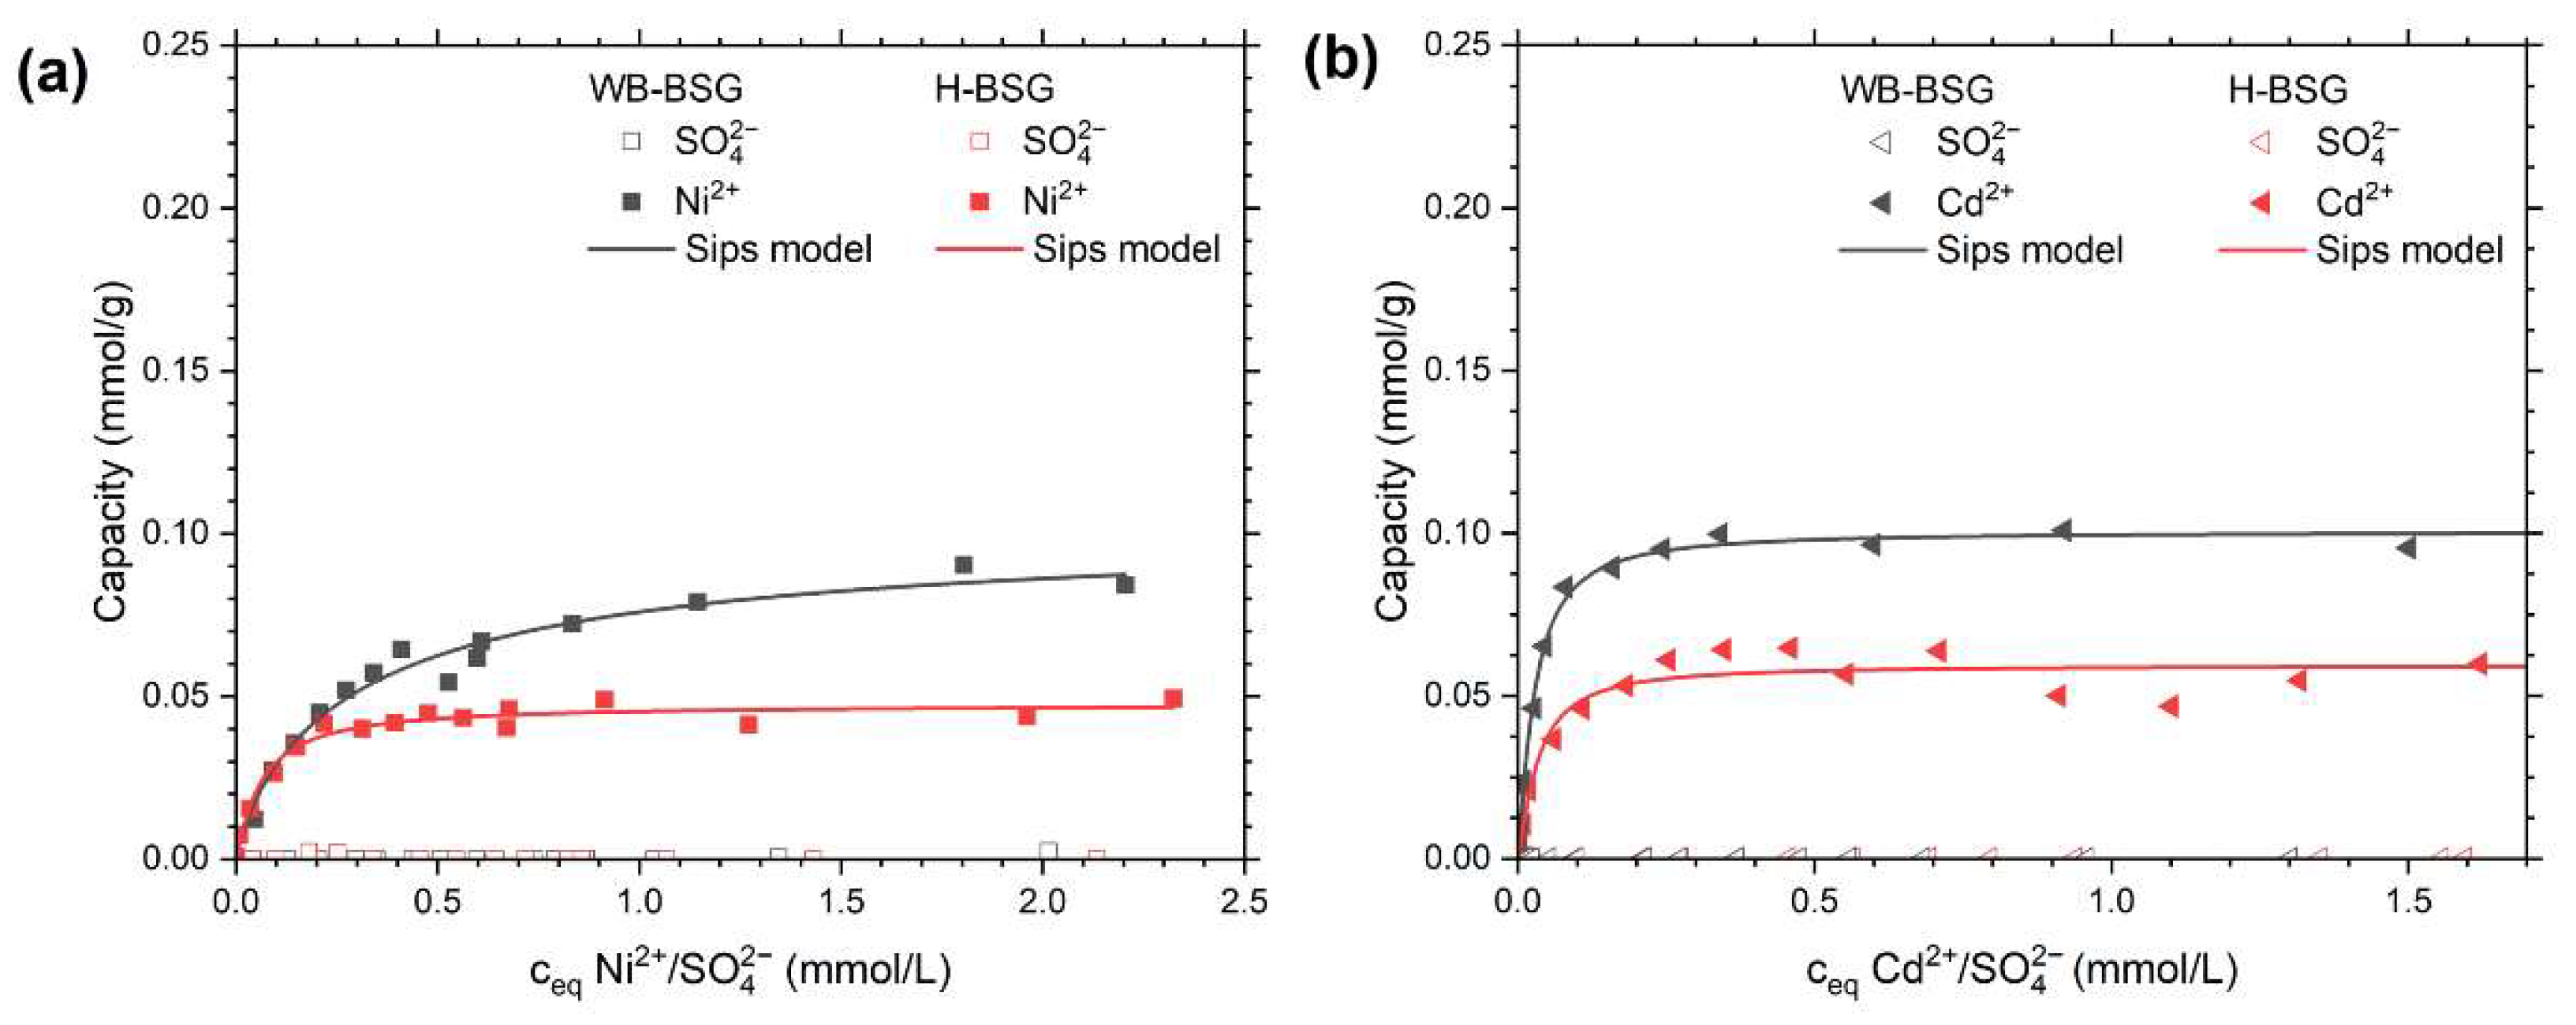
2.4.3. Isotherm Models

To model the sorption process, different fitting models were used, they were the Langmuir, Freundlich, Sips, Elovich and Dubinin–Radushkevich (Equations (6)–(10)) models.
Langmuir model [32].
q eq = Q m K L c eq 1 + K L c eq
Freundlich [33].
q eq = K F c eq 1 / n
Sips model [34].
q eq = Q m K S c eq n 1 + K S c eq n
Elovich model [35,36].
q eq = Q m K E c eq exp ( q eq Q sat )
For the non-linear fitting of the Elovich model, the Lambert W function (W0, product logarithm) was integrated as displayed in Equation (10):
q eq = Q m W 0 ( K c eq )
Dubinin–Radushkevich model [37].
q eq = Q m exp ( β DR ε 2 )
The term ε is given by Equation (12) and can be substituted for the numerically equivalent term in Equation (13) when two requirements are met: First, the solution is only viable for equilibrium concentrations much smaller than the saturation concentration (ceq << cS) and that the modelling of the isotherm is conducted in molar units (mol/L) [38]. In our work, we have implemented both. With these requirements, the energy of adsorption can be expressed by the relation to β DR , given in Equation (14).
ε = RT ln ( c S c eq )
ε = RT ln ( 1 + 1 c eq )
E ads , DR = 1 2 β DR
KL, KF, KS, and KE thereby represent the respective model equilibrium constants, Qm the maximum adsorption capacity, n the Freundlich or Sips model exponent, respectively, βDR the activity coefficient which is related via Equation (13) to the mean free energy of adsorption Eads,DR.
Δ G 0 = RT ln K a
For weakly charged adsorbate or dilute solutions, Δ G 0 can reasonably be calculated from KL (Equation (15)), deliberately ignoring mismatched units between dimensionless thermodynamic equilibrium constants Ka and KL in L per mole [39].

3. Results and Discussion

3.1. Characterization of Brewers’ Spent Grains

The two different brewers’ spent grains H-BSG (Helles-style lager BSG-H-BSG) and WB-BSG (wheat beer BSG-WB-BSG) were received from a brewery in Germany and subsequently washed and dried for further characterization and sorption experiments. To analyze the chemical composition of the two brewery grains ATR-FTIR, elemental analysis and ICP-OES measurements were conducted. ATR-FTIR spectra provide information about the functional groups present on the surface of the BSGs, Figure 1. The bands were assigned to CH2 symmetric (2854 cm−1) and asymmetric (2924 cm−1) stretching vibration [9,24,40]. The broad band at 3305 cm−1 was assigned to overlapping stretching vibrations of primary alcohols, primary amines and Si–OH [26,40]. Further, signals assigned to hydroxylic functionalities were ν C–O (1156 cm−1) and stretching vibrations C–O–C of the cellulose (1035 cm−1). The peak at 1239 cm−1 can be attributed to phenolic C–C–O stretching vibrations possibly from monolignols in hemicellulose and lignin. Protein-related peaks were observed at 1645 cm−1 and 1517 cm−1 and assigned to amide I and II, respectively [24,41]. Further, carboxylic bands were ascribed to ν C=O (1741 cm−1) and ν COO– ( 1377 cm−1). The observed O-containing functionalities observed at the BSG surface are potential metal binding sites for the aspired adsorption process. There was no visible difference between the spectra of WB-BSG and H-BSG, indicating similar functionalities in both BSG samples.
Elemental analysis of the BSG samples was performed to estimate the number of functional groups in the polymeric structure, see Table 1. The BSG samples exhibited approximately 50 wt.% carbon content and 3.6 wt.% nitrogen arising from the protein groups as shown in the IR spectra. The values of the elemental analysis were in line with other references [21,24,42].
To investigate the inorganic content of the BSG samples, thermogravimetry analysis and ICP-OES measurements were conducted, see Figure 2. The thermogravimetry analysis under air atmosphere featured a residual mass of 2–5 wt.% at 1000 °C confirming the purely organic nature of the samples. More detailed insights into the elemental composition of the BSGs were gained using ICP-OES after microwave-assisted digestion. Highest concentrations were found for mineral elements (P, Ca, S, Mg, Na). Other metal ions (K, Fe, Zn, Cu, Mn) and the element silicon were detected in lower concentrations, which is in agreement with the literature (see Table S4) [24]. Minerals can originate from the water used in mashing as well as from the malt itself, e.g., in plant physiology such as phosphorus in DNA or silicon in cell walls. WB-BSG contained higher amounts of the ions P, Ca, Mg, K, Fe, Zn in comparison to H-BSG. Furthermore, H-BSG featured a higher content of the ions S, Na, and Si (see Table S4). WB-BSG possessed three times higher Mg2+ content than H-BSG, nevertheless, still in trace levels.
Naturally the cereals used in the beer formulation, such as barley, wheat, oats or rice have an impact [43] on the differences between H-BSG and WB-BSG [43]. Even for the same grain species, the chemical composition varies strongly due to reasons such as growing conditions, harvesting time, and quality of the grains, followed by different specific treatments such as germination, malting, and the brewing process itself [43,44]. Importantly, as indicated by the chemical characterization, BSG in general mainly consists of carbon, accompanied by a high amount of oxygen containing functional groups for the targeted adsorption of pollutants. Further, due to the lack of pollutants in the initial material and as a bio-based and bio-degradable material, the material represents no danger for the environment. Hence, no harmful secondary pollution of surface waters is to be expected either.
The BSG comprises different parts of the grain and husks of barley malt for H-BSG and barley as well as wheat for WB-BSG but they are indistinguishable to the naked eye, see Figure 3a,d. The BSG samples featured a broad particle size distribution with undefined shapes in the mm range, as shown by their morphology and topological features in the SEM images in Figure 3b–f. Figure 3b shows a complete husk of WB-BSG. The close-up image of the husk fragment (Figure 3e,f) in the cross-section presents cavities, caused by empty cell walls and vascular structures [9]. These cavities, however, present large macropores in the range of 20 µm. Thus, the pores are too large to have an impact on the specific surface area which is an important parameter for an adsorber material. With a diameter of several µm, the pores might contribute to a good diffusion of the water through the material, as it is also its original function in nature.
To investigate the specific surface area of the material, N2 and CO2 sorption measurements were conducted. The BET fitting did not indicate any noteworthy pores in the micro or mesoporous range in the material (see Figures S1 and S2).
SEM-EDX micrographs (Figures S3–S5) affirm the morphological heterogeneity of the BSG. The performed elemental mapping only represents sections of individual particles and are not representative of the whole bulk material as elemental analysis or ICP-OES. It helps rather in elucidating the distribution of elements.
The bulk of the material consists of the elements carbon and oxygen, as expected for plants. The C content was in the range of the elemental analysis and the residue of the EA correlated with the O-content found in EDX. Ions of Mg, P, Ca, and Si detected with ICP-OES were presented as clusters in SEM-EDX. On the surface of several particles of both BSG samples, silicon-rich domains were present in spike-like structures, which could be identified as papillae of the inflorescence bracts [45]. The elements Mg, P, and Ca were found in round clusters as substructures in what appear to be plant cells. In the Fe-loaded samples, an aggregation of iron in those clusters could be observed, but precipitation of iron in individual clusters or crystallites was not visible. It rather covers the particles with a slight prevalence for rougher topologies.
As presented in Figure 4, to estimate the surface charge and thus, sorption properties of the BSG particles, streaming potential measurements were conducted. WB-BSG and H-BSG featured an isoelectric point (IEP) at pH = 4.35 and 4.0, respectively. Thus, the BSG samples featured a comparable positive surface charge for pH values below the IEP. At natural pH, the samples possessed a negative surface charge leading to ionic interactions with positively charged ions such as metal ions (e.g., Fe2+/3+ and Mn2+). Furthermore, for both samples, the charge density was analyzed for pH 3, 5.5, and 7. At pH 5.5 and 7, H-BSG featured a distinctly higher negative charge density in comparison to WB-BSG. For both BSGs the charge density was higher than that of native starch. However, in comparison to chitosan, as an established biopolymer in water treatment, both BSGs exhibited very low charge densities due to the small number of functional groups (see Table 2). For comparison, chitosan is up to pH 7.5 positively charged.

3.2. Sorption Experiments

3.2.1. Time and pH-Dependent Experiments

The adsorption kinetics of iron and manganese ions onto BSG were studied in batch experiments for a period of 48 h. The resulting removal efficiencies are presented in Figure 5. After fast initial adsorption, a plateau was reached after 8 to 10 h. Of the initial 0.38 mmol/L Mn2+, 26% was removed from solution by H-BSG within the first 30 min, followed by a small increase over 48 h to 39%. WB-BSG featured better adsorption performance, starting from 31% (c0 = 0.38 mmol/L), increasing up to 57% after 24 h, and reaching 63% after 48 h. The study by Fontana et al. found plateau after 5 h contact for manganese and iron ions [9]. We observed the same tendency for Mn2+ removal. In contrast, Fe2+/3+ was adsorbed slower but with higher efficiency. Fe2+/3+ was almost completely (97%) removed from solution after 24 h by both types of BSG. The fast kinetics detected reduced the time needed for treatment, thus facilitating higher process throughput, resulting in smaller reactor design and good efficiency [46].
In order to determine the characteristic kinetic parameters (Table 3), kinetic models were fitted to the sorption data in Figure 5. Based on the best fitting model, the underlying mechanism of the kinetic model can be assumed, resulting in characteristic features, as follows. Modelling showed that adsorption of iron ions follows pseudo-second-order kinetics, based on the coefficient of determination R2 (see Table 3). Whereas adsorption kinetics for manganese ions is best fitted using the intraparticle diffusion model, R 2 > 0.8 is not satisfied for Mn2+ on H-BSG [47].
The prerequisites for the pseudo-second order (PSO), as observed for the adsorption kinetics of both BSG types, are as follows: the first condition for the PSO model is that c0 is low. Secondly, the adsorption is assumed to be at a final stage of the process because of a rapid initial phase. The third condition is that the material is abundant with active sites [48]. All conditions seemed to be fulfilled. Equilibrium adsorption amount qeq estimated by PSO model was consistent with q (48 h).
PFO and PSO are both empirical models and hence, do not provide deeper insights into physical mass transfer mechanisms [48]. The three general mass transfer steps of adsorption are external diffusion, internal diffusion, and adsorption on active sites, each can control the rate of sorption [48]. The plot q vs. t1/2 (Figure 6) shows a multilinear behavior, each straight line is representing a controlling process [48]. The initial stage until 2 h, is typical for adsorption controlled by adsorbate diffusion to the outer surface of the adsorbent [9]. As shown in Figure 6, this was pronounced for Fe2+/3+. Intraparticle diffusion is rate limiting for the final stage, as described by the Weber Morris model [9]. For the herein presented BSGs, the adsorption of Mn2+ almost exclusively fell into this final stage, hence the Mn2+ adsorption kinetic is best represented by the intraparticle diffusion model (Table 3).
The effect of adsorbent particle size can supply more insight into the limiting factors in the adsorption process [47], especially if it is rate controlled by intraparticle diffusion. Although grinding of the BSG would result in faster kinetics [20,25], since the diffusion dependences limit the kinetic rate [49] grinding BSG would add additional processing steps and fine adsorber particles suffer from diffusion pressure and removability issues after adsorption.
As the natural pH of surface water changes considerably with seasons and environmental conditions, the adsorption properties in dependent on the pH value of the solution are an important parameter to consider. Hence, for both BSG types, the adsorption performance dependent on the pH was investigated to define the ideal pH range for potential usage in practical adsorption applications (Figure 7).
The adsorption of MnSO4 and FeSO4 was studied in the pH range from 2 to 9, respectively (Figure 6). The pH0 of the FeSO4 solution did not exceed its natural pH, because increasing the pH value with NaOH would lead to a visible precipitation of Fe(OH)3 or MnO2, respectively. This is in accordance with the chemical speciation that at pH > 6 almost all iron ions are present as Fe(OH)2 [9]. Starting from the lowest pH 2, the adsorption efficiency of Mn2+ and Fe2+/3+ increased until a plateau was reached at around pH 4. This trend is in accordance with the streaming potential vs. pH curves featuring an IEP at pH = 4.0 (H-BSG) and pH = 4.35 (WB-BSG), see Figure 6. Thus, Mn2+ and Fe2+/3+ were adsorbed by ionic and coordinative interactions on the BSG surface. However, at a pH < 4 the surface of BSG becomes positively charged, prohibiting ionic and coordinative interaction with the positively charged metal ions. The lower the pH < 4, the larger the positive surface charge on the BSG surface and thus the lower the sorption efficiency of the metal ions at the remaining active sites on the BSG. The early decrease of sorption for both metal ion species is an important factor to account for when planning simultaneous removal from acid mine drainage water, which are defined by low pH values.
With increasing acidity of the solution, the Fe2+/3+ removal decreases to 55% and 73% with H-BSG and WB-BSG, respectively. The general difference in sorption efficiency between Mn2+ and Fe2+/3+ was consistent throughout the full pH range. The significantly higher sorption efficiency of Fe2+/3+ in comparison to Mn2+ can be explained by the higher oxidation of iron, which is favoured for the adsorption process. Mn2+ was adsorbed less effectively, independent of the initial pH of the solution, which is in accordance with the trend shown in Figure 4. Below pH0 3, Mn2+ adsorption no longer occurred. The most stable oxidation state of manganese is Mn2+ featuring a typical octahedral coordination. In neutral or acidic solutions, Mn2+ builds [Mn(H2O)6]2+ complexes, which have stronger oxidation resistance in comparison to Fe2+ due to the stable d5 configuration.
However, the positively charged BSG surface yielded in a minor adsorption of positively charged sulfate ions. Although, theoretically, the fully protonated surface of BSG at low pH should facilitate the adsorption of sulfate, this effect is minor compared to the metal ion adsorption (Figure 7b), even though below pH 3 the sulfate adsorption from FeSO4(aq) gradually increases to reach 0.216 mmol/g at WB-BSG and 0.097 mmol/g at H-BSG, reaching the maximum at pH = 2.0. Since the pH was lowered by the addition of sulfuric acid, the concentration of sulfate ions increased with decreasing pH values. Hence, in comparison to the constant metal ion concentration, the initial sulfate concentration is dependent on the pH. This is explained by lowering the pH using sulfuric acid and is cancelled out in the percentage removed.

3.2.2. Batch Adsorption Experiments with Simulated Water

The adsorption dependency of Mn2+ and Fe2+/3+ on the initial concentration was investigated in batch experiments (see Figure 8). To investigate the adsorption process, the obtained isotherms were fitted with different models (as summarized in Table 4 and Table S6).
Best removal of Fe2+/3+ (>90%) was achieved at an initial concentration of 0.5 mmol/L, see Figure S7. The curve qeq versus ceq (see Figure 8) indicates a plateau reached above ceq (Fe2+/3+) = 0.5 mmol/L for both types of BSG. The maximum adsorption capacities qsat,S from the Sips isotherm model were 0.182 mmol/g and 0.209 mmol/g for Fe2+/3+, and 67.8 µmol/g and 0.104 mmol/g for Mn2+ on H-BSG and WB-BSG, respectively (see Figure 8). WB-BSG displayed a higher maximum adsorption capacity than H-BSG, which is in line with the fitted isotherm models (see Figure 8). The difference between WB-BSG and H-BSG was even more pronounced in respect of Mn2+ adsorption, where the maximum removal efficiency differed by 17% (see Figure S7). The adsorption capacity reached for Mn2+ was only half of the capacity for Fe2+/3+, which is consistent with literature [9]. The presence of BSG or the adsorption did not noticeably influence the pH value of the solution pH value (see Figure S8), as reported previously by Akinpelu et al. [20]. This leads to the conclusion that there is no major involvement of hydronium or hydroxy ions in the adsorption process.
The data of the adsorption isotherm was fitted by various isotherm fitting models. The Sips isotherm model, resulting from a combination of the Langmuir and Freundlich model, yielded the highest coefficient of determination (COD) R2 for both metal ions and both types of BSG (see Figure 8). At n S = 1 , the Sips model reduces to Langmuir, indicating monolayer adsorption on a surface of homogenous active sites [50]. For Mn2+  n S is closest to 1, thus Mn2+ adsorption can be equally well described by the Langmuir isotherm model (see Figure S9). We found qsat,L(Fe2+/3+) of 0.226 mmol/g and 0.191 mmol/g for WB-BSG and H-BSG, respectively. This exceeded the qsat,L(Fe3+) = 0.149 mmol/g from the FeCl3(aq) as well [21].
Supported by SEM-EDX element mapping, BSG showed an equal distribution of Mn2+ in long range scales (µm scale and resolution; see Figures S13 and S14 and Table S9). Even though the BSG morphology appeared heterogeneous in SEM, the surface of active sites for Mn2+ adsorption seem to be homogeneously distributed.
The maximum sorption capacity qsat,E(Mn2+) derived from the Elovich isotherm model was three times lower than qsat,L from the Langmuir model (see Figure S10). Nevertheless, qsat,E(Mn2+) on H-BSG = 0.0213 mmol/g coincided with the value qsat,E(Mn2+) = 0.02 mmol/g for untreated BSG published by Wierzba and Kłos [25].
Between cations of the same valence, those with a smaller hydration ionic radius are preferred for adsorption, giving priority to Fe3+(0.645 Å) over Fe2+ (0.78 Å) and Mn2+ (0.83 Å) [51]. Furthermore, Fe3+ is a harder acid than Fe2+ and Mn2+ and hence, more likely to form a complex with hard bases such as COO-, as mainly present in BSG [52]. The general tendency of increasing affinity with charge M+ < M2+ < M3+ also applies for BSG, as tested by Wierzba and Kłos [25]. Since iron (II) readily oxidizes in solution, [52]. the affinity of Fe2+/3+ is additionally increased by higher ionic charge in relation to stable Mn2+. The claim is further supported by the difference in mean free energy of adsorption Eads, obtained through the Dubinin–Radushkevich model (see Figure 8), i.e., 13.06 kJ/mol and 13.74 kJ/mol for Fe2+/3+ onto H-BSG and WB-BSG, respectively, as opposed to 11.76 kJ/mol and 12.23 kJ/mol for Mn2+. Generally, Eads of both tested metal ions was greater than 8 kJ/mol indicating the transition from physisorption to chemisorption or ion exchange [39]. The Gibbs free energy change (ΔG°) calculated from Langmuir equilibrium constant (KL, see Table 4) were negative, hence the adsorption is spontaneous and thermodynamically favourable at the tested temperature.
Besides the huge amount of FeSO4(aq) in surface water in mining regions, other heavy metal ions such as Ni2+ and Cd2+ play a common issue in surface water pollution and thus, are harmful for their environment as well. To extend the application of BSG as a natural environmentally friendly adsorber, the adsorption properties for Ni2+ and Cd2+, as additional examples of heavy metal ions, were investigated here in a proof-of-concept study.
In Figure 9, the adsorption isotherms of NiSO4(aq) and CdSO4(aq) are presented. The observed isotherms were fitted with Sips, Langmuir and Freundlich model, see Figure 8 and Figure S12. Similar to the isotherms of FeSO4(aq) and MnSO4(aq) (see Figure 8), there is a significant difference in the adsorption performance between H-BSG and WB-BSG. WB-BSG featured a nearly twice as high adsorption capacity in comparison to H-BSG. The determined charge density of the two samples in Figure 4 was more than twice as high for H-BSG in comparison to WB-BSG but in total the charge density was very low for both samples and, therefore, had no significant impact on the adsorption properties. The comparison of both samples shows that there can be extensive differences between the type of BSG used. However, since BSG is a natural material consisting of multiple ions and functional sites, it is difficult to predict the critical properties for the adsorption. Table S3 shows the different concentrations of elements present in the two BSG samples compared with other BSG samples from literature. The different concentrations of elements as well as the brewing procedure might have an impact on the adsorption properties.
The calculated adsorption capacity of WB-BSG by Sips model was 0.104 mmol/g and 0.101 mmol/g for Ni2+ and Cd2+, respectively (Table 5). Although the adsorption capacities for Ni2+ and Cd2+ were very similar, the curve progression at low pH values featured a different trend. This is very important to note since the common heavy metal ion concentrations in real water will be mostly in the region of lower concentrations. Thus, the adsorption performance for Cd2+ was remarkable due to the extraordinarily steep rise of the curve resulting in very efficient Cd2+ removal (from c0 = 0.03 until 10 mg/L) of about 90%. In comparison, Mn2+ and Ni2+ possessed less steep progression.
For both metal ions and both BSG types, the Sips model represents the most accurate fitting of the isotherms, closely followed by the Langmuir model. This suggests that adsorption mainly occurs as an evenly distributed monolayer. Nevertheless, the slightly increased n values of about 1.27 for the Cd2+ adsorption showed a minor tendency towards the Freundlich model. This indicates that some Ni2+ adsorption sites may be more favourable than others. This is also supported by SEM-EDX measurements that showed a mostly uniform Ni2+ distribution on the BSG-surface that was spotted with small sites of preferential adsorption (Figures S19 and S20). The surface bond Ni2+ determined via EDX was around 0.16 atom% (compare Table S11). Cd2+ on the other hand showed a homogenous distribution along the surface (Figures S24 and S25). This is in line with the adsorption models where the n value of the Sips is close to 1.0, and thereby indicates monolayer adsorption. The determined bound Cd2+ fluctuates around 0.18 atom% (Table S13).

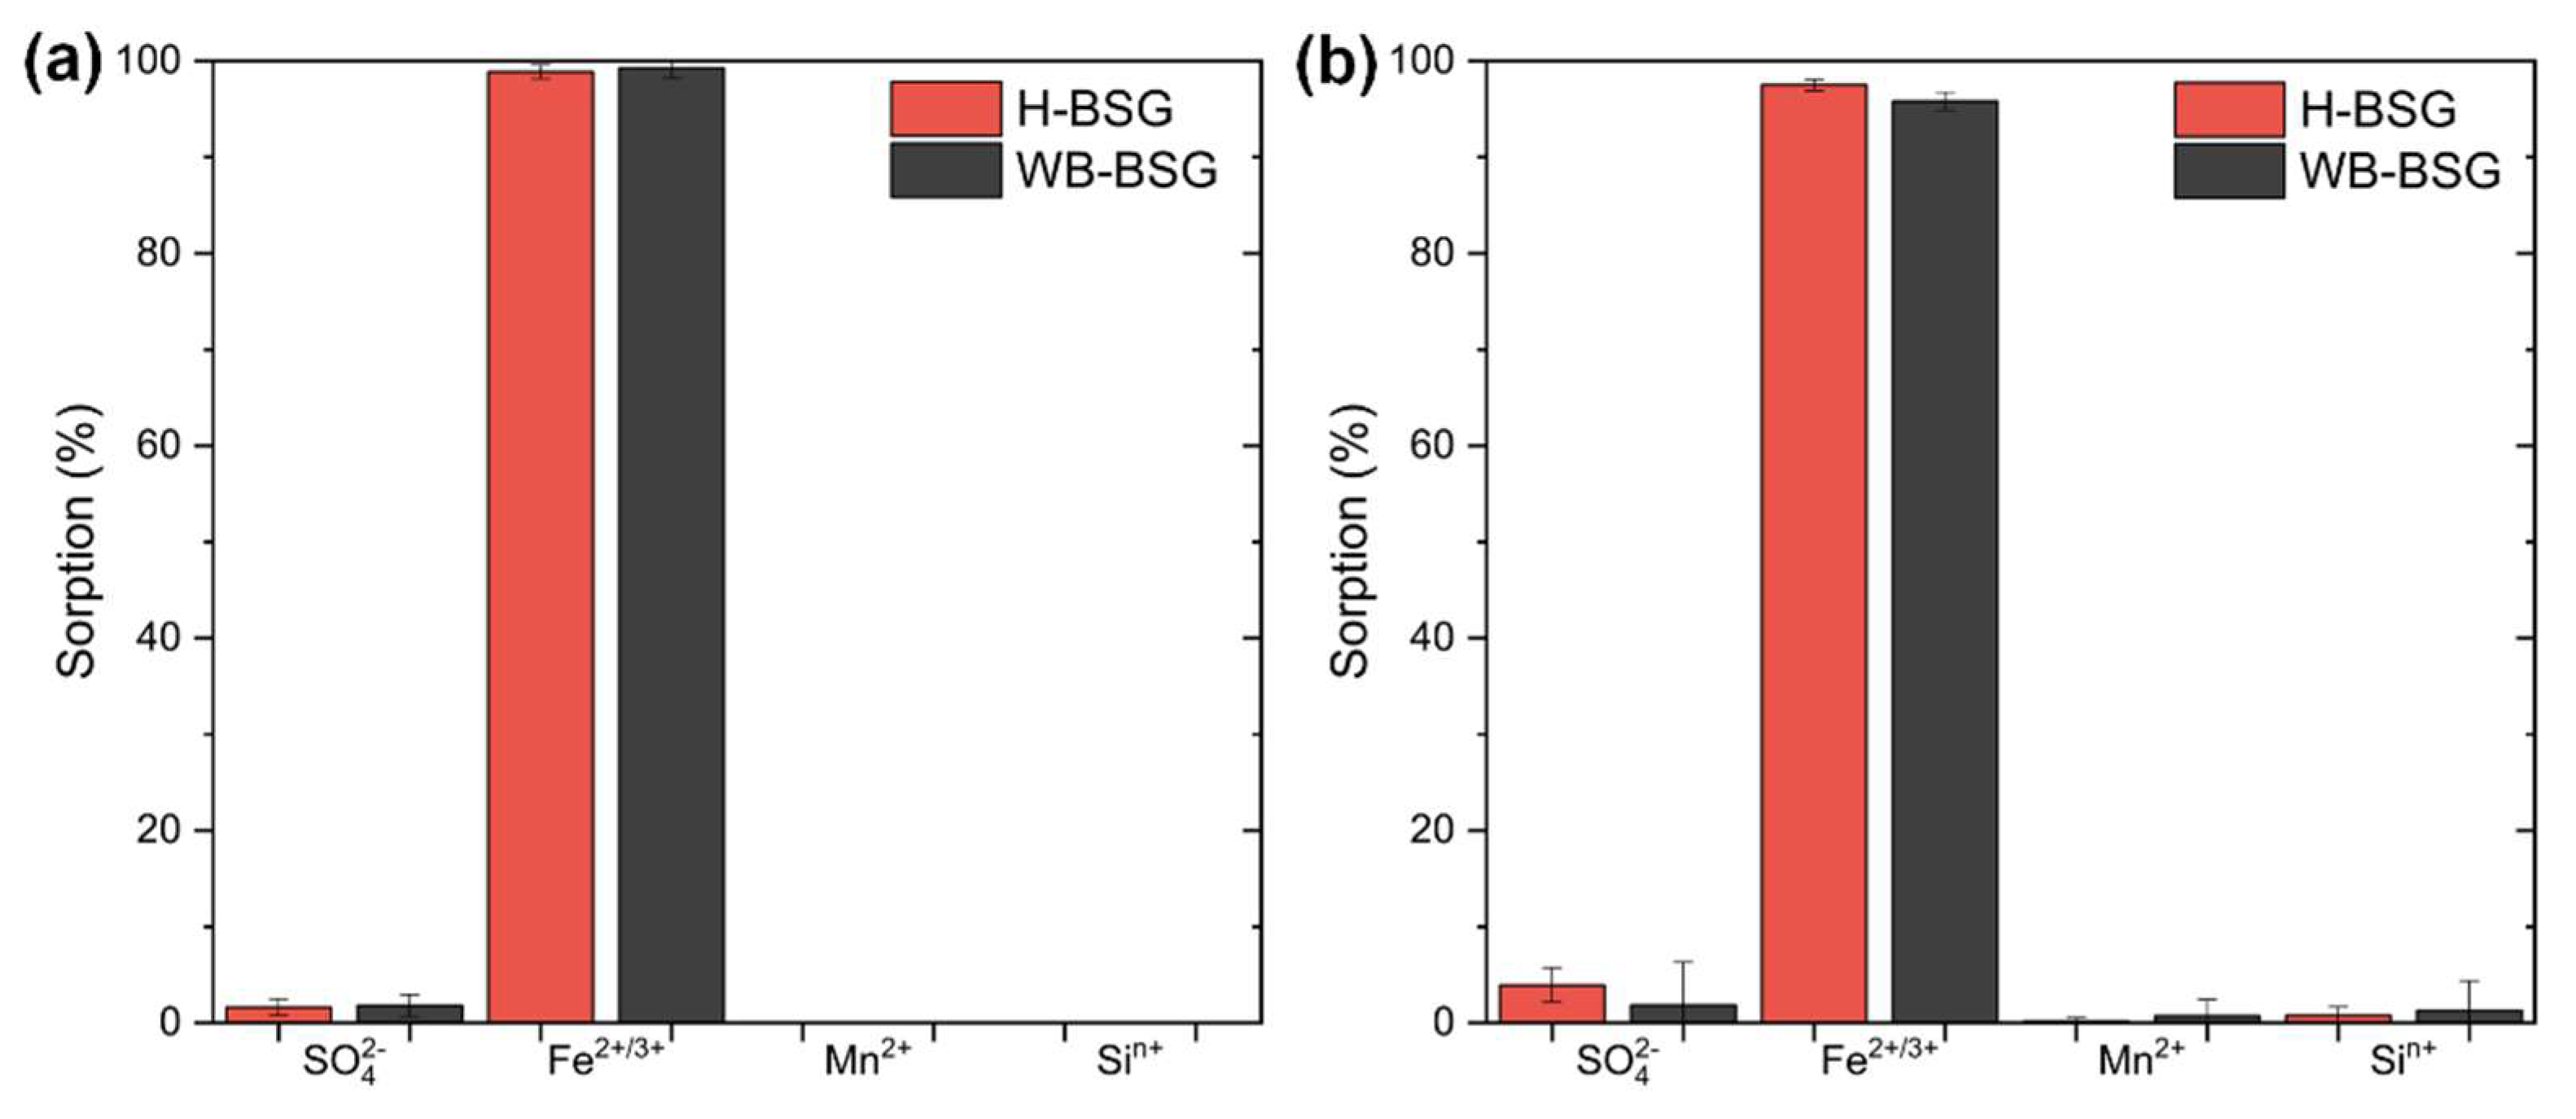
3.2.3. Batch Adsorption Experiments with Surface Water

To further push BSG towards application, adsorption properties from two real water samples originating from a German mining region were investigated. These samples were analyzed prior to adsorption (Table S10) and contained elevated levels of typical acid mine drainage pollutants. To meet the EU Water Framework Directive 2000/60/EC and to achieve a “good status” of the water quality, levels below 140 mg/L SO42− and ≤1.8 mg/L Fe are envisaged by the German surface water ordinance (OGewV) [53]. Sulfate (c0 = 1811 mg/L) in water sample 1 far exceeded this level. Iron ions in water sample 2 weere 50 times above the German guideline (c0 = 9 mg/L). Furthermore, the Mn2+ concentration in water sample 2 exceeded 6.6-fold the health-based value for manganese (0.4 mg/L) for drinking water set by WHO [5].
Despite the presence of the natural matrix, the batch experiments showed that the BSGs were able to efficiently remove Fe2+/3+ (<95%) from real water samples (see Figure 10, Table S10). After the adsorption process, the national guidelines for Fe2+/3+ were satisfied. Water sample 2 exhibited an initial pH of 3, where adsorption of Fe2+/3+ was beginning to be impaired (Figure 5). Nevertheless, the BSG was able to remove Fe2+/3 sufficiently. Consequently, this is a first proof of concept that BSG can indeed be used as an efficient adsorber for Fe2+/3+ in the presence of natural matrix with competing ions. Furthermore, the adsorption is effective in both, high (sample 2) and lower (sample 1) pollution levels, serving thereby as a link between the herein presented fundamental study towards future studies aiming at industrial applications.

4. Conclusions

In conclusion, BSG, as an abundantly available, cheap, and eco-friendly material, has proven itself as an efficient adsorber for heavy metal ion pollution. Our study shows not only the efficient removal of acid mine drainage specific pollutants, i.e., Fe and Mn, by reaching acceptable levels in real water samples, but that BSG is also capable of adsorbing other metal ions (Cd and Ni), thereby, proving its general applicability as an adsorber material. The BSG from wheat beer (WB-BSG), especially, consistently showed significantly higher adsorption efficiency, which we attribute to nature from the additional wheat grain content offering additional adsorption sides. Thus, WB-BSG yielded an outstanding adsorption performance for iron ions of 0.2 mmol/g, and of 0.1 mmol/g for manganese, cadmium, and nickel ions. As a result, the adsorption behavior of BSG types differs, despite almost identical chemistry, as shown by our comprehensive characterization, but still both investigated BSGs were able to purify these waters to reach acceptable levels of cleanness, as defined be official regulations. Further, elemental mapping revealed that all subcomponents of BSG contributed to the adsorption process, as observable by the homogeneous distribution of pollutants after adsorption. As a consequence, environmental pollution can be tackled by exploiting BSG as a natural adsorbent, while simultaneously the waste of resources in the brewery industry is reused and reduced.

Supplementary Materials

The following supporting information can be downloaded at: https://0-www-mdpi-com.brum.beds.ac.uk/article/10.3390/polysaccharides3020021/s1. References [54,55,56,57,58,59,60,61,62,63,64,65,66,67,68,69,70,71,72,73,74,75] are cited in the supplementary materials. Figure S1. Nitrogen sorption isotherm at 77 K of WB-BSG (grey) and H-BSG (red), desorption denoted by hollow symbols.; Figure S2. CO2 sorption isotherm at 273 K of WB-BSG (grey) and H-BSG (red), desorption denoted by hollow symbols.; Figure S3. H-BSG Map A prior adsorption SEM-EDX elemental mapping, all scale bars = 50 µm. Subfigure A SEM micrograph with mapped area (Map A) highlighted as blue rectangles. Subfigures: A1 carbon mapping; A2 oxygen mapping; A3 calcium mapping; A4 magnesium mapping; A5 phosphorus mapping; data summarized in Table S4.; Figure S4. H-BSG Map B prior to adsorption SEM-EDX analysis. Subfigure B showing SEM micrograph, area mapped as Map B highlighted as blue rectangles and magnified as insert. Subfigure B1 carbon mapping; subfigure B2 oxygen mapping; subfigure B3 silicon mapping; data summarized in Table S4.; Figure S5. SEM-EDX elemental mapping of WB-BSG pre-adsorption, all scale bars = 200 µm. Subfigures A and B are SEM micrographs, blue rectangles highlighted mapped areas Map A and Map B. Subfigure X1 carbon mapping; Subfigure X2 oxygen mapping; Subfigure X3 phosphorus mapping; data summarized in Table S5.; Figure S6. pH values before (pH0) and after (pHeq) adsorption in kinetic experiments with (a) FeSO4 and (b) MnSO4 solutions onto H-BSG and WB-BSG. From batch experiments with c0 = 0.36 mmol/L Fe2+/3+ or Mn2+, a BSG dosage of 3.33 g/L, stirred at r.t. and measured at respective times.; Figure S7. Removal rate for Fe2+/3+ and Mn2+ ions by adsorption onto H-BSG and WB-BSG, obtained from batch experiments with constant BSG dosage (3.33 g/L) and varying initial concentration of FeSO4 or MnSO4 for 24 h at r.t..; Figure S8. Changes of pH values throughout adsorption isotherm experiments with (a) FeSO4 and (b) MnSO4 solutions onto H-BSG and WB-BSG in batch experiments with constant dosage of adsorber material (3.33 g/L), varying initial concentrations FeSO4, pH not adjusted 24 h, r.t.; Figure S9. Curve fitting of different isotherm models onto Fe2+/3+ ion adsorption onto H-BSG and WB-BSG in batch experiments with constant dosage of adsorber material (3.33 g/L), varying initial concentrations FeSO4, pH not adjusted 24 h, r.t.; Figure S10. Curve fitting of different isotherm models onto Mn2+ ion adsorption onto H-BSG and WB-BSG in batch experiments with constant dosage of adsorber material (3.33 g/L), varying initial concentrations MnSO4, pH not adjusted 24 h, r.t.; Figure S11. SEM-EDX elemental mapping of H-BSG after adsorption in batch experiments with FeSO4 (2.68 mmol/L), 24 h at 23 °C. Top: regions selected for mapping highlighted as blue rectangles, map A and map B shown below. All subfigure scale bars represent 100 µm. Subfigure: Selected element mappings A1 and B1 iron; A2 carbon, B2 sulfur; A3 calcium; B3 silicon; data summarized in Table S8.; Figure S12. SEM-EDX elemental mapping of WB-BSG after adsorption in batch experiments with FeSO4 (2.68 mmol/L), 24 h at 23 °C, all EDX scale bars = 50 µm. Subfigures A and B are SEM micrographs, blue rectangles in A highlight mapped area Map A. Subfigures show selected element mappings: A1 and B1 carbon; A2 and B2 oxygen; A3 and B3 iron; A4 phosphorus; B4 silicon; data summarized in Table S8.; Figure S13. SEM-EDX elemental mapping of H-BSG after adsorption in batch experiments with MnSO4 (2.91 mmol/L), 24 h at 23 °C, universal scale bars = 100 µm. Subfigures A and B are SEM micrographs of mapped areas. Subfigures show selected element mappings: A1 und B1 carbon; A2 und B2 manganese; A3 sulphur; B3 silicon; data summarized in Table S9.; Figure S14. SEM-EDX elemental mapping of WB-BSG after adsorption in batch experiments with MnSO4 (2.73 mmol/L), 24 h at 23 °C, universal scale bars = 50 µm. Subfigures A and B are SEM micrographs of mapped areas. Subfigures show selected element mappings: A1 und B1 carbon; A2 und B2 manganese; A3 sulphur; B3 silicon; data summarized in Table S9.; Figure S15. Example photograph of the state of German surface waters in mine drainage regions (real water sample 2).; Figure S16. Adsorption in % for Ni2+ and SO42− ions with H-BSG and WB-BSG, obtained from batch experiments and stirred for 24 h.; Figure S17. pH values before (pH0) and after (pHeq) for the adsorption of Ni2+ and SO42− ions onto H-BSG and WB-BSG, obtained from batch experiments, stirred 24 h and pH not adjusted.; Figure S18. Curve fitting of different isotherm models onto Ni2+ adsorption onto H-BSG (red) and WB-BSG (grey) in batch experiments.; Figure S19. SEM-EDX elemental mapping of H-BSG after adsorption in batch experiments with NiSO4 (2.5 mmol/L), 24 h at 23 °C, universal scale bars = 50 µm. Subfigures A and B are SEM micrographs of mapped areas. Subfigures show selected element mappings: A1 and B1 carbon; A2 nitrogen and B2 silicon; A3 and B3 sulphur and A4 and B4 nickel.; Figure S20. SEM-EDX elemental mapping of WB-BSG after adsorption in batch experiments with NiSO4 (2.5 mmol/L), 24 h at 23 °C, universal scale bars = 50 µm. Subfigures A and B are SEM micrographs of mapped areas. Subfigures show selected element mappings: A1 and B1 carbon; A2 and B2 nitrogen, A3 and B3 sulphur and A4 and B4 nickel.; Figure S21. Adsorption in % for Cd2+ and SO42− ions with H-BSG and WB-BSG, obtained from batch experiments and stirred for 24 h.; Figure S22. pH values before (pH0) and after (pHeq) for the adsorption of Cd2+ and SO42− ions onto H-BSG and WB-BSG, obtained from batch experiments, stirred 24 h and pH not adjusted.; Figure S23. Curve fitting of different isotherm models onto Cd2+ ion adsorption onto H-BSG (red) and WB-BSG (grey) in batch experiments. Isotherm model fitting for CdSO4 and NiSO4; Figure S24. SEM-EDX elemental mapping of H-BSG after adsorption in batch experiments with CdSO4 (2.7 mmol/L), 24 h at 23 °C, universal scale bars = 50 µm. Subfigures A and B are SEM micrographs of mapped areas. Subfigures show selected element mappings: A1 and B1 carbon; A2 and B2 silicon; A3 and B3 sulphur and A4 and B4 cadmium.; Figure S25. SEM-EDX elemental mapping of WB-BSG after adsorption in batch experiments with CdSO4 (2.7 mmol/L), 24 h at 23 °C, universal scale bars = 50 µm. Subfigures A and B are SEM micrographs of mapped areas. Subfigures show selected element mappings: A1 and B1 carbon; A2 calcium and B2 phosphorus; A3 and B3 sulphur and A4 and B4 cadmium.; Table S1. Measurements of charge densities (q) at pH values 3, 5.5, and 7 of H-BSG and WB-BSG. Vused Volumes of Polyelectrolyte (poly(sodium ethylenesulfonate) (PES-Na) solution or poly(diallyldimethylammonium chloride) (PDADMAC)) used until point of zero charge.; Table S2. Moisture analysis performed at 110 °C until mass was constant.; Table S3. Relative elemental content of BSG and comparison to literature.; Table S4. Elemental concentration as percentages detected in two areas of H-BSG prior to adsorption. Selected areas are Map A of Figure S4 and Map B of Figure S5.; Table S5. Elemental concentration as percentages detected in two areas of WB-BSG prior to adsorption. Selected areas Map A and B shown in Figure S6.; Table S6. Parameters for linear fitting shown in Figure 6.; Table S7. Fitting parameters for different adsorption isotherm models. Data from batch experiments; constant dosage of H-BSG or WB-BSG 3.33 g/L, varying initial concentrations FeSO4 or MnSO4, pH not adjusted, 24 h, r.t.; Table S8. Elemental concentration as percentages detected on BSG surface after adsorption in batch experiments with FeSO4 (2.68 mmol/L), 24 h at 23 °C. Investigated in two areas (map A and map B) of H-BSG Figure S and WB-BSG (Figure S).; Table S9. Elemental concentration as percentages detected on BSG surface after adsorption in batch experiments with MnSO4 (H-BSG: 2.91 mmol/L; WB-BSG 2.73 mmol/L), 24 h at 23 °C. Investigated in two areas (map A and map B) of H-BSG (Figure S) and WB-BSG (Figure S).; Table S10. Initial concentrations c0 of selected pollutants in 2 water samples from German surface waters and sorption efficiency by H-BSG and WB-BSG given as averages of six batches with standard deviation. Batch experiments performed with real water, 3.33 g/L dosage of H-BSG or WB-BSG for 24 h at r.t.; Table S11. Elemental concentration as percentages detected on BSG surface after adsorption in batch experiments with NiSO4 (H-BSG: 2.5 mmol/L; WB-BSG 2.5 mmol/L), 24 h at 23 °C. Investigated in two areas (map A and map B) of H-BSG (Figure S) and WB-BSG (Figure S20.).; Table S12. Comparison fitting parameters for different adsorption isotherm models, values for Table S13. Elemental concentration as percentages detected on BSG surface after adsorption in batch experiments with CdSO4 (H-BSG: 2.7 mmol/L; WB-BSG 2.7 mmol/L), 24 h at 23 °C. Investigated in two areas (map A and map B) of H-BSG (Figure S24) and WB-BSG (Figure S25).; Table S14. Sorption capacities for Fe2+/3+ removal from aqueous solutions with different biosorbents and adsorbent doses (a.d.). The obtained sorption capacities from this work were achieved in the batch adsorption experiments.; Table S15. Sorption capacities for Mn1+/2+ removal from aqueous solutions with different biosorbents and adsorbent doses (a.d.). The obtained sorption capacities from this work were achieved in the batch adsorption experiments.; Table S16. Sorption capacities for Ni2+ removal from aqueous solutions with different biosorbents and adsorbent doses (a.d.). The obtained sorption capacities from this work were achieved in the batch adsorption experiments.

Author Contributions

Formal analysis, E.G.H., K.H.C., C.S. and K.B.L.B.; investigation, K.H.C. and E.G.H.; resources, D.B.; writing—original draft preparation, E.G.H., D.S., M.M. and K.H.C.; writing—review and editing, D.B., C.S., S.S., K.B.L.B. and B.R.; visualization, E.G.H., D.S., K.H.C. and B.R.; supervision, S.S., K.G. and D.S.; project administration, S.S. and K.G.; funding acquisition, S.S. and K.G. All authors have read and agreed to the published version of the manuscript.

Funding

The authors gratefully acknowledge the support received from the funding organizations of the German Federal Ministry for Economic Affairs and Energy through the Arbeitsgemeinschaft Industrieller Forschungsvereinigungen, “Otto von Guericke” e.V. in the cooperative project (IPF-TUM) entitled “Bio-adsorber aus Brauereireststoffen zur Schwermetallionenabtrennung-BioAd” (AiF no 20879).

Data Availability Statement

The data presented in this study are based on the researched results and are available upon request from the authors.

Acknowledgments

The authors thank the Weihenstephan Brewery, Freising, Germany, for the support of the materials and discussions and cooperation. The authors also thankfully acknowledge the conduction of elemental analysis by Eileen Schierz.

Conflicts of Interest

The authors declare no conflict of interest.

References

  1. Rodríguez-Galán, M.; Baena-Moreno, F.M.; Vázquez, S.; Arroyo-Torralvo, F.; Vilches, L.F.; Zhang, Z. Remediation of acid mine drainage. Environ. Chem. Lett. 2019, 17, 1529–1538. [Google Scholar] [CrossRef]
  2. Neculita, C.M.; Rosa, E. A review of the implications and challenges of manganese removal from mine drainage. Chemosphere 2019, 214, 491–510. [Google Scholar] [CrossRef]
  3. Johnson, D.B.; Hallberg, K.B. Acid mine drainage remediation options: A review. Sci. Total Environ. 2005, 338, 3–14. [Google Scholar] [CrossRef]
  4. Wisotzky, F.; Obermann, P. Acid mine groundwater in lignite overburden dumps and its prevention—the Rhineland lignite mining area (Germany). Ecol. Eng. 2001, 17, 115–123. [Google Scholar] [CrossRef]
  5. World Health Organization. Guidelines for Drinking-Water Quality; World Health Organization: Geneva, Switzerland, 2011. [Google Scholar]
  6. Viadero, R.C.; Zhang, S.; Hu, X.; Wei, X. Mine drainage: Remediation technology and resource recovery. Water Environ. Res. 2020, 92, 1533–1540. [Google Scholar] [CrossRef]
  7. Corral-Bobadilla, M.; González-Marcos, A.; Alba-Elías, F.; Diez de Santo Domingo, E. Valorization of bio-waste for the removal of aluminum from industrial wastewater. J. Clean. Prod. 2020, 264, 121608. [Google Scholar] [CrossRef]
  8. Kaveeshwar, A.R.; Sanders, M.; Ponnusamy, S.K.; Depan, D.; Subramaniam, R. Chitosan as a biosorbent for adsorption of iron (II) from fracking wastewater. Polym. Adv. Technol. 2018, 29, 961–969. [Google Scholar] [CrossRef]
  9. Fontana, I.B.; Peterson, M.; Cechinel, M.A.P. Application of brewing waste as biosorbent for the removal of metallic ions present in groundwater and surface waters from coal regions. J. Environ. Chem. Eng. 2018, 6, 660–670. [Google Scholar] [CrossRef]
  10. Sapci-Ayas, Z. Investigation of Direct Applicability of Modified Agricultural Waste for Contaminant Removal from Real Textile Wastewater. Water 2021, 13, 1354. [Google Scholar] [CrossRef]
  11. Charazińska, S.; Lochyński, P.; Burszta-Adamiak, E. Removal of heavy metal ions form acidic electrolyte for stainless steel electropolishing via adsorption using Polish peats. J. Water Process. Eng. 2021, 42, 102169. [Google Scholar] [CrossRef]
  12. Adekola, F.A.; Hodonou, D.S.S.; Adegoke, H.I. Thermodynamic and kinetic studies of biosorption of iron and manganese from aqueous medium using rice husk ash. Appl. Water Sci. 2016, 6, 319–330. [Google Scholar] [CrossRef] [Green Version]
  13. Feizi, M.; Jalali, M. Removal of heavy metals from aqueous solutions using sunflower, potato, canola and walnut shell residues. J. Taiwan Inst. Chem. Eng. 2015, 54, 125–136. [Google Scholar] [CrossRef]
  14. Vaghetti, J.C.P.; Lima, E.C.; Royer, B.; da Cunha, B.M.; Cardoso, N.F.; Brasil, J.L.; Dias, S.L.P. Pecan nutshell as biosorbent to remove Cu(II), Mn(II) and Pb(II) from aqueous solutions. J. Hazard. Mater. 2009, 162, 270–280. [Google Scholar] [CrossRef]
  15. Corral Bobadilla, M.; Lostado Lorza, R.; Somovilla Gómez, F.; Escribano García, R. Adsorptive of Nickel in Wastewater by Olive Stone Waste: Optimization through Multi-Response Surface Methodology Using Desirability Functions. Water 2020, 12, 1320. [Google Scholar] [CrossRef]
  16. Corral-Bobadilla, M.; Lostado-Lorza, R.; Somovilla-Gómez, F.; Escribano-García, R. Effective use of activated carbon from olive stone waste in the biosorption removal of Fe(III) ions from aqueous solutions. J. Clean. Prod. 2021, 294, 126332. [Google Scholar] [CrossRef]
  17. Borchert, K.B.L.; Boughanmi, R.; Reis, B.; Zimmermann, P.; Steinbach, C.; Graichen, P.; Svirepa, A.; Schwarz, J.; Boldt, R.; Schwarz, S.; et al. Removal of Lead, Cadmium, and Aluminum Sulfate from Simulated and Real Water with Native and Oxidized Starches. Polysaccharides 2021, 2, 429–453. [Google Scholar] [CrossRef]
  18. Weißpflog, J.; Boldt, R.; Kohn, B.; Scheler, U.; Jehnichen, D.; Tyrpekl, V.; Schwarz, S. Investigation of mechanisms for simultaneous adsorption of iron and sulfate ions onto chitosan with formation of orthorhombic structures. Colloids Surf. A Physicochem. Eng. Asp. 2020, 592, 124575. [Google Scholar] [CrossRef]
  19. Weißpflog, J.; Gündel, A.; Vehlow, D.; Steinbach, C.; Müller, M.; Boldt, R.; Schwarz, S.; Schwarz, D. Solubility and Selectivity Effects of the Anion on the Adsorption of Different Heavy Metal Ions onto Chitosan. Molecules 2020, 25, 2482. [Google Scholar] [CrossRef]
  20. Akinpelu, E.A.; Fosso-Kankeu, E.; Waander, F. Biosorption of Fe (II) from Aqueous Solution by Brewing Waste: Equilibrium and Kinetic Studies. J. Water Environ. Technol. 2019, 17, 180–193. [Google Scholar] [CrossRef] [Green Version]
  21. Izinyon, O.C.; Nwosu, O.E.; Akhigbe, L.; Ilaboya, I.R. Performance Evaluation of Fe (III) Adsorption onto Brewers’ Spent Grain. Niger. J. Technol. 2016, 35, 970–978. [Google Scholar] [CrossRef] [Green Version]
  22. World Health Organization. Global Status Report on Alcohol and Health 2018; World Health Organization: Genève, Switzerland, 2019; p. 472. [Google Scholar]
  23. Dunkel, S. Biertreber. Wertvolles heimisches Eiweißfutter für Rinder. Thüringer Landesanstalt für Landwirtschaft. 2015. Available online: https://www.tll.de/www/daten/publikationen/merkblaetter/mb_biertr.pdf (accessed on 11 April 2022).
  24. Su, Y.; Böhm, W.; Wenzel, M.; Paasch, S.; Acker, M.; Doert, T.; Brunner, E.; Henle, T.; Weigand, J.J. Mild hydrothermally treated brewer’s spent grain for efficient removal of uranyl and rare earth metal ions. RSC Adv. 2020, 10, 45116–45129. [Google Scholar] [CrossRef]
  25. Wierzba, S.; Klos, A. Heavy metal sorption in biosorbents—Using spent grain from the brewing industry. J. Clean. Prod. 2019, 225, 112–120. [Google Scholar] [CrossRef]
  26. Zhang, Y.; Luo, X.; Lin, X.; Huang, S. A sorbent based on liquor distillers’ grains for the removal of Pb(II) and Cr(III) from aqueous solution. Procedia Environ. Sci 2016, 31, 785–794. [Google Scholar] [CrossRef] [Green Version]
  27. Sillerová, H.; Komárek, M.; Chrastný, V.; Novák, M.; Vaněk, A.; Drábek, O. Brewers draff as a new low-cost sorbent for chromium (VI): Comparison with other biosorbents. J. Colloid Interface Sci. 2013, 396, 227–233. [Google Scholar] [CrossRef]
  28. Kim, T.Y.; Park, S.K.; Cho, S.Y.; Kim, H.B.; Kang, Y.; Kim, S.D.; Kim, S.J. Adsorption of heavy metals by brewery biomass. Korean J. Chem. Eng. 2005, 22, 91–98. [Google Scholar] [CrossRef]
  29. Lagergren, S. Ueber die Dämpfung electrischer Resonatoren. Ann. Phys. 1898, 300, 290–314. [Google Scholar] [CrossRef] [Green Version]
  30. Ho, Y.S.; McKay, G. Pseudo-second order model for sorption processes. Process. Biochem. 1999, 34, 451–465. [Google Scholar] [CrossRef]
  31. Weber, W.J.; Morris, J.C. Kinetics of Adsorption on Carbon from Solution. J. Sanit. Eng. Div. 1963, 89, 31–59. [Google Scholar] [CrossRef]
  32. Langmuir, I. The constitution and fundamental properties of solids and liquids. Part I. Solids. J. Am. Chem. Soc. 1916, 38, 2221–2295. [Google Scholar] [CrossRef] [Green Version]
  33. Freundlich, H. Über die Adsorption in Lösungen. Z. Phys. Chem. 1907, 57U, 385–470. [Google Scholar] [CrossRef]
  34. Sips, R. On the Structure of a Catalyst Surface. J. Chem. Phys. 1948, 16, 490–495. [Google Scholar] [CrossRef]
  35. Elovich, S.Y.H. International Congress of Surface Activity. In Proceedings of the Second International Congress on Surface Activity; Academic Press Inc.: New York, NY, USA, 1959. [Google Scholar]
  36. Elovich, S.Y.; Larinov, O. Theory of adsorption from solutions of non electrolytes on solid (I) equation adsorption from solutions and the analysis of its simplest form,(II) verification of the equation of adsorption isotherm from solutions. Otd. Khim. Nauk Izv. Akad. Nauk. SSSR 1962, 2, 209–216. [Google Scholar]
  37. Dubinin, M.M. The Equation of the Characteristic Curve of Activated Charcoal. Dokl. Akad. Nauk. SSSR 1947, 55, 327–329. [Google Scholar]
  38. Zhou, X. Correction to the calculation of Polanyi potential from Dubinnin-Rudushkevich equation. J. Hazard. Mater. 2020, 384, 121101. [Google Scholar] [CrossRef]
  39. Liu, Y. Is the Free Energy Change of Adsorption Correctly Calculated? J. Chem. Eng. Data 2009, 54, 1981–1985. [Google Scholar] [CrossRef]
  40. Ferraz, A.; Amorim, C.; Tavares, T.; Teixeira, J. Chromium(III) biosorption onto spent grains residual from brewing industry: Equilibrium, kinetics and column studies. Int. J. Environ. Sci. Technol. 2014, 12, 1591–1602. [Google Scholar] [CrossRef] [Green Version]
  41. Li, Q.; Chai, L.; Yang, Z.; Wang, Q. Kinetics and thermodynamics of Pb(II) adsorption onto modified spent grain from aqueous solutions. Appl. Surf. Sci. 2009, 255, 4298–4303. [Google Scholar] [CrossRef]
  42. Coronado, M.A.; Montero, G.; Montes, D.G.; Valdez-Salas, B.; Ayala, J.R.; García, C.; Carrillo, M.; León, J.A.; Moreno, A. Physicochemical Characterization and SEM-EDX Analysis of Brewer’s Spent Grain from the Craft Brewery Industry. Sustainability 2020, 12, 7744. [Google Scholar] [CrossRef]
  43. Karlović, A.; Jurić, A.; Ćorić, N.; Habschied, K.; Krstanović, V.; Mastanjević, K. By-Products in the Malting and Brewing Industries—Re-Usage Possibilities. Fermentation 2020, 6, 82. [Google Scholar] [CrossRef]
  44. Huige, N. Handbook of Brewing; Priest, F.G., Ed.; CRC Press: Boca Raton, FL, USA, 2006. [Google Scholar]
  45. Kumar, S.; Soukup, M.; Elbaum, R. Silicification in Grasses: Variation between Different Cell Types. Front. Plant. Sci. 2017, 8, 438. [Google Scholar] [CrossRef] [Green Version]
  46. Wu, Y.; Hu, Y.; Xie, Z.; Feng, S.; Li, B.; Mi, X. Characterization of biosorption process of acid orange 7 on waste brewery’s yeast. Appl. Biochem. Biotechnol. 2011, 163, 882–894. [Google Scholar] [CrossRef] [PubMed]
  47. Simonin, J.-P. On the comparison of pseudo-first order and pseudo-second order rate laws in the modeling of adsorption kinetics. Chem. Eng. J. 2016, 300, 254–263. [Google Scholar] [CrossRef] [Green Version]
  48. Wang, J.; Guo, X. Adsorption kinetic models: Physical meanings, applications, and solving methods. J. Hazard. Mater. 2020, 390, 122156. [Google Scholar] [CrossRef] [PubMed]
  49. Boyd, G.E.; Adamson, A.W.; Myers, L.S. The Exchange Adsorption of Ions from Aqueous Solutions by Organic Zeolites. II. Kinetics. J. Am. Chem. Soc. 1947, 69, 2836–2848. [Google Scholar] [CrossRef]
  50. Wang, J.; Guo, X. Adsorption isotherm models: Classification, physical meaning, application and solving method. Chemosphere 2020, 258, 127279. [Google Scholar] [CrossRef]
  51. Shannon, R.D. Revised effective ionic radii and systematic studies of interatomic distances in halides and chalcogenides. Acta Crystallogr. 1976, 5, 751–767. [Google Scholar] [CrossRef]
  52. Richens, D.T. The Chemistry of Aqua Ions: Synthesis, Structure and Reactivity: A Tour Through the Periodic Table of the Elements; Wiley: Hoboken, NJ, USA, 1997. [Google Scholar]
  53. Federal Ministry for the Environment. Verordnung zum Schutz der Oberflächengewässer (Oberflächengewässerverordnung—OGewV) Anlage 7 (zu § 5 Absatz 4 Satz 2); Fundstelle: Anlage 7 (zu § 5 Absatz 4 Satz 2); BMU: Berlin, Germany, 20 July 2016. [Google Scholar]
  54. Khidzir, K.M.; Abdullah, N.; Agamuthu, P. Brewery Spent Grain: Chemical Characteristics and utilization as an Enzyme Substrate. Malaysian J. Sci. 2010, 29, 41–51. [Google Scholar] [CrossRef]
  55. Ahmad, A.; Bhat, A.H.; Buang, A. Biosorption of transition metals by freely suspended and Ca-alginate immobilised with Chlorella vulgaris: Kinetic and equilibrium modeling. J. Cleaner Prod. 2018, 171, 1361–1375. [Google Scholar] [CrossRef]
  56. Moreno-Piraján, J.C.; Garcia-Cuello, V.S.; Giraldo, L. The removal and kinetic study of Mn, Fe, Ni and Cu ions from wastewater onto activated carbon from coconut shells. Adsorption 2010, 505–514. [Google Scholar] [CrossRef]
  57. Moreno, J.C.; Gómez, R.; Giraldo, L. Removal of Mn, Fe, Ni and Cu Ions from Wastewater Using Cow Bone Charcoal. Materials 2010, 3, 452–466. [Google Scholar] [CrossRef] [Green Version]
  58. Esfandiar, N.; Nasernejad, B.; Ebadi, T. Removal of Mn(II) from groundwater by sugarcane bagasse and activated carbon (a comparative study): Application of response surface methodology (RSM). J. Ind. Eng. Chem. 2014, 20, 3726–3736. [Google Scholar] [CrossRef]
  59. Veglió, F.; Beolchini, F.; Gasbarro, A. Biosorption of toxic metals: An equilibrium study using free cells of Arthrobacter sp. Process Biochem. 1997, 32, 99–105. [Google Scholar] [CrossRef]
  60. Fernández-González, R.; Martín-Lara, M.A.; Iáñez-Rodríguez, I.; Calero, M. Removal of heavy metals from acid mining effluents by hydrolyzed olive cake. Bioresour. Technol. 2018, 268, 169–175. [Google Scholar] [CrossRef] [PubMed]
  61. Anguile, J.J.; Ona-Mbega, M.; Makani, T.; Ketcha-Mbadcam, J. Adsorption of manganese (II) ions from aqueous solution on to volcanic ash and geopolymer based volcanic ash. Int. J. Basic Appl. Chem. Sci. 2013, 3, 7–18. [Google Scholar]
  62. Kara, I.; Tunc, D.; Sayin, F.; Akar, S.T. Study on the performance of metakaolin based geopolymer for Mn(II) and Co(II) removal. Appl. Clay Sci. 2018, 161, 184–193. [Google Scholar] [CrossRef]
  63. Yang, X.; Zhou, T.; Ren, B.; Hursthouse, A.; Zhang, Y. Removal of Mn (II) by Sodium Alginate/Graphene Oxide Composite Double-Network Hydrogel Beads from Aqueous Solutions. Sci. Rep. 2018, 8, 10717. [Google Scholar] [CrossRef] [PubMed] [Green Version]
  64. Kemik, Ö.; Ngwabebhoh, F.A.; Yildiz, U. A response surface modelling study for sorption of Cu2+, Ni2+, Zn2+ and Cd2+ using chemically modified poly(vinylpyrrolidone) and poly(vinylpyrrolidone-co-methylacrylate) hydrogels. Adsorption Sci. Technol. 2016, 35, 263–283. [Google Scholar] [CrossRef]
  65. Wu, F.-C.; Tseng, R.-L.; Juang, R.-S. A review and experimental verification of using chitosan and its derivatives as adsorbents for selected heavy metals. J. Environ. Manag. 2010, 798–806. [Google Scholar] [CrossRef]
  66. Reis, B.; Gerlach, N.; Steinbach, C.; Haro Carrasco, K.; Oelmann, M.; Schwarz, S.; Müller, M.; Schwarz, D. A Complementery und Revised View on the N-Acylation of Chitosan with Hexanoyl Chloride. Mar. Drugs 2021, 19, 385. [Google Scholar] [CrossRef]
  67. Rao, K.S.; Anand, S.; Venkateswarlu, P. Adsorption of Cadmium from Aqueous Solution by Ficus religiosa Leaf Powder and Characterization of Loaded Biosorbent. Clean Soil Air Water 2011, 39, 384–391. [Google Scholar] [CrossRef]
  68. Kobya, M.; Demirbas, E.; Senturk, E.; Ince, M. Adsorption of heavy metal ions from aqueous solutions by activated carbon prepared from apricot stone. Bioresour. Technol. 2005, 96, 1518–1521. [Google Scholar] [CrossRef] [PubMed]
  69. Li, W.; Liao, X.; Wang, L.; Huang, Z. Adsorption of cadmium and lead in wastewater by four kinds of biomass xanthates. Water Sci. Technol. 2019, 79, 1222–1230. [Google Scholar] [CrossRef] [PubMed]
  70. Wang, Z.; Zhang, X.; Wu, X.; Yu, J.-G.; Jiang, X.-Y.; Wu, Z.-L.; Hao, X. Soluble starch functionalized graphene oxide as an efficient adsorbent for aqueous removal of Cd(II): The adsorption thermodynamic, kinetics and isotherms. J. Sol-Gel Sci. Technol. 2017, 82, 440–449. [Google Scholar] [CrossRef]
  71. Chen, Y.X.; Zhong, B.H.; Fang, W. Adsorption characterization of lead(II) and cadmium(II) on crosslinked carboxymethyl starch. J. Appl. Polym. Sci. 2011, 124, 5010–5020. [Google Scholar] [CrossRef]
  72. Ghiorghita, C.-A.; Borchert, K.; Vasiliu, A.-L.; Zaharia, M.-M.; Schwarz, D.; Mihai, M. Porous thiourea-grafted-chitosan hydrogels: Synthesis and sorption of toxic metal ions from contaminated waters. Colloids Surfaces A 2020, 607, 125504. [Google Scholar] [CrossRef]
  73. Dzul Erosa, M.S.; Saucedo Medina, T.I.; Navarro Mendoza, R.; Avila Rodriguez, M.; Guibal, E. Cadmium sorption on chitosan sorbents: Kinetic and equilibrium studies. Hydrometallurgy 2001, 61, 157–167. [Google Scholar] [CrossRef]
  74. Vilela, P.; Matias, C.; Dalalibera, A.; Becegato, V.; Paulino, A. Polyacrylic Acid-Based And Chitosan-Based Hydrogels For Adsorption Of Cadmium: Equilibrium Isotherm, Kinetic and Thermodynamic Studies. J. Environ. Chem. Eng. 2019, 7, 103327. [Google Scholar] [CrossRef]
  75. Sharififard, H.; Shahraki, Z.; Rezvanpanah, E.; Rad, S. A Novel Natural Chitosan/Activated Carbon/Iron Bio-Nanocomposite: Sonochemical Synthesis, Characterization, And Application For Cadmium Removal In Batch And Continuous Adsorption Process. Bioresour. Technol. 2018, 270, 562–569. [Google Scholar] [CrossRef]
Figure 1. ATR-FTIR spectra of H-BSG (red) and WB-BSG (grey). Spectra were normalized to νas CH2 (2924 cm−1) and isolated by an offset. CH2 symmetric (2854 cm−1) and asymmetric (2924 cm−1) stretching vibration, overlapping stretching vibrations of primary alcohols, primary amines and Si-OH (3305 cm−1), carboxylic bands ν C=O (1741 cm−1) and ν COO– (1377 cm−1), amide I and II (1645 cm−1 and 1517 cm−1, respectively) phenolic C–C–O stretching vibrations (1239 cm−1), hydroxylic functionalities ν C–O (1156 cm−1) and stretching vibrations C–O–C (1035 cm−1).
Polysaccharides 03 00021 g001
Figure 2. Thermogravimetric analysis of H-BSG (red) and WB-BSG (grey) studied in the range from 30 °C to 1000 °C with a heating rate of 10 °C/min under (a) atmospheric conditions and (b) N2 at constant flow of 40 mL/min.
Polysaccharides 03 00021 g002
Figure 3. Images of WB-BSG (top row) and H-BSG (bottom row) at different magnifications (a) and (d) from conventional SLR camera; (bf) SEM images of two different magnifications.
Polysaccharides 03 00021 g003
Figure 4. Streaming potential and charge density for H-BSG (red) and WB-BSG (grey). The streaming potential (a) was measured as a function of the pH value and the z potential for H-BSG and WB-BSG was thus determined. The charge density values (b) as a function of pH are in Table 2.
Polysaccharides 03 00021 g004
Figure 5. Adsorption kinetics of Fe2+/3+ and Mn2+ onto H-BSG (red) and WB-BSG (grey). From batch experiments with c0 = 0.36 mmol/L Fe2+/3+ or Mn2+, a BSG dosage of 3.33 g/L, stirred at r.t. and measured at respective times. Curves present respective fitted kinetic models, model parameters given in Table 3. The respective pH values are given in Figure S6.
Polysaccharides 03 00021 g005
Figure 6. Adsorption kinetics of Fe2+/3+ and Mn2+ onto H-BSG and WB-BSG transformed as q vs. t1/2. From batch experiments with c0 = 0.36 mmol/L Fe2+/3+ or Mn2+, a BSG dosage of 3.33 g/L, stirred at r.t. and measured at respective times. Curves present respective fitted kinetic models, model parameters given in Table S6.
Polysaccharides 03 00021 g006
Figure 7. Influence of the initial pH on ions adsorbed onto BSG. (a) Metal ions Fe2+/3+ and Mn2+, (b) corresponding sulfate ions. Batch experiments performed with solutions of FeSO4 and MnSO4 (0.5 mmol/L) and 3.33 g/L dosage of H-BSG or WB-BSG for 24 h at r.t. The initial pH was adjusted with H2SO4(aq) and NaOH(aq), respectively.
Polysaccharides 03 00021 g007
Figure 8. Adsorption isotherms for (a) Fe2+/3+ and (b) Mn2+ onto H-BSG and WB-BSG, obtained from batch experiments with constant BSG dosage (3.33 g/L) and varying initial concentration of FeSO4 or MnSO4 for 24 h at r.t. Fitted Sips isotherm model is presented as dash-dotted line, curves of other fitted models are given in Figures S9 and S10.
Polysaccharides 03 00021 g008
Figure 9. Adsorption isotherms for (a) Ni2+ and (b) Cd2+ onto H-BSG (red) and WB-BSG (grey) obtained from batch experiments with constant BSG dosage (3.33 g/L) and varying initial concentration of NiSO4 or CdSO4 for 24 h at r.t. The fitted Sips isotherm model is a solid line and the pH values are in Figures S18 and S21.
Polysaccharides 03 00021 g009
Figure 10. Adsorption efficiency of different ions from real water samples onto BSG, averages of six batches with standard deviation as error bars. Batch experiments performed with real water samples from two locations (a,b) and 3.33 g/L dosage of H-BSG (red) or WB-BSG (grey) for 24 h at r.t. Real water (a) contained 18.850 mmol/L SO42−, 0.005 mmol/L Fe2+/3+, 0.002 mmol/L Mn2+, 0.176 mmol/L Si and had a pH0 from 6.98, while real water (b) had 3.958 mmol/L SO42−, 1.612 mmol/L Fe2+/3+, 0.048 mmol/L Mn2+, 2.182 mmol/L Si and a pH0 from 3.1. The exact numeric values can be seen in Table S10.
Polysaccharides 03 00021 g010
Table 1. Elemental analysis of Helles brewers’ spent grain (H-BSG, top) and wheat beer-BSG (WB-BSG, bottom).
SamplesC (wt.%)H (wt.%)N (wt.%)S (wt.%)Residue (wt.%)
H-BSG48.16.13.6n.a.142.2
WB-BSG47.66.23.7n.a.142.5
1 below limit of detection (LOD = 1 wt.%).
Table 2. Charge densities of BSG and other different biopolymers for comparison.
Charge Density in µeq/g
MaterialpH = 3pH = 5.5pH = 7
H-BSG+0.64−4.20−7.67
WB-BSG+0.54−1.09−2.46
Native wheat starch [17]+0.21−0.82 (at pH = 5.0)n.a.
Native corn starch [17]+0.10−0.28 (at pH = 5.0)n.a.
Chitosan+5907+5833+3486
Table 3. Fitting parameters for Fe2+/3+ and Mn2+ adsorption onto H-BSG and WB-BSG for different kinetic models. Data from batch experiments as presented in Figure 5.
Kinetic ModelFe2+/3+Mn2+
ParametersH-BSGWB-BSGH-BSGWB-BSG
Pseudo-First Order
qeq (mmol/g)0.1000.1010.0400.057
K1 (g/mmol∙h)0.9040.6912.4771.375
R20.900.830.530.47
Pseudo-Second Order
qeq (mmol/g)0.1070.1080.0410.061
K2 (g/mmol∙h)138.448115.854530.518186.752
R20.960.910.670.68
Intraparticle Diffusion
kWM(mmol/(g∙h1/2))0.0130.0130.0020.006
C (mmol/g)0.0440.0420.0320.034
R20.650.720.750.94
Table 4. Fitting parameters for Fe2+/3+ and Mn2+ adsorption onto H-BSG and WB-BSG for Sips, Langmuir, Freundlich, Elovich and Dubinin–Radushkevich isotherm models. Data from batch experiments as presented in Figure 8. The graphical fitting comparison is given in Figures S9 and S10.
Adsorption ParametersFe2+/3+Mn2+
H-BSGWB-BSGH-BSGWB-BSG
Langmuir
Qm,L (mmol/g)0.1910.2260.06740.101
KL (L/mmol)9.58511.4435.7188.489
R20.8840.8690.9640.951
ΔG° (kJ/mol)−22.72−23.15−21.44−22.41
Freundlich
n3.4943.8522.8052.937
KF (L/mmol)1/n0.1530.1850.05610.0909
R20.7910.7290.910.89
Elovich
Qm,E (mmol/g)0.04740.05140.02130.0301
KE103.734166.26638.59863.712
R20.8440.7950.9450.942
Sips
qsat,S (mmol/g)0.1820.209 0.06780.104
KS (Ln/mmoln)22.145786.8225.4716.793
n1.27982.61960.984280.93208
R20.8880.8940.9640.952
Dubinin-Radushkevich
qsat,DR (mmol/g)0.3760.4170.1630.244
β (10−9 mol2/J2)2.9312.6493.6163.342
R20.8240.7730.9340.927
Eads (kJ/mol)13.0613.7411.7612.23
Table 5. Fitting parameters for Ni2+ and Cd2+ adsorption onto H-BSG and WB-BSG for Sips, Langmuir, Freundlich, Elovich and Dubinin-Radushkevich isotherm models. Data from batch experiments as presented in Figure 9. The graphical fitting comparisons are given in Figures S21 and S24.
Adsorption; ParametersNi2+Cd2+
H-BSGWB-BSGH-BSGWB-BSG
Sips
Qsat.S (mmol/g)0.04760.1040.05950.101
KS (Ln/mmoln)20.9842.73078.55992.796
n1.0980.8491.2801.262
R20.96700.9790.9690.979
Langmuir
Qsat.L (mmol/g)0.0480.0950.0610.104
KL (L/mmol)15.8894.01729.22834.638
ΔG° (kJ/mol) from KL−23.97−20.56−25.48−25.90
R20.9690.9770.9660.976
Freundlich
n4.7772.9304.2384.263
KF (L/mmol)1/n0.0450.0730.0580.100
R20.8370.9430.8330.843
Elovich
Qm,E (mmol/g)0.0090.0300.0120.020
KE644.42330.079751.719963.399
R20.9080.9720.9080.922
Dubinin–Radushkevich
Qm,DR (mmol/g)0.0840.2150.1120.189
β (10−9 mol2/J2)2.0873.6322.1652.110
R20.8890.9630.8820.894
EAds,DR (kJ/mol)15.4811.7315.215.39
Publisher’s Note: MDPI stays neutral with regard to jurisdictional claims in published maps and institutional affiliations.

