
Modelling Physical Accessibility to Public Green Spaces in Switzerland to Support the SDG11


1
Institute for Environmental Sciences, University of Geneva, Bd Carl-Vogt 66, CH-1205 Geneva, Switzerland
2
United Nations Environment Programme, GRID-Geneva, 11 chemin des Anémones, CH-1211 Châtelaine, Switzerland
3
GeoHealth Group, Institute of Global Health, University of Geneva, 9 chemin des Mines, CH-1202 Geneva, Switzerland
*
Author to whom correspondence should be addressed.
Geomatics 2021, 1(4), 383-398; https://0-doi-org.brum.beds.ac.uk/10.3390/geomatics1040022
Submission received: 23 August 2021
/
Revised: 17 September 2021
/
Accepted: 23 September 2021
/
Published: 28 September 2021
(This article belongs to the Special Issue Earth Observations for Sustainable Development Goals)
Abstract
:Urban sprawl has a strong impact on the provision and use of green spaces and, consequently, on the benefits that society can derive from these natural ecosystems, especially in terms of public health. In looking at the Sustainable Development Goals and other regional policy frameworks, there is a strong need for quantifying access to green spaces. This study presents and applies a methodology to model the physical accessibility at national and sub-national scales to public green spaces (i.e., urban green spaces and forests) in Switzerland, using AccessMod and ArcGIS travel time functions. We found that approximately 75% and 36% of the Swiss population can access the nearest urban green space within 5 min and 15 min, respectively, using motorized transport. For motorized access to the nearest forest patch, 72% and 52% of the population are within 5 min and 15 min, respectively. When considering only the main urban areas, approximately 55% of the population can walk to the nearest urban green space within 5 min. However, a high heterogeneity in access exists at cantonal and municipal levels, depending on road density, green space density, and population distribution. Despite some possible challenges in correctly delineating public green spaces, our methodology offers a replicable approach offering not only insights into sustainable urban development, but also the facilitation of comparison with other European countries.
1. Introduction
Since the 19th century, urbanization has grown exponentially. In Europe, 73% of the population is already located in urban areas. Urban sprawl reinforces the effects of climate change, environmental pollution, and the loss of functional ecosystems. Urban green spaces (UGS) can mitigate these effects and thus provide beneficial services to society, especially in terms of public health. A growing number of studies quantify the public health benefits of green spaces [1,2,3,4]. Overall, urban green spaces reduce damage from air or noise pollution, as well as heat islands, they help to relax and restore energy, and promote physical and social capacities [5].
However, the provision of urban green spaces in cities can bring social inequalities. Indeed, inequalities in health and well-being were reported to be 40% lower among people living close to green spaces. In addition, due to age or culture, urban green spaces are not appreciated equally and thus, the presupposed benefits are not necessarily achieved [6]. Therefore, the preferences and expectations of different social groups are important elements to consider. Furthermore, the needs of the elderly should be considered to a greater extent, given that the population is ageing [6]. In this sense, the quality of the green spaces (i.e., the diversity of activities offered, the level of maintenance or the size) is an important selection criterion for the inhabitants. Because the quality of green spaces has been found to be a strong motivator for people to visit a green space [7], green-space goers therefore tend to travel greater distances to reach a quality green space.
The importance of public space is recognized in the United Nations 2030 Agenda for Sustainable Development [8,9] setting a specific target 11.7 in the Sustainable Development Goals (SDGs) that attempt to “provide universal access to safe, inclusive and accessible, green and public spaces, in particular for women and children, older persons and persons with disabilities” by 2030 [10]. This target can be monitored through two indicators, one of them aiming at estimating the “Average share of the built-up area of cities that is open space for public use for all, by sex, age and persons with disabilities” [11]. This indicator intends to increase the perceived value of public spaces by policy makers, political leaders, citizens and urban developers [12]. Currently, this indicator is classified in the Tier 2 of the SDG framework, meaning that the indicator is conceptually clear, has an internationally established methodology, and standards which are available. Nevertheless, data are not produced regularly by countries [12] and usually they do not provide information on accessibility, use or safety [13]. At the European level, the closest indicator is the "Share of urban population without green urban areas in their neighborhood” [14]. Unlike the SDGs, this indicator still does not have a reliable and common methodology, but is currently being tested [15]. Consequently, it is still difficult to get sufficient and consistent information on public green space preventing effective comparisons between cities, regions, or nations.
No consensus currently exists on the definition of an urban green space or on its minimum set of conditions deemed to provide sufficient ecological, environmental, and public health benefits. A minimum size for the green space can be considered, but the size threshold used varies among authors [16]. The status of green spaces is also being debated. While some consider only public green spaces, to ensure accessibility to the entire population, others consider private green areas as well, judging that they can contribute to the well-being of the population [17]. Similarly, some argue that out-of-town green spaces (i.e., agricultural areas or forests) can act as a substitute for urban green spaces, providing access to a place to exercise and relax. Finally, the distance to urban green spaces plays a major role, as residents generally visit parks close to home. Studies have shown that accessibility to green spaces located between 300 m and 1 km from home positively influences public health and well-being [16,18].
In line with the requirements of the SDG and EU indicators on access to green spaces, the physical accessibility to green spaces is increasingly being evaluated using geographic information system (GIS) tools. A simple method is to build linear buffer zones around the green spaces, allowing the ability to define the distance to the surrounding dwellings. Despite easy computation and ease of comparison between countries, this method tends to overestimate physical accessibility. Approaches using least-cost path analyses, accounting for barriers and facilitators of movement, as well as average speeds of movement, are usually more realistic in capturing the extent of physical access. These approaches have been used recently for modelling access to UGS in four European cities (including Geneva) [19], and are used in numerous other studies for modelling access to various types of services, and notably health services (e.g., [20,21,22]).
Most of the studies focusing on the modelling of physical accessibility to public green spaces have been carried out at the scale of large cities [16,18,19,23]. To the best of our knowledge, no study has yet modelled physical accessibility to public green spaces on a national scale. The aim of this study is therefore to establish the physical accessibility of public green spaces by modelling access to both forests and UGS at the national and sub-national scales of Switzerland. We extend and develop the methodology proposed by [19] by using various geospatial tools to model accessibility in a realistic way yet accounting for the current limitations of these tools.
2. Materials and Methods
2.1. Input Data Processing
In this study, we define urban green spaces as parks and gardens that are typically found in urbanized areas, while the more general terms “green spaces” also include forests. To assess the accessibility to public green spaces in Switzerland, several geospatial data are required at the national scale (Table 1).
All layers were projected in the projection CH1903/LV03–EPSG: 21781, and all raster layers were processed at 100 m resolution.
The landcover layer from the Swiss Federal Office of Topography’s (swisstopo) cadastral data provides precise attributes on green surfaces such as vineyards, intensively cultivated areas, grazing areas, etc. For this study, we extracted all data referred as “Garden”. This category includes all the grassy areas, gardens, and parks, both private and public in Switzerland, thus representing the urban green spaces. As the aim of our study was to only consider the green spaces accessible to the entire population, we needed to only retain the public areas. To this end, using the QuickOSM plugin [24] we imported in QGIS the “Parks” layer provided by OpenStreetMap. The “Access” field of this layer indicates whether the park is public or private. We kept only the public ones and the ones without any information assuming they are also publicly accessible. Finally, the “Garden” layer from swisstopo was masked by the public parks from OpenStreetMap, using the overlay tool in QGIS. This resulted in our final data sets of considered public urban green spaces.
The Swiss landcover layer comes from the mapping of the European CORINE program. Specifically, the data used are Corine Land Cover CLC-2018 and come from the “Swiss Federal Institute for Forest, Snow and Landscape Research WSL” website. We grouped similar landcover categories by reclassifying the existing CORINE landcover categories in ArcMap 10.7.1 [25] into the following five landcover classes: urban area, natural area, agricultural land, wetlands, and water area (Table S1).
The Swiss forests were extracted from the swissTLM3D land use dataset, the most accurate and complete 3D vector dataset in Switzerland provided by swisstopo. It contains information on both artificial and natural landscape elements. As private forests are scarce in Switzerland, all forests were considered to be public.
The topographic landscape model, swissTLMRegio, also provided by swisstopo, was used to obtain the following vector layers: lakes, rivers, railway lines, and airports. The digital elevation model (DEM) comes from MNT25, an accurate DEM provided by swisstopo. As the DEM has an initial resolution of 25 m, it was aggregated to 100 m.
For the spatial distribution of the Swiss population, we used the 2020 Population Density Maps from Facebook Connectivity Lab and Center for International Earth Science Information Network–CIESIN–Columbia University, downloaded from Humanitarian Data Exchange (HDX) [26]. Initially at 30 m, this dataset was aggregated at a spatial resolution of 100 m by summing the population count.
The acquisition of road data was more challenging. We needed information on road types, but the road layer from swisstopo did not contain this information, and we therefore extracted the Swiss roads from OpenStreetMap. Five classes of roads were thus selected with corresponding maximum official driving speeds: highways (120 km/h); primary roads (80 km/h); secondary roads (60 km/h); tertiary roads (50 km/h). For pedestrian roads, we used 5 km/h as in [19].
The geographic objects considered to be complete barriers to movement were lakes, rivers, railway lines, as well as airport areas. These corresponding datasets were obtained from swisstopo.
Finally, two different urban footprints of Switzerland were used and compared in our analyses: the Copernicus’s Urban Atlas 2018 with 10 main urban centers in Switzerland [27], and the European Commission’s Global Human Settlement Layer 2019 with 17 urban centers in Switzerland [28].
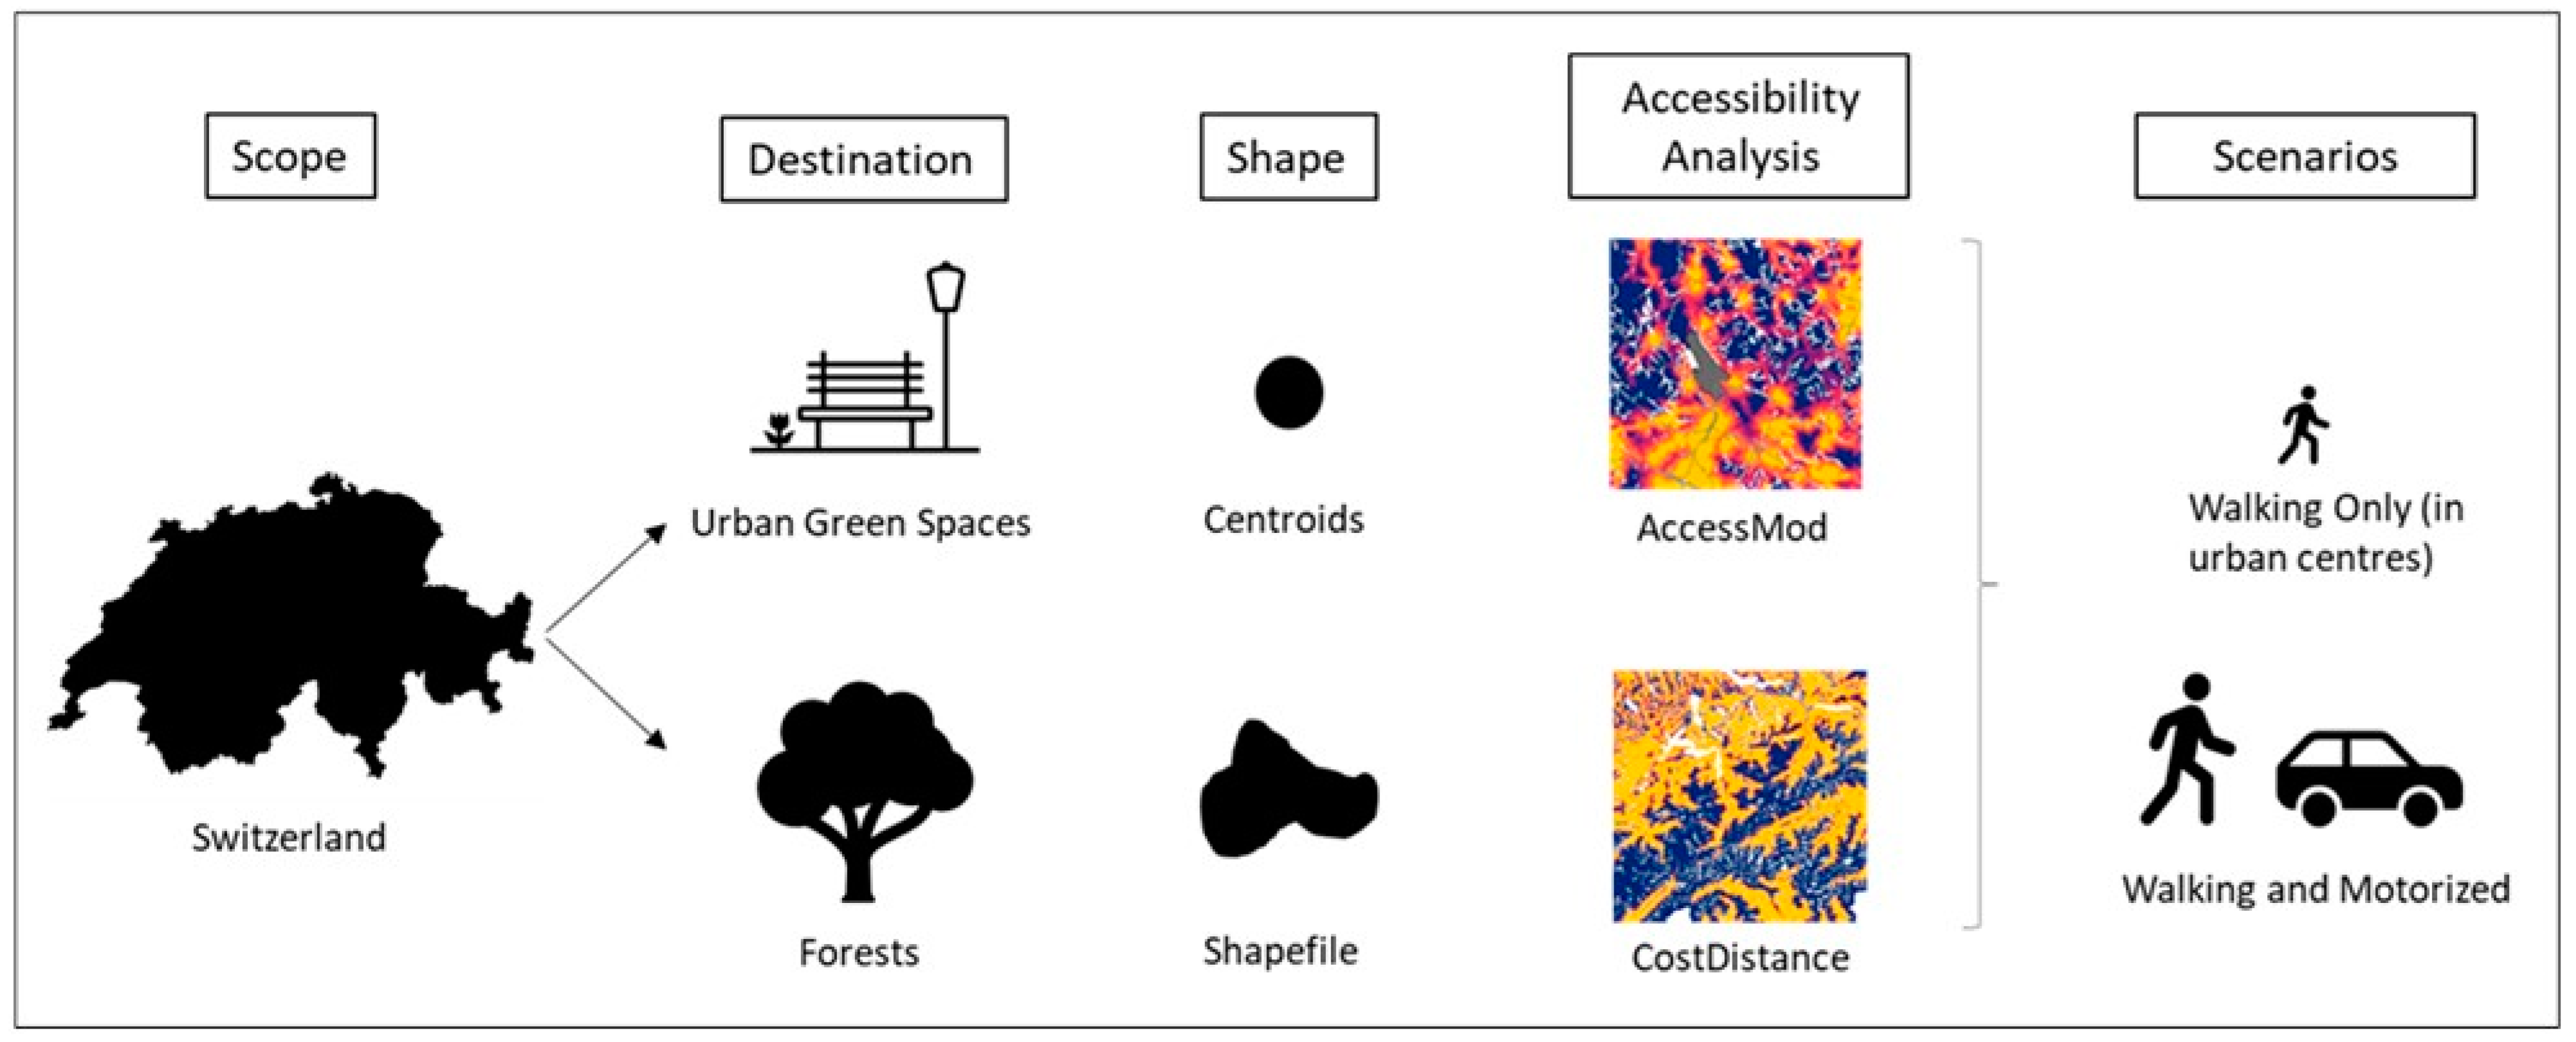
The overall methodology is summarized in Figure 1.
2.2. Physical Accessibility Modelling
Modelling physical accessibility implies, in our study, to model the fastest travel time from any location to the nearest public green space (UGS or forest patch). Two different tools were used for that.
First, in keeping with our previous study on access to urban green spaces [19], we used AccessMod ver. 5. [29] to model accessibility to, and the population coverage of, UGS. AccessMod is based on a least-cost path algorithm (Dijkstra) that computes the fastest route between any location and the nearest service considered (here parks, for details see [29]). A travel scenario must be defined, informing on modes and speeds of transport on- and off-roads. Several modes of travel can be considered sequentially (e.g., walking to a road where one uses a motorized vehicle, or driving close to park where walking is then used to reach it). Any complete barrier to movement can be factored in, and AccessMod can consider the direction of movement by applying an anisotropic analysis (i.e., considering the slope of the terrain to correct for walking speeds according to the Tobler function) [30]. In our study, we assumed the slopes were not affecting the speeds of motorized vehicles.
A current technical limitation in AccessMod is that it can only consider point features for the destination objects. As UGS were represented as polygons, we computed the centroids of each UGS’ polygon. To avoid the situation were complex, multi-part polygons (e.g., representing a string of small, connected parks or park areas) would be reduced to a single point, we first applied the ArcGIS function Multipart to Singlepart to get centroid points representing each park polygon, assuming they can each be accessed independently.
Second, because the size and shape of a park can have an influence on the time it takes to reach its borders, compared to the times needed to reach its centroid, we used the costdistance function in ArcGIS 10.7.1 [25]. This function uses the same least-cost path algorithm as AccessMod, and can consider polygons as destination objects, but with the limitation of being an isotropic function (i.e., no consideration of the direction of travel and no influence of the slopes). We did not use the anisotropic function pathdistance in ArcGIS, because it applies the slope correction for any mode of transport and cannot do it only for walking, as does AccessMod.
For the accessibility to forest patches, we used only the costdistance function in ArcGIS. It would have been indeed unrealistic to reduce forest polygons to their centroid, as very large forest patches are numerous in Switzerland. It was therefore assumed that reaching the border of a forest patch implies that one has access to this forest patch.
2.3. Travel Scenarios
Both AccessMod and the ArcGIS costdistance function need a travel scenario to transform landcover information into a cost surface raster upon which travel time is computed. We developed two travel scenarios (Table 2). The first one “Walking & motorized” assumes visitors use an optimized combination of motorized vehicle (on roads) and walking (off-road or on pedestrian roads) to reach the nearest UGS or forest patch. The second one “Walking-only” assumes walking off-roads, but also on the roads, except on highways considered in this case as unpracticable. In both scenarios, wetlands, rivers, lakes, airports, and railways were all considered as barriers to movement, except when a road crosses over.
For the walking speeds, we assumed an average speed of 5 km/h on flat ground, and a reduced walking speed of 2 km/h on agricultural lands and other natural elements [19]. Speeds on roads were assigned the official maximum driving speeds in Switzerland.
2.4. Population Coverage Statistics
Once accessibility was modelled, we overlaid the output travel time raster with the raster of the spatial distribution of the population to calculate the percentage of the population living within a given maximum travel time to the nearest public green space (i.e., population coverage). We used the module “Zonal Statistics” in AccessMod to compute population coverages for different administrative levels (national, canton, municipalities) and for each urban center. The travel time raster files obtained in ArcGIS were previously imported into AccessMod.
3. Results
3.1. Accessibility Analyses to Urban Green Spaces
We assembled a total of 2919 urban green spaces represented by their centroids. There were 79 facilities falling on a barrier. We moved them outside the barrier pixel with the AccessMod Interactive map using a satellite image in the background to guide the positioning of the facility on the appropriate side of the barrier. After disaggregating multi-part polygons into singles parts, a total of 14’024 UGS’ centroid points were obtained (Figure 2) and used in the accessibility analyses.
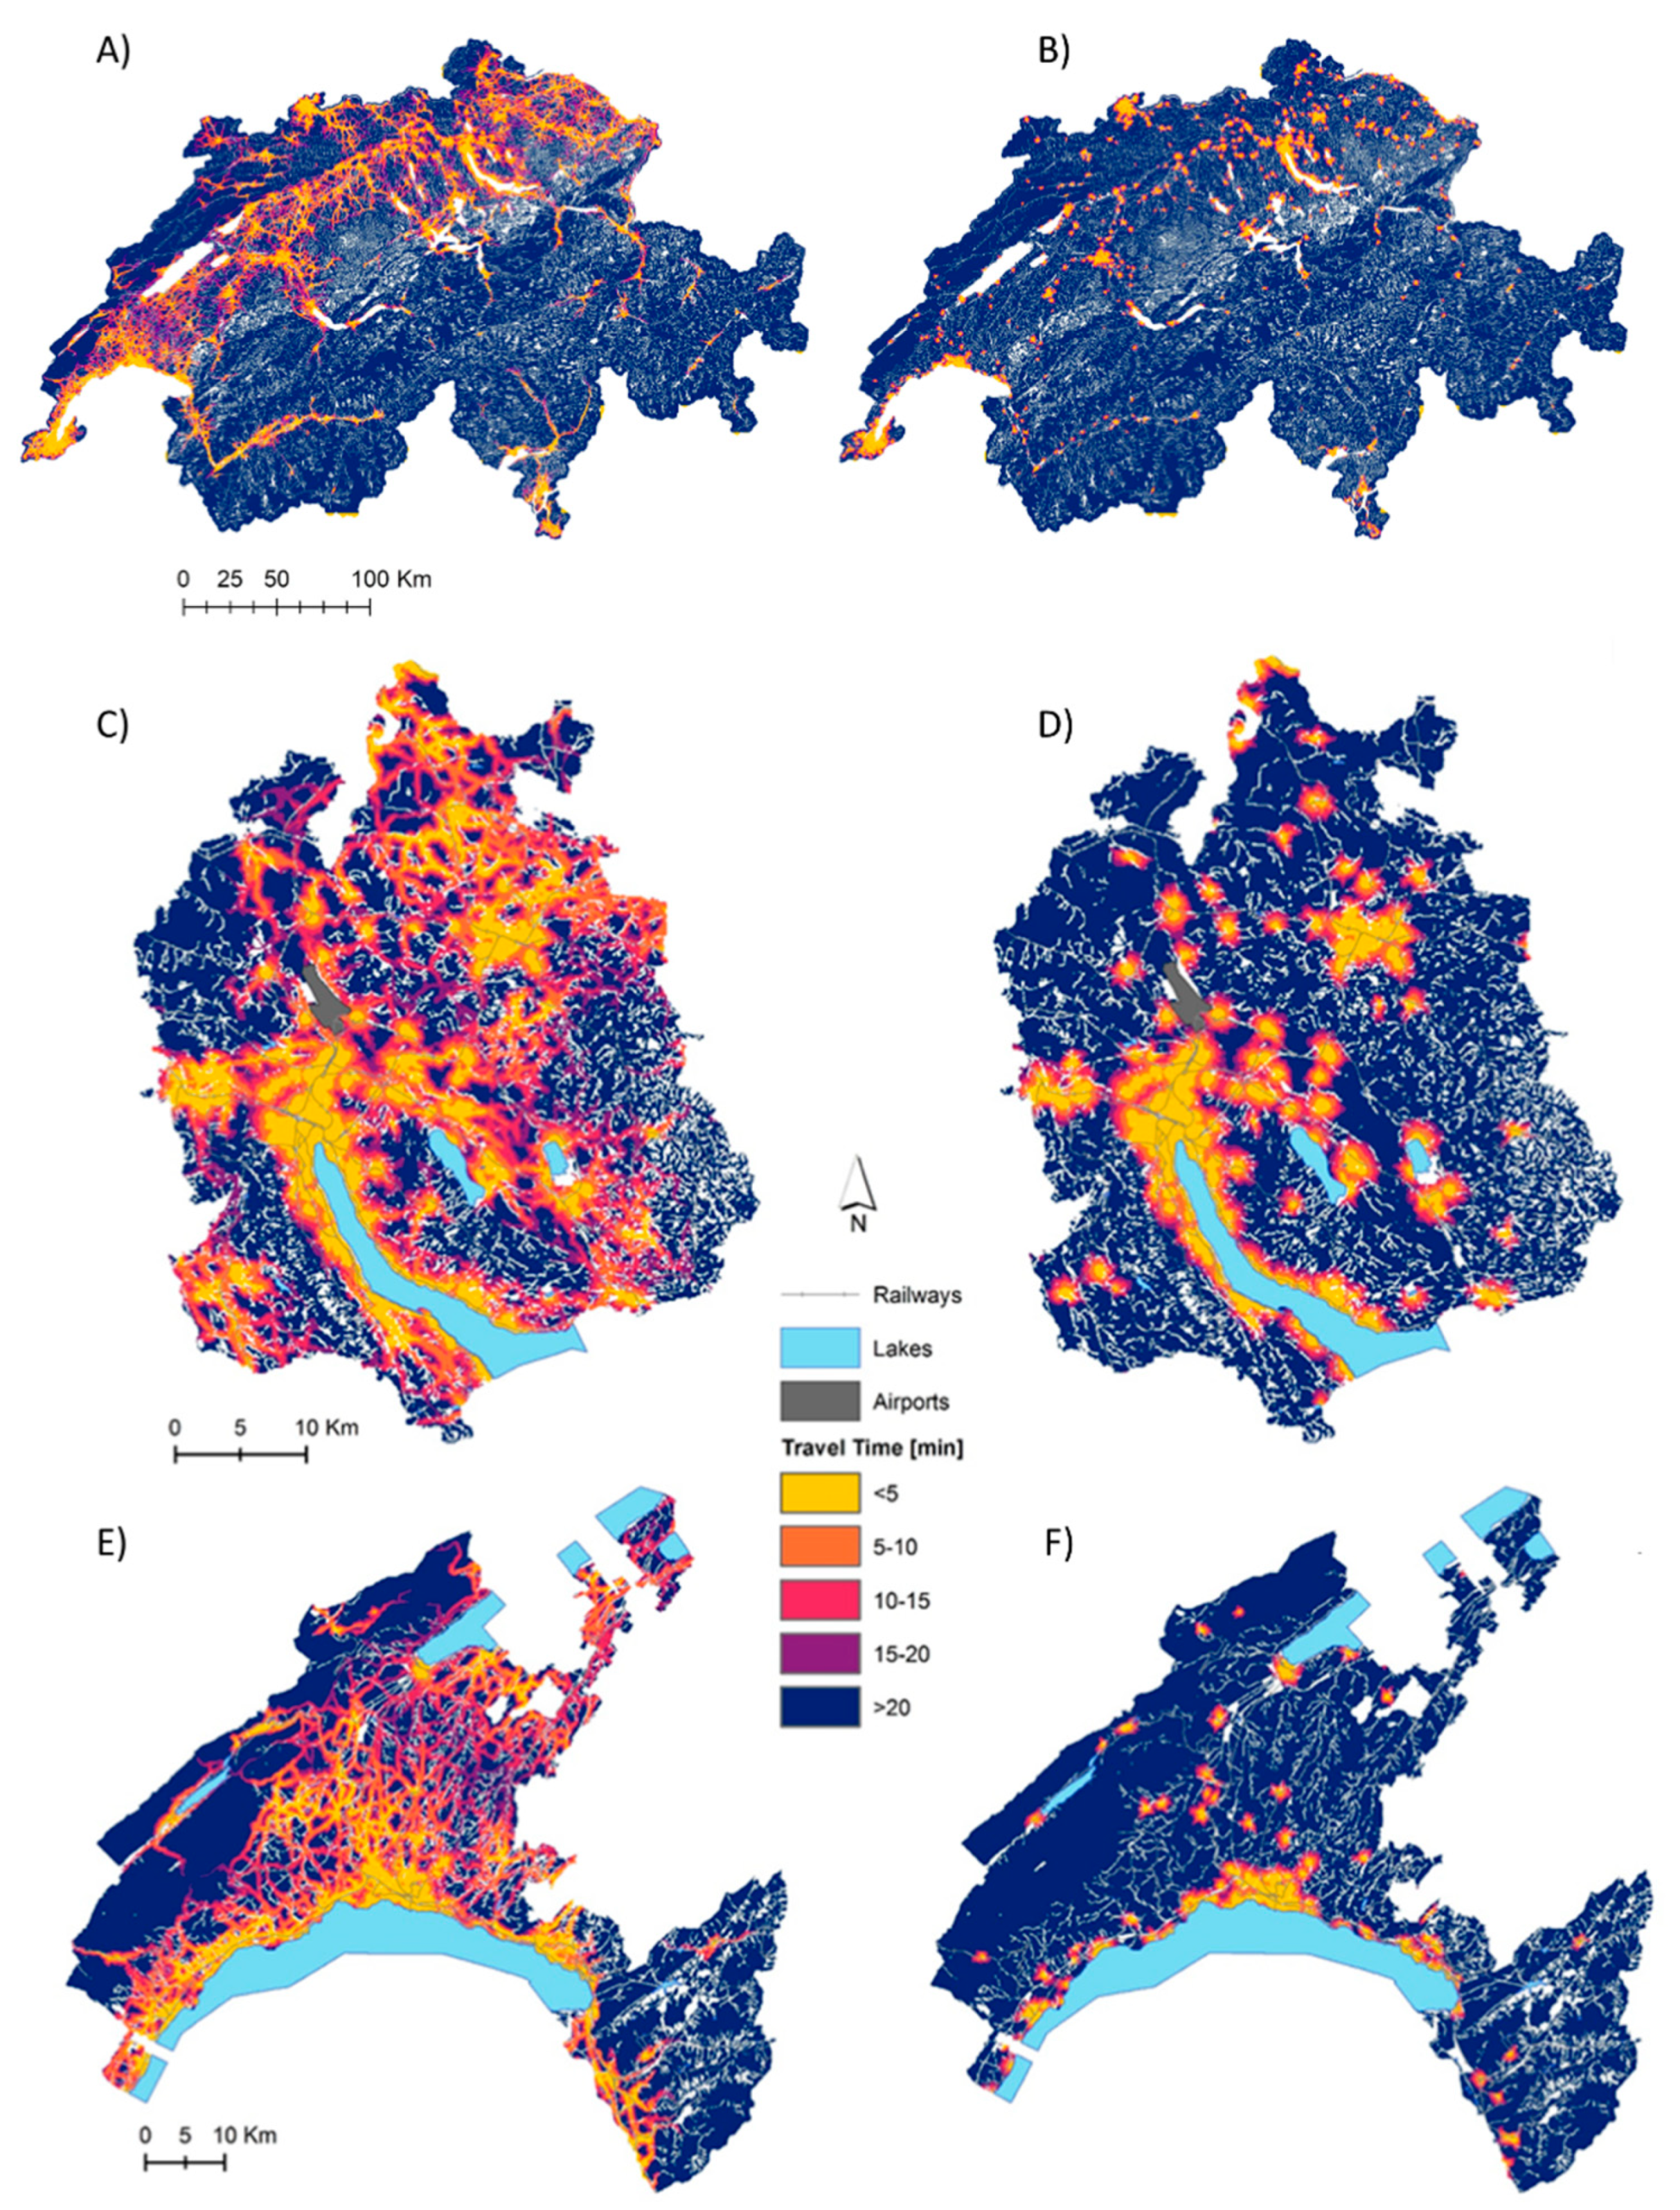
The walking and motorized and walking-only accessibility maps at national scale are depicted as travel times in Figure 3A,B. The Alpine region (i.e., southern, and eastern part of the country) and the Jura Mountains (i.e., northwest part of the country) feature relatively much fewer UGS, as they are mountainous and less-populated areas, as evidenced by a strong presence of dark blue on the map. This is particularly visible at the cantonal level, as shown by the examples of the cantons of Zurich and Vaud in Figure 3C–F.
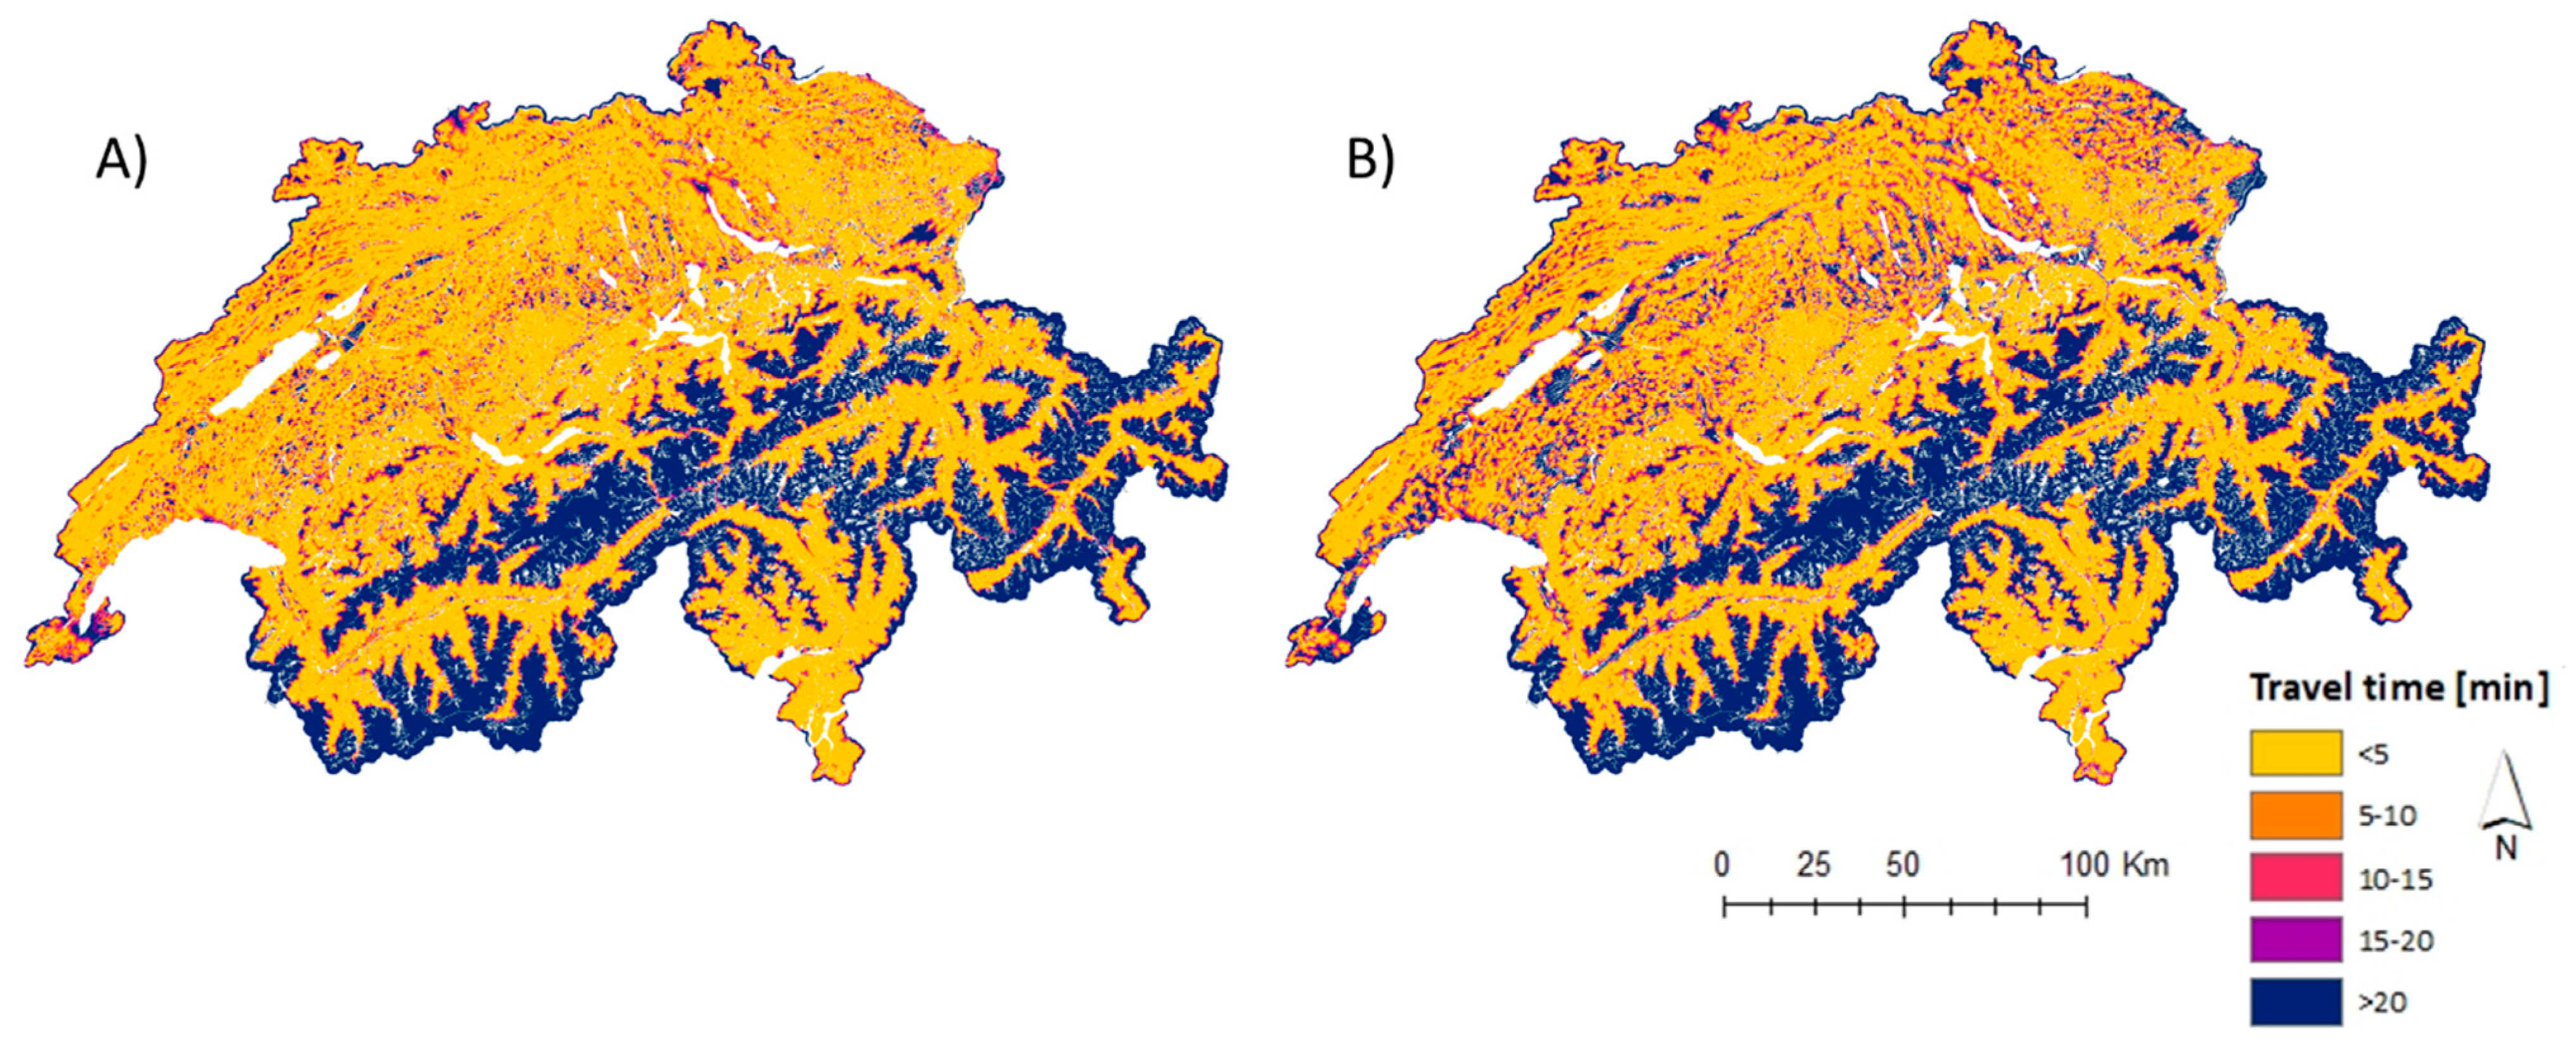
The results of accessibility modeling to forest patches using the walking and motorized model are shown in Figure 4A. The resulting map shows a high accessibility to forest patches using motorized transport in most parts of Switzerland. Only high-altitude and glaciated areas lack rapid access to forests, with a join effect of having less forest patches and a lower roads density in their vicinity. The walking-only model implies longer travel times to forest patches, as visualized in Figure 4B.
3.2. Population Coverages
Population coverage statistics (i.e., percentages of the population having access to UGS or forest patches within a maximum travel time) were first obtained at a national scale. For the analysis on UGS, we contrasted an anisotropic model applying the influence of the slopes on walking speeds, and an isotropic model without this influence. As shown in Table 3, results between the two are very similar (approximately 75% population coverage within 15 min), with slightly lower percentages of the population having access to UGS with the isotropic mode at any of the considered maximum travel times. The population coverages for access to forests is much higher than for access to UGS (Table 3), with 92.17% of the Swiss population using a motorized vehicle able to reach the nearest forest patch in less than 15 min.
Population coverages statistics were also obtained for each of the 26 Swiss cantons using the anisotropic model and the centroid method for UGS (Table 4). Coverages vary greatly among cantons, ranging at the 15 min threshold from 11.29% for Obwald to 99.32% for Geneva. At the same time threshold, coverages at the cantonal level for access to forests (Table 4) are larger, ranging from 55.73% for Basel-City to 99.30% for Soleure. The corresponding thematic maps per canton are shown in Figure S1. Slightly higher population coverages are observed when the isotropic model is used with UGS’ centroids, using AccessMod (Table S2). When the cost distance approach is used in ArcGIS with UGS’ centroids (Table S3), one also observes very similar values in population coverage.
3.3. Urban Centers
In keeping with the study of Giuliani et al. [13], we used two different urban center footprints (Copernicus and GHSL) in which we applied the walking-only travel scenario to obtain population coverage statistics. We assumed the urban population mainly walk to the nearest UGS. Using the set of 10 urban centers from Copernicus, more than 55% of the urban population has access to a green space in less than 5 min walking and more than 87% within 15 min walking (Table 5). Using the GHSL urban footprint composed of 17 urban centers (Table 5), these results are 54% and 89%, respectively.
3.4. Population Coverages at Municipal Level
We also obtained population coverages and maps at the municipal level (Figure 5). The percentage of inhabitants with good access to public parks seems to be mainly concentrated in urban municipalities, or on the lowlands (Figure 5A). Conversely, rural, or mountainous municipalities lack accessibility to public green parks, which is mainly due to the small number of parks in these areas. The Swiss population has good access to forests within 15 min travel time, even at the municipal level (Figure 5B). The few municipalities that stand out as having low access to forests are in cold, mountainous regions.
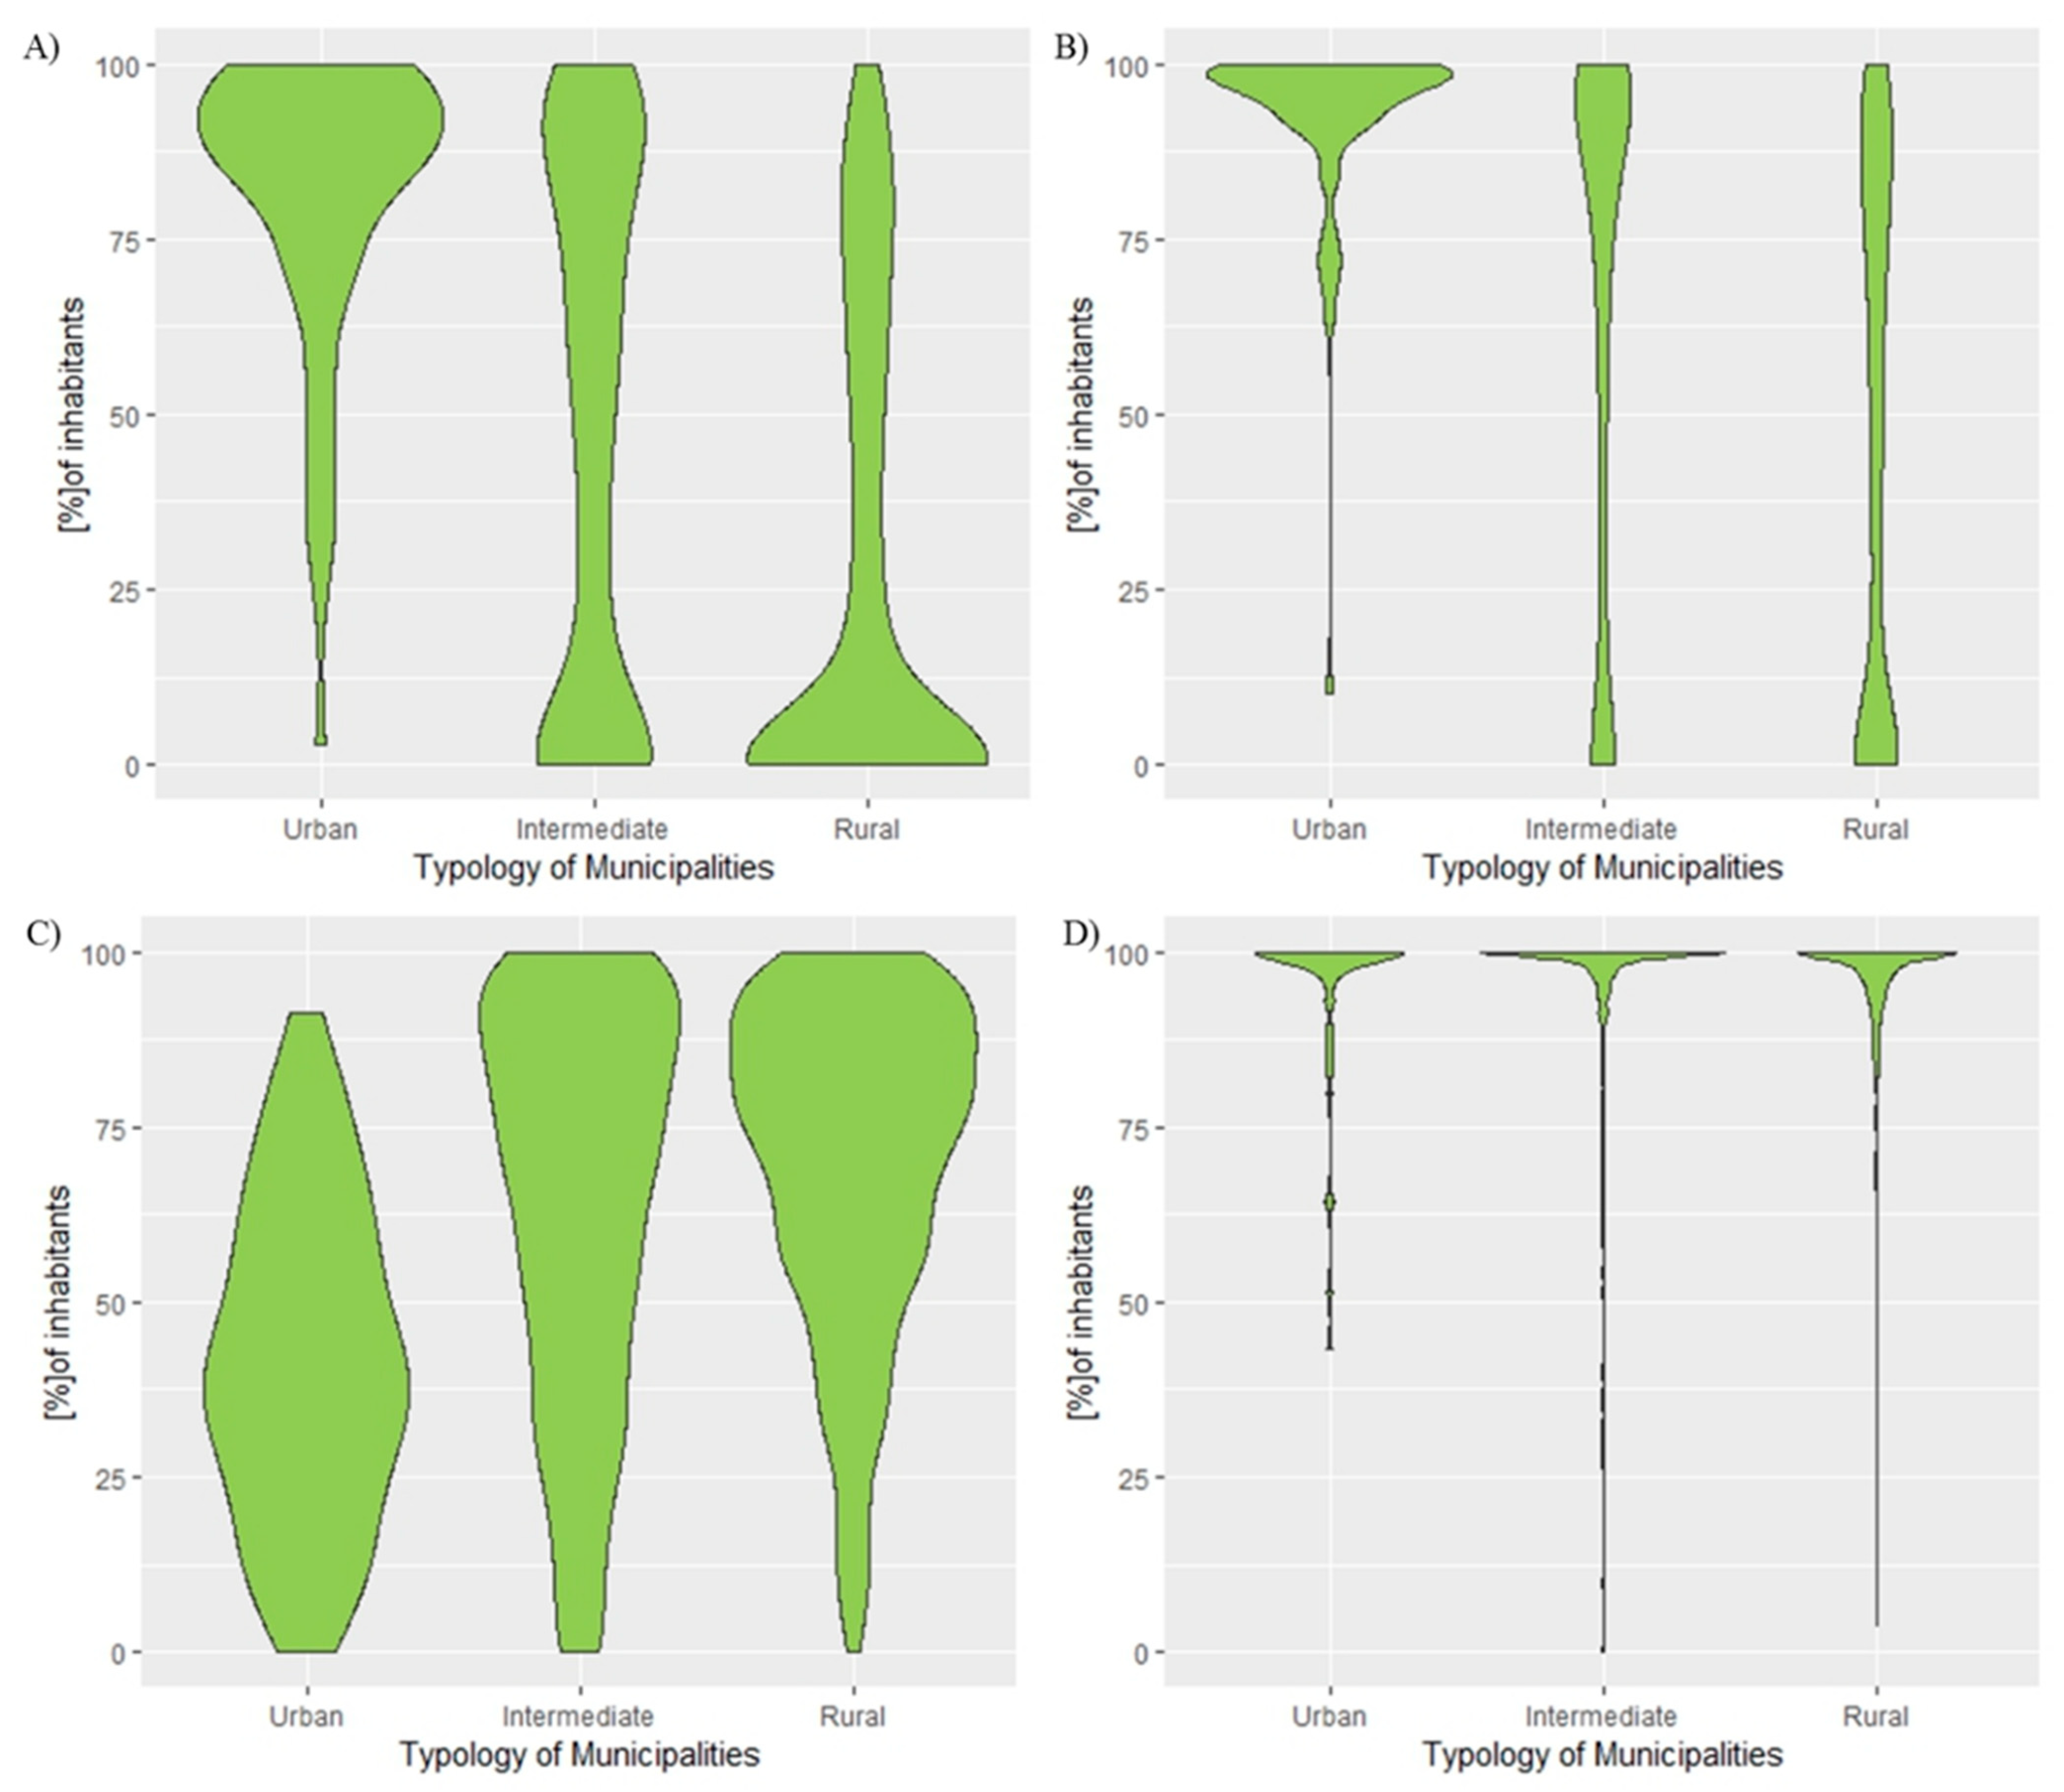
To further analyze the relationship between the physical accessibility to UGS and the degree of urbanization of the municipality level, we made use of the official urban typology of municipalities in three categories: “Urban”, “Intermediate”, “Rural”. The distribution of the population coverages over the municipalities falling within each urban category is depicted as violin plots in Figure 6, for both access to UGS and access to forests, following a walking and motorized travel model. Urban green spaces, which are mostly located within cities, provide easy access (within 10 min) to a large proportion of the population in most urban municipalities (Figure 6A). Intermediate and rural municipalities mostly have a relatively lower percentage of population with easy access to UGS, even within 15 min (Figure 6B). Conversely, most intermediate and rural municipalities have a large percentage of the population with timely access to a forest in 5 min (Figure 6C), which is not the case for urban municipalities. However, by increasing the travel time to 15 min (Figure 6D), then the vast majority of the municipalities have a very high percentage of their population that can access the nearest forest within that timeframe.
4. Discussion
The aim of our study was to assess the population’s physical accessibility to green spaces throughout Switzerland. Our results at a national scale showed that more than 75% of the Swiss population has access to the nearest urban green space from their home within 15 min of travel using private motorized transport where possible. This population coverage decreases to approximately 60% and 35% when considering a maximum of 10 min and 5 min travel time, respectively. Accounting for the effects of slopes on decreasing walking speeds had little effects on the overall population coverage at the 5-, 10-, or 15-min travel time thresholds (less than 1.5% difference).
The relatively high national accessibility to UGS hides a large disparity in access at the cantonal level. At the 15 min travel time threshold, some predominantly rural cantons (e.g., Obwald, Neuchatel) have a population coverage below 12%, while this figure is larger than 98% for other urban cantons (e.g., Basel City, Geneva), with intermediate values for the other cantons. This geographic heterogeneity calls for subnational consideration of access when considering access to urban green spaces.
When only urban centers from Copernicus are considered, we found that more than 55% of the Swiss urban population can access the nearest UGS in less than 5 min walking, with this percentage increasing to 87% at the 15 min walking time threshold. Interestingly, when using the 17 GHSL urban centers, those figures are very close, with corresponding values of 54% and 89%. However, some urban centers featured a different population coverage depending on the extent of the urban area considered. For example, with a 15 min travel time threshold, the canton of Lugano has 80.1% and 66.4% population coverage to UGS using the Copernicus and GHSL footprint, respectively. For the canton of Lucerne, these figures are 90.6% and 81.5%.
In addition to urban green spaces, we considered access to forested areas by treating them as polygons that can be reached anywhere on their periphery. More than 92% of the Swiss population can reach a forest in less than 15 min with motorized transport, and close to 52% in less than 5 min. These figures are high at the national level, and only four out of the 26 cantons have a population coverage smaller than 90% at the 15 min thresholds, due essentially to a few municipalities featuring a low access to forests. For example, in the canton of Geneva, the municipalities with a low accessibility to forests are located in the city center, distant from the wooded areas.
The accessibility standards of the European Common Indicators [3] stipulates public access to a green space within 300 m of a dwelling (i.e., a travel time within approximately 5 min walking). Even if we consider only access to urban green spaces, Switzerland still has a good progression margin to improve this access to its population and to meet SDGs 11.7.1. The proposed methodology allows obtaining consistent information at different scales to support this SDG indicator, while at the same time providing additional disaggregated information enabling apprehending spatial and temporal dynamics of accessibility to green spaces. Such an approach can also significantly contribute to the “New Urban Agenda”, a policy promoted by UN-Habitat [31], to enhance urban resilience and sustainable urban development. Together with the SDGs, they provide a platform to globally monitor the public space, recognizing the key role of cities and local communities to implement and achieve the SDGs [11]. The long history of forest preservation in Switzerland, at least in some parts of it [32], translates into a very good availability in timely access to forests for recreative purposes. More efforts should be put into a better understanding of how access to forests, and especially in peri-urban situations, could complement indicators focusing only on access to urban green spaces.
Since Switzerland has a large catalogue of high-resolution geospatial data, the data on the precise delineations of UGS and forests were easily obtained. However, this data lacked information on the public vs. private attribute, a well-known issue in other similar studies [26]. Within urban areas, it is advisable to use the official cadasters whenever accessible [16,33], but alternative sources of information may be needed outside urban areas. Our use of OpenStreetMap data for that purpose is likely to be a common, and often the only, source of such information in many countries. As OSM data still lack completeness for many of its object attributes in many places, there is an urgent need to find alternatives for filling this information gap. Among potential alternatives, citizen science campaigns can be a promising approach to identify public/private areas using aerial and/or on-the-ground images available in public databases (e.g., Flickr) or the Land Use and Coverage Area frame Survey (LUCAS) [34,35]. In addition, using patterns of mobile phone data (e.g., number and pattern over time of mobile phone users in a dedicated space) can also help detecting if a given green area is publicly accessible or not.
Limitations and Perspectives
Some limitations in our study need to be discussed considering future perspectives for improvements. First, we used OpenStreetMap data for the identification of public and private parks as an open and assumed valid alternative to using official cadasters. However, the attribute information in OSM objects depends on the involvement of users and may therefore lack completeness and accuracy in some places, leading to frequent undervaluation of the private green space. Ideally, a complete and accurate cadastral data should be used to inform the public access to green spaces.
Second, the analysis of accessibility was restricted here to public green spaces and public forests. Yet, other studies underline the benefits of private green spaces [10,11]. Considering all green spaces, both public and private, would remove the need to apply a public/private mask, whose data sources may be debatable. A future challenge for integrating the benefits of private green spaces with our approach used here for public ones, is to find the appropriate data or methodology to identify the population that has access to private green areas.
Third, other types of green spaces such as rural areas with crops, vineyards or even wetlands can provide positive health effects to the population [17]. As these areas are often located on the urban periphery, they could be worth including in a national accessibility analysis. Future studies should focus more strongly on the influence of the rural area on the physical accessibility to green spaces.
Fourth, regarding public parks, only their locations were used for the purposes of this study. No size constraints were imposed, although certain accessibility standards indicators require a minimum size of green space near the dwellings. For instance, the Accessible Natural Greenspace Standard for England recommends that a green space of at least 2 hectares in size should be accessible within a 5 min’ walk [3].
Fifth, the characteristics of public parks have not been investigated. A park offering particular settings (e.g., playground for children, dog-friendly environment, easy wheelchair access), could encourage residents to travel longer distances to reach it, by-passing the nearest park. Dedicated accessibility analyses could be done with these other target populations in mind. This may require considering alternative travel scenarios to account, for example, for reduced mobility. Future studies could consider the expectations of these different social groups, which would better respond to the demand of the SDG 11.7 that intends to provide a safe public green space “in particular for women and children, older persons and persons with disabilities” [11].
Sixth, we had to use two different accessibility modelling approaches for parks (AccessMod targeting parks centroids) and forests (ArcGIS costdistance targeting forest polygons), as both had limitations preventing them to be used satisfactorily for all target objects. Ideally, a single flexible algorithm should be used for parks and forests, which would simplify the overall workflow. These current algorithmic limitations will hopefully be overcome in future versions of any of the used software. Also, and especially for large parks that are fenced, obtaining the locations of park entrances could increase the accuracy of the accessibility results from the Centroid method by considering multiple access points placed on the entrances. Giuliani et al. [19] had tested moving the centroids of parks to the known entrances of certain parks in the city of Geneva, which showed little effects on the overall modelled accessibility after performing a sensitivity test. However, the effects of this at a national scale in Switzerland remains to be investigated.
Seventh, our national study used a 100 m pixel resolution. While this resolution allows for shorter calculation time, it may also reduce the accuracy of the analyses. For example, barriers, such as rivers, can become artificially too large when rasterized and may interfere with park or forest polygons that are often located on the riverbanks. Consequently, when making corrections (i.e., moving parks’ centroids located on barriers), riverside parks’ centroids may be slightly shifted. This can lead to biased accessibility results. Working at a higher spatial resolution could be beneficial for future accessibility assessments. However, getting an accurate spatial distribution of the population at this higher resolution may be challenging in some areas.
Finally, a bias in accessibility may occur in some areas due to the way the different categories of roads are treated. The two accessibility algorithms we used do not consider highway entrances and exits differently than the situations where a primary or secondary road passes over (bridge) or under (tunnel) a highway. In both cases the highway can be used.
5. Conclusions
Urban sprawl and unsustainable land use are major issues significantly impacting the provision and use of green spaces and, consequently, on the many benefits that the population can derive from them.
This important role is featured in the UN 2030 Agenda for Sustainable Development defining related targets and indicators to increase the awareness of the value of public spaces by policy makers, political leaders, citizens, and urban developers. However, most of the countries are not regularly providing the necessary information and thus preventing policy- and decision-makers to create the conditions for these spaces to deliver their full potential by ensuring sufficient variety, accessibility, and quality of public spaces. Consequently, there is a significant need for quantifying access to green spaces with timely and spatially disaggregated information.
In this study, we used a combination of different geospatial data to model the physical accessibility at national and sub-national scales to public green spaces (i.e., urban green spaces and forests) in Switzerland. Findings suggest that approximately 75% and 36% of the Swiss population can access the nearest urban green space within 5 min and 15 min, respectively, using motorized transport. For motorized access to the nearest forest patch, 72% and 52% of the population are within 5 min and 15 min, respectively. When considering only the main urban areas, approximately 55% of the population can walk to the nearest urban green space within 5 min. These results demonstrate that the proposed methodology represents a replicable, consistent, valid, reliable, timely, and continuous source of information on accessibility to green spaces at various scales. Nevertheless, a high heterogeneity in access exists at sub-national levels, depending on road density, green space density, and population distribution. Despite some possible challenges in correctly identifying and delineating public green spaces, the proposed methodology offers a replicable approach offering not only insights towards sustainable urban development, but also facilitating comparison between countries. Furthermore, our results highlight the regions of Switzerland with sub-optimal accessibility to public green spaces, which can guide future planning in improving the current situation.
The proposed methodology can be a good complement to official and traditional statistics towards reporting against SDG (and other policies) indicators, facilitating comparison between different administrative levels, and offering further combination with other data (e.g., socio-economic) to gain knowledge and support for evidence-based decisions.
Supplementary Materials
The following are available online at https://0-www-mdpi-com.brum.beds.ac.uk/article/10.3390/geomatics1040022/s1, Table S1: Reclassification of the existing CORINE landcover categories, Table S2: Percentage of population that have access to UGS within a maximum travel time, using AccessMod on with the UGS centroids, and ignoring the influence of the DEM (isotropic mode), Table S3: Percentage of population that have access to UGS within a maximum travel time, using ArcGIS cost-distance analysis in isotropic mode, Figure S1: Percentage of the population per Canton that have access to the centroid of the nearest Urban Green Space.
Author Contributions
Conceptualization, C.C., N.R. and G.G.; methodology, C.C. and N.R.; formal analysis, C.C.; data curation, C.C.; writing—original draft preparation, C.C. and N.R.; writing—review and editing, C.C., N.R. and G.G.; visualization, C.C.; supervision, N.R. All authors have read and agreed to the published version of the manuscript.
Funding
This research received no external funding.
Data Availability Statement
The following data are available on the swisstopo website: DEM, rivers, lakes, railways, airports, garden landcover, forest and administrative boundaries. The roads layers are available on OpenStreetMap. The landcover CORINE and the Urban Atlas are available on Copernicus website. The Urban Centre is available on Global Human Settlement website. The Population Density is available on Humanitarian Data Exchange website. The travel scenario in AccessMod format, as well as the output population coverage statistics in Excel format, are available upon request to the corresponding author.
Acknowledgments
We thank the Swiss Federal Office of Topography (swisstopo) for providing the landcover layer.
Conflicts of Interest
The authors declare no conflict of interest.
References
- Hartig, T.; Mitchell, R.; de Vries, S.; Frumkin, H. Nature and Health. Annu. Rev. Public Health 2014, 35, 207–228. [Google Scholar] [CrossRef] [PubMed] [Green Version]
- Stanhope, J.; Breed, M.F.; Weinstein, P. Exposure to greenspaces could reduce the high global burden of pain. Environ. Res. 2020, 187, 109641. [Google Scholar] [CrossRef] [PubMed]
- WHO Regional Office for Europe. Urban Green Spaces and Health—A Review of the Evidence; WHO: Copenhagen, Danmark, 2016. [Google Scholar]
- Zufferey, J. Relations entre santé et espaces verts et bleus: Une synthèse de la recherche empirique, 2003–2014. Nat. Sci. Soc. 2015, 23, 343–355. [Google Scholar] [CrossRef] [Green Version]
- Bolon, I.; Cantoreggi, N.; Simos, J.; Ruiz De Castañeda, R. Espaces verts et forêts en ville: Bénéfices et risques pour la santé humaine selon l’approche « Une seule santé » (One Health). Sante Publique (Bucur.) 2019, S1, 173–186. [Google Scholar] [CrossRef] [PubMed]
- Kabisch, N.; Haase, D. Green justice or just green? Provision of urban green spaces in Berlin, Germany. Landsc. Urban Plan. 2014, 122, 129–139. [Google Scholar] [CrossRef]
- La Rosa, D.; Takatori, C.; Shimizu, H.; Privitera, R. A planning framework to evaluate demands and preferences by different social groups for accessibility to urban greenspaces. Sustain. Cities Soc. 2018, 36, 346–362. [Google Scholar] [CrossRef]
- Assembly, G. United Nations Transforming Our World: The 2030 Agenda for Sustainable Development; UN: New York, NY, USA, 2015. [Google Scholar]
- Simon, D.; Arfvidsson, H.; Anand, G.; Bazaz, A.; Fenna, G.; Foster, K.; Jain, G.; Hansson, S.; Evans, L.M.; Moodley, N.; et al. Developing and testing the Urban Sustainable Development Goal’s targets and indicators—A five-city study. Environ. Urban. 2016, 28, 49–63. [Google Scholar] [CrossRef]
- Klopp, J.; Petretta, D.L. The urban sustainable development goal: Indicators, complexity and the politics of measuring cities. Cities 2017, 63, 92–97. [Google Scholar] [CrossRef]
- Eurostat SDG 11. SDG 11-Sustainable Cities and Communities: Make Cities and Human Settlements Inclusive, Safe, Resilient and Sustainable. Available online: https://sdgs.un.org/goals/goal11 (accessed on 20 August 2021).
- UN-HABITAT. SDG Indicator Metadata; United Nations: Nairobi, Kenya, 2021. [Google Scholar]
- Pafi, M.; Siragusa, A.; Ferri, S.; Halkia, M. Measuring the Accessibility of Urban Green Areas: A Comparison of the Green ESM with other Datasets in Four European Cities; 2016. [Google Scholar]
- Poelman, H. A Walk to the Park? Assessing Access to Green Urban Areas in Europe’s Cities; European Commission: Brussels, Belgium, 2016. [Google Scholar]
- UN-GGIM. The Territorial Dimension in SDG Indicators: Geospatial Data Analysis and Its Integration with Statistical Data; Instituto Nacional de Estatística: Lisboa, Portugal, 2019. [Google Scholar]
- Le Texier, M.; Schiel, K.; Caruso, G. The provision of urban green space and its accessibility: Spatial data effects in Brussels. PLoS ONE 2018, 13, e0204684. [Google Scholar] [CrossRef] [PubMed]
- Ekkel, E.D.; de Vries, S. Nearby green space and human health: Evaluating accessibility metrics. Landsc. Urban Plan. 2017, 157, 214–220. [Google Scholar] [CrossRef]
- Gupta, K.; Roy, A.; Luthra, K.; Maithani, S. Mahavir GIS based analysis for assessing the accessibility at hierarchical levels of urban green spaces. Urban For. Urban Green. 2016, 18, 198–211. [Google Scholar] [CrossRef]
- Giuliani, G.; Petri, E.; Interwies, E.; Vysna, V.; Guigoz, Y.; Ray, N.; Dickie, I. Modelling accessibility to urban green areas using Open Earth Observations Data: A novel approach to support the urban SDG in four European cities. Remote Sens. 2021, 13, 422. [Google Scholar] [CrossRef]
- Ebener, S.; Stenberg, K.; Brun, M.; Monet, J.-P.; Ray, N.; Sobel, H.L.; Roos, N.; Gault, P.; Conlon, C.M.; Bailey, P.; et al. Proposing standardised geographical indicators of physical access to emergency obstetric and newborn care in low-income and middle-income countries. BMJ Glob. Health 2019, 4, e000778. [Google Scholar] [CrossRef] [PubMed] [Green Version]
- Neutens, T. Accessibility, equity and health care: Review and research directions for transport geographers. J. Transp. Geogr. 2015, 43, 14–27. [Google Scholar] [CrossRef]
- Ouma, P.; Macharia, P.M.; Okiro, E.; Alegana, V. Methods of Measuring Spatial Accessibility to Health Care in Uganda. In Practicing Health Geography: The African Context; Makanga, P.T., Ed.; Global Perspectives on Health Geography; Springer International Publishing: Cham, Switzerland, 2021; pp. 77–90. [Google Scholar] [CrossRef]
- Cetin, M. Using GIS Analysis to Assess Urban Green Space in Terms of Accessibility: Case Study in Kutahya. Int. J. Sustain. Dev. World Ecol. 2015, 22, 420–424. [Google Scholar] [CrossRef]
- QGIS. QGIS Python Plugins Repository. Available online: https://plugins.qgis.org/plugins/QuickOSM/ (accessed on 19 February 2021).
- ESRI. Présentation de L’analyse de la Distance de Coût—ArcGIS Pro|Documentation. Available online: https://pro.arcgis.com/fr/pro-app/tool-reference/spatial-analyst/understanding-cost-distance-analysis.htm (accessed on 29 October 2020).
- HDX. Switzerland: High Resolution Population Density Maps + Demographic Estimates-Humanitarian Data Exchange. Available online: https://data.humdata.org/dataset/switzerland-high-resolution-population-density-maps-demographic-estimates (accessed on 31 January 2021).
- Copernicus. Urban Atlas 2018—Copernicus Land Monitoring Service. Available online: https://land.copernicus.eu/local/urban-atlas/urban-atlas-2018 (accessed on 25 January 2021).
- Global Human Settlement. Global Human Settlement-Urban Centre Database R2019A-European Commission. Available online: https://ghsl.jrc.ec.europa.eu/ghs_stat_ucdb2015mt_r2019a.php (accessed on 25 January 2021).
- Ray, N.; Ebener, S. AccessMod 3.0: Computing Geographic Coverage and Accessibility to Health Care Services Using Anisotropic Movement of Patients. Available online: https://0-link-springer-com.brum.beds.ac.uk/article/10.1186/1476-072X-7-63 (accessed on 29 October 2020).
- Tobler, W. Three Presentations on Geographical Analysis and Modeling: Non- Isotropic Geographic Modeling; Speculations on the Geometry of Geography; and Global Spatial Analysis (93-1); University of California: Santa Barbara, CA, USA, 1993. [Google Scholar]
- Kaika, M. ‘Don’t call me resilient again!’: The New Urban Agenda as immunology … or … what happens when communities refuse to be vaccinated with ‘smart cities’ and indicators. Environ. Urban. 2017, 29, 89–102. [Google Scholar] [CrossRef] [Green Version]
- Prins, K. Country Profiles on Forests and Forestry; Forest Europe; State of Europe’s Forests; 2020; p. 238. [Google Scholar]
- Comber, A.; Brunsdon, C.; Green, E. Using a GIS-based network analysis to determine urban greenspace accessibility for different ethnic and religious groups. Landsc. Urban Plan. 2008, 86, 103–114. [Google Scholar] [CrossRef] [Green Version]
- Leibovici, D.; Williams, J.; Rosser, J.; Hodges, C.; Chapman, C.; Higgins, C.; Jackson, M. Earth Observation for Citizen Science Validation, or, Citizen Science for Earth Observation Validation? The Role of Quality Assurance of Volunteered Observations. Data 2017, 2, 35. [Google Scholar] [CrossRef] [Green Version]
- Bayas, J.C.L.; See, L.; Bartl, H.; Sturn, T.; Karner, M.; Fraisl, D.; Moorthy, I.; Busch, M.; van der Velde, M.; Fritz, S. Crowdsourcing LUCAS: Citizens Generating Reference Land Cover and Land Use Data with a Mobile App. Land 2020, 9, 446. [Google Scholar] [CrossRef]
Figure 1.
Summary of the methodology used.

Figure 2.
Location of public urban green spaces in Switzerland, represented by their centroids, overlaid on the road network.
Figure 2.
Location of public urban green spaces in Switzerland, represented by their centroids, overlaid on the road network.
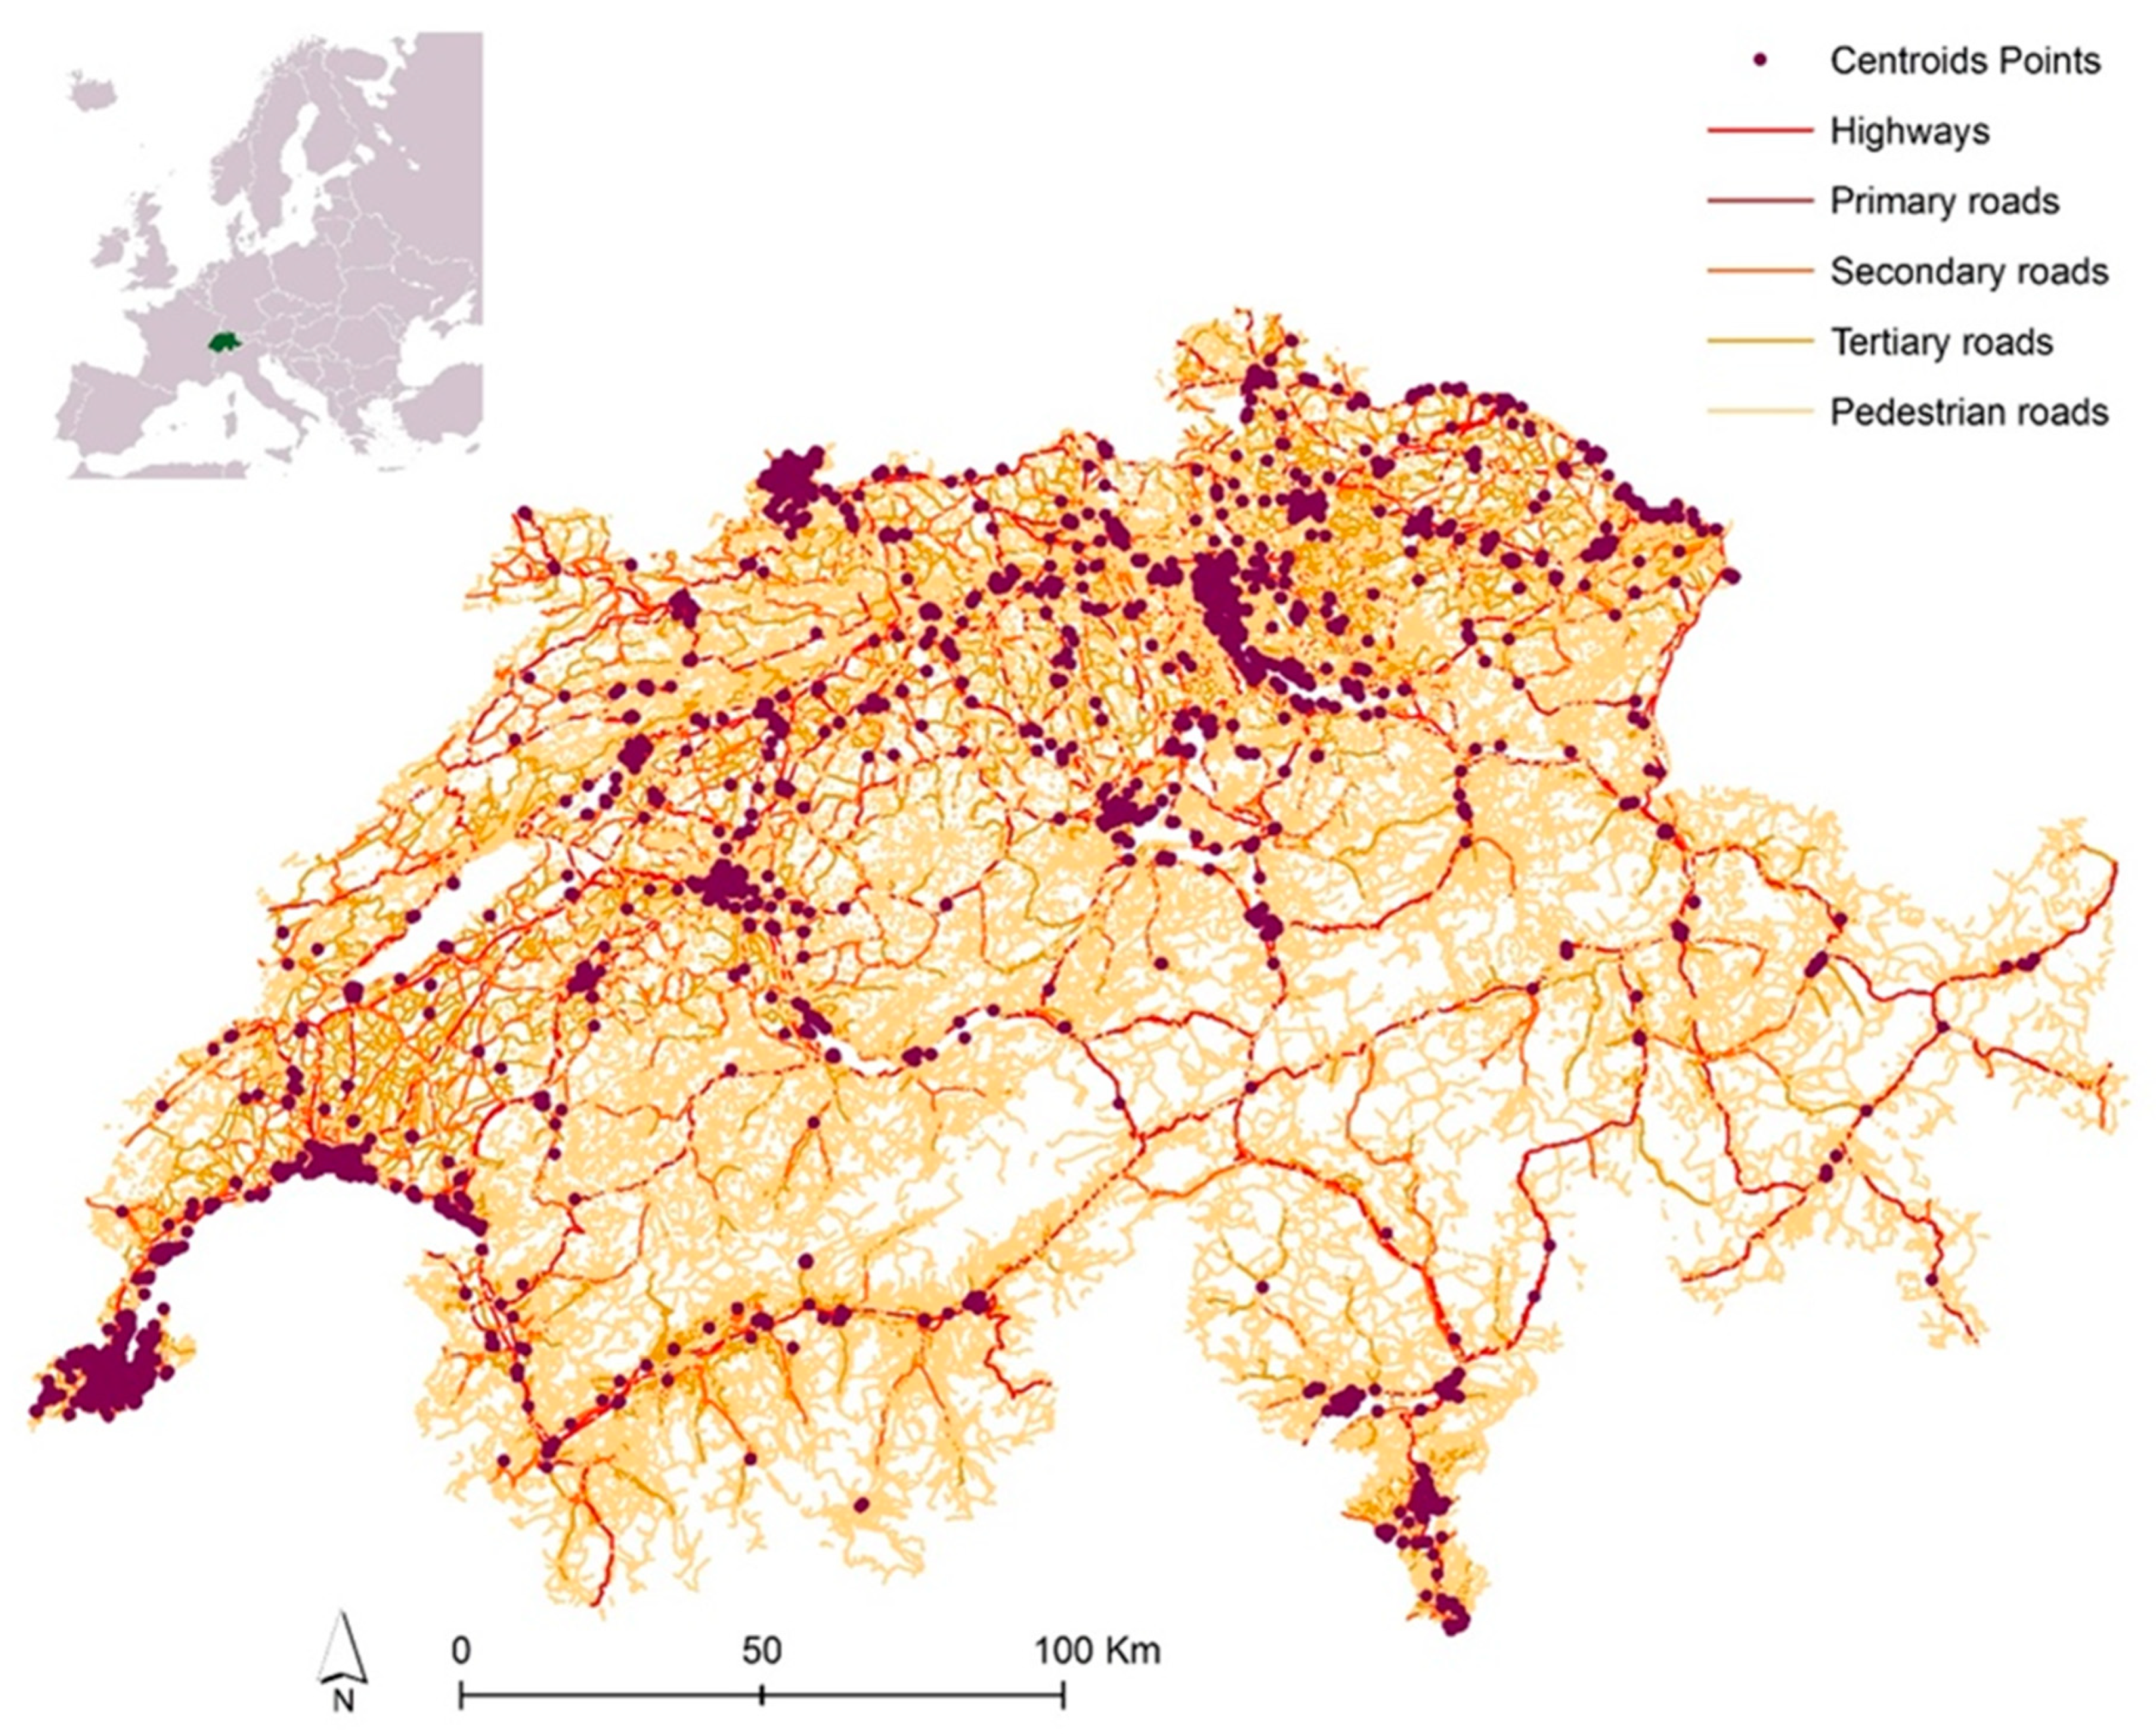
Figure 3.
Travel time to reach centroids of urban green spaces, using a walking and motorized model: (A) nationally, (C) for the canton of Zurich, (E) for the canton of Vaud; and using a walking-only model: (B) nationally, (D) for the canton of Zurich, (F) for the canton of Vaud.
Figure 3.
Travel time to reach centroids of urban green spaces, using a walking and motorized model: (A) nationally, (C) for the canton of Zurich, (E) for the canton of Vaud; and using a walking-only model: (B) nationally, (D) for the canton of Zurich, (F) for the canton of Vaud.

Figure 4.
Travel times to reach forest patches (A) with a walk and motorized travel scenario, and (B) with a walking-only scenario.
Figure 4.
Travel times to reach forest patches (A) with a walk and motorized travel scenario, and (B) with a walking-only scenario.

Figure 5.
(A) percentage of the population, per municipality, that have access within 15 min (walking and motorized scenario) to (A) the centroid of the nearest urban green space, and to (B) the nearest forest patch.
Figure 5.
(A) percentage of the population, per municipality, that have access within 15 min (walking and motorized scenario) to (A) the centroid of the nearest urban green space, and to (B) the nearest forest patch.
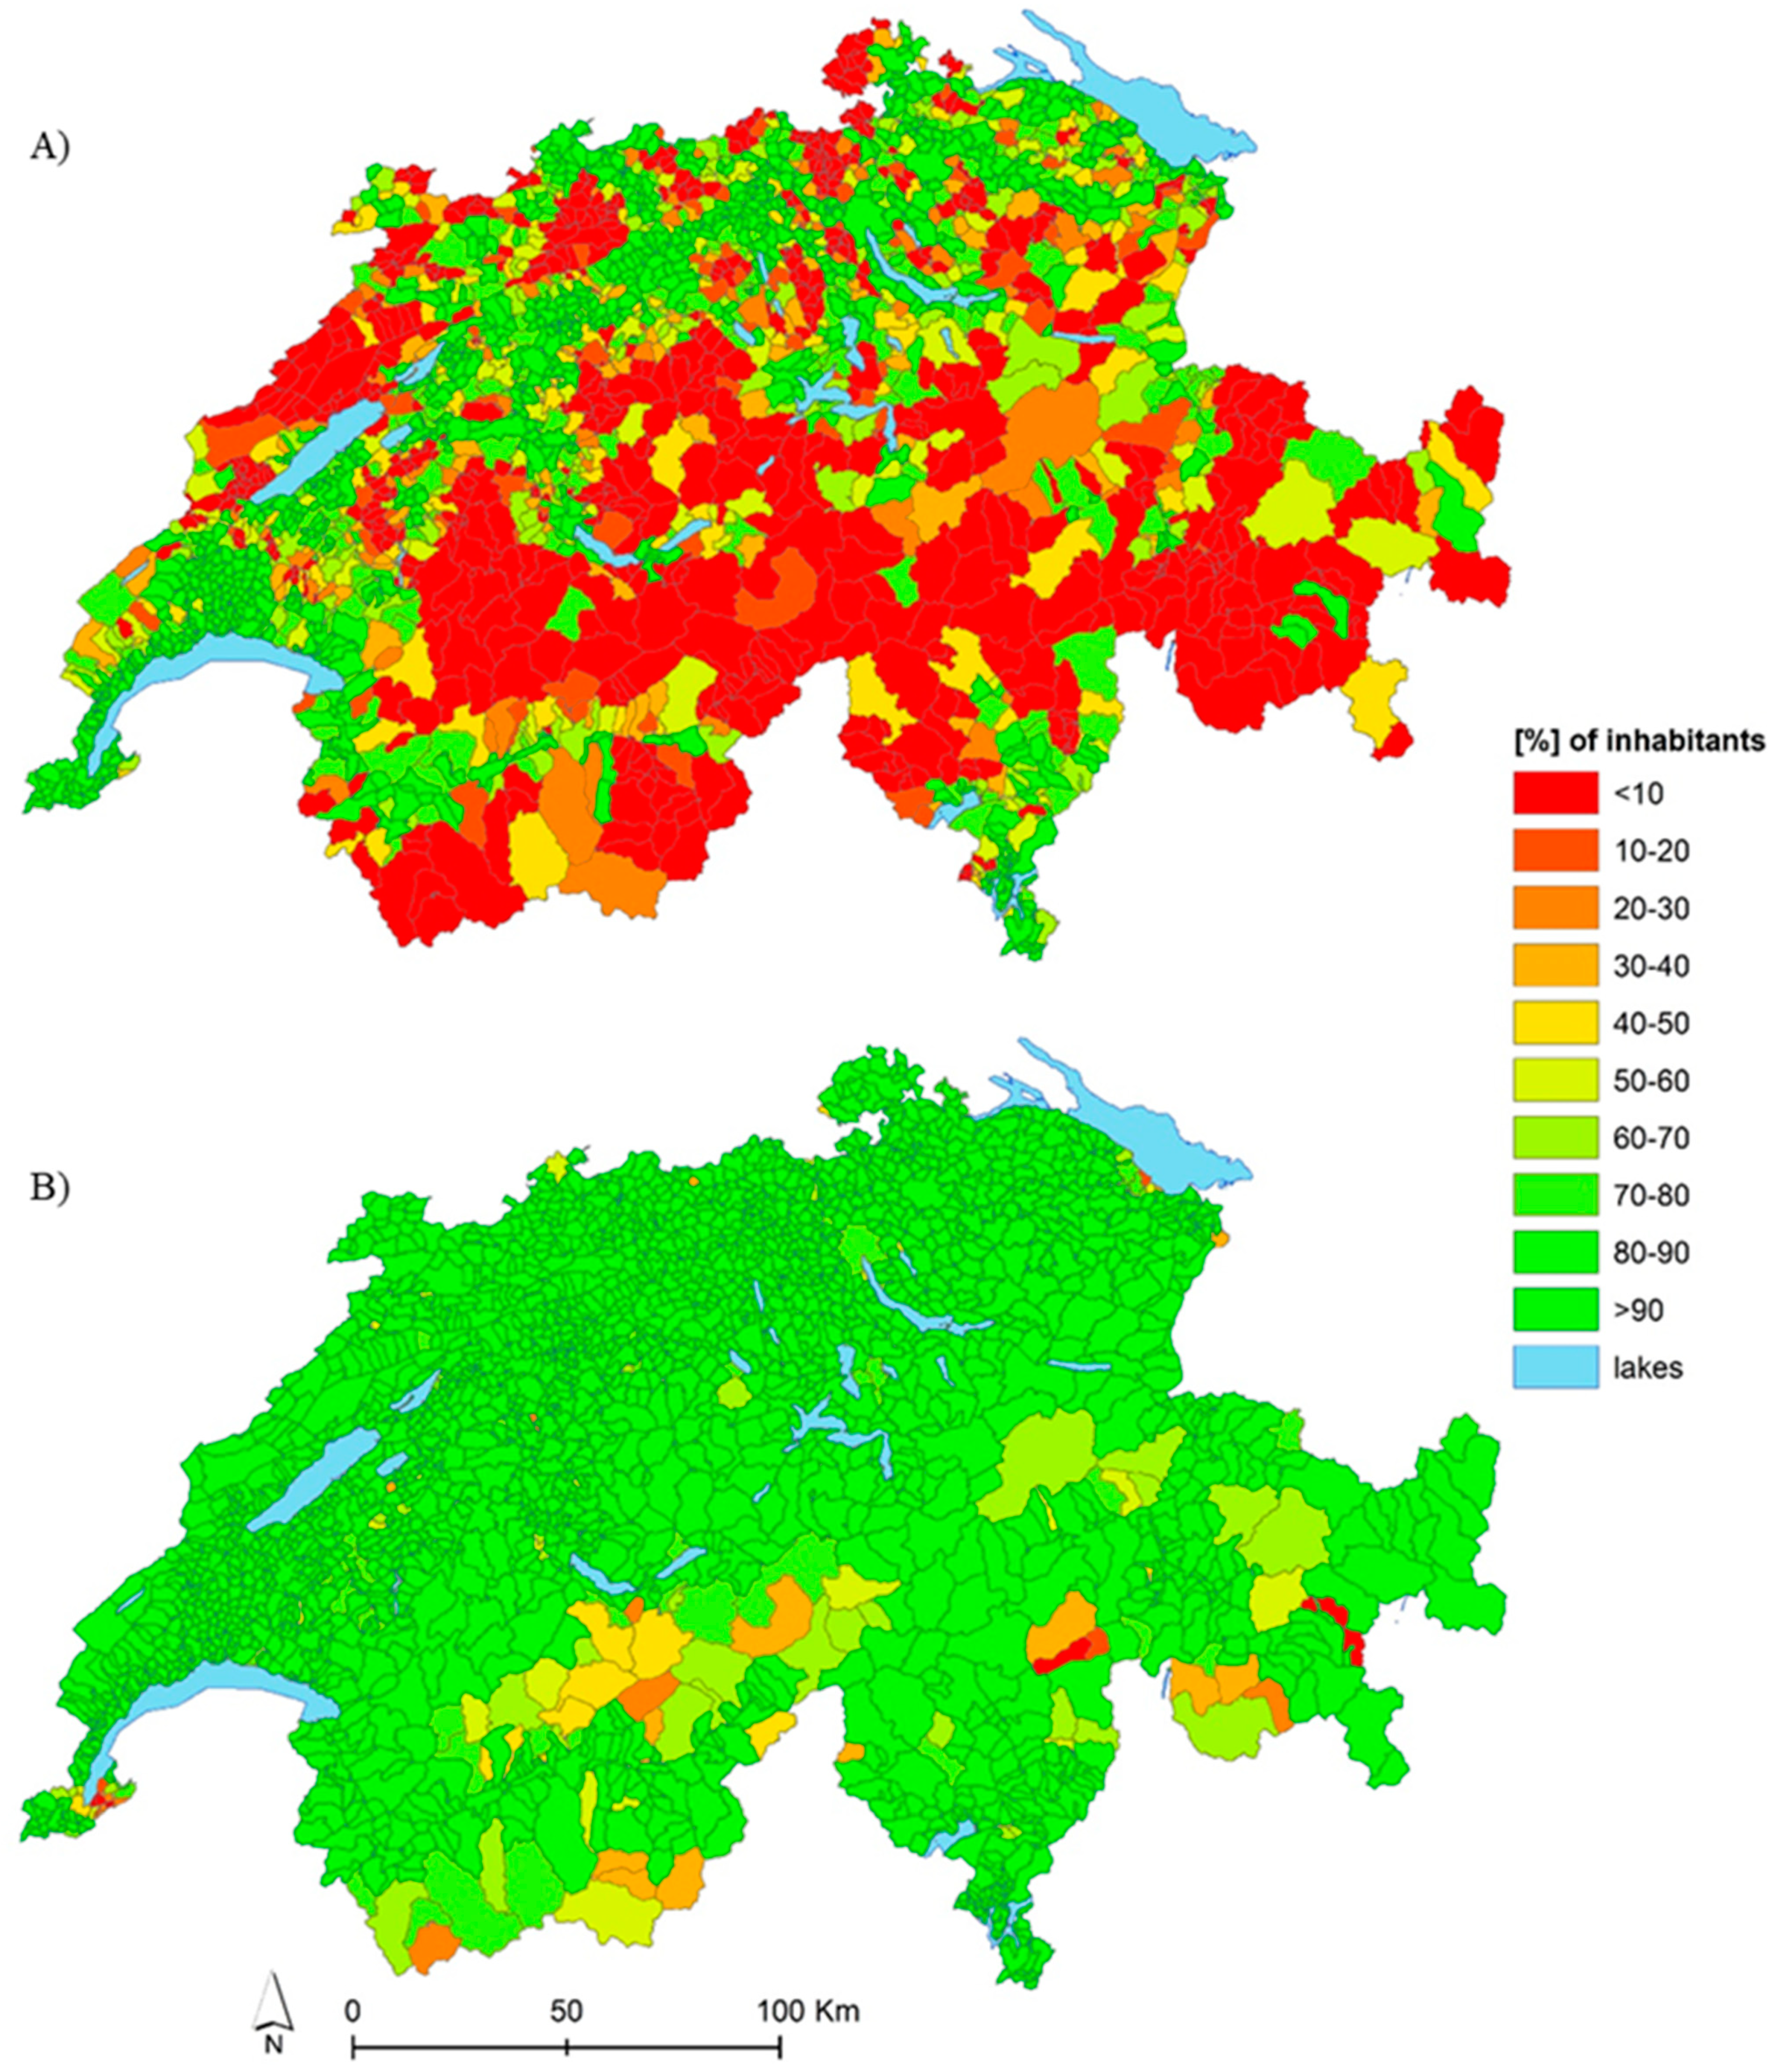
Figure 6.
Percentage of the population with access to a UGS within (A) 10 min and (B) 15 min, according to the urban typology of the municipalities. Percentage of the population with access to a forest within (C) 5 min and (D) 15 min. Model’s specifications are the same as in Figure 5.
Figure 6.
Percentage of the population with access to a UGS within (A) 10 min and (B) 15 min, according to the urban typology of the municipalities. Percentage of the population with access to a forest within (C) 5 min and (D) 15 min. Model’s specifications are the same as in Figure 5.


Table 1.
Geospatial layers used for analyzing the physical accessibility to public green spaces in Switzerland.
Table 1.
Geospatial layers used for analyzing the physical accessibility to public green spaces in Switzerland.
Table 2.
Description of the travel scenarios, with speeds and transport modes for each merged landcover categories.
Table 2.
Description of the travel scenarios, with speeds and transport modes for each merged landcover categories.
| Land Cover Merged Raster Category 1 | Label | Walking & Motorized Model | Walking-Only Model | ||
|---|---|---|---|---|---|
| Speed [km/h] 2 | Transport Mode 3 | Speed [km/h] 2 | Transport Mode 3 | ||
| 1 | Urban | 5 | Walking | 5 | Walking |
| 2 | Agricultural Land | 2 | Walking | 2 | Walking |
| 3 | Nature | 2 | Walking | 2 | Walking |
| 4 | Wetlands | 0 | - | 0 | - |
| 5 | Rivers and lakes | 0 | - | 0 | - |
| 1000 | Highways | 120 | Motorized | 0 | - |
| 1001 | Primary roads | 80 | Motorized | 5 | Walking |
| 1002 | Secondary roads | 60 | Motorized | 5 | Walking |
| 1003 | Tertiary roads | 50 | Motorized | 5 | Walking |
| 1004 | Pedestrian roads | 5 | Walking | 5 | Walking |
1 Railways and airports are also barriers and featured as NoData. 2 A speed of 0 means a complete barrier to travel. 3 In AccessMod, the Walking mode implies speed is affected by the slope, which is not the case for the Motorized mode.
Table 3.
Percentage of population that have access by walking and motorization to a green space or forest patch within a maximum travel time (PopTt), using different methods.
Table 3.
Percentage of population that have access by walking and motorization to a green space or forest patch within a maximum travel time (PopTt), using different methods.
| Methods | Destination Features | Model | PopTt [%] <5 min. | PopTt [%] <10 min. | PopTt [%] <15 min. |
|---|---|---|---|---|---|
| Centroids | UGS | Isotropic | 36.48 | 61.23 | 75.72 |
| Centroids | UGS | Anisotropic | 35.52 | 59.78 | 74.30 |
| Cost Distance | Forest | Isotropic | 51.97 | 81.84 | 92.17 |
Table 4.
Percentage of population that have access to a green space using their centroid and the anisotropic model (PopTt-UGS), and percentage of population that have access to a forest patch (PopTt-Forest) using the isotropic model, within a maximum travel time.
Table 4.
Percentage of population that have access to a green space using their centroid and the anisotropic model (PopTt-UGS), and percentage of population that have access to a forest patch (PopTt-Forest) using the isotropic model, within a maximum travel time.
| PopTt-UGS [%] | PopTt-Forest [%] | |||||
|---|---|---|---|---|---|---|
| Canton | <5 min. | <10 min. | <15 min. | <5 min. | <10 min. | <15 min. |
| Zurich (ZH) | 33.41 | 60.02 | 75.74 | 40.88 | 77.52 | 92.85 |
| Bern (BE) | 30.29 | 57.10 | 72.74 | 60.93 | 89.75 | 95.93 |
| Lucerne (LU) | 24.76 | 47.87 | 65.88 | 49.23 | 86.33 | 96.02 |
| Uri (UR) | 43.82 | 57.27 | 62.05 | 67.78 | 92.12 | 95.06 |
| Schwyz (SZ) | 19.29 | 46.01 | 63.30 | 41.40 | 79.99 | 91.94 |
| Obwald (OW) | 3.59 | 7.93 | 11.29 | 64.27 | 90.23 | 96.57 |
| Nidwald (NW) | 20.13 | 41.18 | 58.66 | 49.21 | 80.89 | 93.72 |
| Glarus (GL) | 20.74 | 40.42 | 54.22 | 55.95 | 78.15 | 82.49 |
| Zug (ZG) | 29.05 | 66.04 | 80.40 | 33.82 | 70.58 | 91.51 |
| Fribourg (FR) | 24.06 | 46.94 | 65.54 | 58.40 | 87.35 | 95.48 |
| Soleure (SO) | 23.15 | 56.42 | 77.33 | 73.98 | 95.96 | 99.30 |
| Basel-City (BS) | 78.03 | 93.16 | 98.04 | 6.77 | 27.61 | 55.73 |
| Basel-Country (BL) | 44.38 | 73.12 | 86.53 | 55.14 | 87.73 | 98.33 |
| Schaffhouse (SH) | 39.41 | 61.50 | 70.67 | 63.04 | 90.08 | 95.85 |
| Appenzell Out. (AR) | 18.02 | 35.20 | 57.16 | 69.02 | 90.74 | 97.33 |
| Appenzell In. (AI) | 12.84 | 40.54 | 51.01 | 50.38 | 81.83 | 91.47 |
| St-Gall (SG) | 31.42 | 57.52 | 71.80 | 53.13 | 86.65 | 95.33 |
| Grisons (GR) | 18.02 | 32.45 | 48.51 | 68.48 | 88.79 | 92.37 |
| Argovia (AG) | 22.05 | 49.89 | 71.17 | 56.78 | 90.38 | 96.33 |
| Thurgovia (TG) | 30.43 | 62.39 | 82.97 | 45.65 | 77.33 | 88.82 |
| Ticino (TI) | 44.89 | 69.53 | 79.69 | 84.10 | 97.26 | 98.29 |
| Vaud (VD) | 46.15 | 73.84 | 87.76 | 54.66 | 83.82 | 95.54 |
| Valais (VS) | 31.22 | 54.34 | 65.50 | 65.52 | 88.08 | 92.06 |
| Neuchâtel (NE) | 2.19 | 5.92 | 11.29 | 67.06 | 94.35 | 98.45 |
| Geneva (GE) | 91.70 | 98.14 | 99.32 | 15.19 | 39.41 | 62.78 |
| Jura (JU) | 27.05 | 46.73 | 65.74 | 60.30 | 89.29 | 96.97 |
Table 5.
Percentage of population that have access to an urban green space, using their centroid and the anisotropic walking-only model (PopTt-UGS) for urban footprints provided by Copernicus and GHSL.
Table 5.
Percentage of population that have access to an urban green space, using their centroid and the anisotropic walking-only model (PopTt-UGS) for urban footprints provided by Copernicus and GHSL.
| Urban Center | Population- Copernicus | Population- GHSL | PopTt-UGS [%] Copernicus/GHSL | ||
|---|---|---|---|---|---|
| <5 min. | <10 min. | <15 min. | |||
| Geneva | 392,360 | 430,183 | 90.64/90.41 | 98.56/98.73 | 99.36/99.42 |
| Lausanne | 241,507 | 258,769 | 56.94/62.19 | 78.93/88.34 | 86.59/96.29 |
| Montreux | - | 65,269 | -/32.33 | -/67.10 | -/84.26 |
| Freiburg | - | 57,452 | -/50.85 | -/79.06 | -/93.06 |
| Biel | 57,165 | 64,774 | 48.86/47.45 | 86.96/86.03 | 91.82/92.62 |
| Bern | 220,774 | 196,515 | 43.90/49.26 | 67.63/76.84 | 75.77/85.56 |
| Basel | 308,518 | 332,709 | 60.31/58.54 | 86.14/84.85 | 95.02/95.39 |
| Thun | - | 65,111 | -/11.57 | -/33.00 | -/56.61 |
| Olten | - | 53,989 | -/29.57 | -/57.70 | -/76.93 |
| Wettingen | - | 56,116 | -/39.00 | -/70.42 | -/85.18 |
| Lucerne | 158,895 | 142,037 | 28.89/34.11 | 51.63/63.46 | 66.49/81.51 |
| Zurich | 646,675 | 735,718 | 46.53/45.03 | 72.20/71.71 | 85.71/85.67 |
| Zug | - | 56,268 | -/20.44 | -/58.70 | -/71.96 |
| Winterthur | 106,777 | 92,907 | 52.44/59.64 | 82.86/90.07 | 92.45/96.57 |
| Lugano | 86,847 | 74,617 | 38.98/43.61 | 67.99/76.63 | 80.16/90.66 |
| Constance | - | 20,434 | -/34.60 | -/71.90 | -/95.75 |
| St. Gallen | 78,422 | 73,607 | 38.38/43.62 | 59.44/67.61 | 70.73/75.99 |
| Total | 2,297,943.97 | 2,776,484.05 | 55.3/53.5 | 77.8/78.5 | 86.8/89.2 |
Publisher’s Note: MDPI stays neutral with regard to jurisdictional claims in published maps and institutional affiliations. |
© 2021 by the authors. Licensee MDPI, Basel, Switzerland. This article is an open access article distributed under the terms and conditions of the Creative Commons Attribution (CC BY) license (https://creativecommons.org/licenses/by/4.0/).
Share and Cite
MDPI and ACS Style
Chênes, C.; Giuliani, G.; Ray, N. Modelling Physical Accessibility to Public Green Spaces in Switzerland to Support the SDG11. Geomatics 2021, 1, 383-398. https://0-doi-org.brum.beds.ac.uk/10.3390/geomatics1040022
AMA Style
Chênes C, Giuliani G, Ray N. Modelling Physical Accessibility to Public Green Spaces in Switzerland to Support the SDG11. Geomatics. 2021; 1(4):383-398. https://0-doi-org.brum.beds.ac.uk/10.3390/geomatics1040022
Chicago/Turabian StyleChênes, Camille, Gregory Giuliani, and Nicolas Ray. 2021. "Modelling Physical Accessibility to Public Green Spaces in Switzerland to Support the SDG11" Geomatics 1, no. 4: 383-398. https://0-doi-org.brum.beds.ac.uk/10.3390/geomatics1040022