
Vibration Analyses of a Gantry Structure by Mobile Phone Digital Image Correlation and Interferometric Radar †


Abstract
:1. Introduction
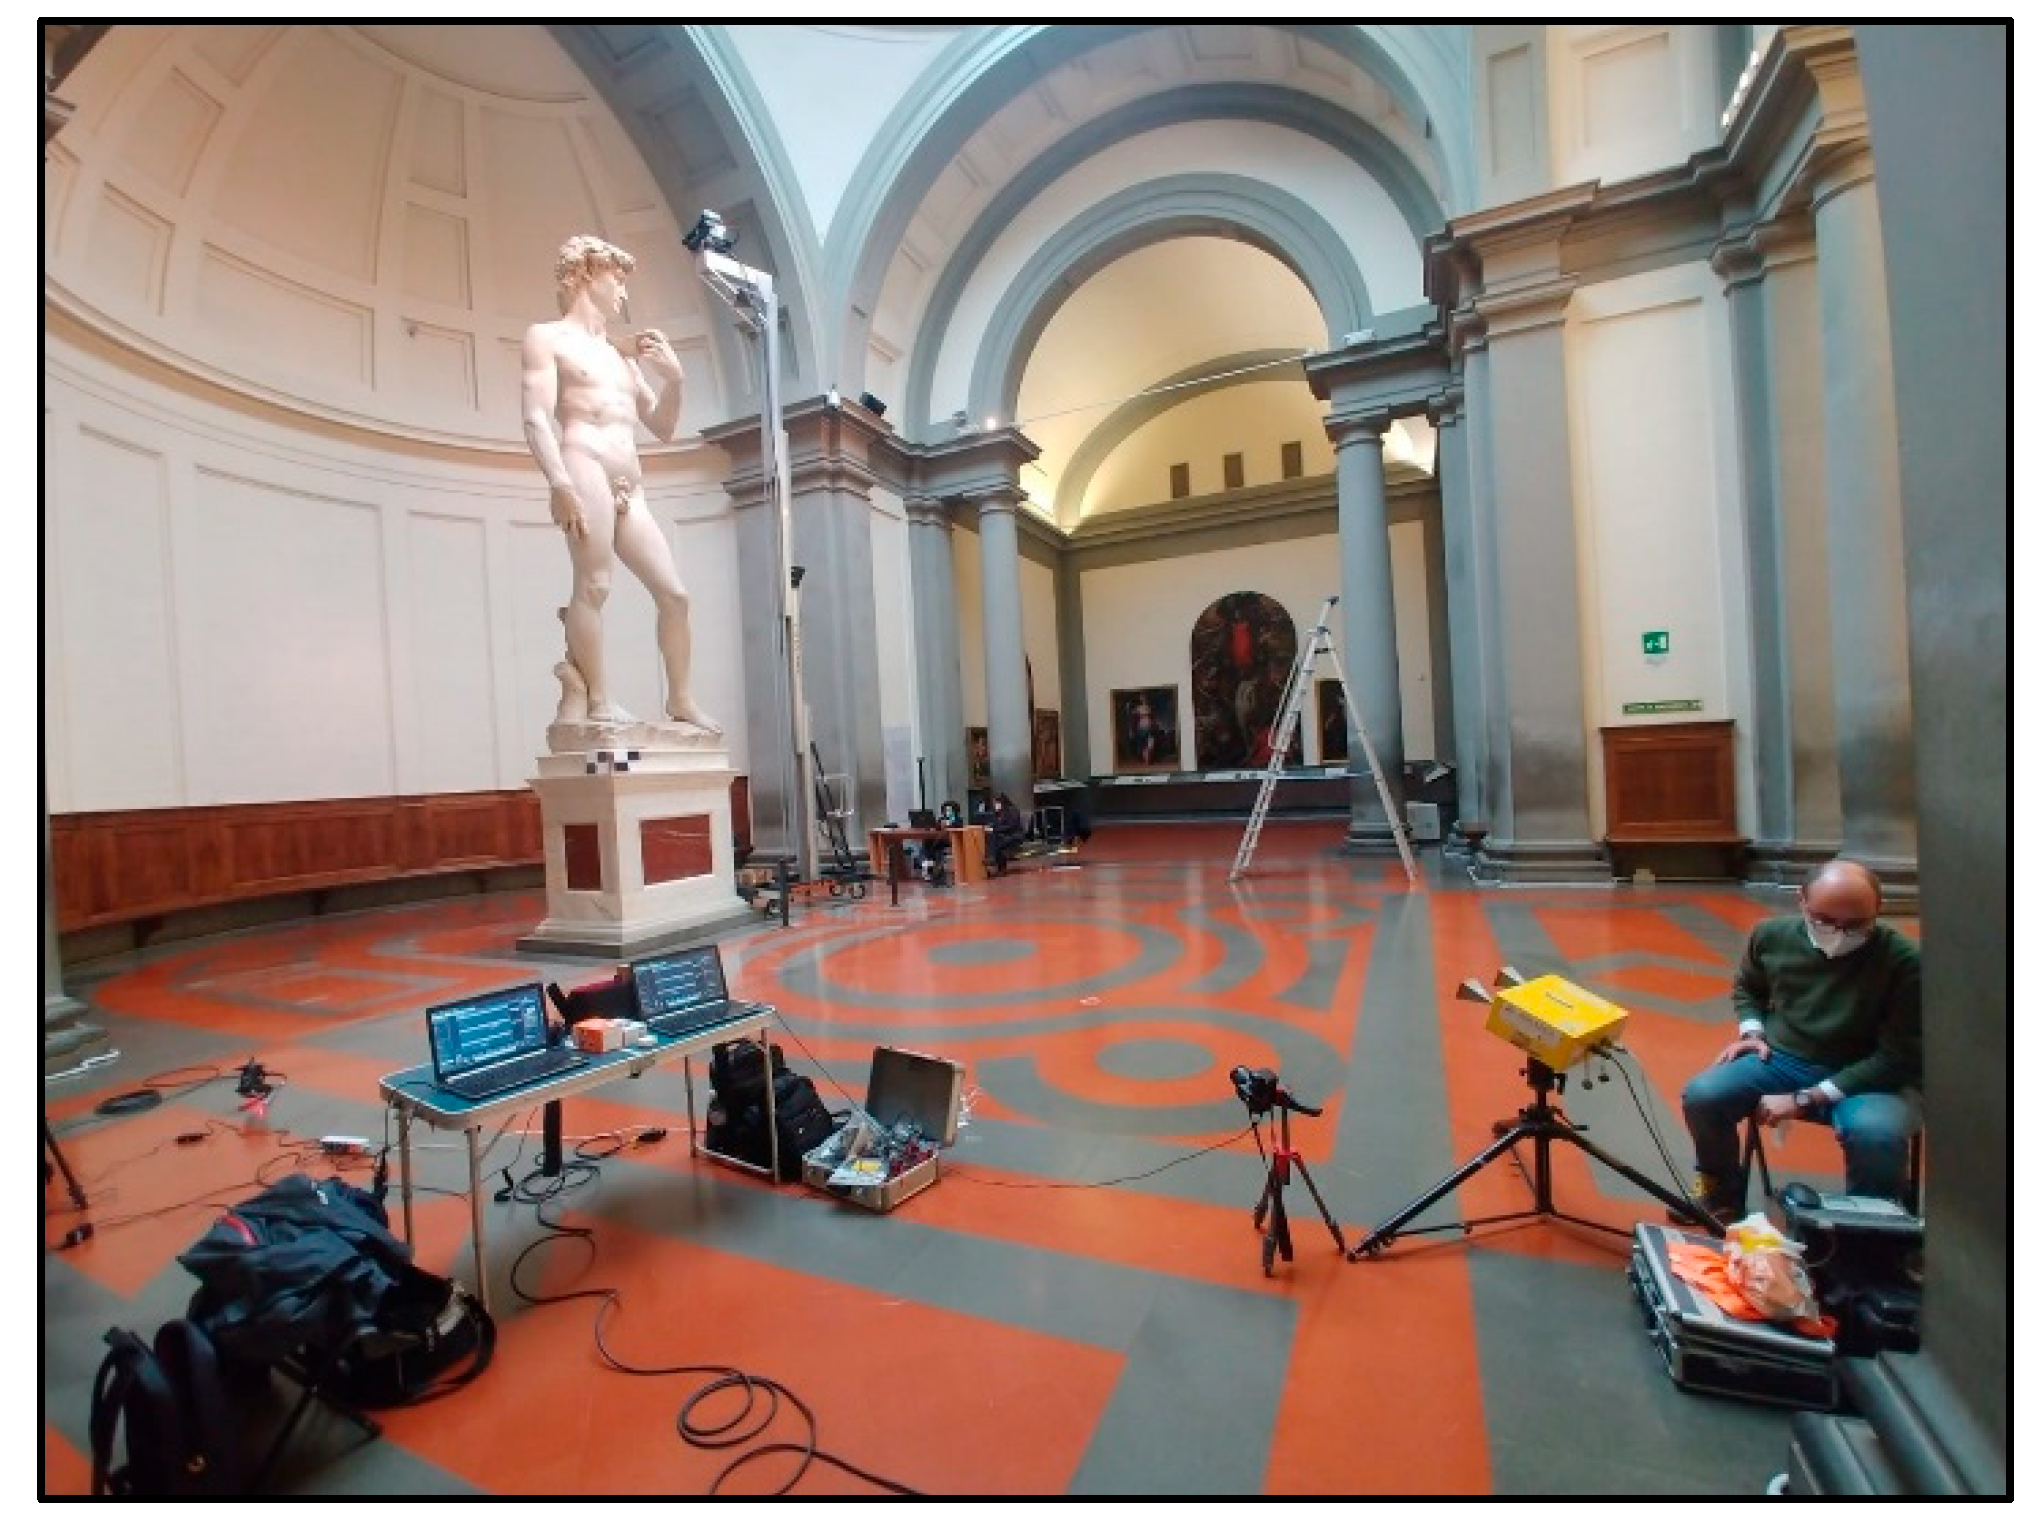
2. Test Site
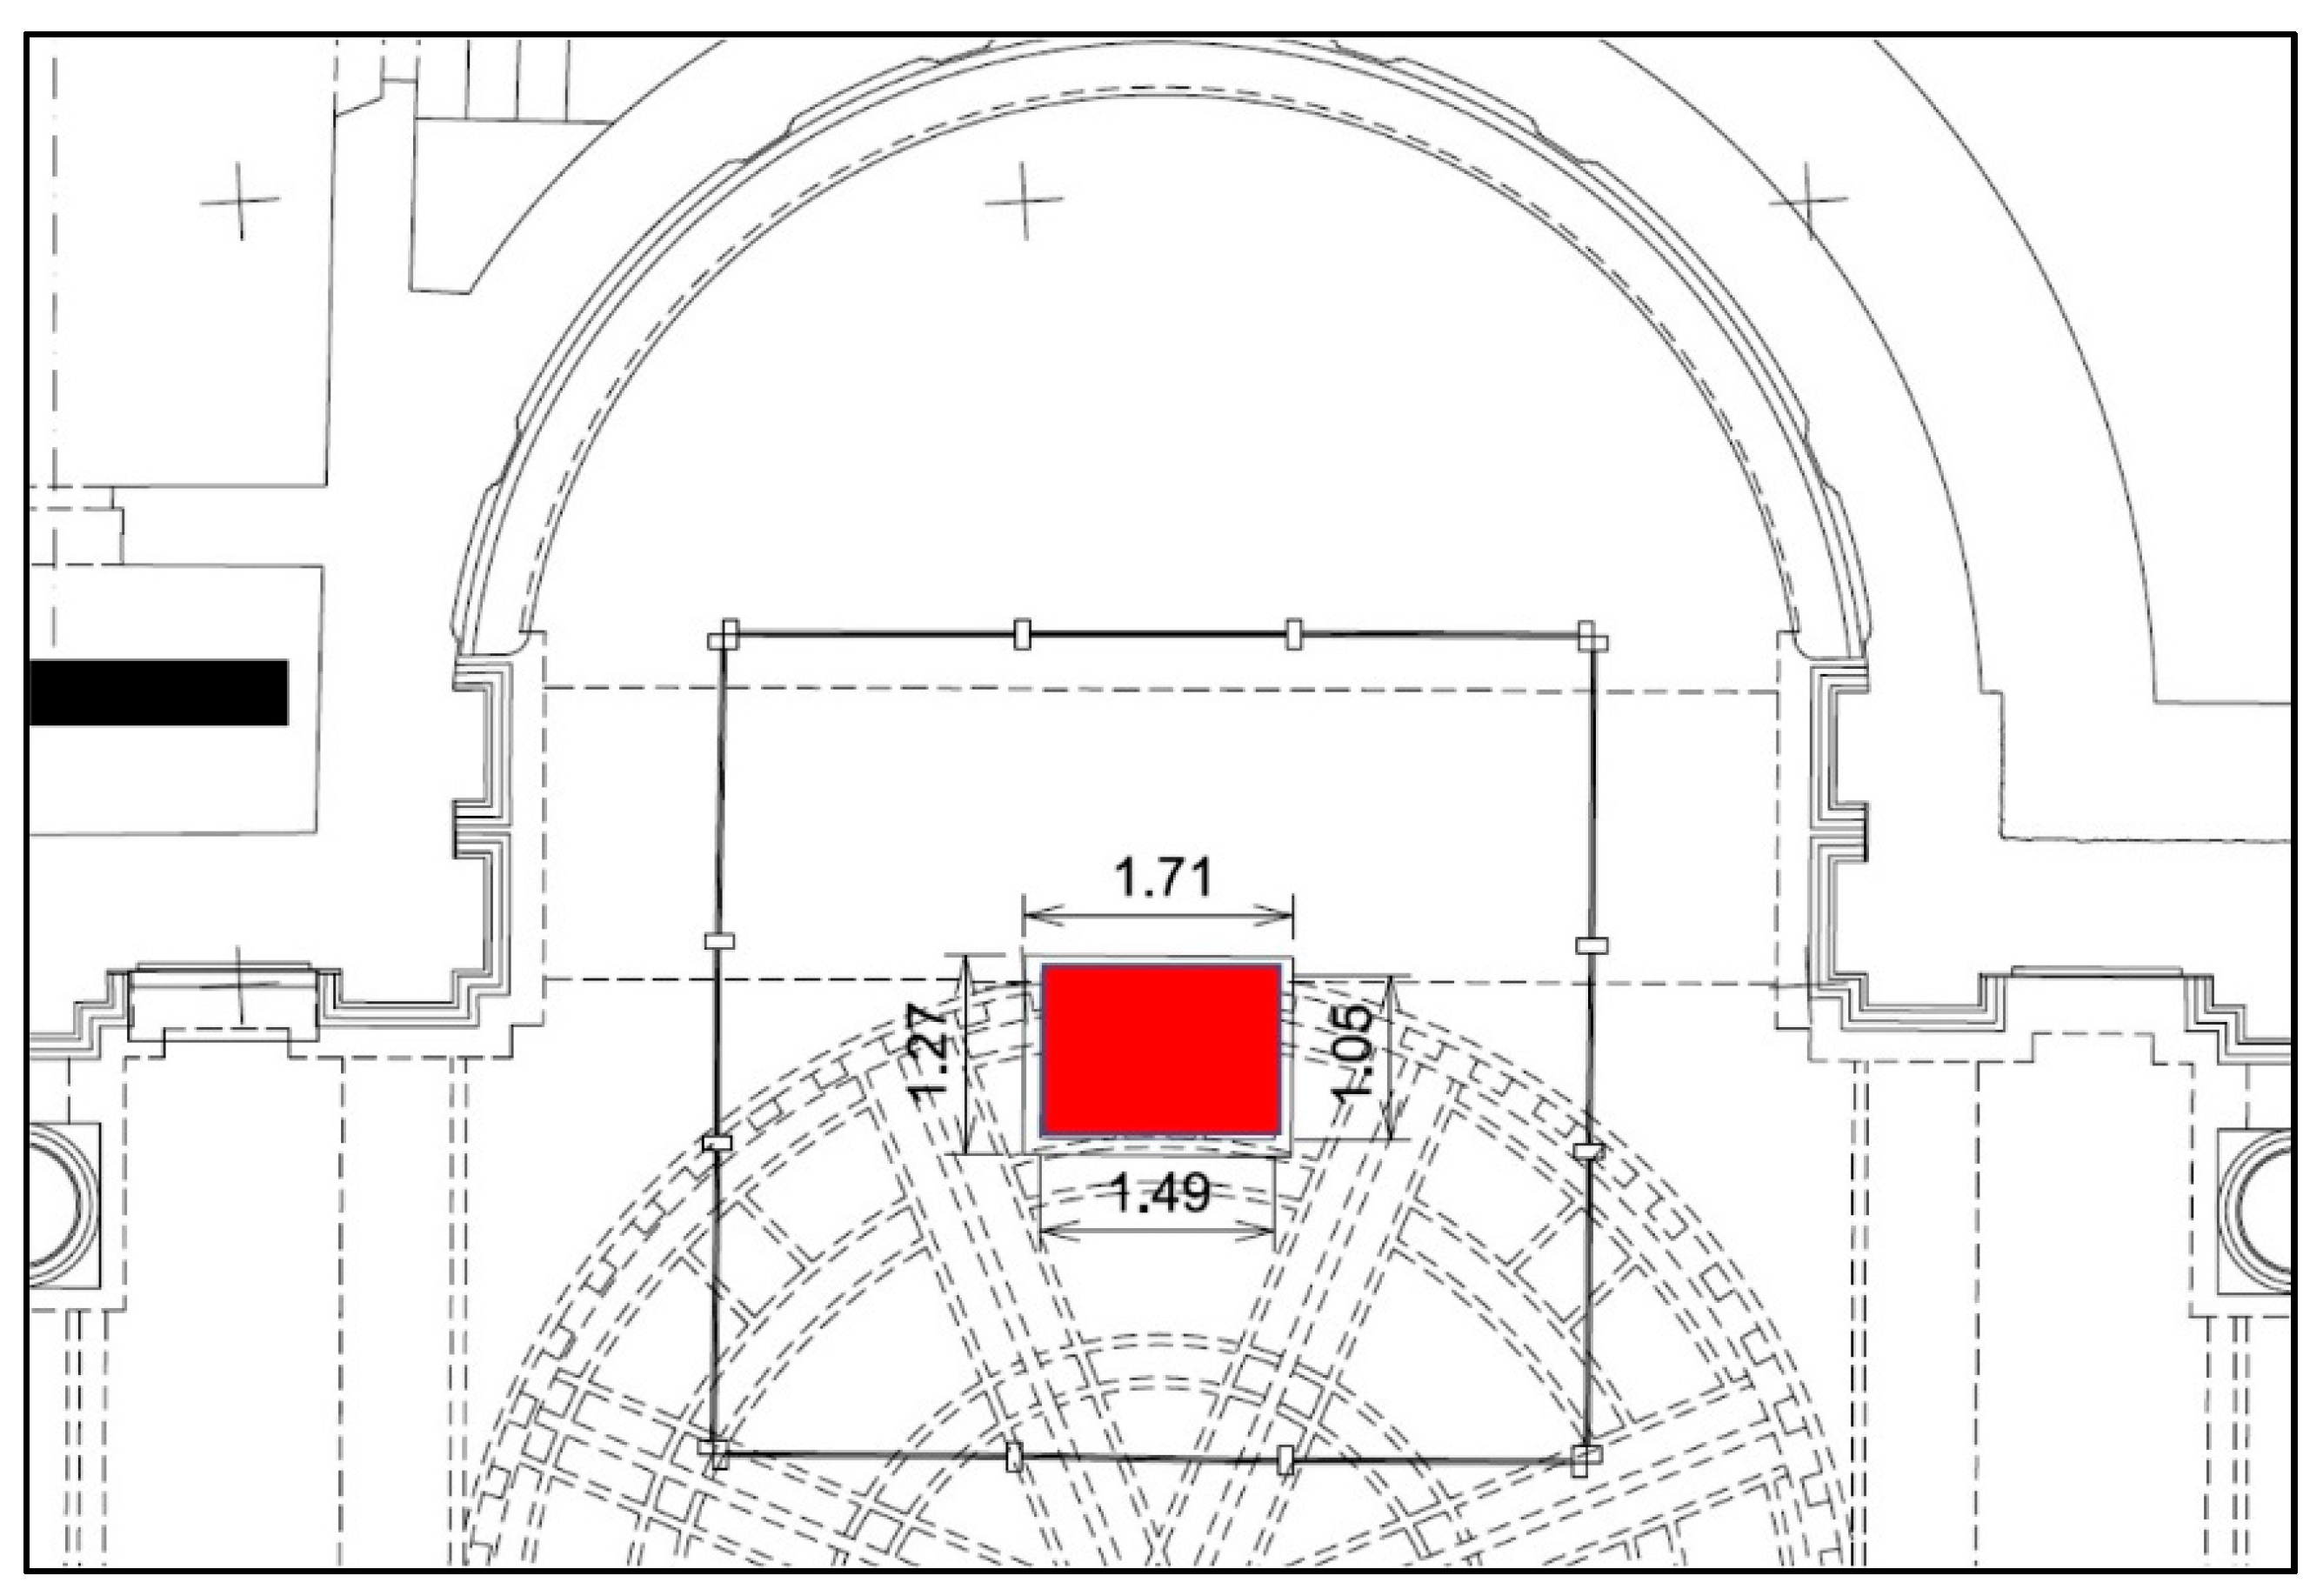
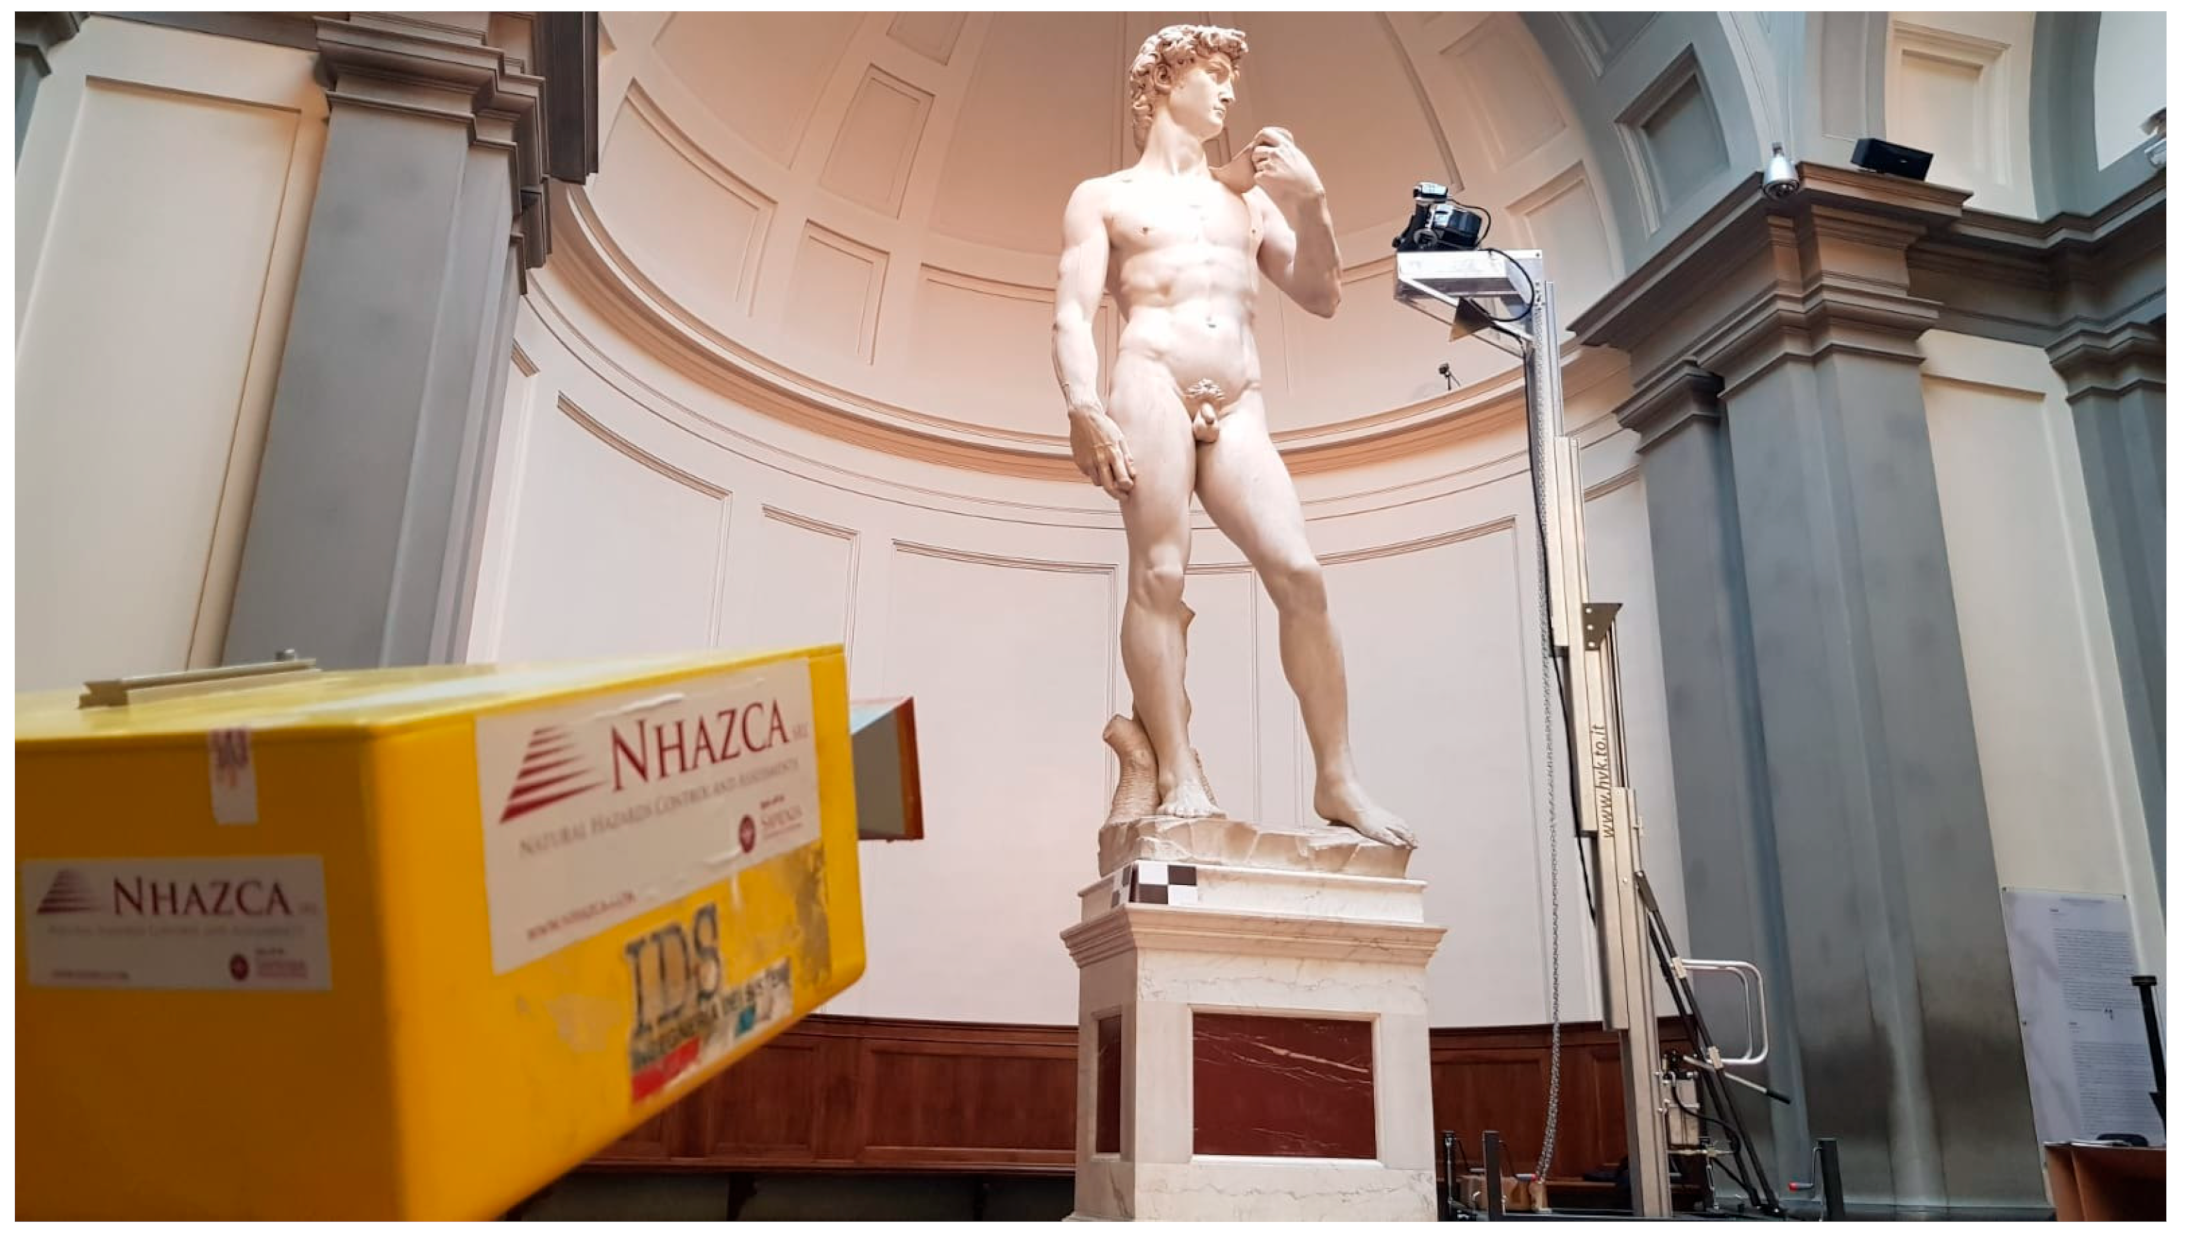
2.1. The Venue
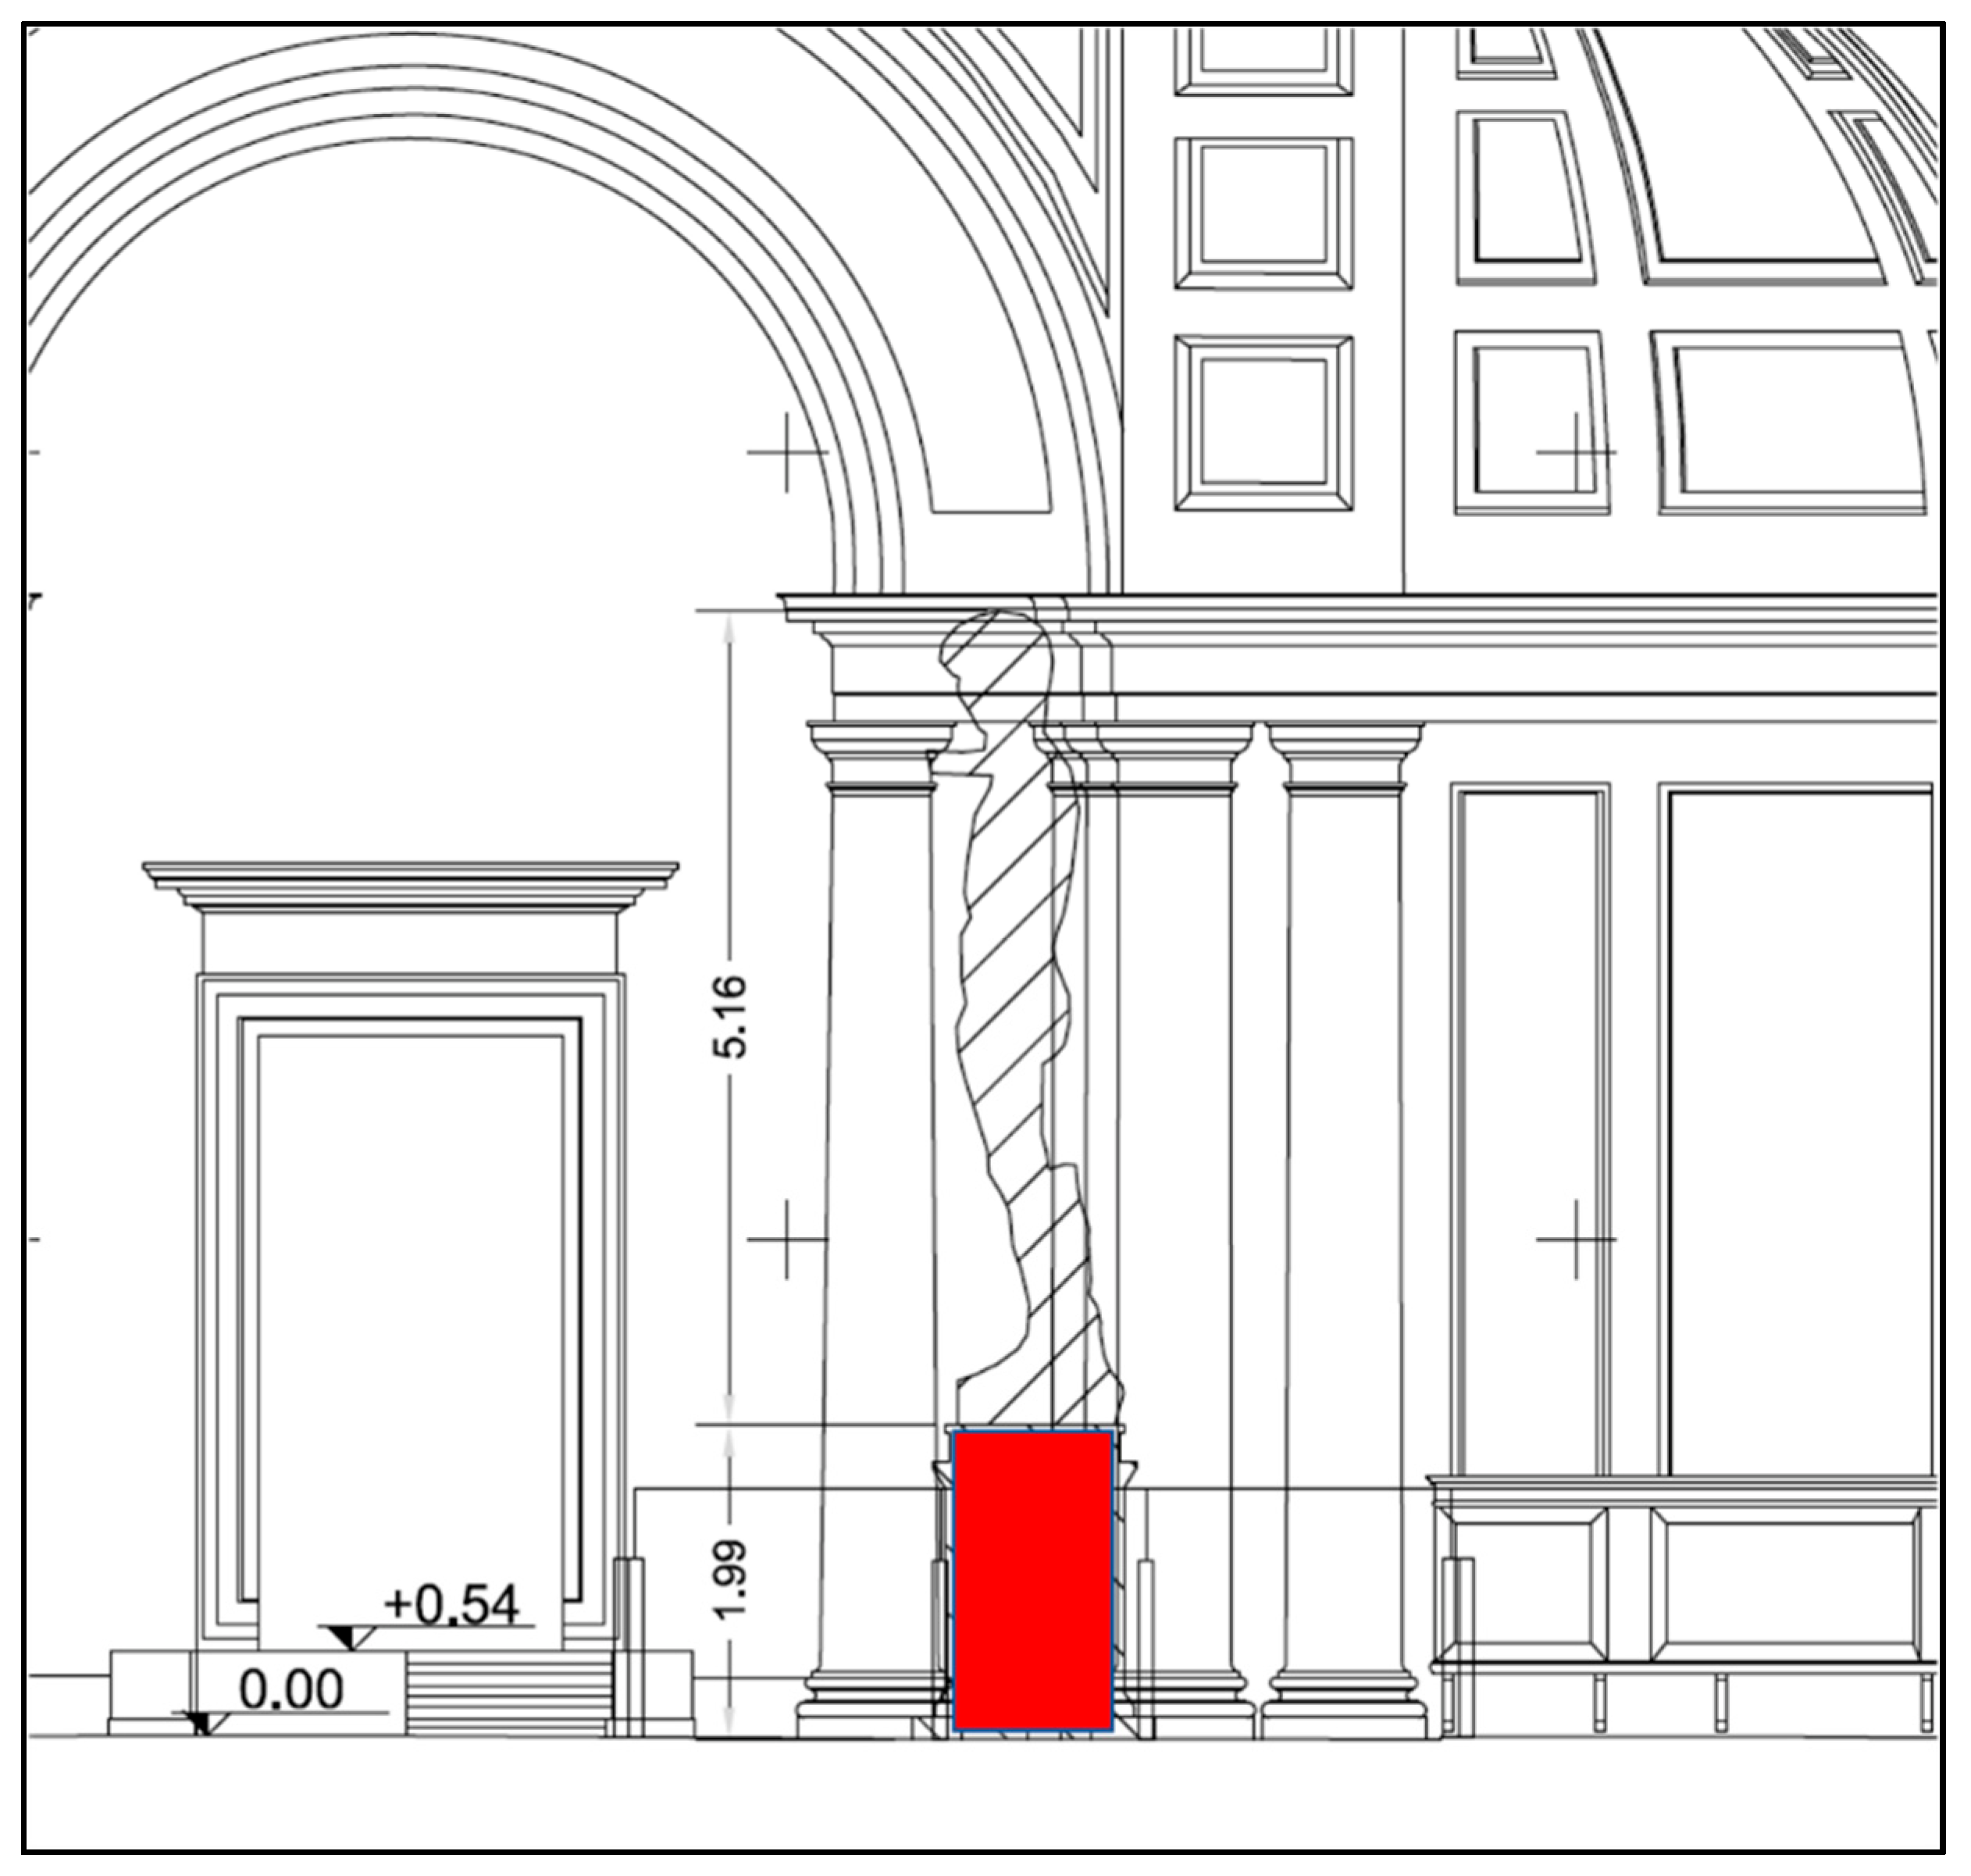
2.2. The Statue
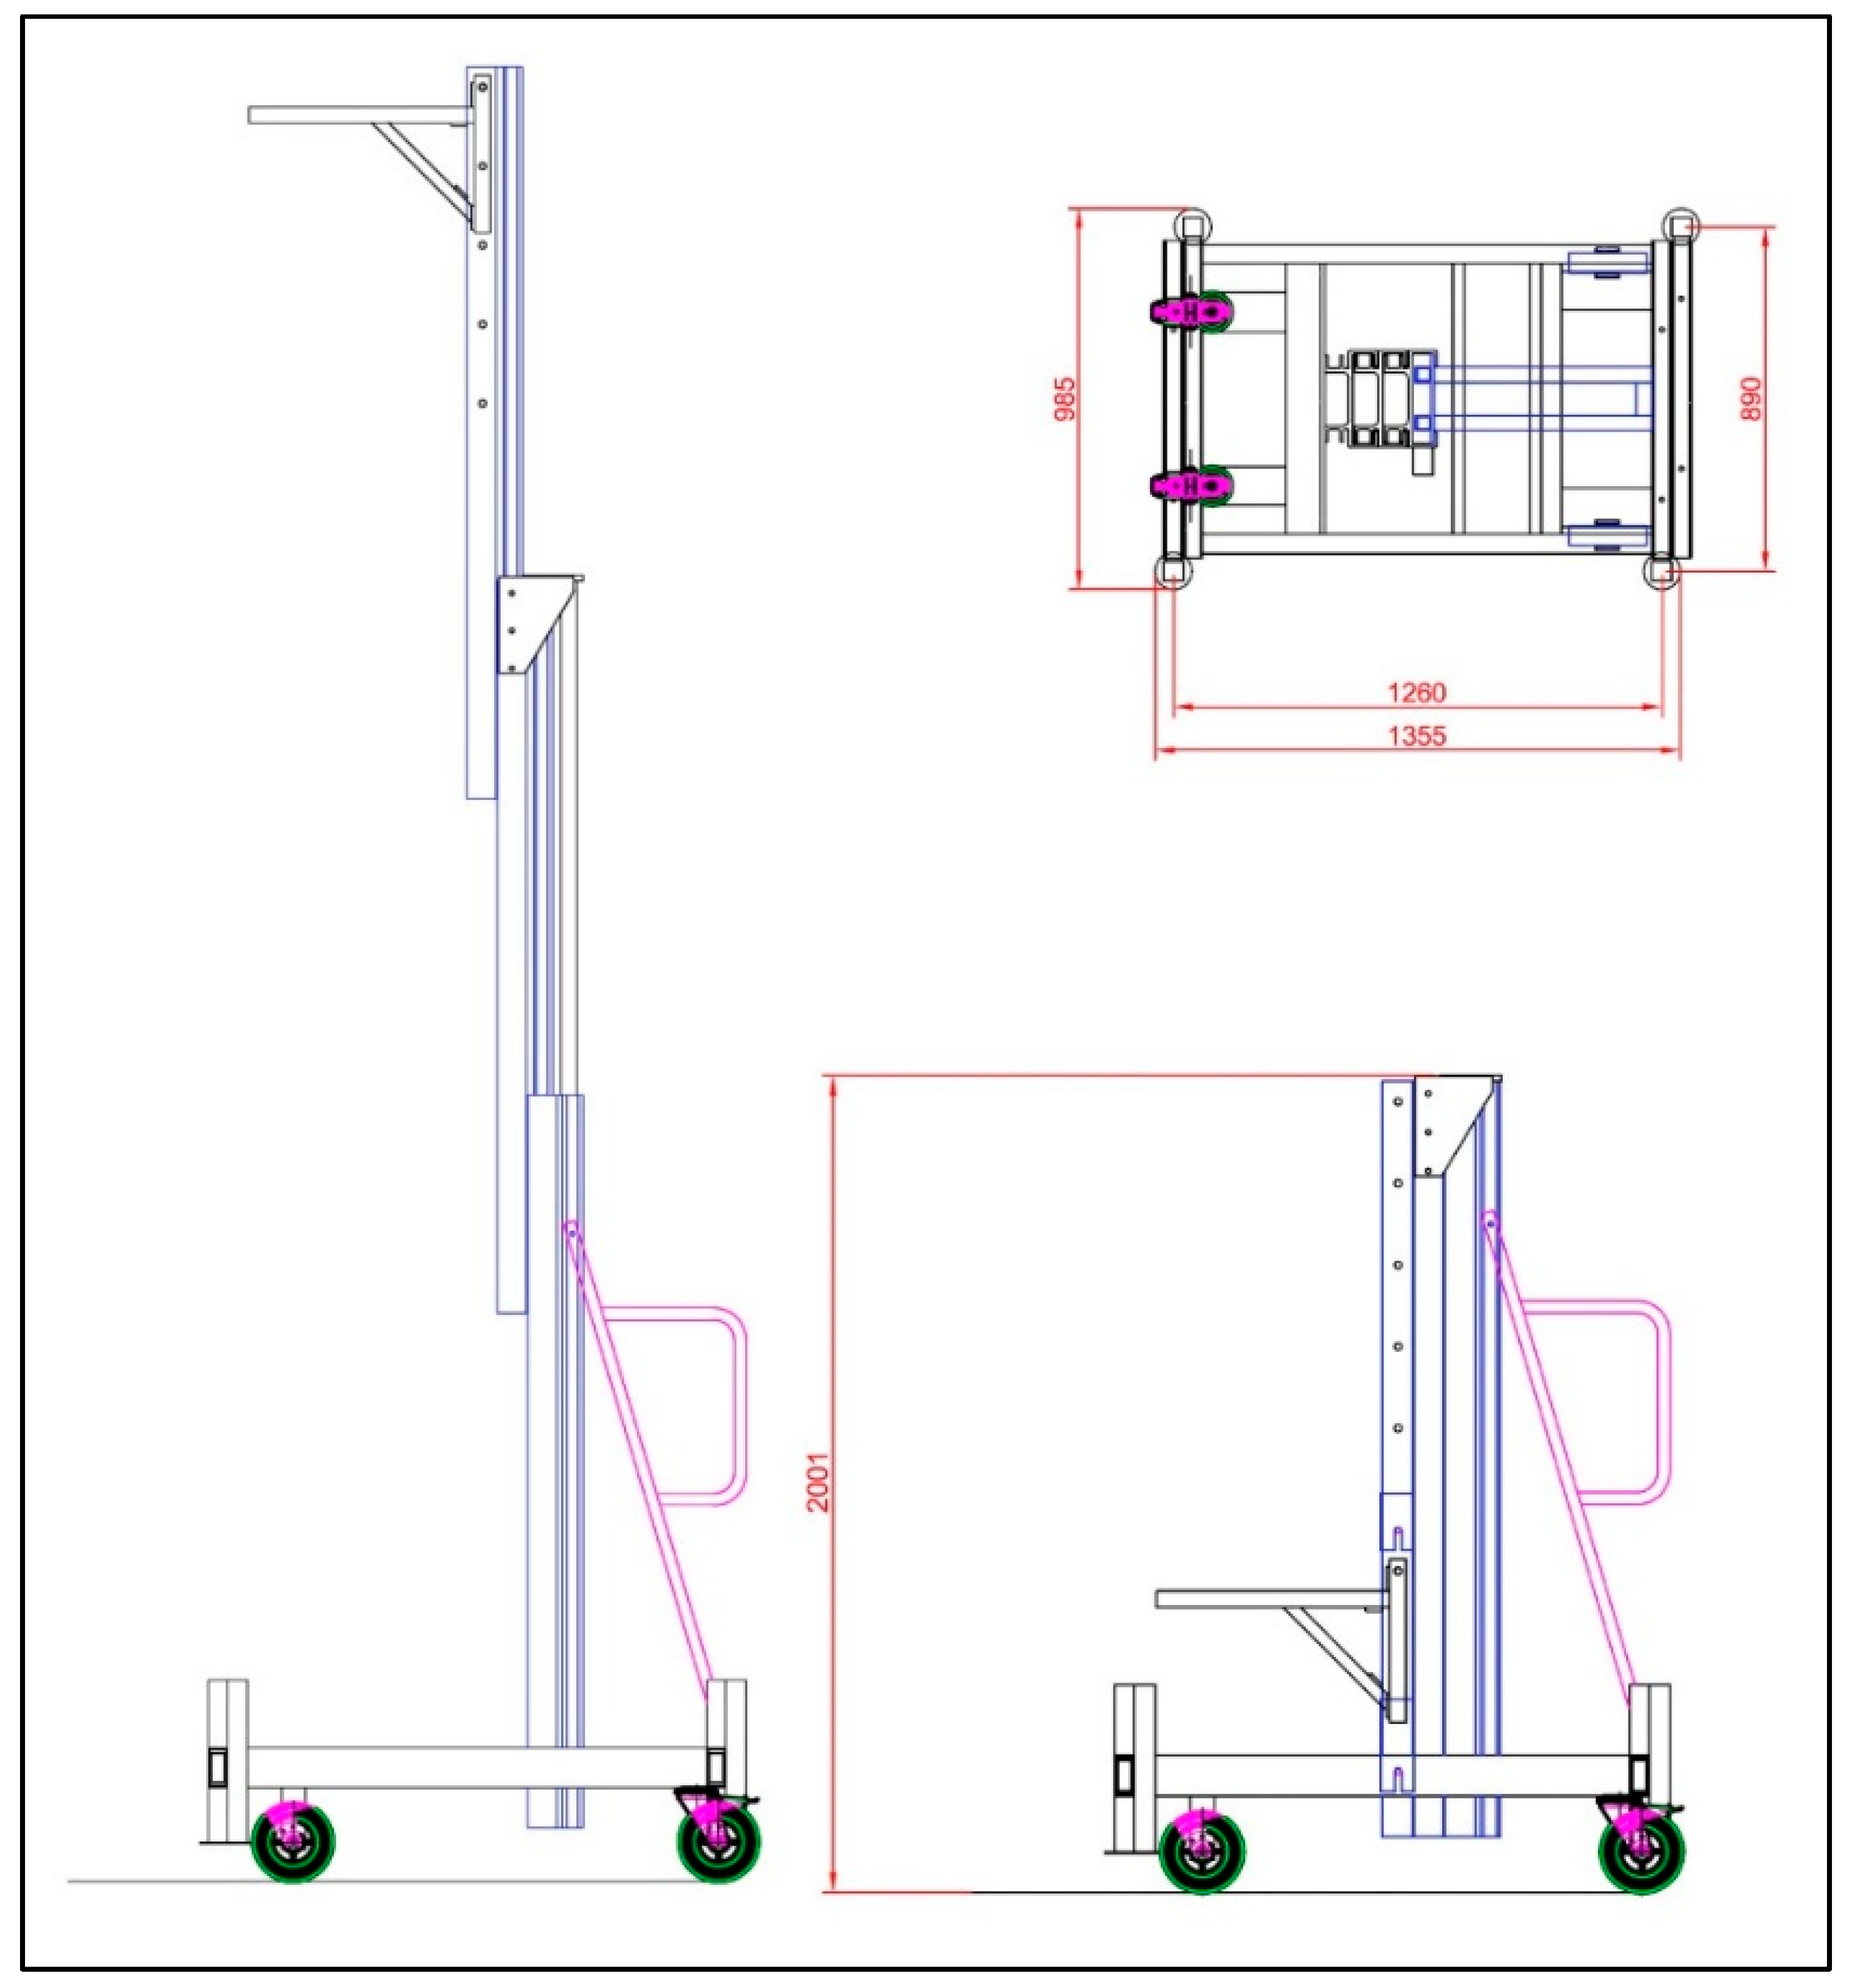
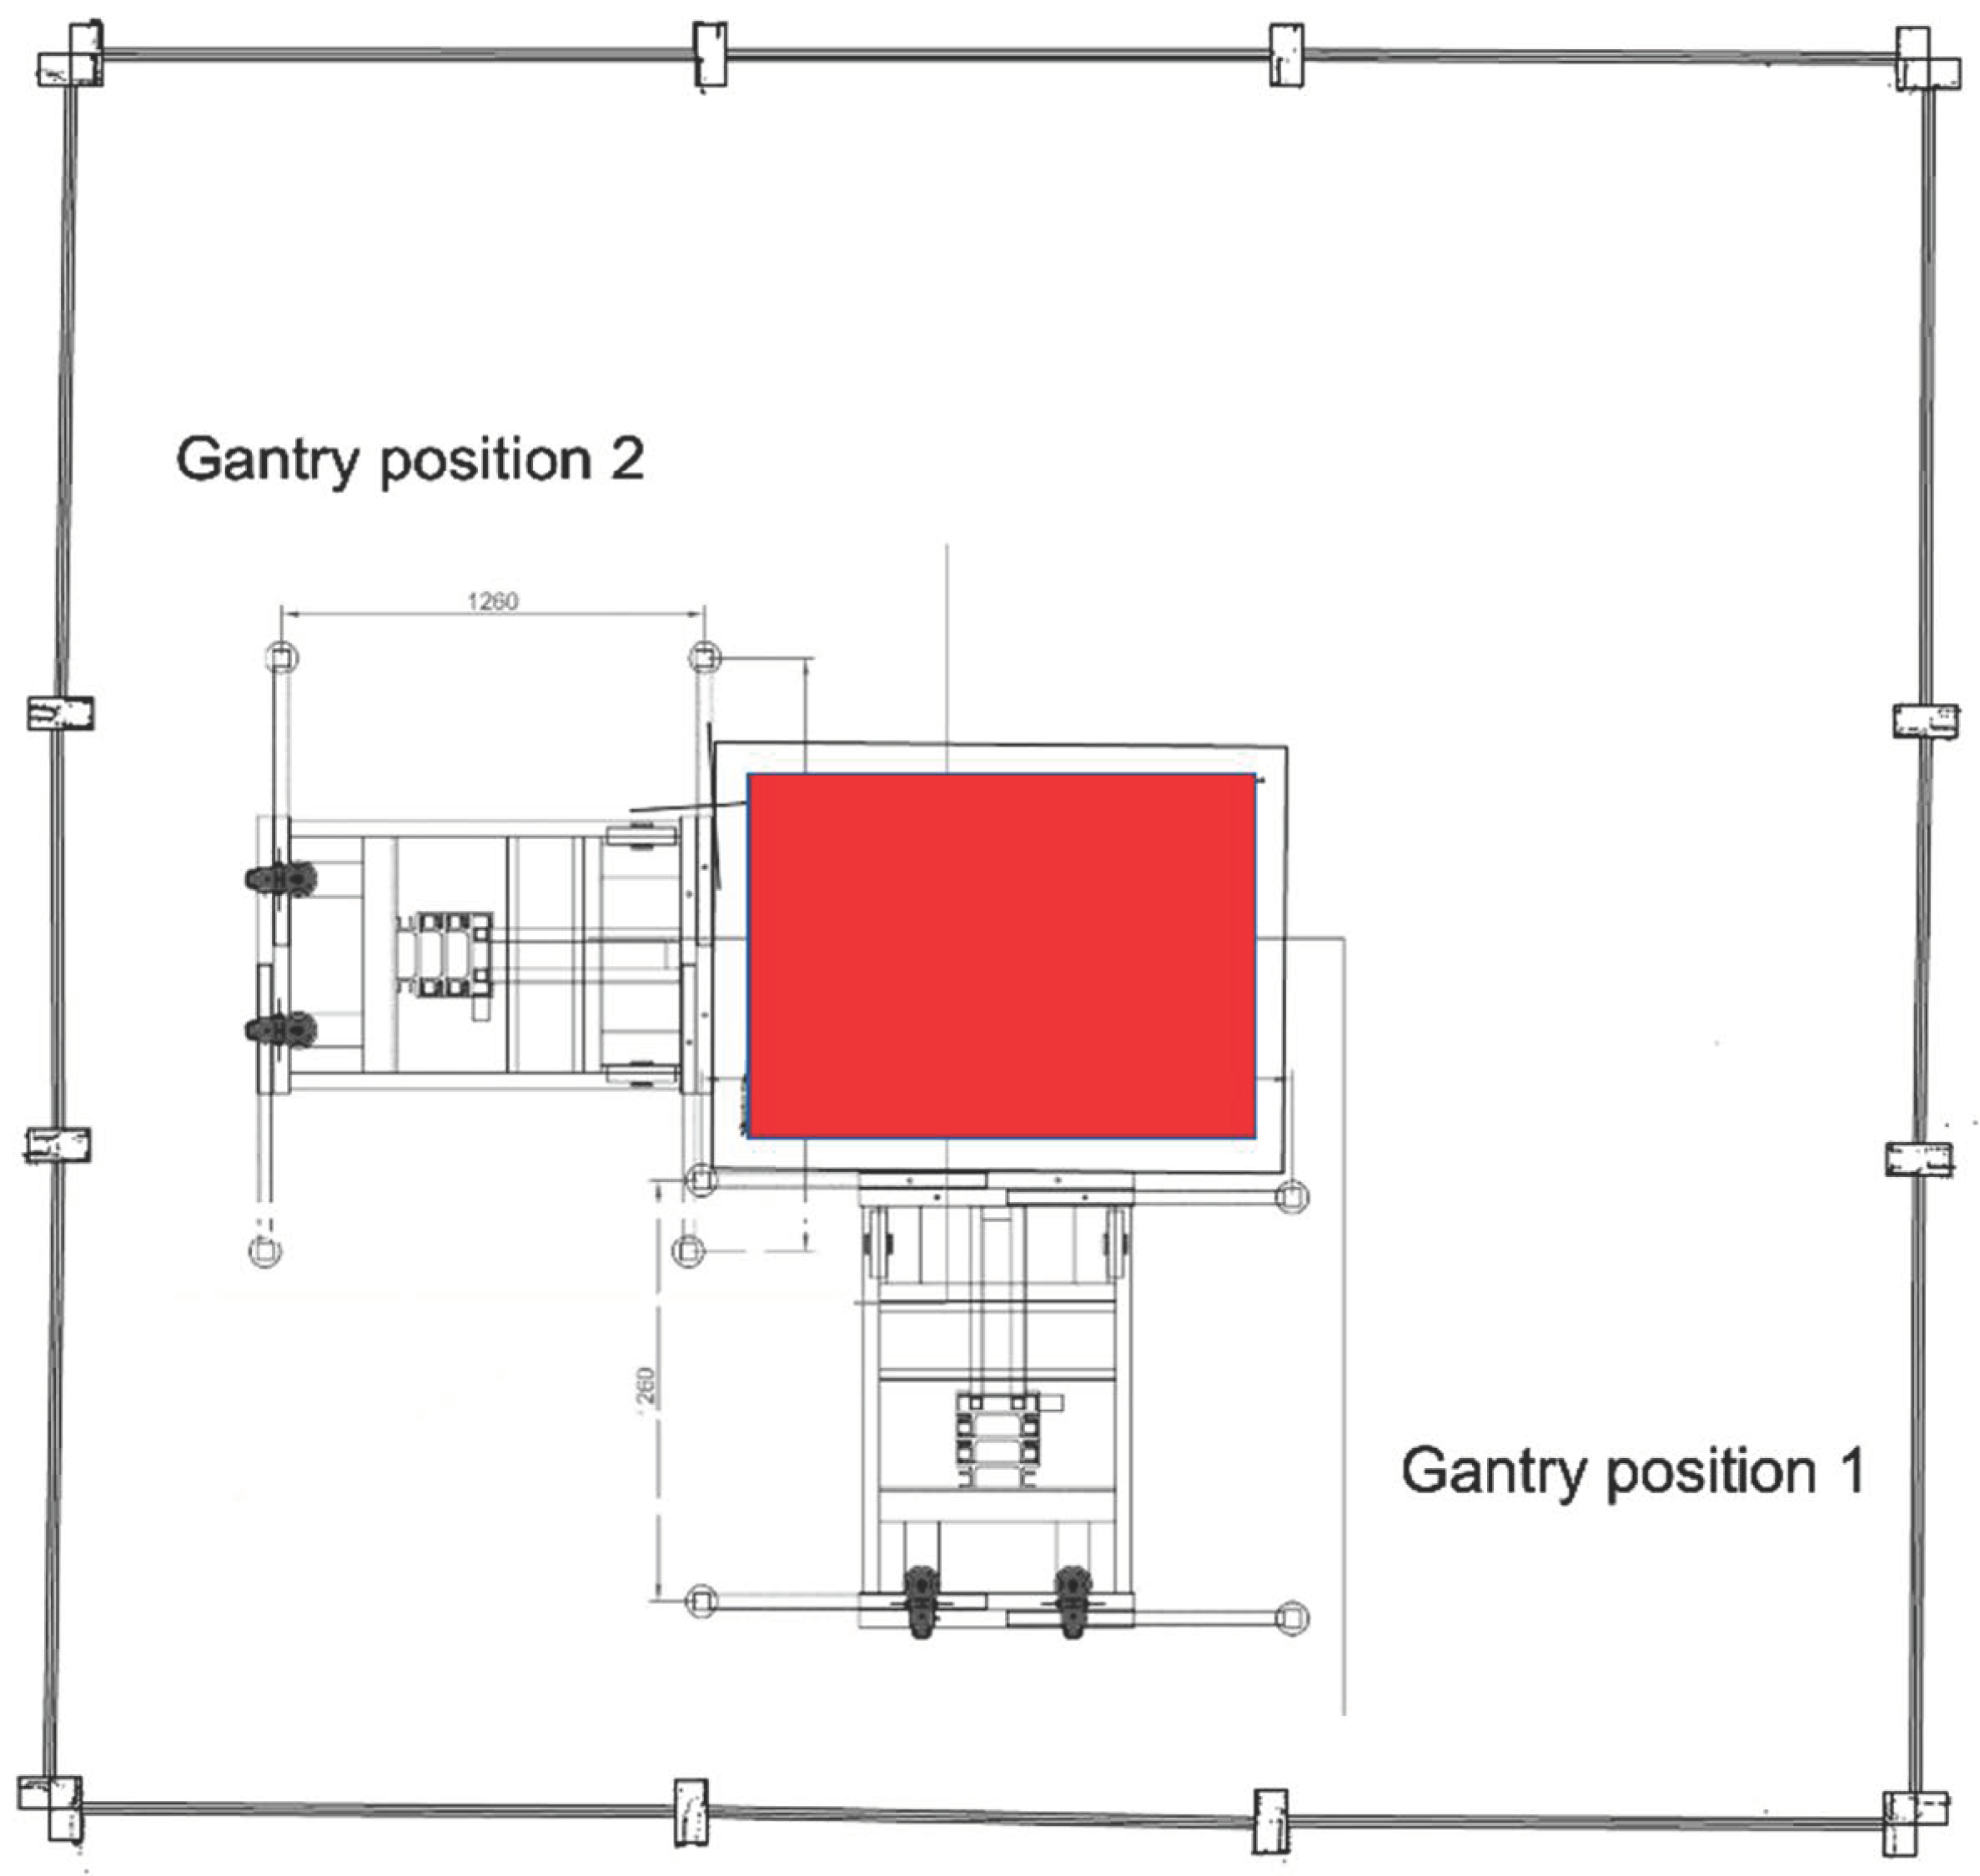
2.3. The Gantry
3. Materials and Methods
3.1. TInRAR
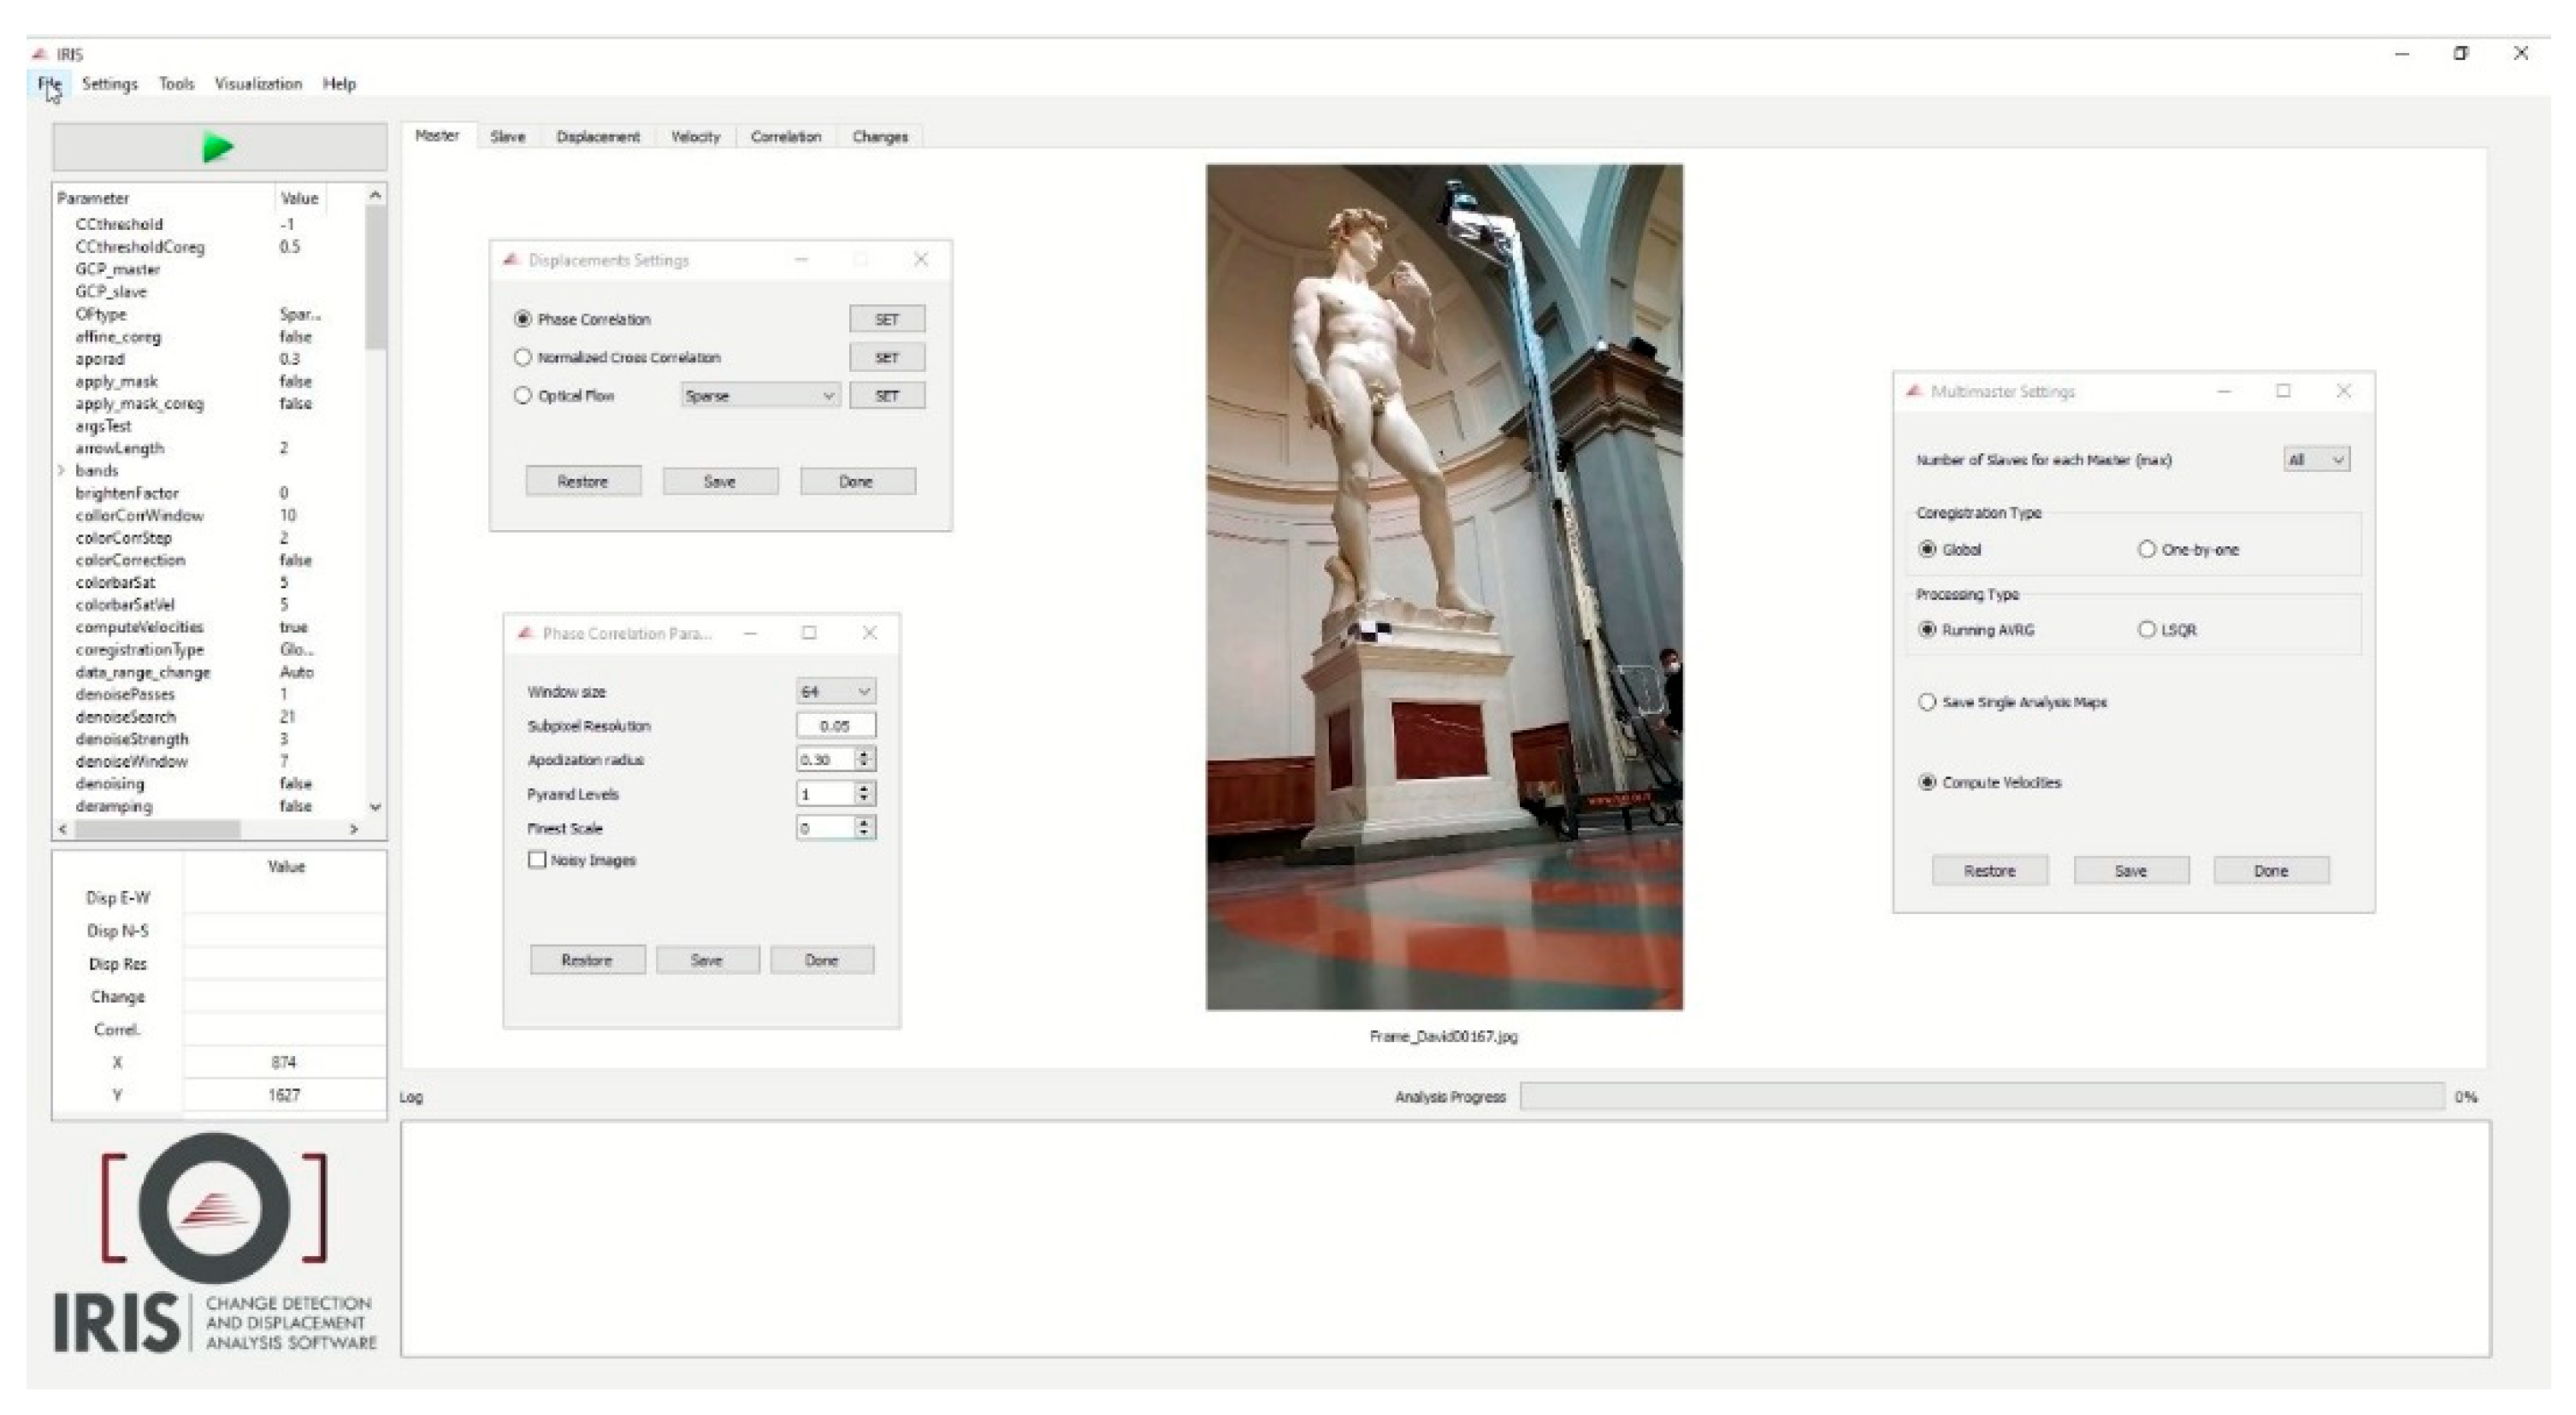
3.2. Photomonitoring
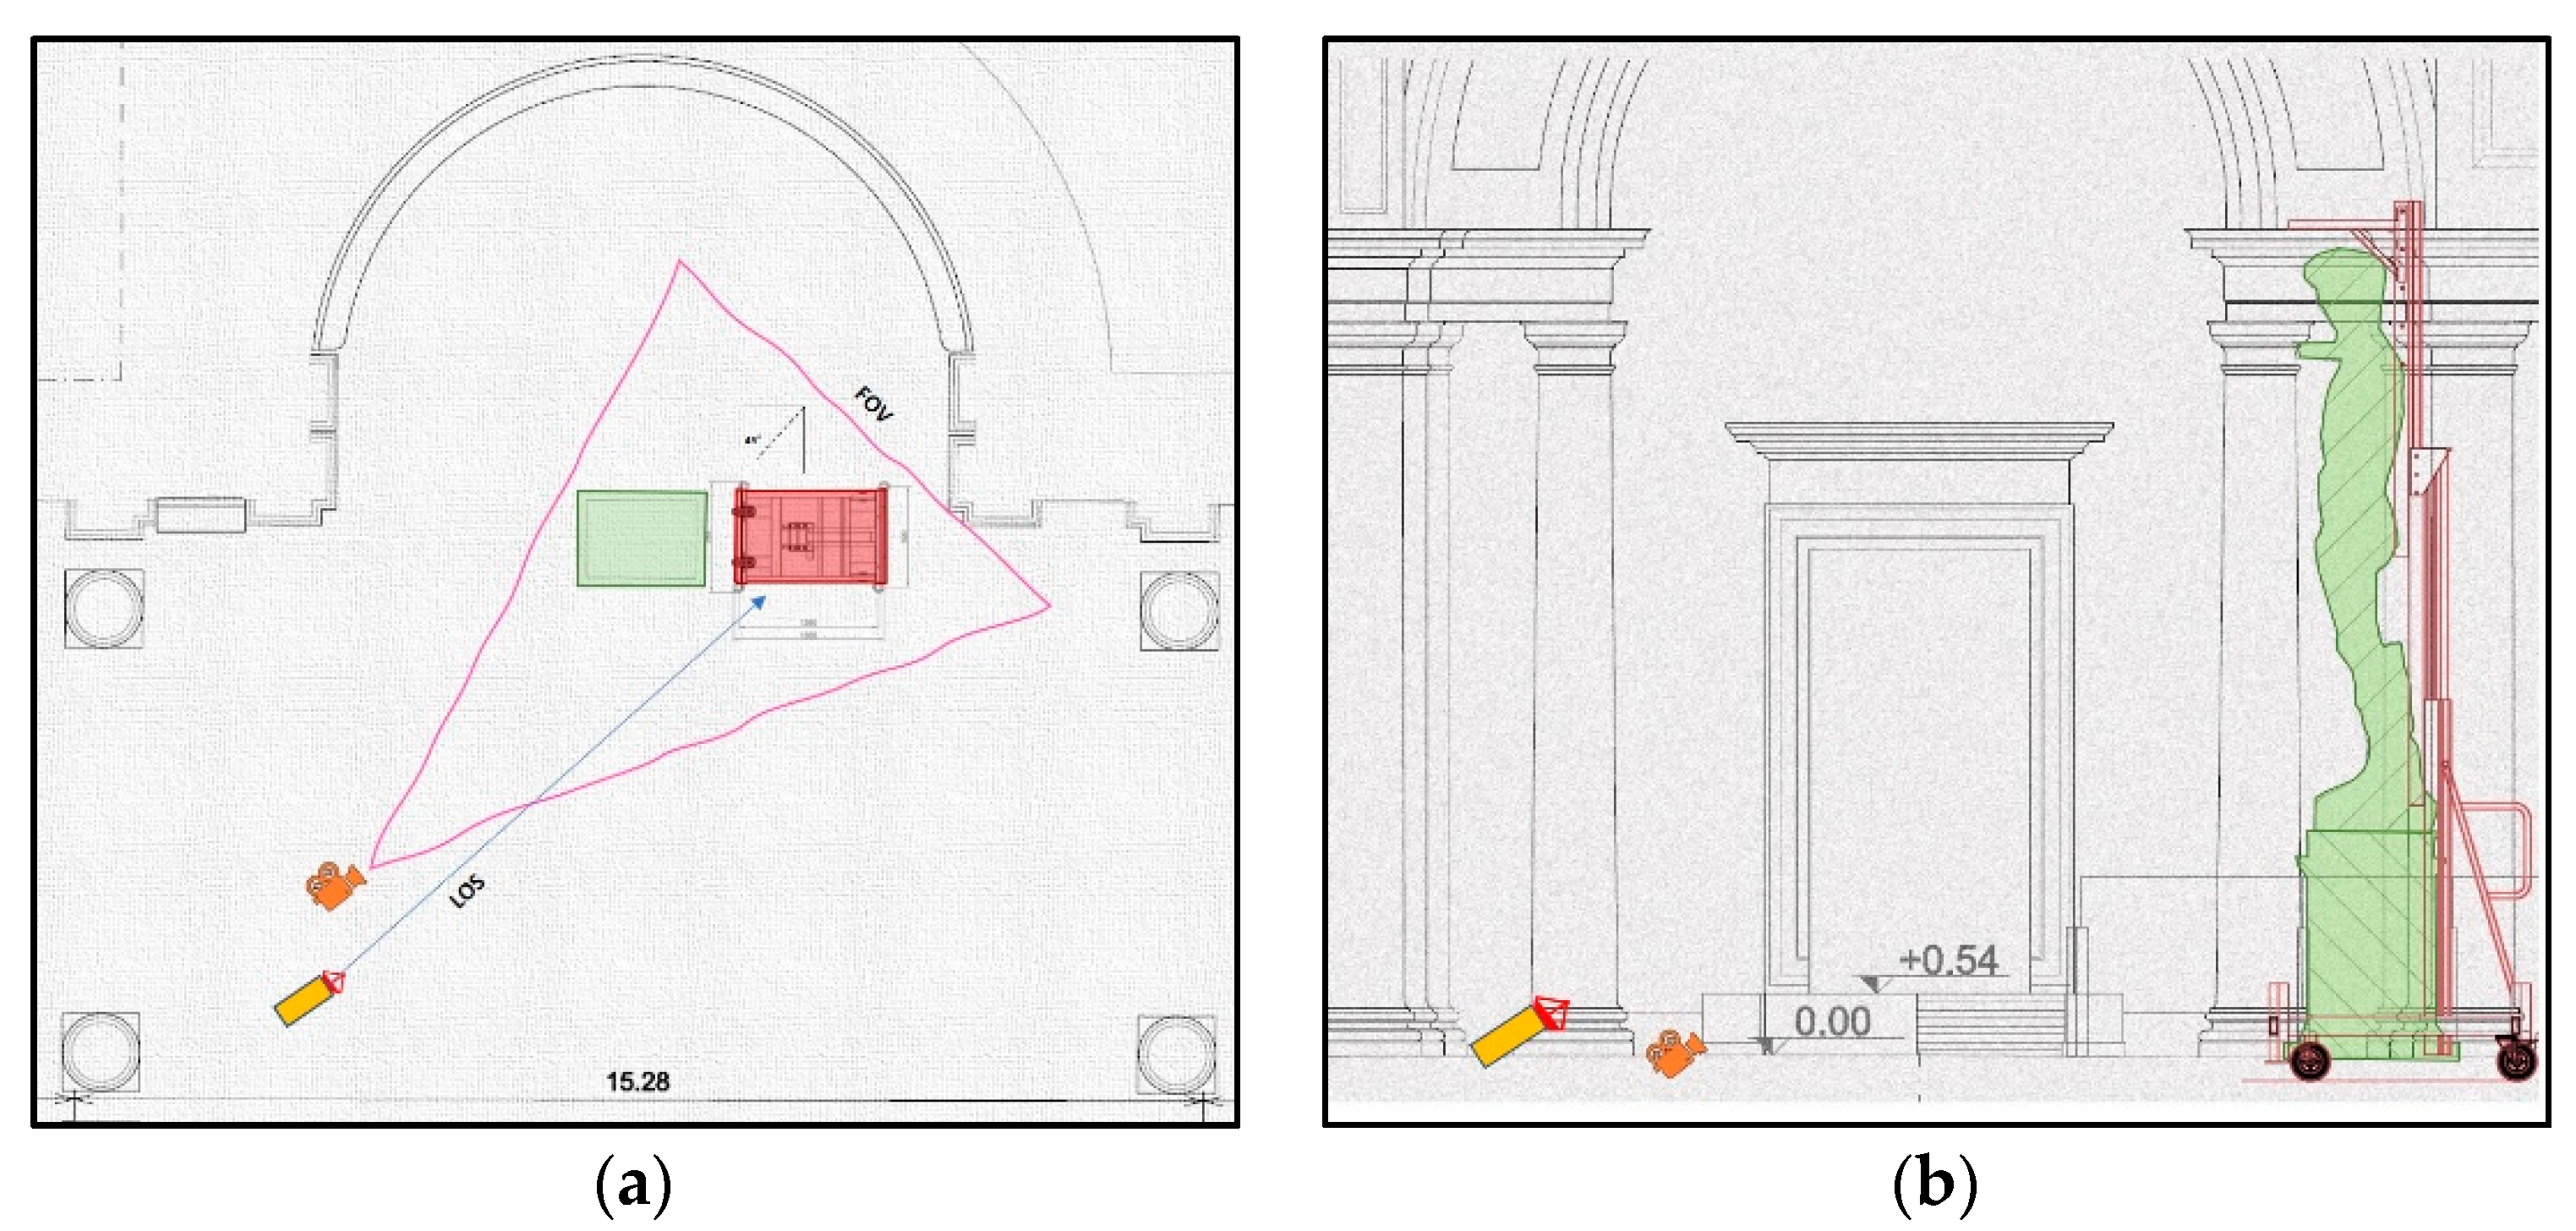
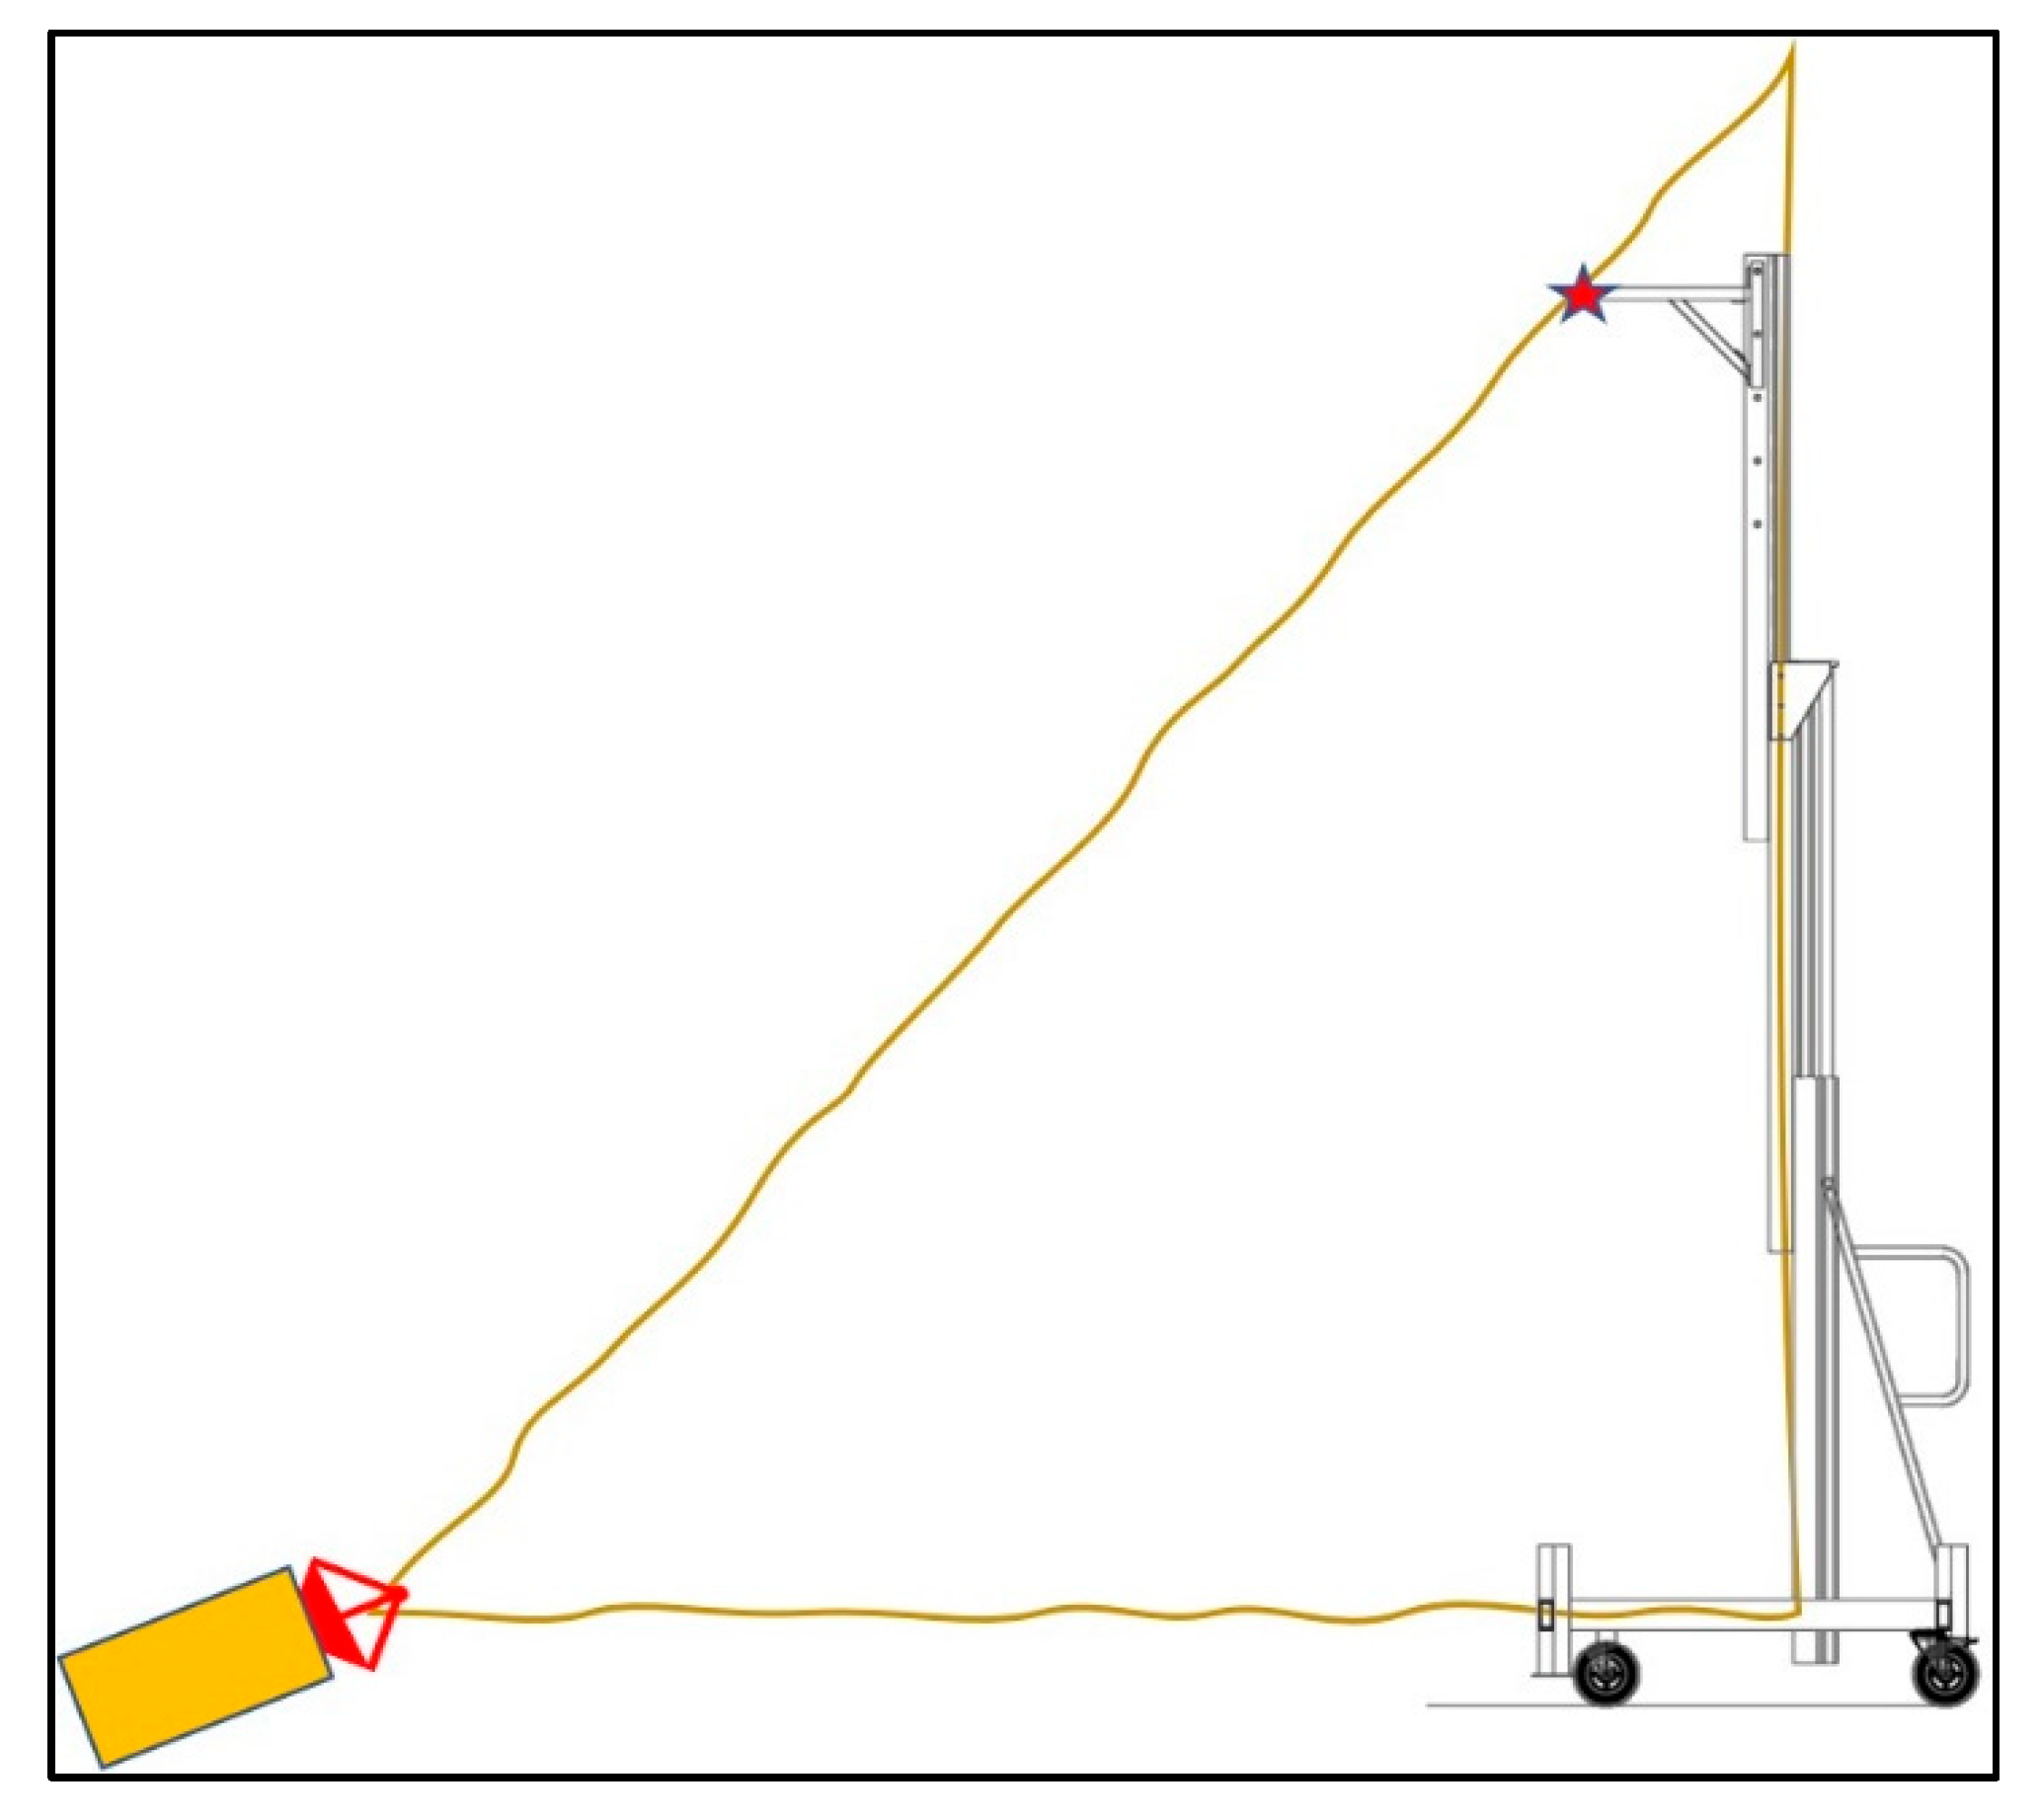
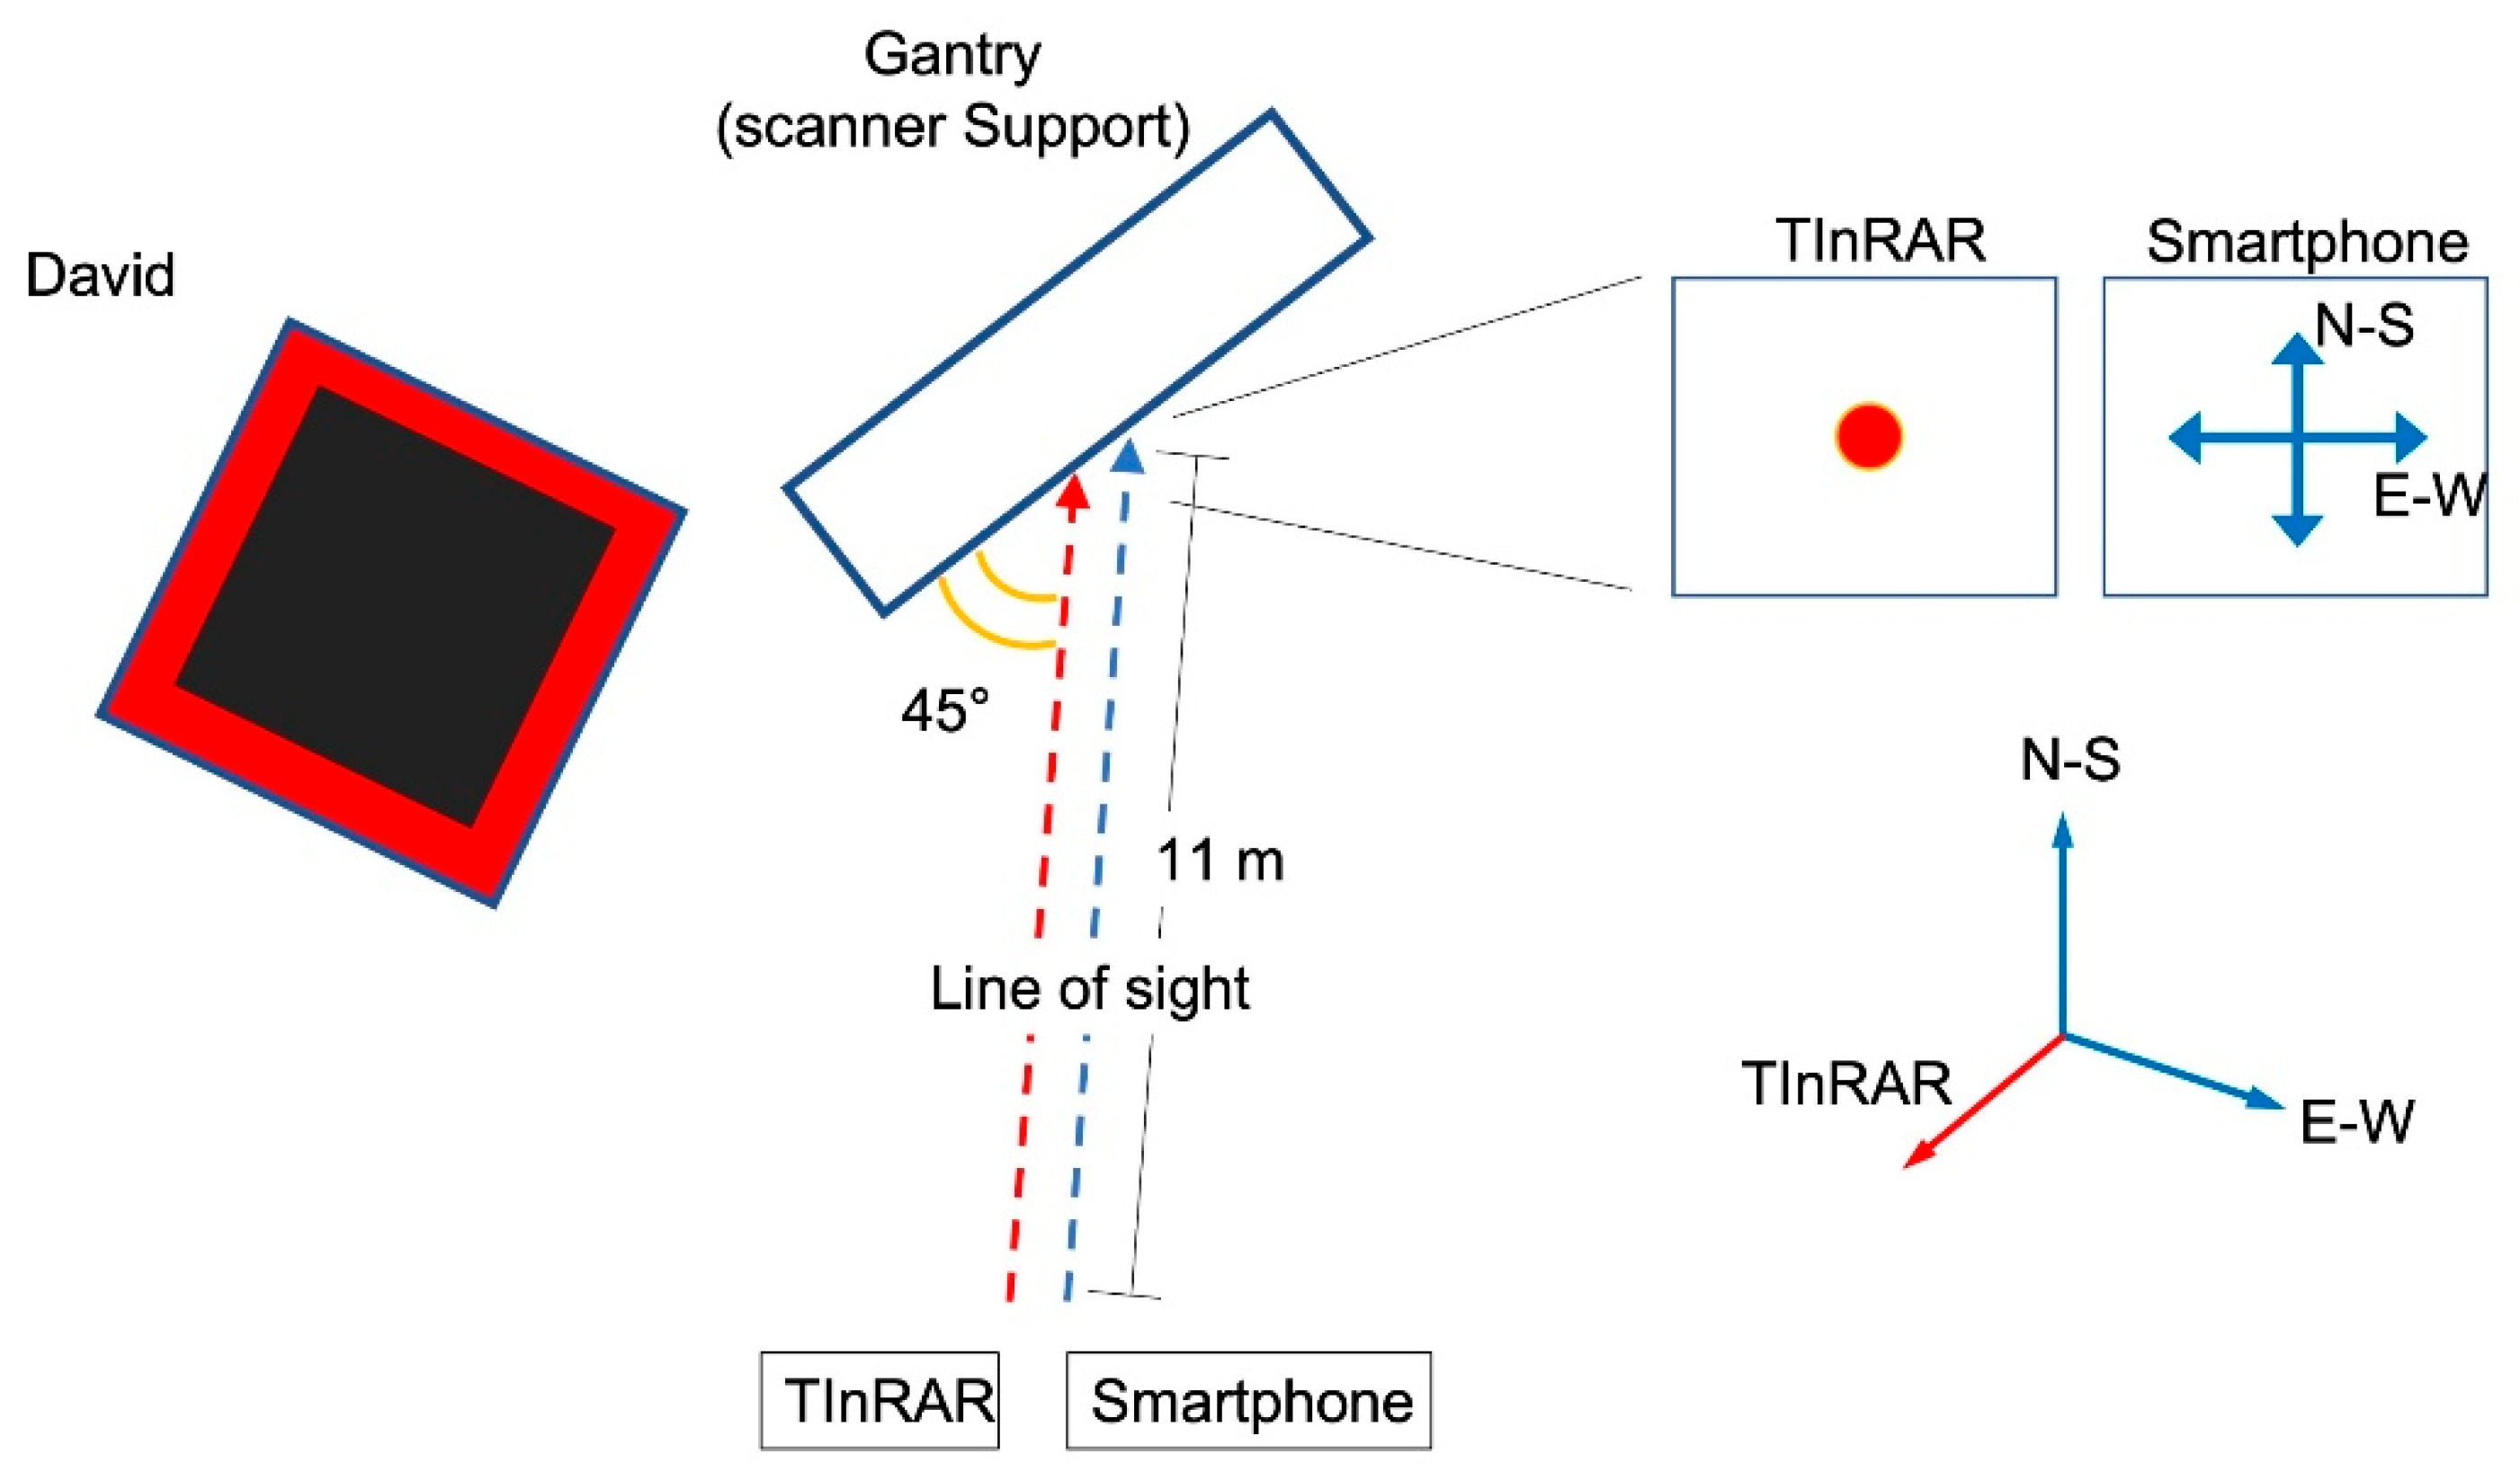
3.3. TInRAR and DIC Surveys
4. Results
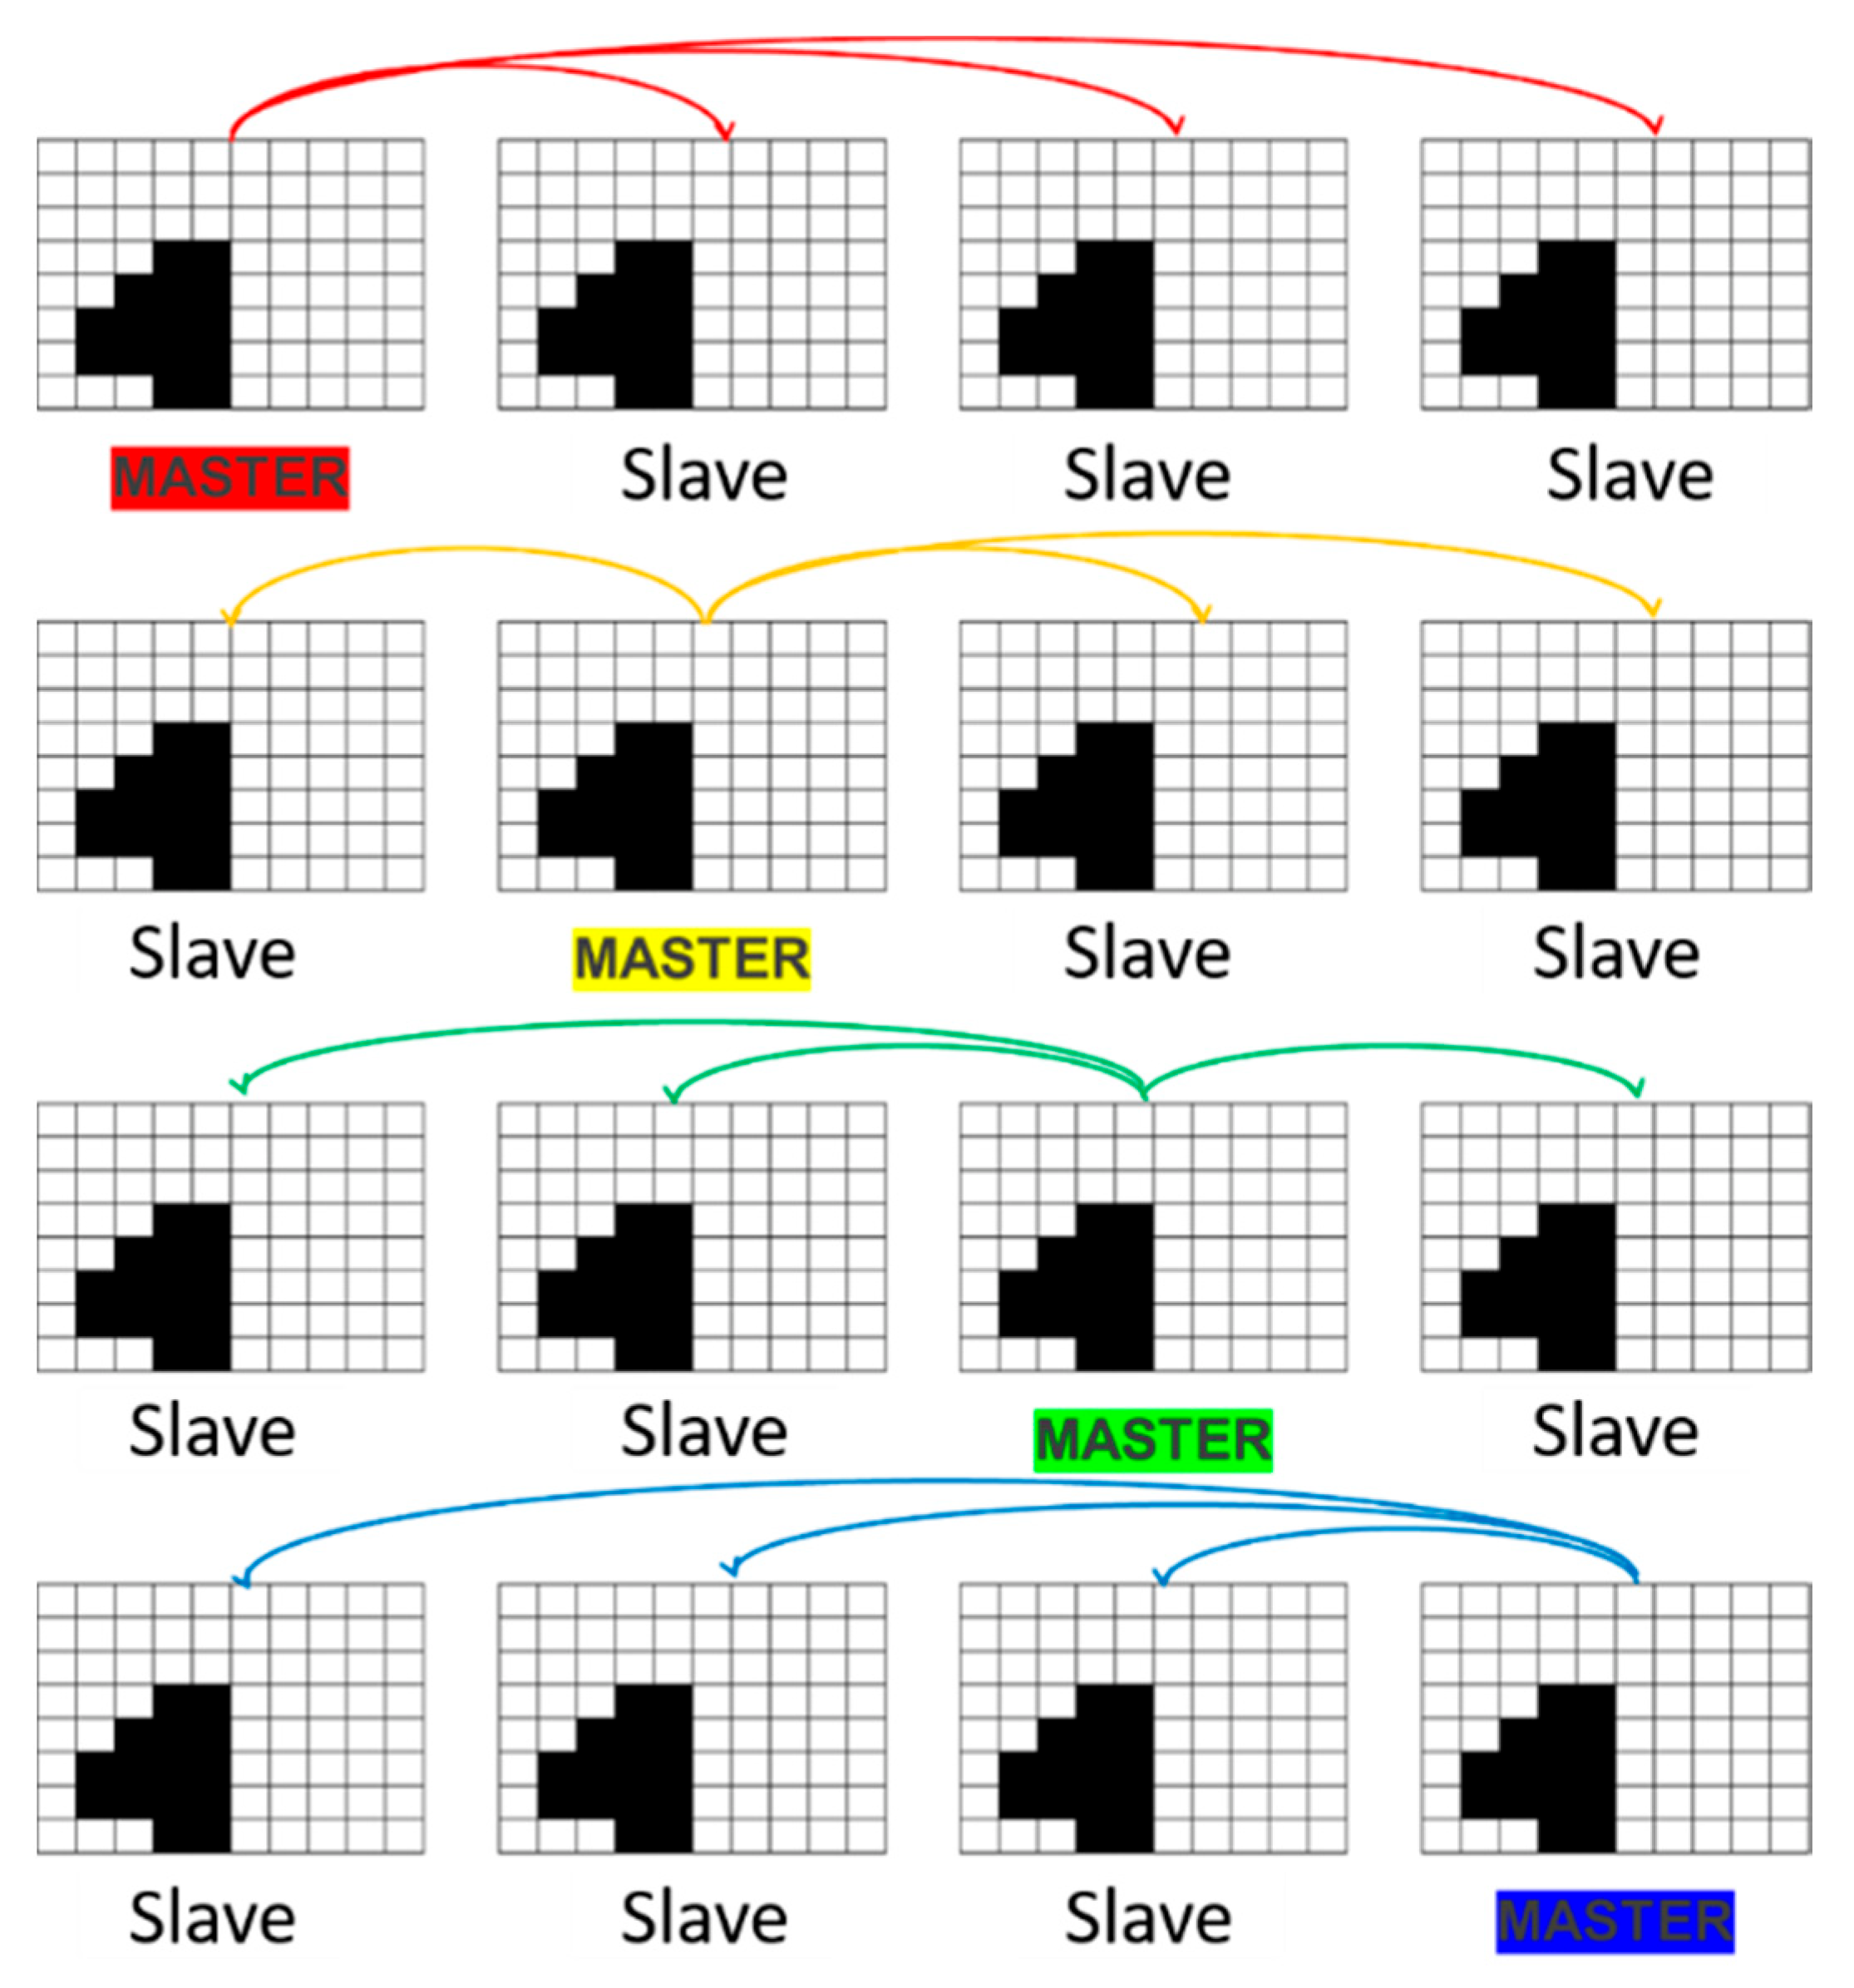
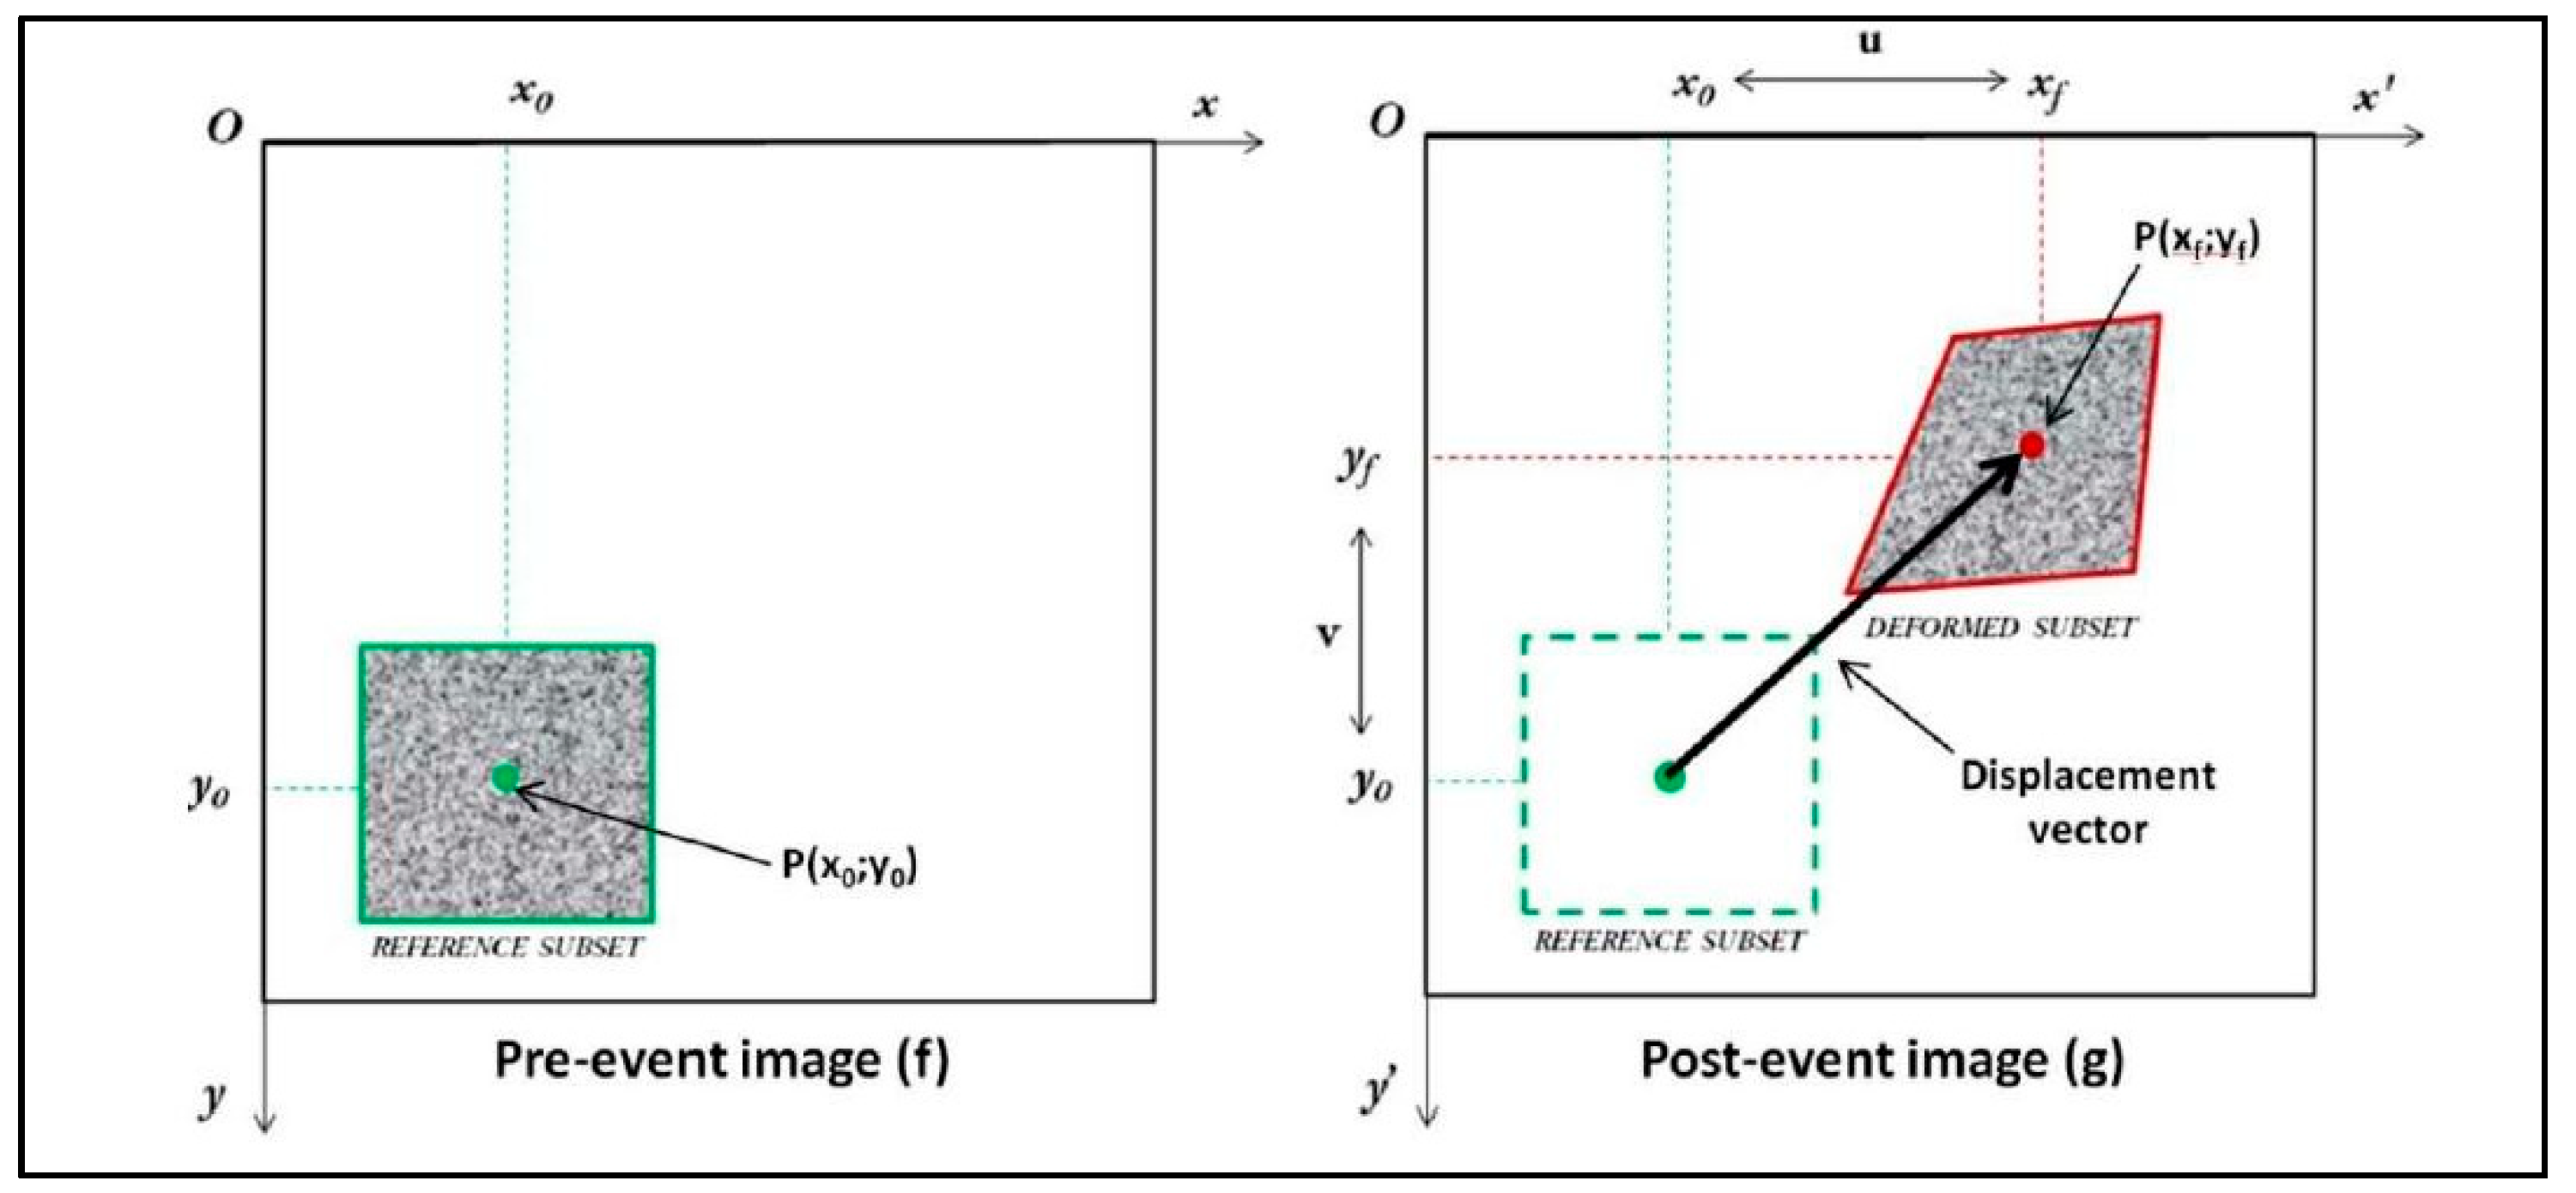
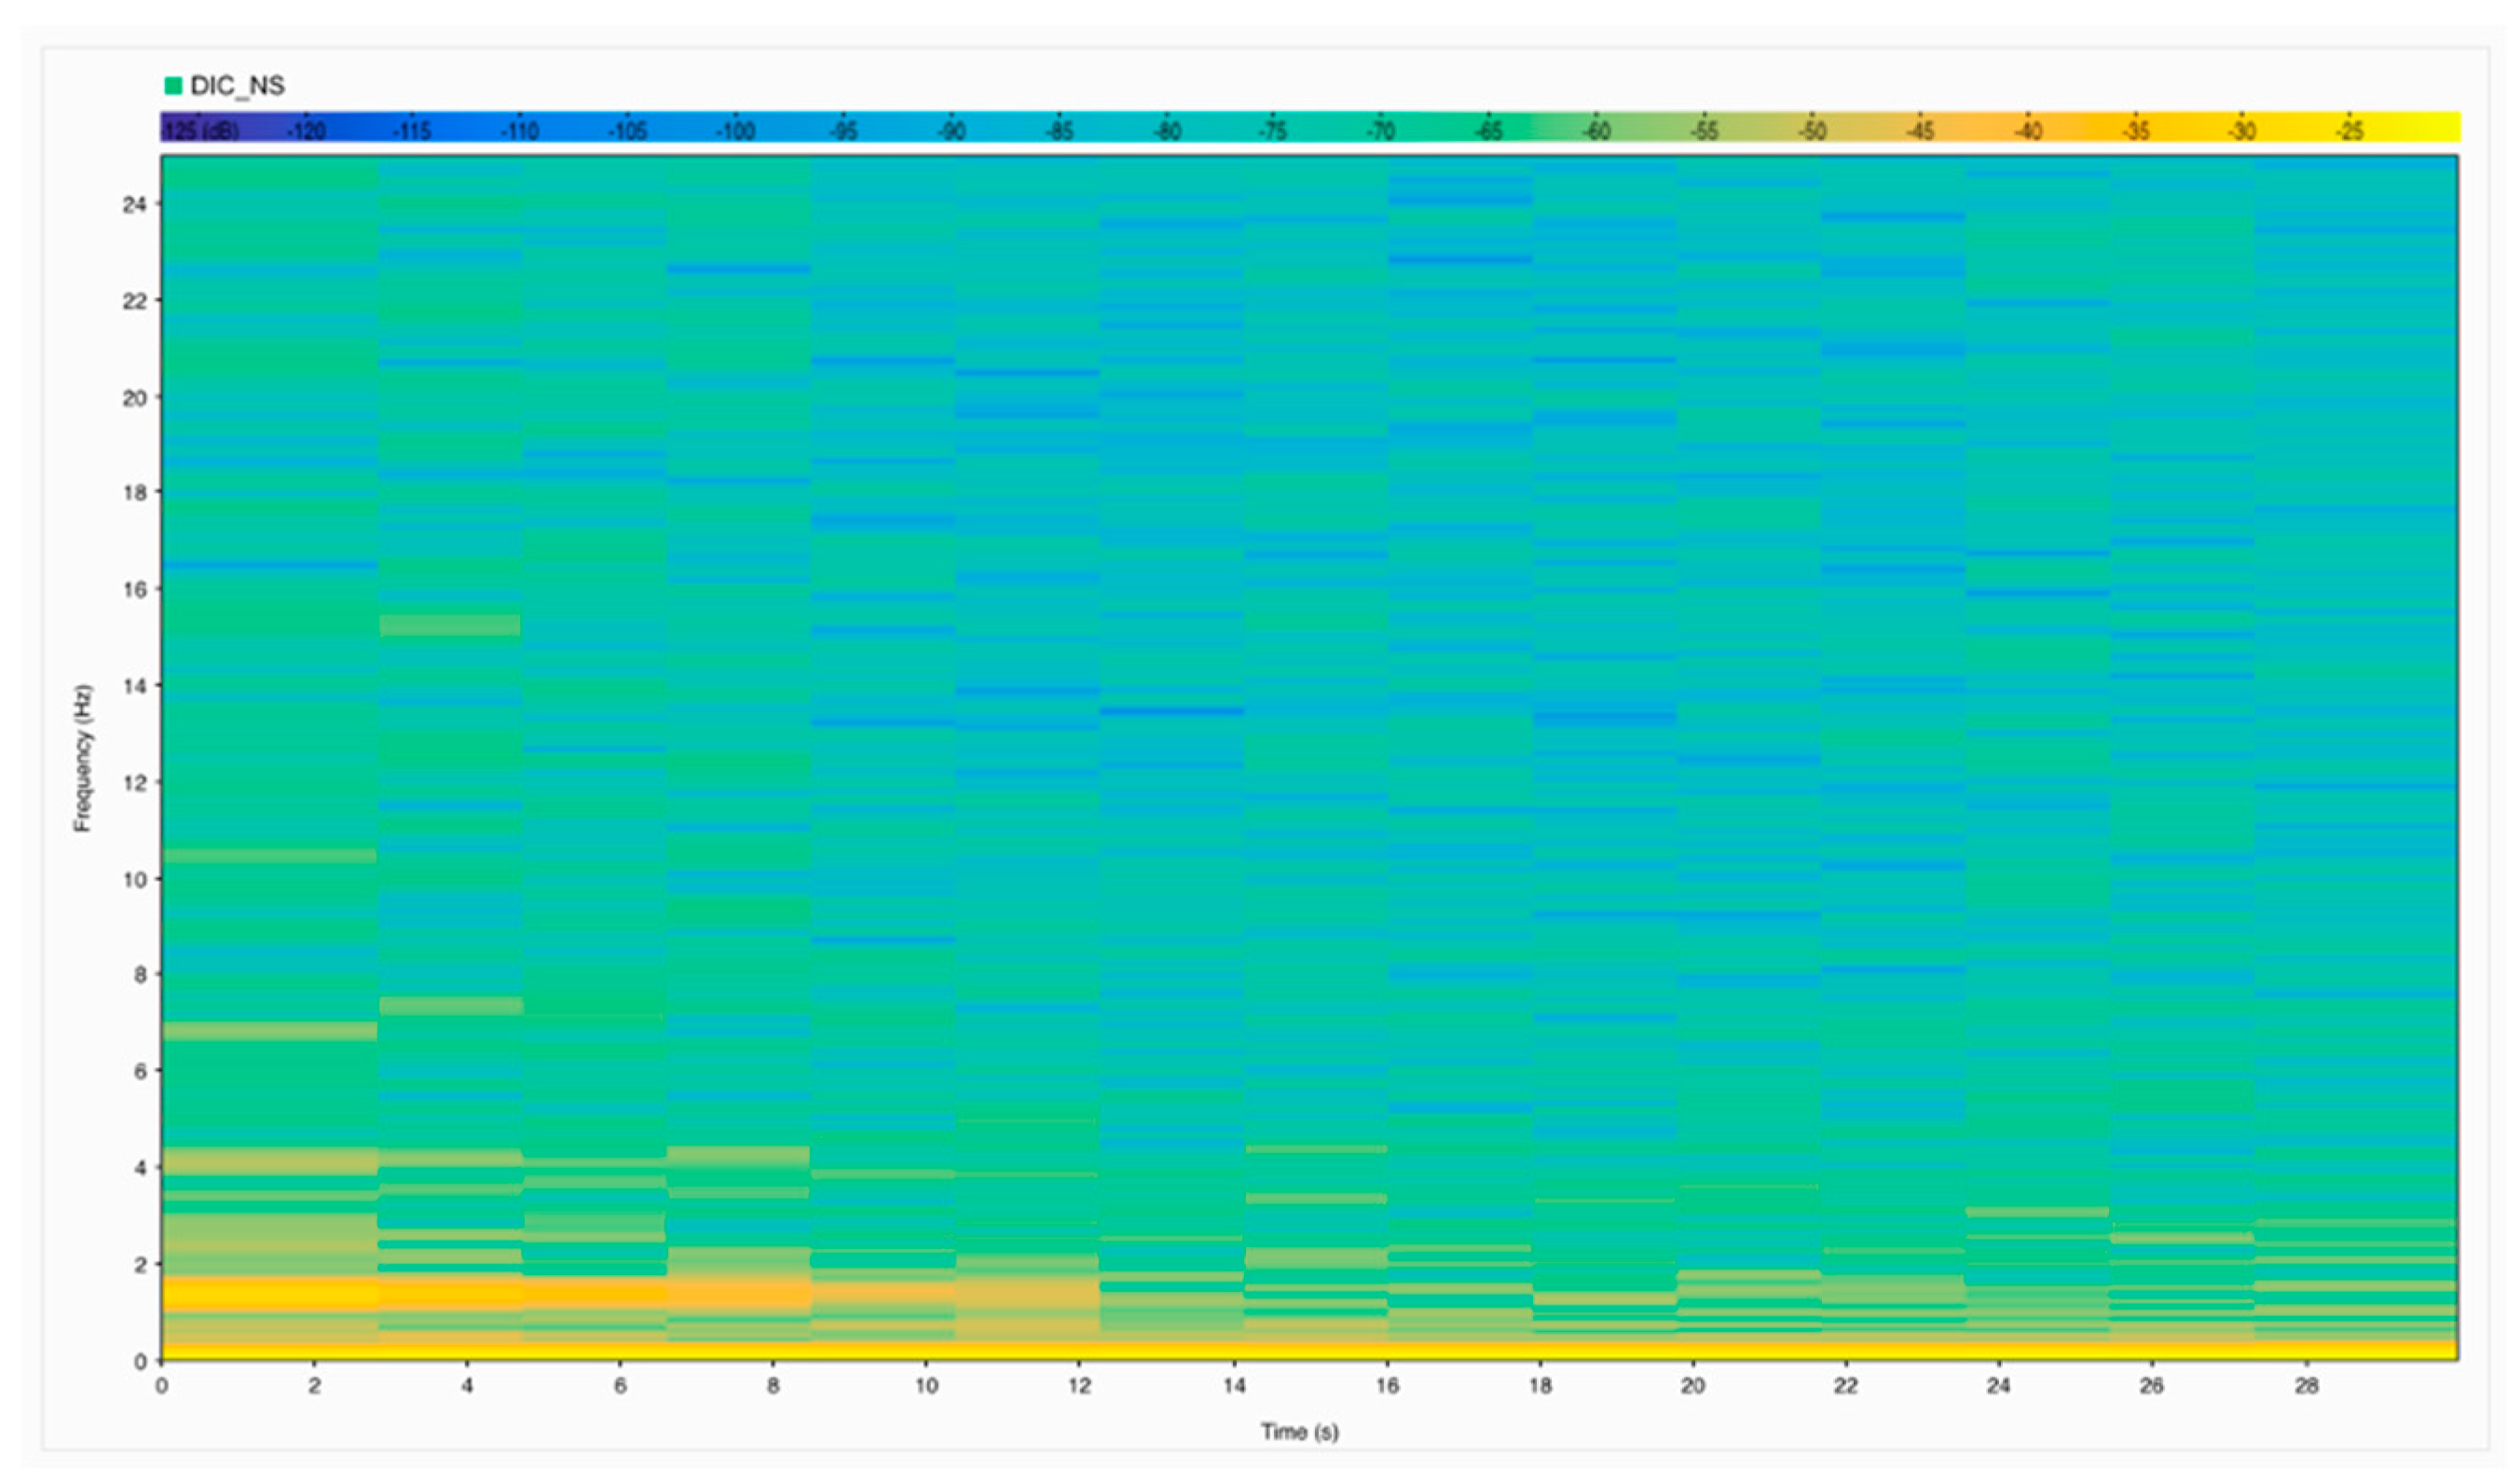
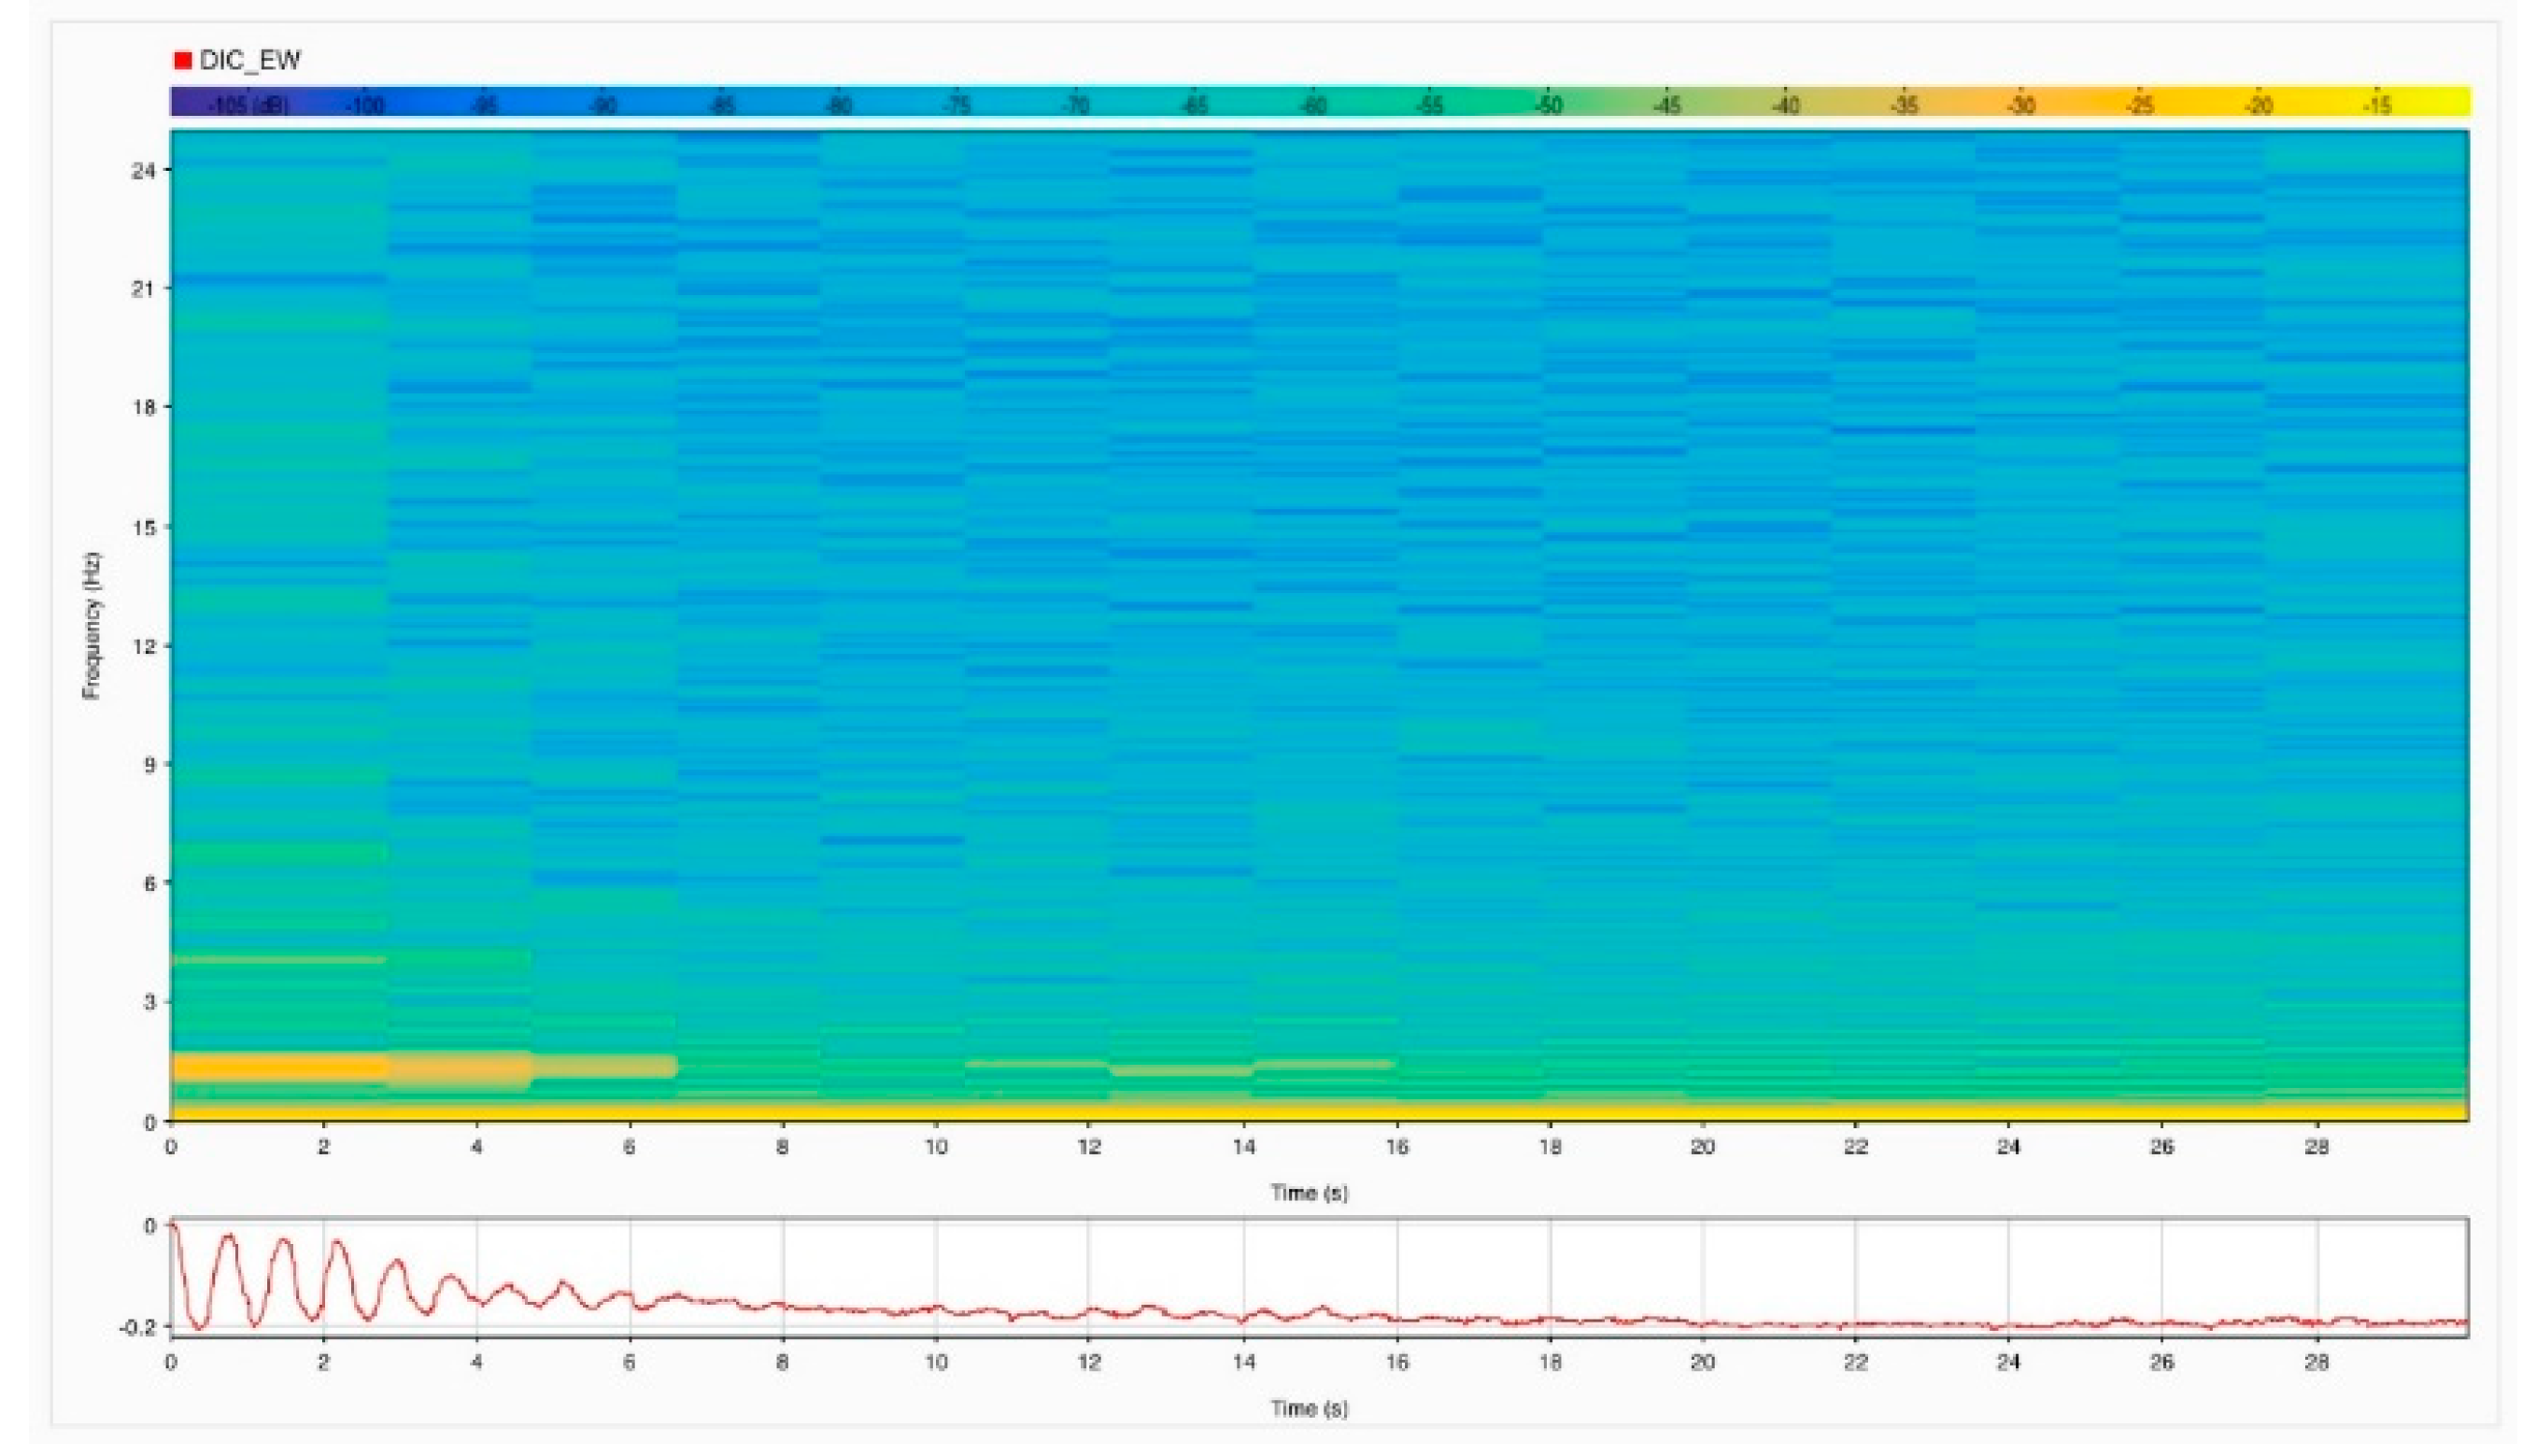
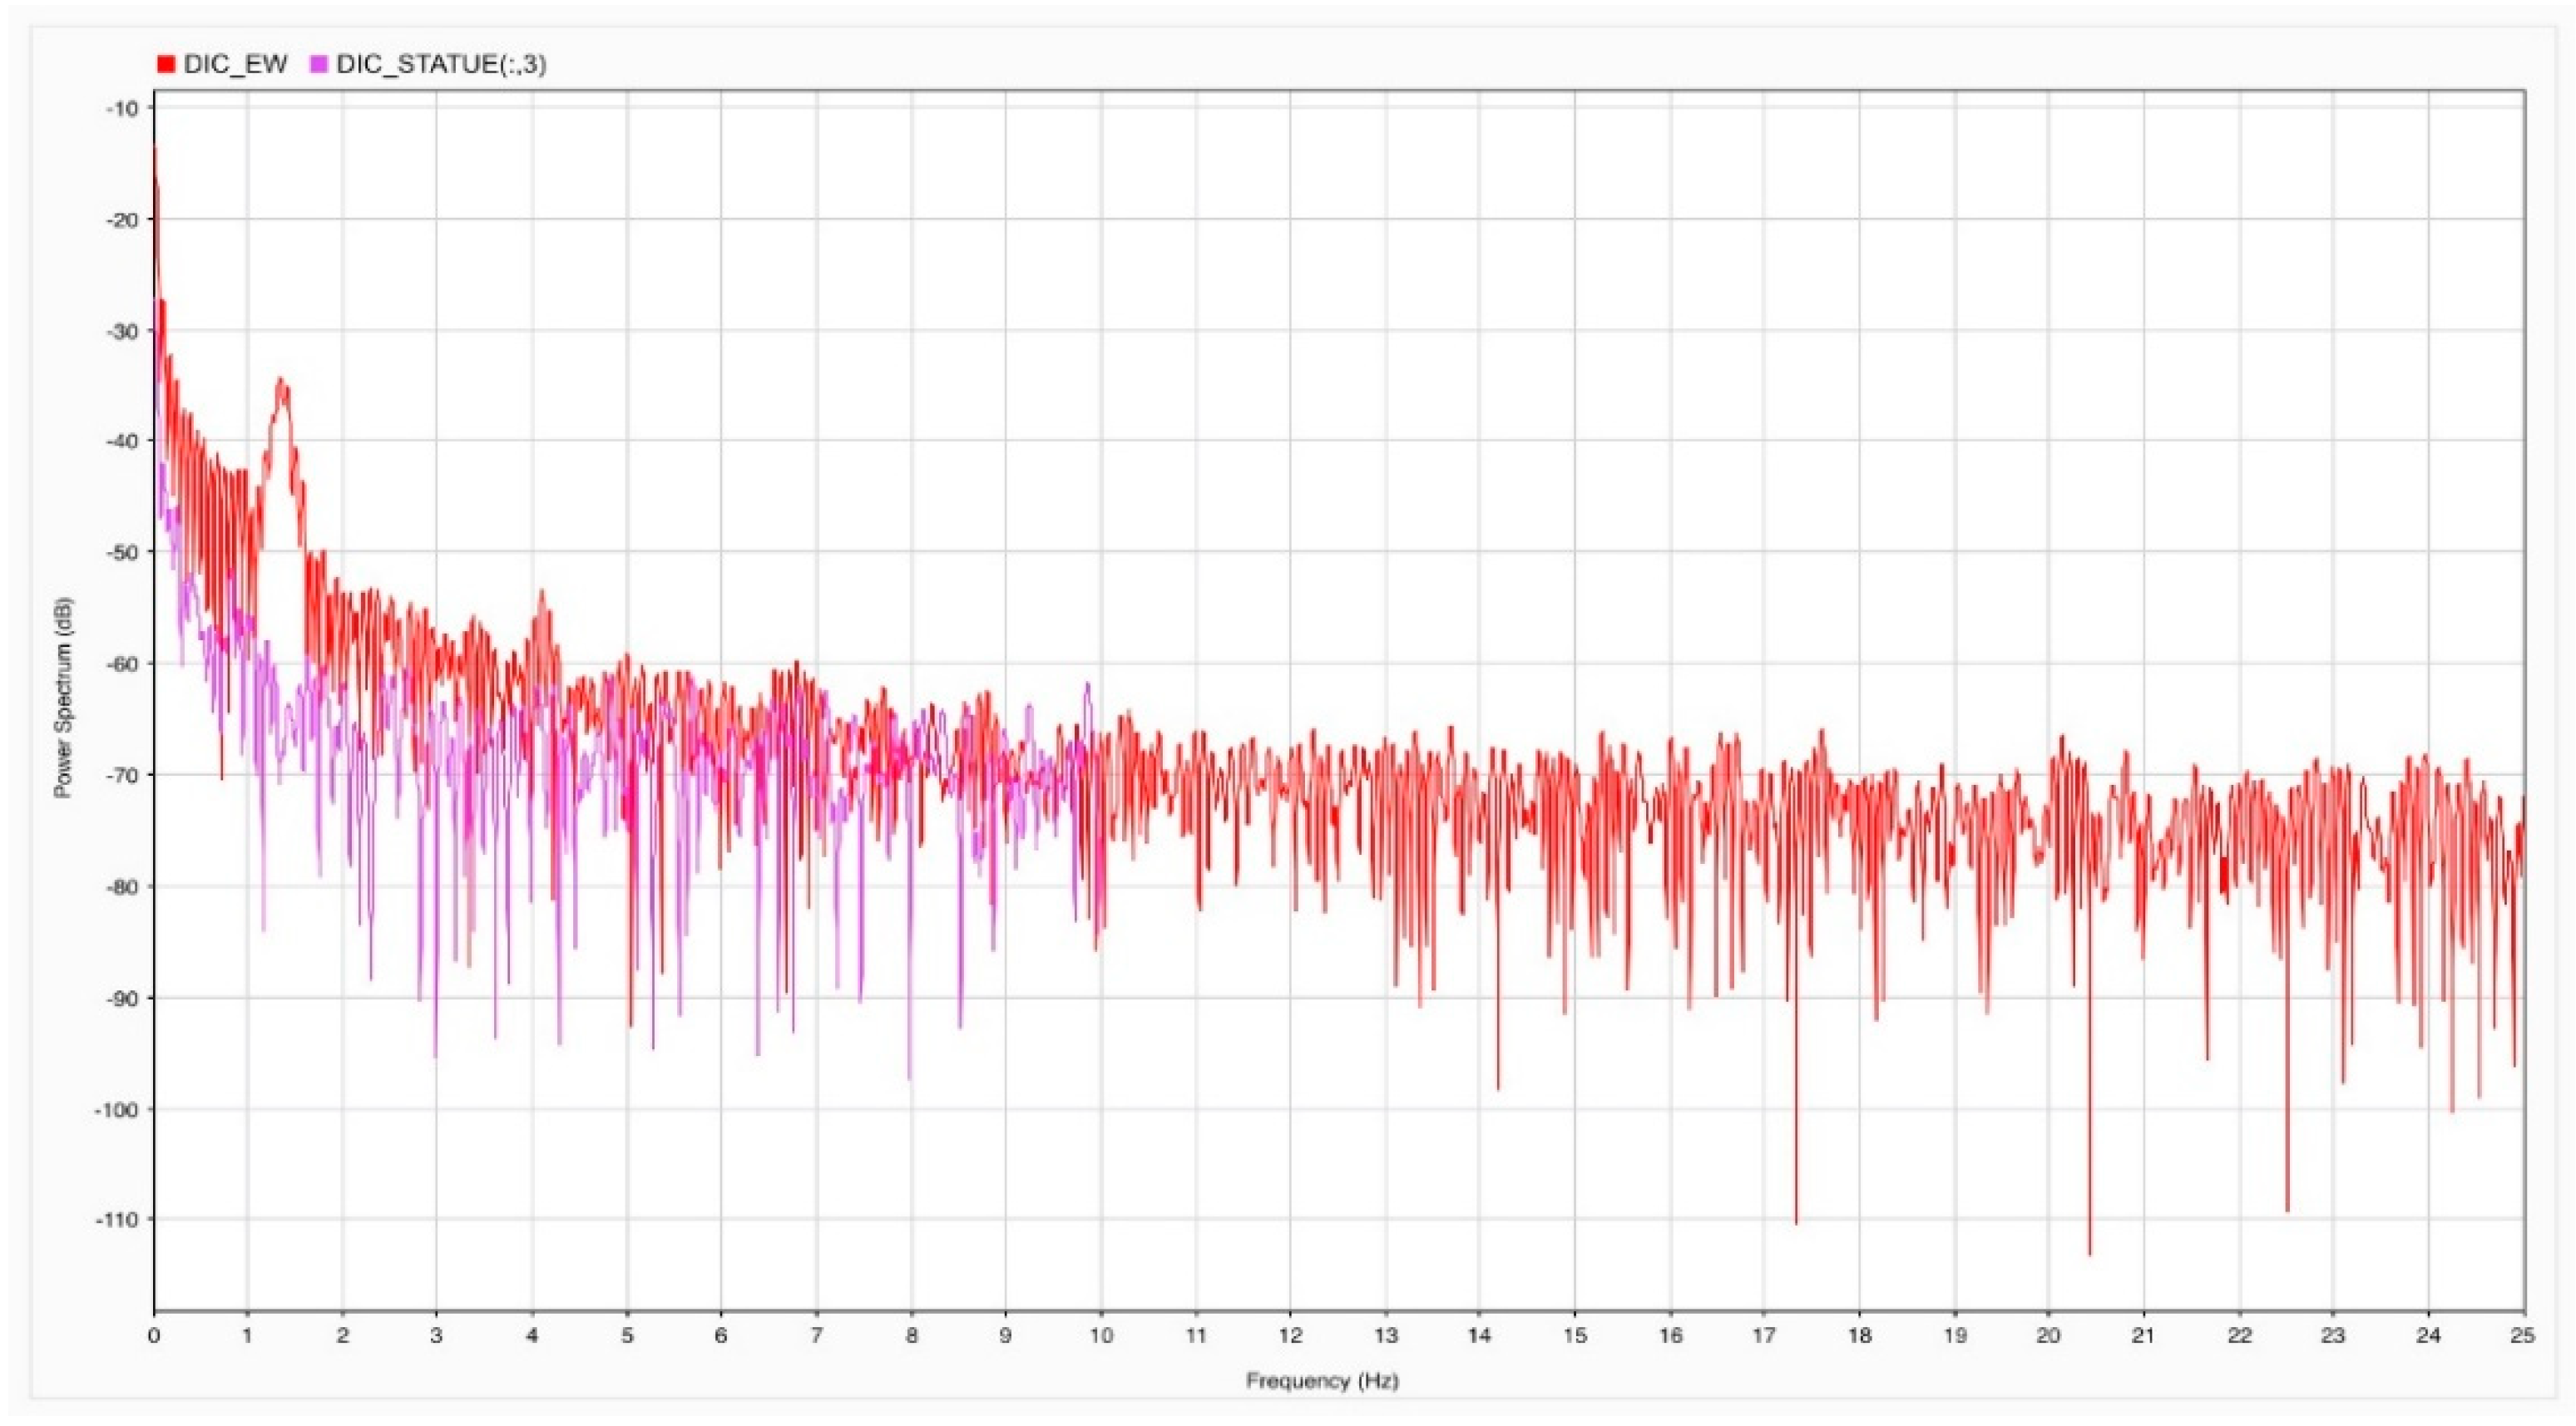
4.1. DIC Analysis
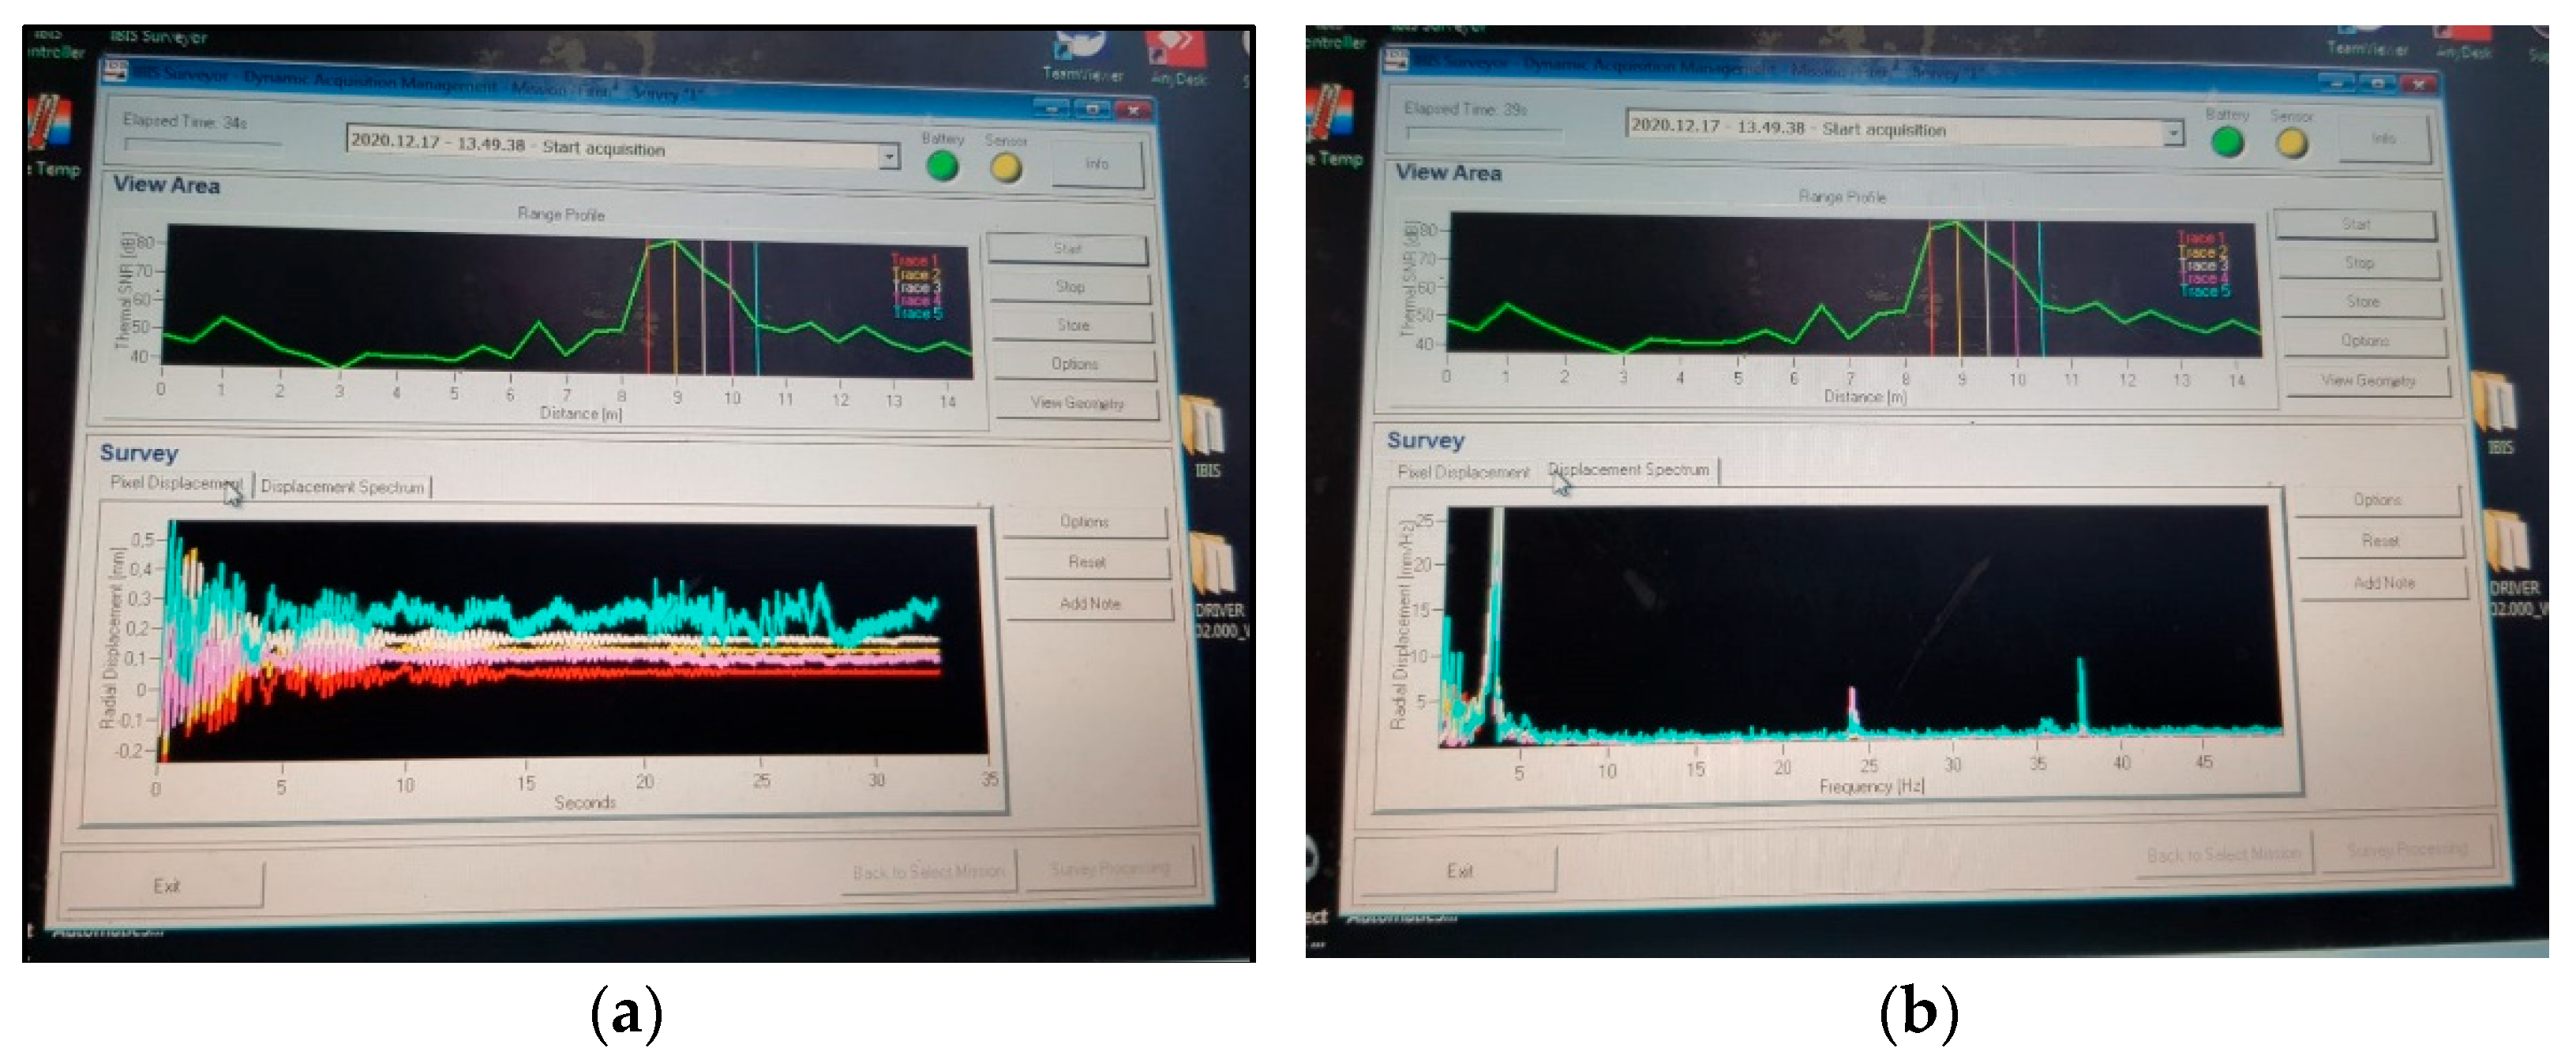
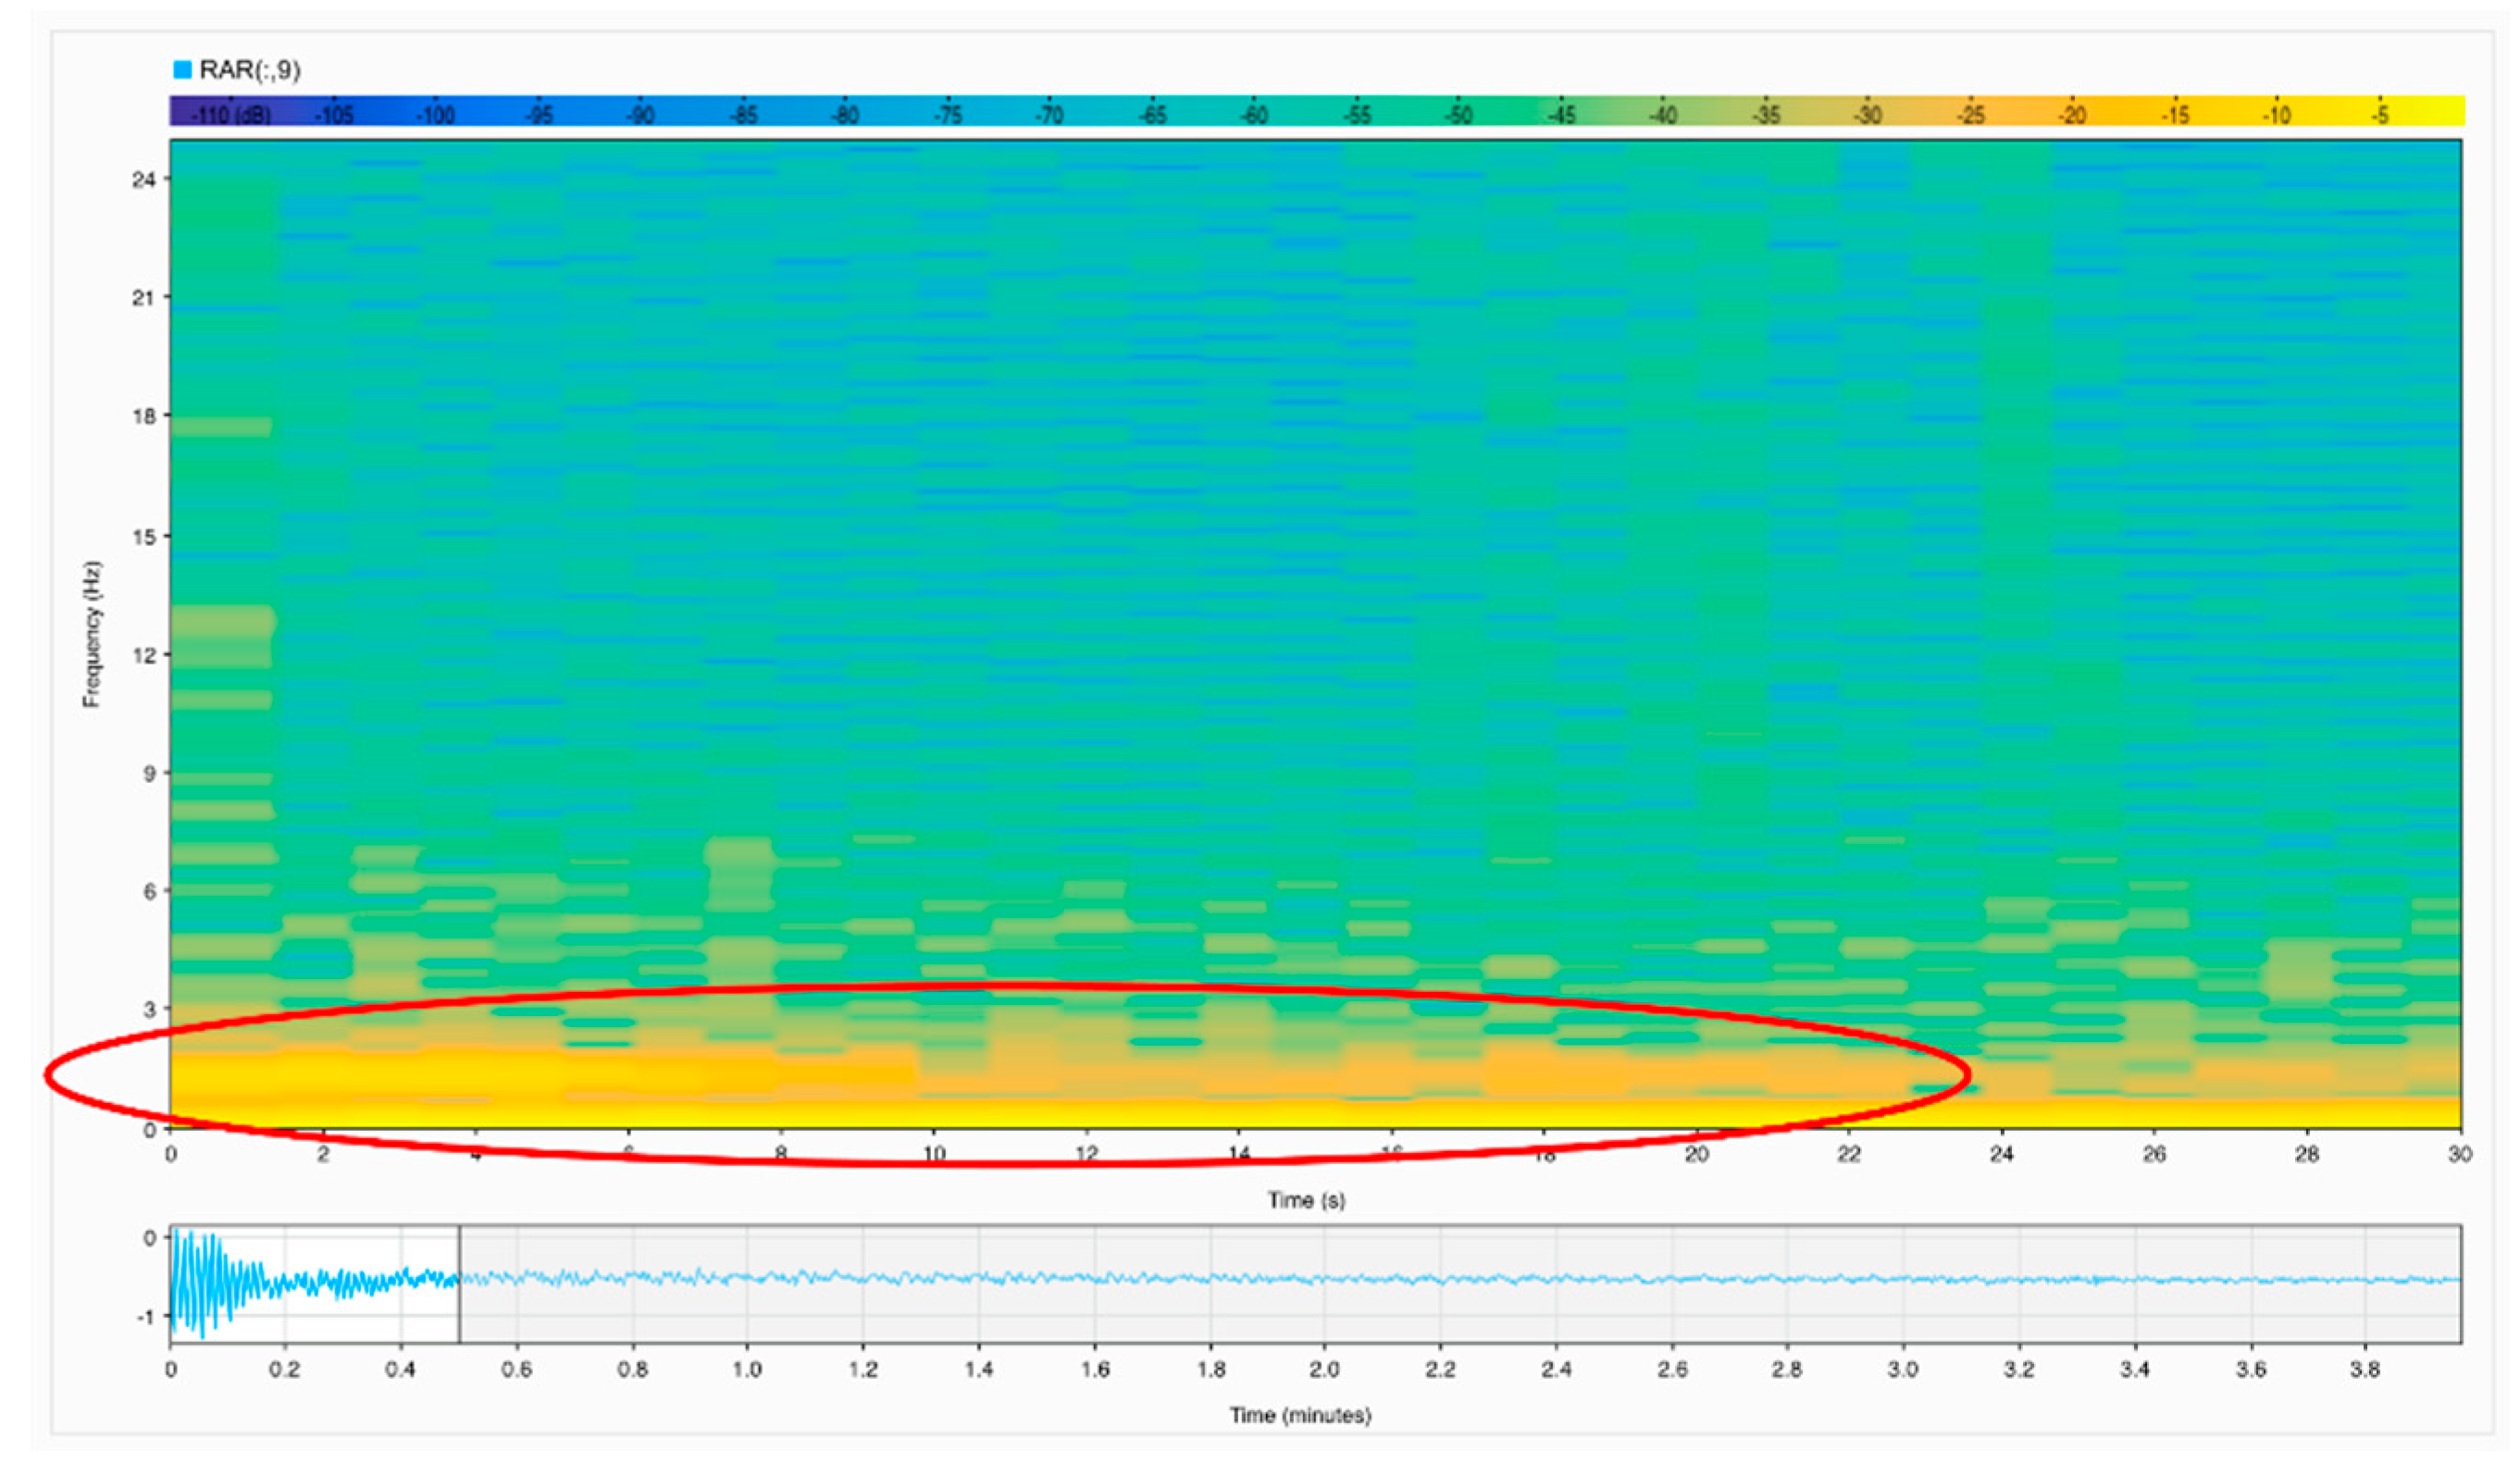
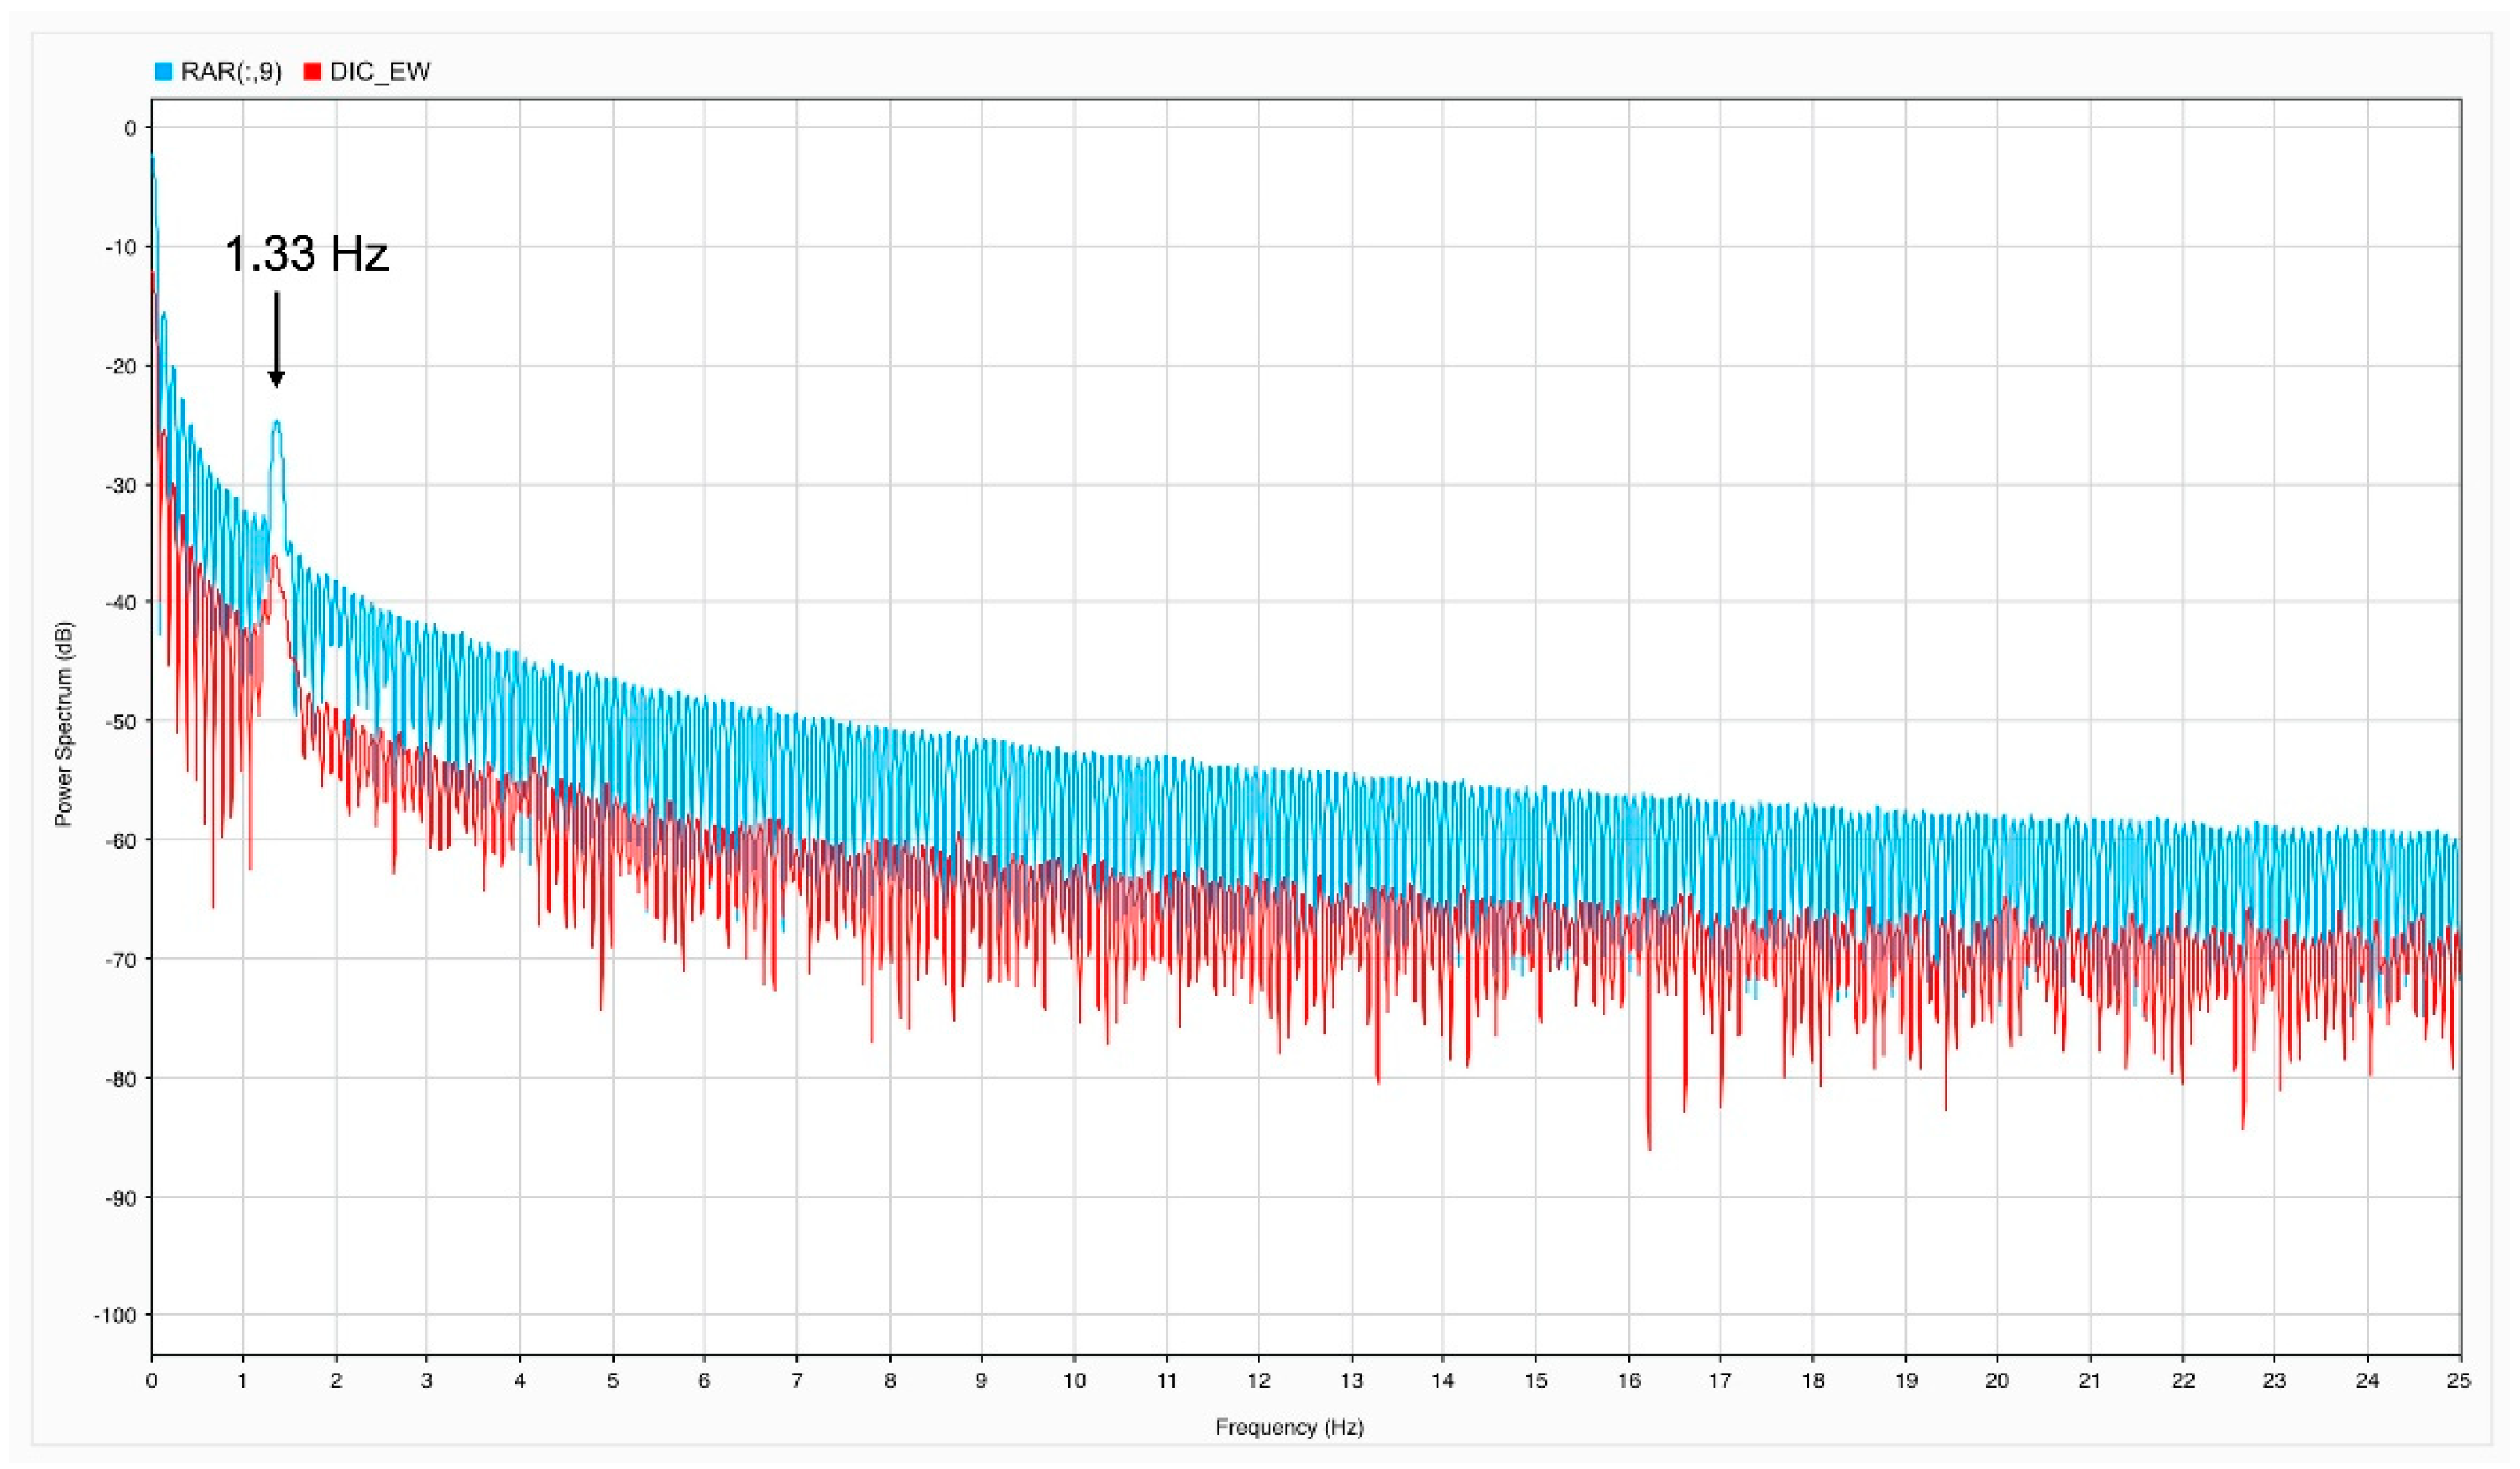
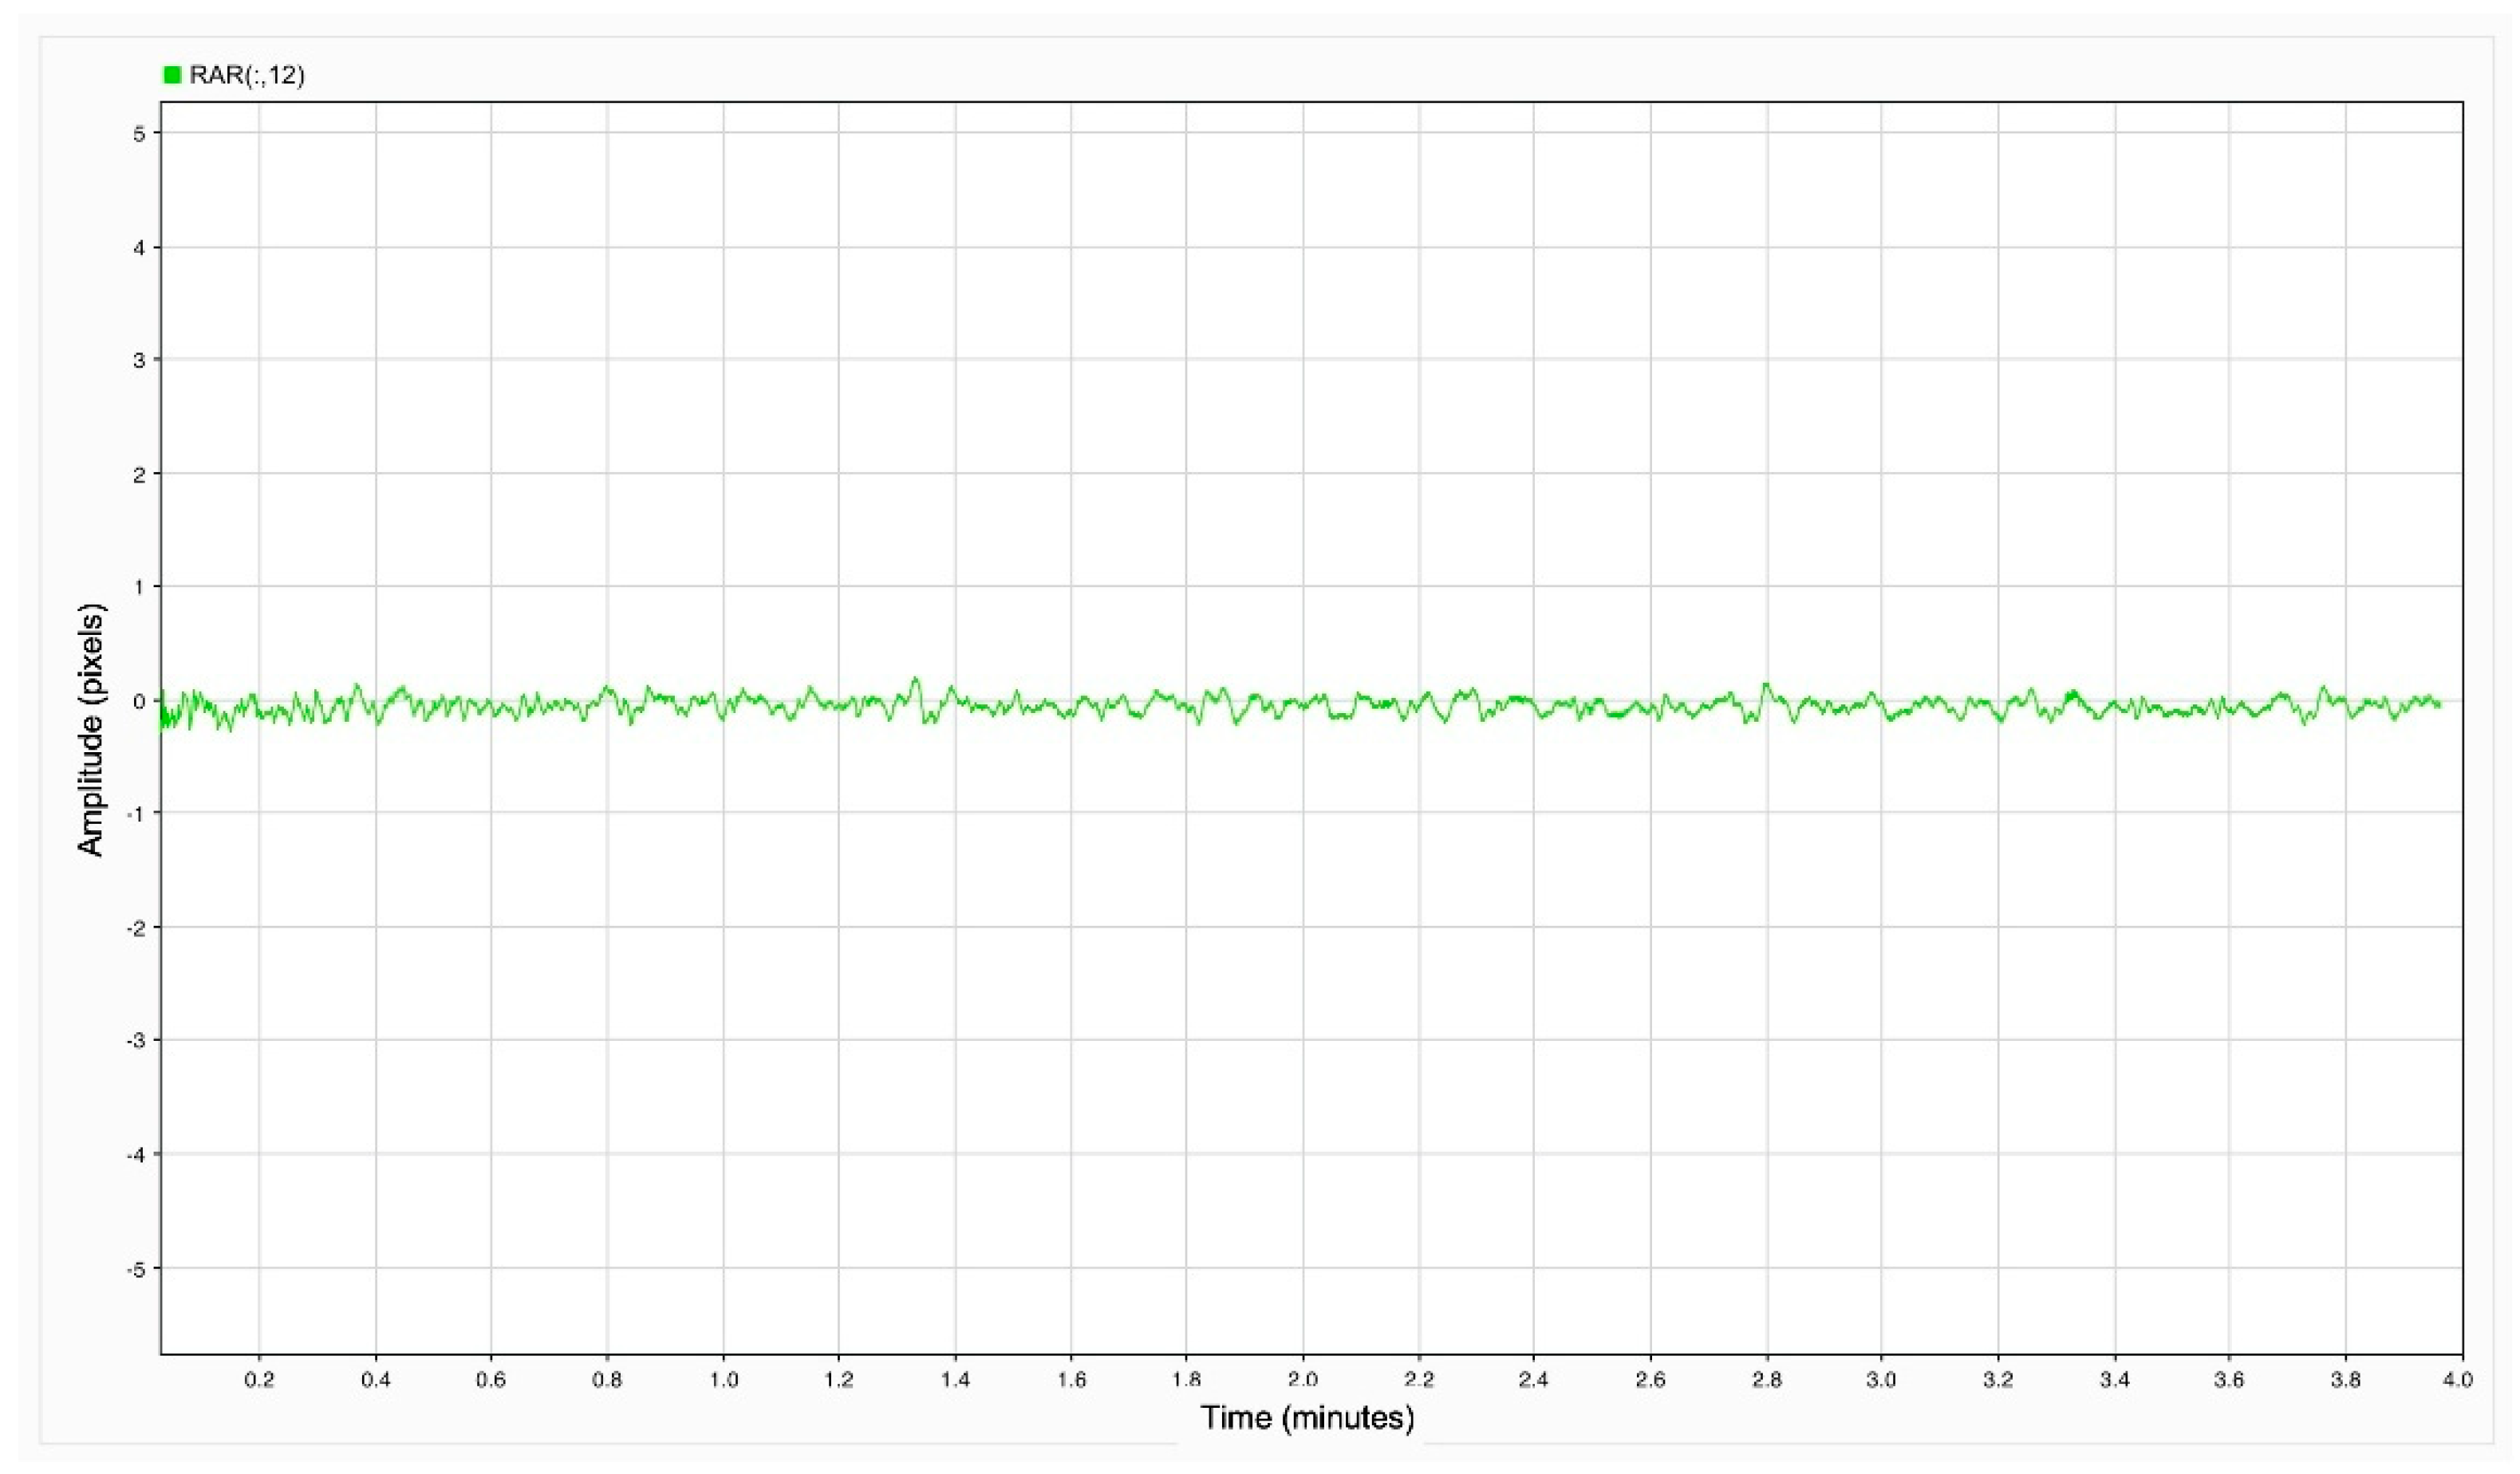
4.2. TInRAR
5. Discussion
6. Conclusions
Author Contributions
Funding
Institutional Review Board Statement
Informed Consent Statement
Data Availability Statement
Acknowledgments
Conflicts of Interest
References
- Ngeljaratan, L.; Moustafa, M.A. Structural health monitoring and seismic response assessment of bridge structures using target-tracking digital image correlation. Eng. Struct. 2020, 213, 110551. [Google Scholar] [CrossRef]
- Brunetti, A.; Mazzanti, P. Il Monitoraggio Dinamico delle Strutture e delle Infrastrutture con Interferometria Radar Terrestre. Available online: https//www.ingenio-web.it/ (accessed on 1 October 2019).
- Bautista-De Castro, A.; Sánchez-Aparicio, L.J.; Ramos, L.F.; Sena-Cruz, J.; González-Aguilera, D. Integrating geomatic approaches, Operational Modal Analysis, advanced numerical and updating methods to evaluate the current safety conditions of the historical Bôco Bridge. Constr. Build. Mater. 2018, 158, 961–984. [Google Scholar] [CrossRef]
- Civera, M.; Fragonara, L.Z.; Surace, C. Video processing techniques for the contactless investigation of large oscillations. J. Phys. Conf. Ser. 2019, 1249, 12004. [Google Scholar] [CrossRef]
- Beninati, L.; Brunetti, A.; Caruso, C.; Mazzanti, P. Structural Health Characterization of an Old Riveted Iron Bridge by Remote Sensing Techniques. In Proceedings of the 7th International Conference on Structural Health Monitoring of Intelligent Infrastructure, Torino, Italy, 1–3 July 2015; pp. 1–3. [Google Scholar]
- Mugnai, F. Laser Scanning and Point Cloud Segmentation for Contactless Geo-Mechanical Surveying: Conservative Restoration in Hypogeum Environment. ISPRS Int. Arch. Photogramm. Remote Sens. Spat. Inf. Sci. 2021, 46, 455–461. [Google Scholar] [CrossRef]
- Mugnai, F.; Lombardi, L.; Tucci, G.; Nocentini, M.; Gigli, G.; Fanti, R. Geomatics in bridge structural health monitoring, integrating terrestrial laser scanning techniques and geotechnical inspections on a high value cultural heritage. In Proceedings of the International Archives of the Photogrammetry, Remote Sensing and Spatial Information Sciences, Milan, Italy, 8–10 May 2019; Volume 42. [Google Scholar]
- Balageas, D.; Fritzen, C.-P.; Güemes, A. Structural Health Monitoring; John Wiley & Sons: Hoboken, NJ, USA, 2010; Volume 90. [Google Scholar]
- Castagnetti, C.; Bertacchini, E.; Capra, A.; Dubbini, M. Terrestrial laser scanning for preserving cultural heritage: Analysis of geometric anomalies for ancient structures. In Proceedings of the FIG Working Week 2012—Territory, Environment, and Cultural Heritage, Rome, Italy, 6–10 May 2012; pp. 1–13. [Google Scholar]
- Achille, C.; Adami, A.; Chiarini, S.; Cremonesi, S.; Fassi, F.; Fregonese, L.; Taffurelli, L. UAV-based photogrammetry and integrated technologies for architectural applications—Methodological strategies for the after-quake survey of vertical structures in Mantua (Italy). Sensors 2015, 15, 15520–15539. [Google Scholar] [CrossRef] [PubMed] [Green Version]
- Fregonese, L.; Barbieri, G.; Biolzi, L.; Bocciarelli, M.; Frigeri, A.; Taffurelli, L. Surveying and monitoring for vulnerability assessment of an ancient building. Sensors 2013, 13, 9747–9773. [Google Scholar] [CrossRef]
- Mazzanti, P.; Bozzano, F.; Brunetti, A.; Esposito, C.; Martino, S.; Prestininzi, A.; Rocca, A.; Mugnozza, G.S. Terrestrial SAR interferometry monitoring of natural slopes and man-made structures. In Engineering Geology for Society and Territory; Springer: Berlin/Heidelberg, Germany, 2015; Volume 5, pp. 189–194. [Google Scholar]
- Bernardini, G.; De Pasquale, G.; Gallino, N.; Gentile, C. Microwave interferometer for ambient vibration measurements on civil engineering structures: 2. Application to full-scale Bridges. In Proceedings of the Experimental Vibration Analysis for Civil Engineering Structures (EVACES’07), Porto, Portugal, 24–26 October 2007; pp. 153–162. [Google Scholar]
- Hanssen, R.F. Radar Interferometry: Data Interpretation and Error Analysis; Springer Science & Business Media: New York, NY, USA, 2001; Volume 2. [Google Scholar]
- Qing, X.P.; Beard, S.J.; Kumar, A.; Ooi, T.K.; Chang, F.-K. Built-in sensor network for structural health monitoring of composite structure. J. Intell. Mater. Syst. Struct. 2007, 18, 39–49. [Google Scholar] [CrossRef]
- Bongiovanni, G.; Brunetti, A.; Clemente, P.; Conti, C.; Mazzanti, P.; Verrubbi, V. Dynamic characterization of tower structures by means of interferometry measurements. In Proceedings of the 7th International Conference on Structural Health Monitoring of Intelligent Infrastructure, Torino, Italy, 1–3 July 2015; pp. 1–3. [Google Scholar]
- Gracchi, T.; Lotti, A.; Saccorotti, G.; Lombardi, L.; Nocentini, M.; Mugnai, F.; Gigli, G.; Barla, M.; Giorgetti, A.; Antolini, F. A method for locating rockfall impacts using signals recorded by a microseismic network. Geoenviron. Disasters 2017, 4, 26. [Google Scholar] [CrossRef]
- Schumacher, T.; Shariati, A. Monitoring of Structures and Mechanical Systems Using Virtual Visual Sensors for Video Analysis: Fundamental Concept and Proof of Feasibility. Sensors 2013, 13, 16551–16564. [Google Scholar] [CrossRef]
- Chopra, A.K. Dynamics of Structures; Pearson Education: Sholinganallur, Chennai, India, 2007. [Google Scholar]
- Bickel, V.T.; Manconi, A.; Amann, F. Quantitative assessment of digital image correlation methods to detect and monitor surface displacements of large slope instabilities. Remote Sens. 2018, 10, 865. [Google Scholar] [CrossRef] [Green Version]
- Antonielli, B.; Caporossi, P.; Mazzanti, P.; Moretto, S.; Rocca, A. InSAR & Photomonitoringtm for Dams and Reservoir Slopes Health & Safety Monitoring. In Proceedings of the Twenty-Sixth International Congress on Large Dams/Vingt-Sixième Congrès International des Grands Barrages, Vienna, Austria, 4–6 July 2018; p. 4. [Google Scholar]
- Mugnai, F.; Tucci, G.; Da Re, A. Digital image correlation in assessing structured-light 3D scanner’s gantry stability: Performing david’s (michelangelo) high-accuracy 3D survey. In Proceedings of the International Archives of the Photogrammetry, Remote Sensing and Spatial Information Sciences, Torino, Italy, 1 August 2021; Volume XLVI-M-1–2, pp. 463–469. [Google Scholar] [CrossRef]
- Bing, P.; Hui-Min, X.; Bo-Qin, X.; Fu-Long, D. Performance of sub-pixel registration algorithms in digital image correlation. Meas. Sci. Technol. 2006, 17, 1615. [Google Scholar] [CrossRef]
- Pan, B.; Qian, K.; Xie, H.; Asundi, A. Two-dimensional digital image correlation for in-plane displacement and strain measurement: A review. Meas. Sci. Technol. 2009, 20, 62001. [Google Scholar] [CrossRef]
- Wen, D.; Huang, X.; Bovolo, F.; Li, J.; Ke, X.; Zhang, A.; Benediktsson, J.A. Change Detection From Very-High-Spatial-Resolution Optical Remote Sensing Images: Methods, applications, and future directions. IEEE Geosci. Remote Sens. Mag. 2021, 2–35. [Google Scholar] [CrossRef]
- Yu, L.; Pan, B. In-plane displacement and strain measurements using a camera phone and digital image correlation. Opt. Eng. 2014, 53, 54107. [Google Scholar] [CrossRef]
- Patsias, S.; Staszewskiy, W.J. Damage Detection Using Optical Measurements and Wavelets. Struct. Health Monit. 2002, 1, 5–22. [Google Scholar] [CrossRef]
- Fu, G.; Moosa, A.G. An optical approach to structural displacement measurement and its application. J. Eng. Mech. 2002, 128, 511–520. [Google Scholar] [CrossRef]
- Baqersad, J.; Poozesh, P.; Niezrecki, C.; Avitabile, P. Photogrammetry and optical methods in structural dynamics—A review. Mech. Syst. Signal Process. 2017, 86, 17–34. [Google Scholar] [CrossRef]
- Feng, D.; Feng, M.Q. Experimental validation of cost-effective vision-based structural health monitoring. Mech. Syst. Signal Process. 2017, 88, 199–211. [Google Scholar] [CrossRef]
- Mazzanti, P.; Caporossi, P.; Muzi, R. Sliding Time Master Digital Image Correlation Analyses of CubeSat Images for landslide Monitoring: The Rattlesnake Hills Landslide (USA). Remote Sens. 2020, 12, 592. [Google Scholar] [CrossRef] [Green Version]
- Fastellini, G.; Grassi, S.; Marrucci, M.; Radicioni, F. Michelangelo’s David: Historical images for the preservation of a masterpiece. In Proceedings of the CIPA 2005 XX International Symposium, Torino, Italy, 27 September–1 October 2005. [Google Scholar]
- Levoy, M.; Pulli, K.; Curless, B.; Rusinkiewicz, S.; Koller, D.; Pereira, L.; Ginzton, M.; Anderson, S.; Davis, J.; Ginsberg, J. The digital Michelangelo project: 3D scanning of large statues. In Proceedings of the 27th Annual Conference on Computer Graphics and Interactive Techniques, New York, NY, USA, 1 July 2000; pp. 131–144. [Google Scholar]
- Rugis, J. Surface curvature maps and Michelangelo’s David. In Image and Vision Computing New Zealand; University of Auckland: Auckland, New Zealand, 2005; Volume 2005, pp. 218–222. [Google Scholar]
- Koller, D.; Turitzin, M.; Levoy, M.; Tarini, M.; Croccia, G.; Cignoni, P.; Scopigno, R. Protected interactive 3D graphics via remote rendering. ACM Trans. Graph. 2004, 23, 695–703. [Google Scholar] [CrossRef] [Green Version]
- Brown, B.J.; Rusinkiewicz, S. Non-rigid range-scan alignment using thin-plate splines. In Proceedings of the 2nd International Symposium on 3D Data Processing, Visualization and Transmission, Washington, DC, USA, 6–9 September 2004; pp. 759–765. [Google Scholar]
- Bernardini, F.; Rushmeier, H.; Martin, I.M.; Mittleman, J.; Taubin, G. Building a digital model of Michelangelo’s Florentine Pieta. IEEE Comput. Graph. Appl. 2002, 22, 59–67. [Google Scholar] [CrossRef] [Green Version]
- Gonzalez-Drigo, R.; Cabrera, E.; Luzi, G.; Pujades, L.G.; Vargas-Alzate, Y.F.; Avila-Haro, J. Assessment of post-earthquake damaged building with interferometric real aperture radar. Remote Sens. 2019, 11, 2830. [Google Scholar] [CrossRef] [Green Version]
- Negulescu, C.; Luzi, G.; Crosetto, M.; Raucoules, D.; Roullé, A.; Monfort, D.; Pujades, L.; Colas, B.; Dewez, T. Comparison of seismometer and radar measurements for the modal identification of civil engineering structures. Eng. Struct. 2013, 51, 10–22. [Google Scholar] [CrossRef]
- Luzi, G.; Crosetto, M.; Cuevas-González, M. A radar-based monitoring of the Collserola tower (Barcelona). Mech. Syst. Signal Process. 2014, 49, 234–248. [Google Scholar] [CrossRef] [Green Version]
- Ekstrom, M.P. Digital Image Processing Techniques; Academic Press: Cambridge, MA, USA, 2012; Volume 2. [Google Scholar]
- Caporossi, P.; Mazzanti, P.; Bozzano, F. Digital image correlation (DIC) analysis of the 3 December 2013 Montescaglioso landslide (Basilicata, southern Italy): Results from a multi-dataset investigation. ISPRS Int. J. Geo-Inf. 2018, 7, 372. [Google Scholar] [CrossRef] [Green Version]
- Stumpf, A. Landslide Recognition and Monitoring with Remotely Sensed Data from Passive Optical Sensors. Ph.D. Thesis, University of Strasbourg, Strasbourg, France, 2013. [Google Scholar]
- Tong, X.; Luan, K.; Stilla, U.; Ye, Z.; Xu, Y.; Gao, S.; Xie, H.; Du, Q.; Liu, S.; Xu, X.; et al. Image Registration with Fourier-Based Image Correlation: A Comprehensive Review of Developments and Applications. IEEE J. Sel. Top. Appl. Earth Obs. Remote Sens. 2019, 12, 4062–4081. [Google Scholar] [CrossRef]
- XIAOMI REDMI NOTE 8T Technical Specs. 2021. Available online: https://www.mi.com/it/redmi-note-8-t/specs/ (accessed on 10 October 2021).
- Luzi, G.; Crosetto, M.; Fernández, E. Radar interferometry for monitoring the vibration characteristics of buildings and civil structures: Recent case studies in Spain. Sensors 2017, 17, 669. [Google Scholar] [CrossRef] [PubMed] [Green Version]
- Feng, S.; Zhang, L.; Zuo, C.; Tao, T.; Chen, Q.; Gu, G. High dynamic range 3d measurements with fringe projection profilometry: A review. Meas. Sci. Technol. 2018, 29, 122001. [Google Scholar] [CrossRef]
- Scott, R.P.; Langrock, C.; Kolner, B.H. High-dynamic-range laser amplitude and phase noise measurement techniques. IEEE J. Sel. Top. Quantum Electron. 2001, 7, 641–655. [Google Scholar] [CrossRef] [Green Version]


| Total Surface | 19.47 m2 |
| Volume | 2098 m3 |
| Weight | 5.57 tons |
| Height without pedestal | 5.16 m |
| Parameter | Operating Frequency | Max. Operational Distance | Max. Range Resolution | Nominal Displacement Accuracy | Max. Acquisition Rate | Weight/Battery Autonomy |
|---|---|---|---|---|---|---|
| Value | 17.2 GHz (Ku band) | 1000 m | 0.75 m | 10−5 m | 200 Hz | 12 kg/5 h |
| Sensor | 48.0 MP |
| Sensor Size | 1/2″ |
| FOV | 79.4° |
| Video Resolution | Full HD 1080p |
| FPS Video | 60 FPS |
| Aperture | f/1.75 |
| Pixel size | 0.8 µm |
Publisher’s Note: MDPI stays neutral with regard to jurisdictional claims in published maps and institutional affiliations. |
© 2021 by the authors. Licensee MDPI, Basel, Switzerland. This article is an open access article distributed under the terms and conditions of the Creative Commons Attribution (CC BY) license (https://creativecommons.org/licenses/by/4.0/).
Share and Cite
Mugnai, F.; Cosentino, A.; Mazzanti, P.; Tucci, G. Vibration Analyses of a Gantry Structure by Mobile Phone Digital Image Correlation and Interferometric Radar. Geomatics 2022, 2, 17-35. https://0-doi-org.brum.beds.ac.uk/10.3390/geomatics2010002
Mugnai F, Cosentino A, Mazzanti P, Tucci G. Vibration Analyses of a Gantry Structure by Mobile Phone Digital Image Correlation and Interferometric Radar. Geomatics. 2022; 2(1):17-35. https://0-doi-org.brum.beds.ac.uk/10.3390/geomatics2010002
Chicago/Turabian StyleMugnai, Francesco, Antonio Cosentino, Paolo Mazzanti, and Grazia Tucci. 2022. "Vibration Analyses of a Gantry Structure by Mobile Phone Digital Image Correlation and Interferometric Radar" Geomatics 2, no. 1: 17-35. https://0-doi-org.brum.beds.ac.uk/10.3390/geomatics2010002