
Global Passenger Transport


Department of Design, Monash University-Caulfield Campus, P.O. Box 197, Caulfield East, VIC 3145, Australia
Encyclopedia 2021, 1(1), 189-197; https://0-doi-org.brum.beds.ac.uk/10.3390/encyclopedia1010018
Submission received: 4 January 2021
/
Revised: 25 January 2021
/
Accepted: 4 February 2021
/
Published: 8 February 2021
(This article belongs to the Section Engineering)
Definition
:Global passenger transport consists of all passenger travel by private and public road vehicles, rail passenger travel, air travel, and non-motorized travel. The vehicular travel component expanded an estimated 14-fold between 1950 and 2018, so that now it is not only a major energy user and CO2 emitter, but also the cause of a variety of other negative effects, especially in urban areas. Global transport in future will be increasingly subject to two contradictory forces. On the one hand, the vast present inequality in vehicular mobility between nations should produce steady growth as low-mobility countries raise material living standards. On the other hand, any such vast expansion of the already large global transport task will magnify the negative effects of such travel. The result is a highly uncertain global transport future.
1. Introduction
Possible global passenger transport futures are important to consider, both because of the economic and social importance of this sector, and because of the environmental/social costs generated, many of which presently go unpaid. Before the 2020 pandemic, most forecasts were upbeat about the continued growth of global passenger transport. Pre-pandemic, the Organization of the Petroleum Exporting Countries (OPEC) forecast passenger car numbers growing from 1133 million in 2018 to 1969 million in 2040. In their late 2020 report, the OPEC forecast for 2040 had dropped slightly to 1936 million, but the 2045 forecast was for 2119 million passenger vehicles, with strongest growth in countries outside the Organization for Economic Cooperation and Development (OECD) [1]. For air travel, Airbus in 2019 forecast an average 4.7% annual growth globally out to 2038 [2].
Given the great inequalities in ownership of vehicles and plane travel throughout the world, it might be argued global passenger transport will continue to rise strongly as predicted by OPEC and Airbus, as presently low-mobility countries catch up with the OECD. These countries are keen to enjoy the many benefits they perceive from car ownership and air travel, as well as the economic benefits from a national car manufacturing industry. However, even present high levels of travel come at a high cost, not all of which is covered by users. Fossil fuels overall receive an estimated global subsidy of US$ 5.3 trillion in 2015 [3]. Much of this subsidy was for CO2 emissions, including those from passenger transport.
However, passenger transport incurs a number of other costs, a key one being the result of the global toll of road fatalities and injuries; according to the World Health Organization [4], in 2018 1.35 million died on the world’s roads, with millions more injured. The WHO further pointed out that: “The burden is disproportionately borne by pedestrians, cyclists and motorcyclists, in particular those living in developing countries.” Nevertheless, other external costs include oil supply security fears; air and noise pollution, especially in urban areas; the heavy uptake of urban land for transport infrastructure; and even the health implications from the lack of exercise caused by the replacement of walking and cycling by motorized modes.
A US study evaluated the external costs for all modes of transport in the year 2006 for the US [5]. The study included estimated costs for a variety of items, with the costliest being for accidents, traffic delays, air pollution, and climate change. For car travel, total external costs (in 2006 values) were calculated to lie in the range 1.6–23.5 US cents/p-k. (p-k = passenger-km: one p-k is generated when one passenger travels one km.) The large range reflects the uncertainty in estimates of this type. Presumably, figures in 2020 dollar values would be higher.
Climate researchers sometimes speak of a “carbon pie”—the maximum allowable global CO2 emissions to avoid serious climate change [6]. Many papers have discussed the equitable division of this “pie” between the world’s nations or even individuals. Similarly, Campbell [7] discussed the “Rimini Protocol” which was formulated for what was seen as the need to better match global oil demand to falling supply. An important provision was that “Each importing country shall reduce its imports to match the current World Depletion Rate, deducting any indigenous production.” Additionally, along the same lines, Kitzes et al. [8] proposed a general “shrink and share” approach for achieving both global environmental sustainability and equity. In this proposal, high-income countries would greatly reduce their greenhouse gas emissions (GHGs) while low-income countries could increase theirs.
This idea of limits has prompted Swiss advocacy of a “2 kW society”, in which Swiss average power use per capita is reduced to 2 kW by year 2050 [9]. Given passenger transport’s many costs—particularly CO2 emissions—it might be time for high-mobility countries to analogously consider a “4000 p-k society”, with average vehicular travel levels per capita of 4000 passenger-km (p-k). Average vehicular travel per capita in 2018 was about 6300 p-k [6] but varied from over 30,000 p-k in the US to a few hundred p-k in some low-mobility countries [10]. No limit is proposed for the various forms of non-motorized travel, given their positive health benefits.
The remainder of the paper examines in Section 2 past and present international travel: the amount of travel and its distribution between countries, its distribution between modes, and travel energy consumption and emissions. Section 3 explains why improvements in energy efficiency, even if significant, would not solve the ecological challenges facing transport. In Section 4, several approaches to future patterns of travel are explored, including fully automated vehicles. Section 4 offers some conclusions about preferred futures for global travel.
2. Transport Patterns: Past and Present
2.1. Transport Levels and Modal Shares
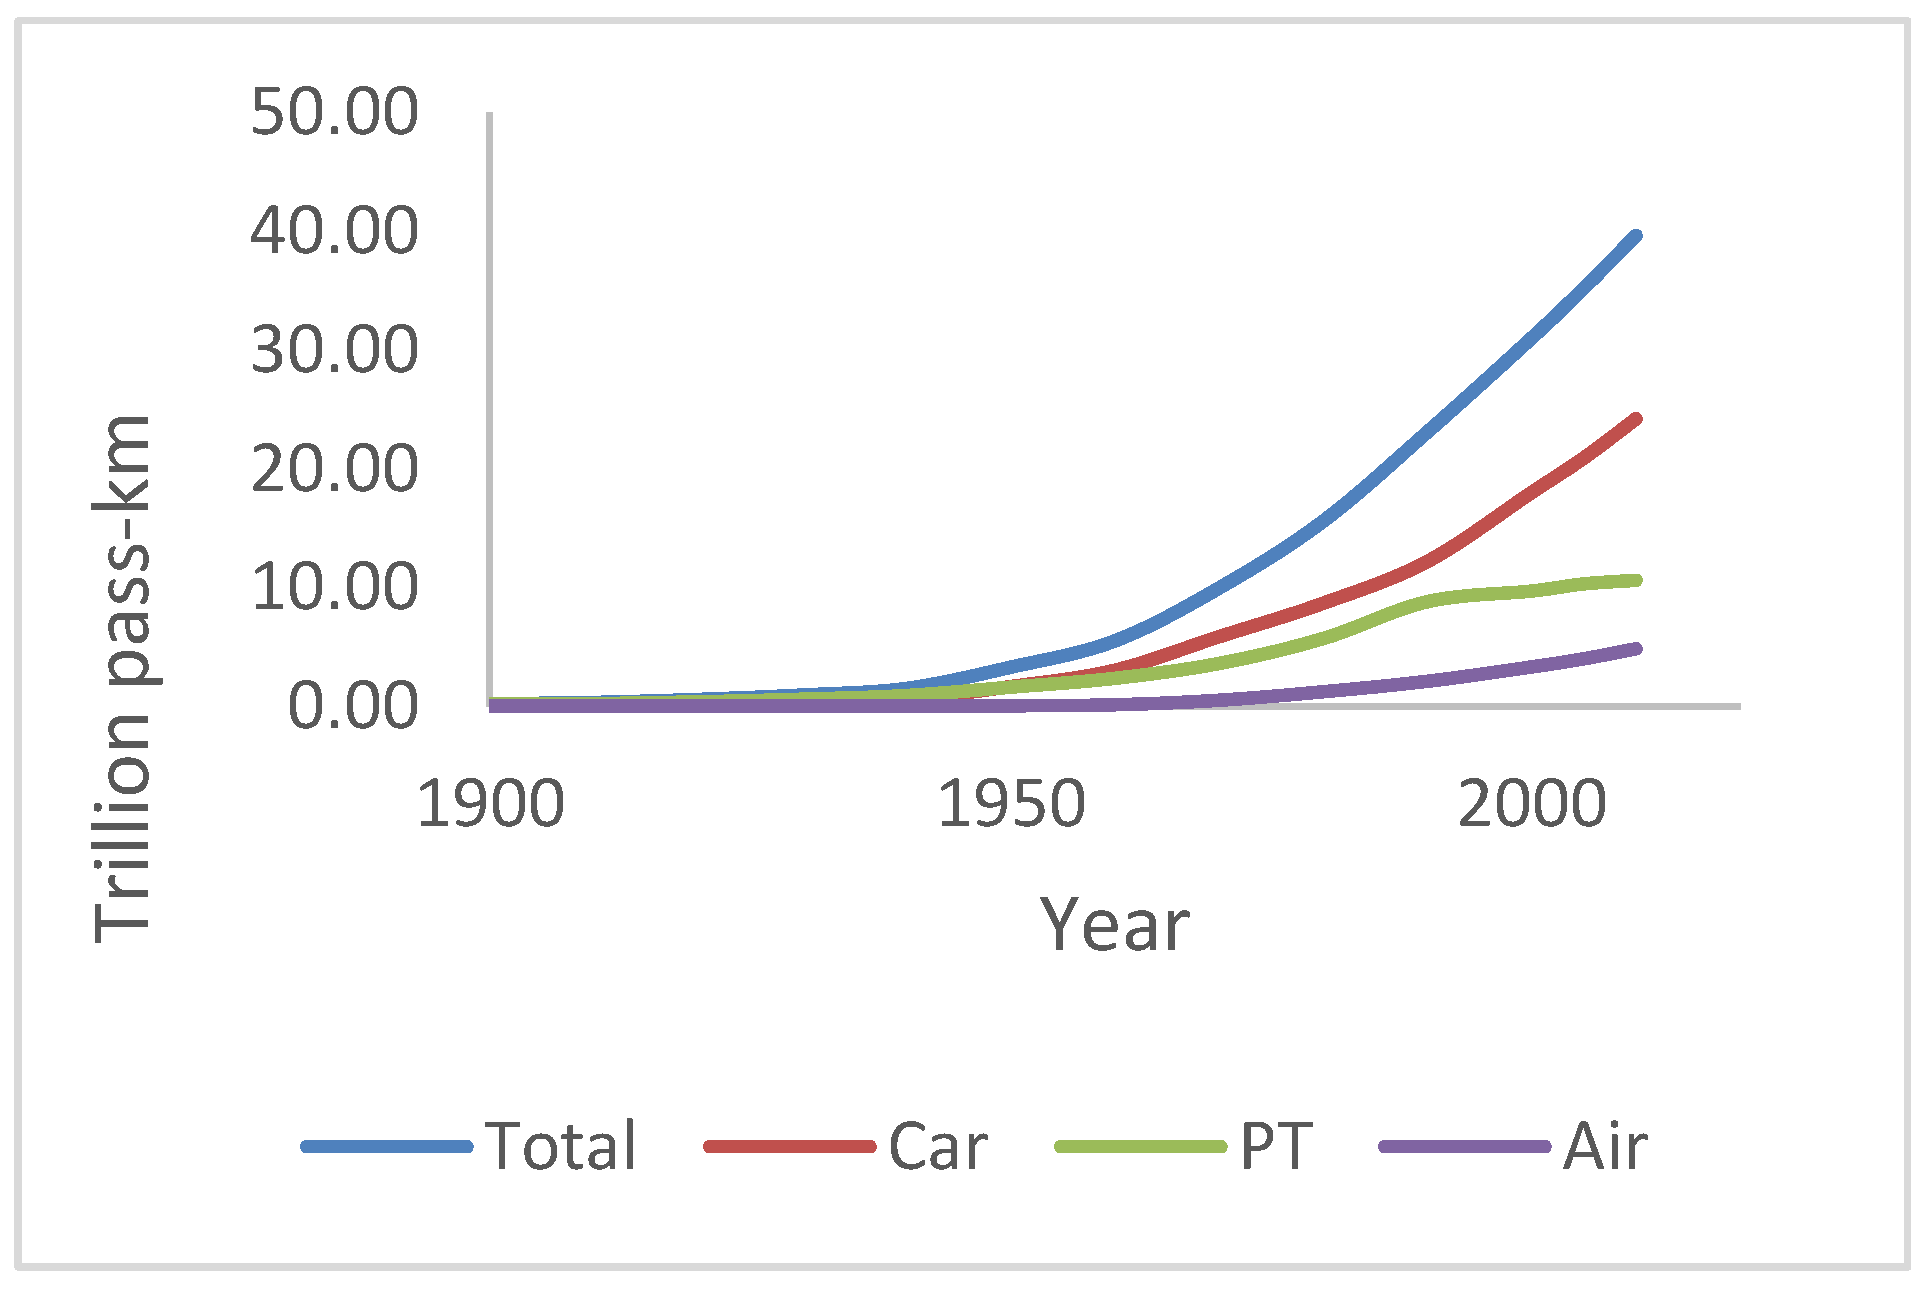
In 1900, global vehicular passenger travel was only about 0.2 trillion p-k (tp-k)—see Table 1. Nearly all of this travel was by rail. Even given a nearly 5-fold rise in global population, a roughly 240-fold growth in travel from 1900 to 2018 is extraordinary and has been termed “hypermobility” [11]. In 1950, nearly all the world’s cars were found in North America; today, both car manufacturing and ownership is more evenly spread around the globe. Nevertheless, huge ownership inequalities persist, with the US and some other countries owning over 800 vehicles (all types with four wheels or more) per 1000 population, compared with less than 5 in several low-income countries, especially in tropical Africa [12]. Air travel is even more skewed: data from Airbus [2] show that air trips per capita for urban residents from different countries can vary by three to four orders of magnitude.
One mode, water transport, is not considered further in this entry for two reasons. First, global statistics are not available. Second, those countries that do give national statistics, such as Japan, indicate that it forms a negligible (and falling) share of total passenger travel—about 0.2% of the total in 2017 [13].
Table 1 indicates that in 1900, all vehicular travel was by public transport, but by 1950, private and public transport had roughly equal shares—at least at the global level. However, nearly all car travel was in North America; elsewhere, public transport was still dominant. Figure 1 shows how the proportions of air, private vehicle, and public transport have varied over the decades and makes it clear that public transport is losing share to both private road and air travel. However, global statistics hide significant differences between countries, even for OECD countries of similar income per capita. On a per capita basis, public transport modes in 2017 accounted for 37.0% of surface domestic transport in Japan, compared with only 7.7% in the US, with Great Britain and Australia having intermediate values of 14.9% and 10.4%, respectively [14].
More than 50% of the global population now lives in cities, and, particularly in large cities, modal shares can differ greatly from the national average. Public transport (and non-motorized) modes fare best in cities with high population densities, such as Tokyo, Hong Kong, and Seoul. High-density cities tend to have lower average car speeds, lower road space provision per person or per vehicle and well-developed fixed rail systems. The result is lower per capita vehicular travel overall, and higher shares for public transport, especially rail. This in turn gives lower per capita transport energy use and transport CO2 emissions for denser cities [15].
2.2. Transport Fuels
Although in 1900, coal fueled most of the world’s trains, by mid-century, oil-based fuels were dominant, with some electric traction used for urban public transport. This oil dominance has continued to this day, despite increased use of natural gas (NG), bioethanol, and electric vehicles (EVs). Table 2 gives the percentage breakdown of transport fuels, both passenger and freight, for 1973 and 2018. Alternative fuels are mainly used by surface passenger transport. Transport, both passenger and freight, in 2018 used 121.0 EJ or 29.1% of global final energy demand, compared with 45.2 EJ or 23.1% in 1973. Transport’s share of energy-related CO2 in 2018 was somewhat smaller, at around 24% [19].
It is an interesting exercise to examine what would happen if all the world’s people had transport energy levels similar to those of the US today. In 2019, the primary energy consumption of US transport was 25.4 EJ [16]. In 2018, the world population was 23.33 times that of the US [20]. Hence, world transport energy levels alone would be about 668 EJ, greater than global total commercial energy use of 576 EJ for 2018 [21]. Even if at average OECD levels, the figure would still be very high.
At the end of 2019, global NG vehicles totaled 28.5 million, mainly in Asia and Latin America, and numbers were rising rapidly [22]. Bio-liquids production in 2019 was 91.7 million barrels oil equivalent (3.8 EJ), up 6% from the 2018 figure [21]. Even though these fuels are still increasing their share, this situation may not last for much longer; recent developments have cast doubt on the future of all internal combusting fuels, including petroleum fuels. A number of countries (and cities) plan to ban internal combustion engine vehicles, some as early as 2030, usually for air pollution reasons [23,24]. The choices would then be between EVs and hydrogen fuel cell vehicles (HFCVs).
Although at various times, both EVs and HFCVs have found favor, at present, EVs have won out—at the end of 2019, they numbered 7.2 million (of which 47% were in China), compared with only a few thousand HFCVs. In the International Energy Agency (IEA) Sustainable Development Scenario, “the global electric vehicle stock (excluding two/three-wheelers) grows by 36% annually, reaching 245 million vehicles in 2030—more than 30 times above today’s level” [25]. The key advantage for EVs is the ubiquity of electric grids; batteries can even be charged (albeit slowly) from domestic power points. The global number of private slow chargers now number 6.5 million, public slow-charging stations about 0.6 million, and public rapid-charging stations over 0.26 million [25]. If the electricity is derived from RE-–and at present, 62.8% of the world’s electricity production is still derived from fossil fuels [21]—both oil consumption and GHG emissions would be greatly reduced. Electric buses are an especially promising option, given than even diesel buses are more energy-efficient (MJ/p-k) than cars. China is again leading the way, with nearly all the global fleet of electric buses deployed there [23].
Some transport urban air pollution would still remain, since non-exhaust emissions of fine particular matter from tire wear is actually greater than for equivalent conventional vehicles, because EVs are heavier than their conventionally fueled counterparts [26].
3. Energy Efficiency Limitations
Improvements in vehicular energy efficiency are often seen as an important means for simultaneously cutting oil use with its resulting air pollution and CO2 emissions, and large efficiency gains are theoretically possible [23]. Although steady improvements have been made in vehicle engine efficiencies, the IEA found that for 20 OECD countries between 2000 and 2017, including the largest, no significant change in energy efficiency (MJ/p-k) occurred for light-duty vehicles [19]. Reasons include the shift to larger vehicles, higher performance, and more energy used for auxiliary purposes such as power steering. In 1970 in the US, light trucks were only 15.1% of total light-duty vehicle sales, but by 2019, their share had risen to 71.6% [10,16].
Even if all passenger transport modes could raise their efficiency to very high levels, serious problems for environmental sustainability would still remain. All surface transport requires roads or rail lines; globally, many million km of roads that already crisscross the inhabited continents. Many more roads are planned, as Laurence and Arrea [27] have stressed: “in the next three decades, the total length of additional paved roads could approach 25 million kilometers worldwide—enough to encircle the planet more than 600 times.” Already in 2013, the Amazon rainforest had 100,000 km of roads [28]. Even mountainous Japan has an average of 3.4 km of roads for every square km [13]. The result is that there are few areas of wilderness that are not near a road. The existing roads, and the 25 million km planned to be built before 2050, pose a number of environmental challenges. First, millions of animals and birds are killed by vehicles each year. Second, the roads create edge effects in forests, which can adversely affect both flora and fauna in these regions. Third, the roads become barriers for wildlife, restricting breeding populations.
Light pollution from vehicle lights and streetlamps also results in adverse environmental effects. Lighting efficiency for fluorescent lighting and LED are far more efficient (in terms of lumen per watt) than incandescent light bulbs, but it is lumen output, not bulb wattage, that causes light pollution. According to Marshall [29], for cities, researchers “have revealed that illuminated nights change animals” life cycles and when plants flower and can affect predator–prey relationships. Even in the world’s key biodiversity areas where wildlife is under threat, about half “had artificially bright skies throughout, and fewer than a third had no light pollution at all.”
Yet another difficulty for the environment results from de-icing roads in winter in colder climates. The salts used in de-icing roads or runways finishes up in waterways. As Pecher et al. [30] note: “Salt pollution causes damage to roadside vegetation, material goods, and infrastructure, including roads and bridges, as well as water systems.” They further stress that its use on roads is increasing, and in the Northwest US, salmon deaths in urban waterways were traced to a chemical commonly used in tire manufacture [31].
The above discussion has made it clear that the effects of vehicular transport extend far beyond the well-researched problems of oil use and accompanying air pollution and global climate change. It has shown that even with high efficiency and/or non-carbon transport fuels, many of the most important adverse environmental effects of transport would still remain.
4. Future Transport
Two decades ago, Schafer and Victor [18] forecast the world’s travel future out to 2050, mainly based on three assumptions. First, that on average, people everywhere allocate roughly 1.1 h per day for travel by all modes, including non-vehicular travel. Second, that at least in high-income countries, travel expenditures form a roughly constant share of household disposable income. Third, that global real GDP per capita would continue to grow at a constant rate of around 1.5% per annum. Given the second and third assumptions, it follows that total travel would continue to rise in line with total income. However, because of the first assumption of a daily travel time limit, faster modes would progressively replace the slower ones. In short, car travel would replace non-motorized modes and surface public transport, and air travel (together with very fast rail) would replace long-distance surface travel. Unfortunately, faster modes are also more energy-intensive [32].
The peak in per capita surface travel reported in a number of OECD countries and cities [33], together with the rapid growth in air travel in recent decades [airbus], provides some support for the Schafer and Victor approach. Their global-level forecasts for 2020 and 2050 were around 53 tp-k and 105 tp-k, respectively [18]. Their 2020 global estimate of 53 tp-k may well have proven fairly accurate—were it not for the 2020 pandemic. Although their first two assumptions seem reasonable, the empirical evidence for them is limited [34]. Further, no allowance is made for possible economic growth declines, or the need for transport to reduce CO2 emissions. The conclusion is that—unlike planetary movements, which can be accurately forecast decades ahead—future transport levels cannot be predicted; they are still very much open to policy interventions—and unanticipated events.
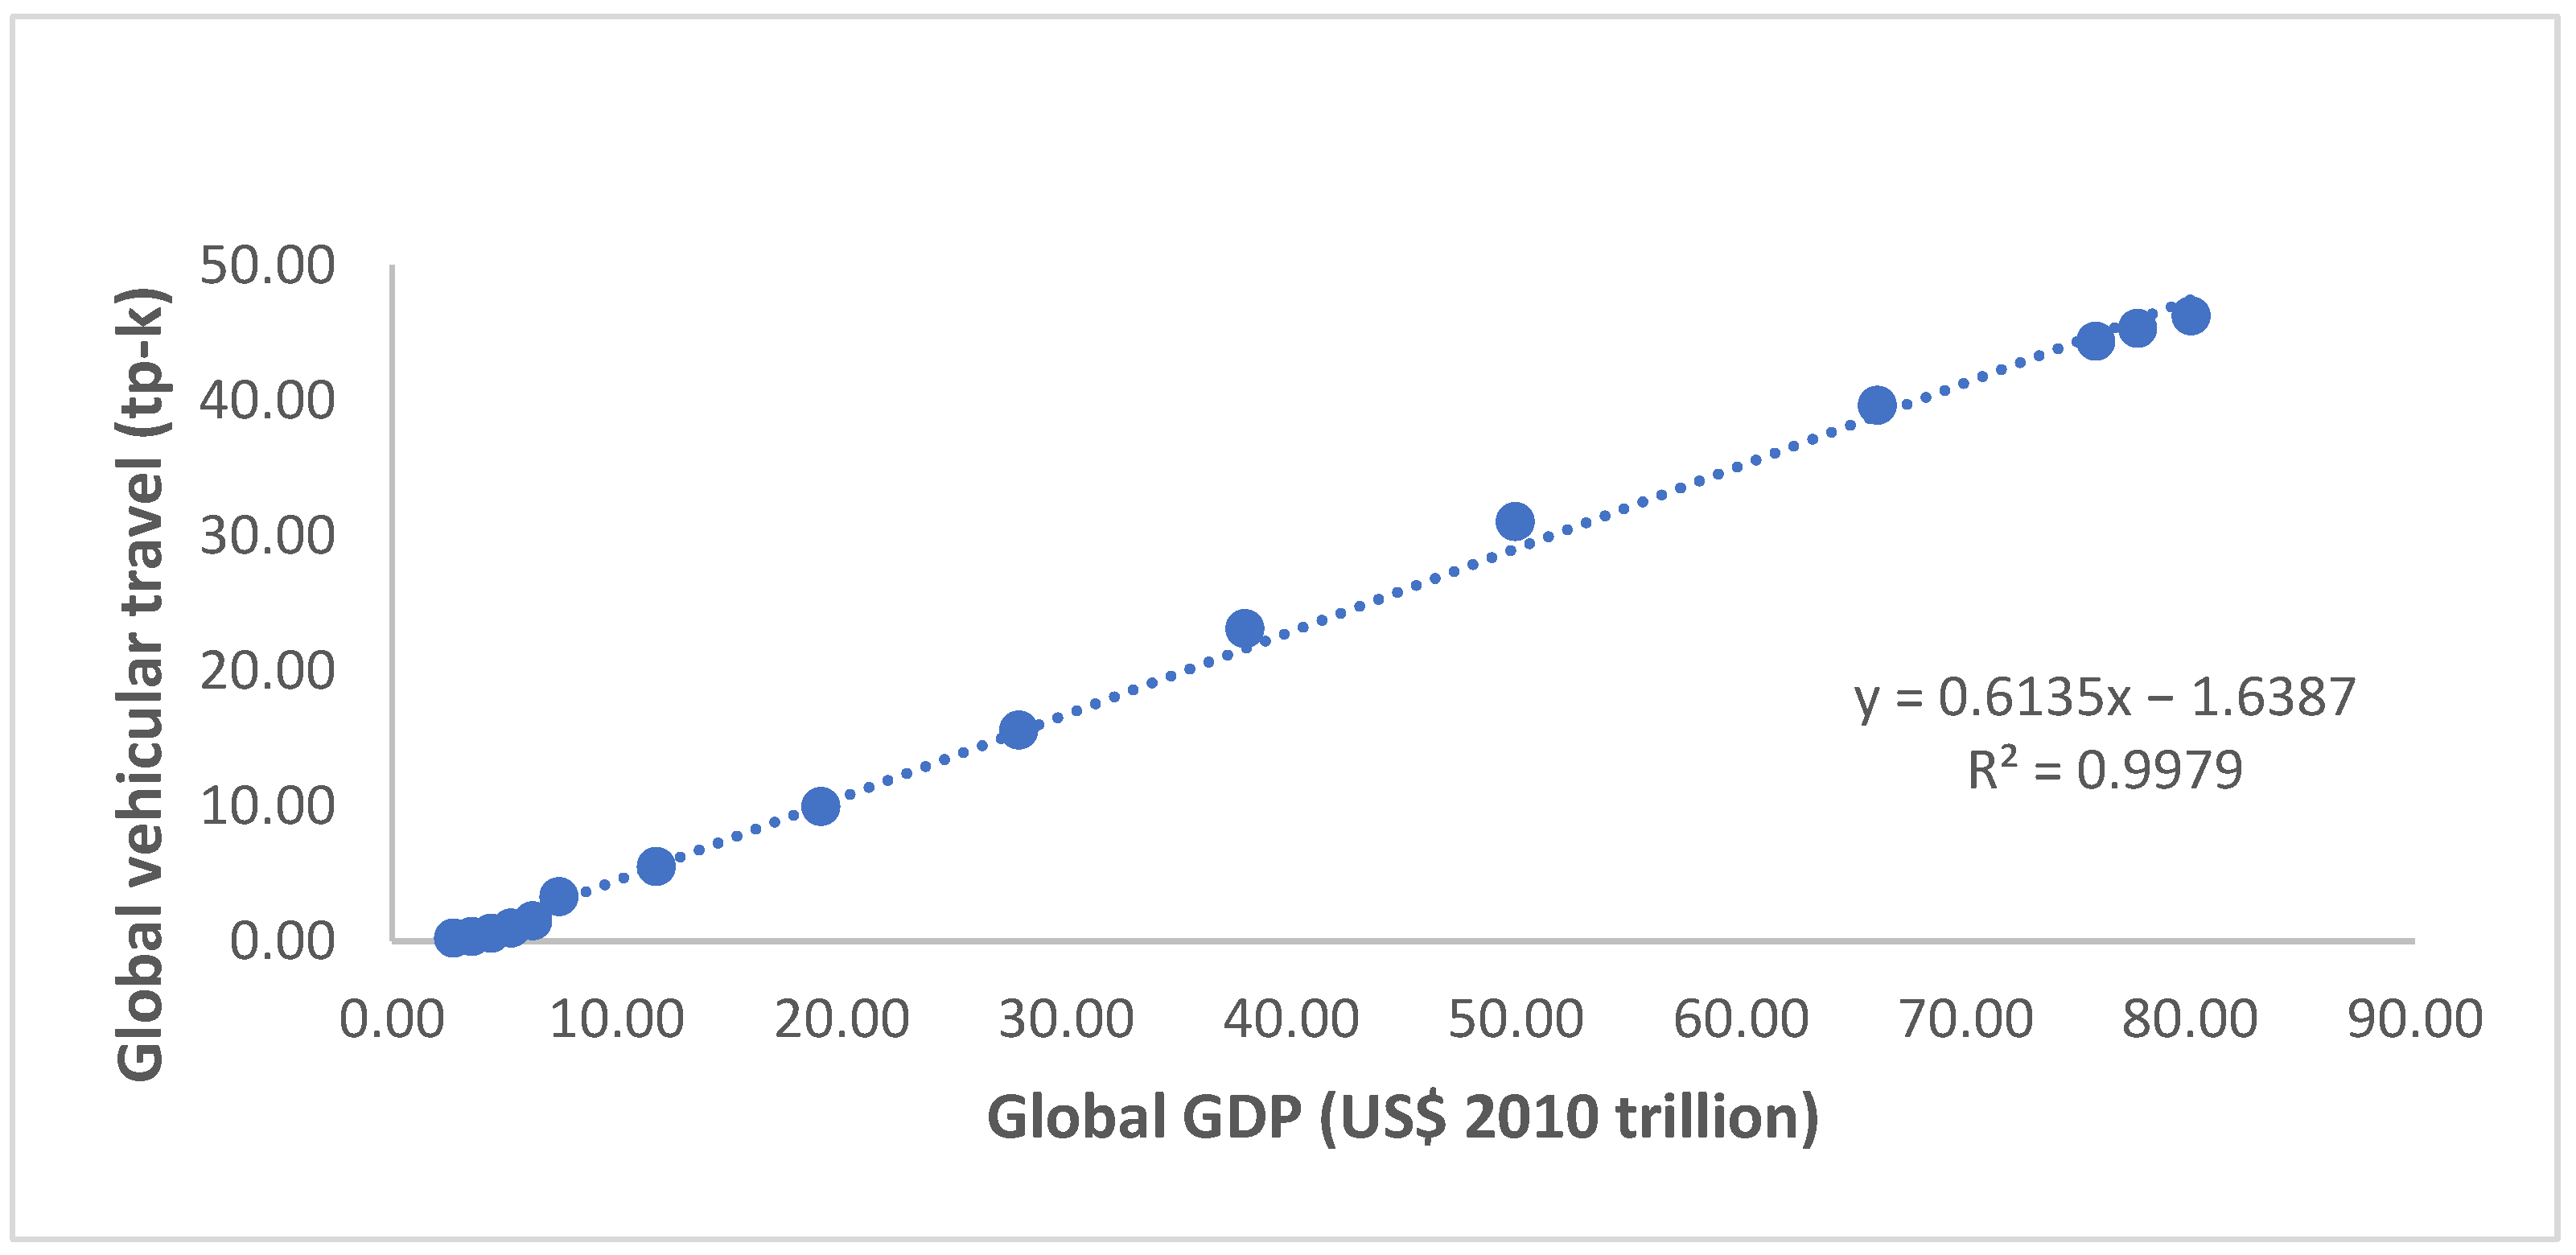
Nevertheless, global transport seems to be strongly linked to global GDP. Figure 2 shows global travel by all modes (in p-k) against global GDP (in constant 2010 US$ per capita). As can be seen, the R2 value is nearly 100%, which suggests that vehicular travel will not be easily uncoupled from global GDP in future. In brief, reductions in travel and its accompanying environmental problems might only be achieved by corresponding GDP reductions. This is not to imply that individual countries lie on this line. An earlier study found for Australia, the UK, Japan and the US that, for car travel at least, national travel again varied linearly with national GDP, but the lines were different for each country, being steepest for the US and flattest for Japan [17].
The global coronavirus pandemic, and the resulting lockdowns in many countries, caused a significant drop in travel compared with 2019. Air travel, especially international services, has been particularly hard hit. Nor does the International Air Transportation Association (IATA) forecast a rebound to business-as-usual anytime soon. The industry expects losses of US$ 118.5 billion in 2020, and US$ 38.7 billion in 2021. “Passenger numbers are expected to plummet to 1.8 billion (60.5% down on the 4.5 billion passengers in 2019). This is roughly the same number that the industry carried in 2003” [37].
During the lockdown and travel restrictions in many countries, people who could work from home were encouraged or required to do so. Working from home with the aid of information technology has been discussed for decades but has never been popular [38]. However, in 2020, it became the only option for many workers and students. Even before the coronavirus pandemic, some researchers were questioning the need for air travel, often because of its carbon footprint (see, for example, [39,40]). With online conferencing becoming common, their several advantages over conventional conferences are becoming clearer [41]. They are much cheaper: the virtual attendee saves on air fares and accommodation. This low cost has enabled more attendance from postgraduate students and those from lower-income countries. They also mean that time-pressed individuals can attend from their own homes or offices. Finally, they get around the problems of visa difficulties and travel bans because of pandemics or politics. Internet learning was also heavily used during lockdowns at all levels of education, and in the post-pandemic era, it seems likely that more work and (especially tertiary) education will be done from home compared with 2019. Nevertheless, face-to-face meetings will still be the preferred communication mode in many circumstances.
Another potential application of the new IT is fully automated vehicles (AVs). Several advantages are claimed for AVs. First, they will reduce both energy use and emissions from vehicles, for several reasons:
- AVs will be much safer than conventional cars, so safety features are not needed, reducing vehicle mass;
- Since they will be driverless, human-controlled steering and braking mechanisms are not needed, again reducing mass;
- Since vehicles can be more closely spaced, air friction is lowered on average.
However, there are not only doubts about whether AVs will even be common on roads [42], but also about whether they have the potential to decrease transport energy [43]. Since drivers are not needed, time spent traveling by car can now be used for other purposes, removing limits on daily travel time. Further, no driving license will be required for AVs, so the pool of potential car owners will grow, and with it, total travel distance. IT can also help in car-sharing schemes. These have been around for decades without really taking off but have potential for reducing car numbers, and possible car travel itself.
In summary, technical fixes are unlikely to solve passenger transport’s many challenges. As Table 2 shows, fossil fuels are being replaced far too slowly, and renewable energy may never be able to supply anywhere near present energy consumption levels [44]. Energy efficiency improvements are offset by the shift to less efficient, faster modes, by rising car ownership in non-OECD countries, and by energy rebound effects as fuel efficiency rises for a given mode. It may be that the observed replacement of travel by internet use will prove to be only temporary. Nevertheless, this large-scale global natural experiment did show that much travel replacement was possible; if for various reasons travel must be reduced, the internet could prove an important means of coping with reduced travel.
5. Conclusions
Before 2020, the future for world transport looked set to continue the steady growth seen over past decades, with only minor and short-lived interruptions. Car ownership was steadily spreading from OECD countries to the rest of the world, and air travel was growing rapidly. The pandemic has driven home the fragility of forecasts based on past extrapolation. At this stage, it is not known if or when global vehicular travel will return to previous patterns. In the short to near term, there will be some travel rebound. Surface travel could return to pre-pandemic trends quickly—and follow pre-pandemic patterns for at least for a few years—but for air travel, disruptions could last for years. Air travel was an important means for the spread of the coronavirus pandemic.
Even before the 2020 watershed year, there were signs that major changes to the global transport system could occur, particularly in Europe [23]. There were concerns about passenger and freight transport’s large and rising share of global CO2 emissions, and about energy security in oil-importing countries (and even about oil depletion, if technical fixes such as carbon dioxide removal and/or geoengineering enabled fossil fuel use to continue unabated). If predicting futures, including that for passenger transport, is becoming increasingly difficult, we must resort to normative planning and decide on what transport future we would prefer.
The difficulty here, of course, is in achieving any consensus on preferred future travel patterns. The huge spread in present average per capita vehicular travel observed between nations, let alone between households, is the main obstacle. Given that technical solutions are unlikely to help much, a “low transport future” [45] is proposed. In this shrink and share approach, OECD countries should aim for their average vehicular transport levels to be reduced to around 4000 p-k per capita by 2050, with some increases in low-mobility societies. It may even be, as several researchers e.g., [46,47,48] have proposed, that further economic growth is fundamentally incompatible with ecological sustainability. If so, all economic/energy sectors, not only transport, will need to contract.
Funding
This research received no external funding.
Conflicts of Interest
The author declares no conflict of interest.
Entry Link on the Encyclopedia Platform
References
- Organization of the Petroleum Exporting Countries (OPEC). 2020 OPEC World Oil Outlook 2045; OPEC: Vienna, Austria, 2020; Available online: http://www.opec.org (accessed on 1 December 2020).
- Airbus. Global Market Forecast 2019–2038; Airbus: Blagnac, CEDEX, France, 2019; Available online: https://www.airbus.com/aircraft/market/global-market-forecast.html (accessed on 1 December 2020).
- Coady, D.; Parry, I.; Sears, S.; Shang, B. How large are global energy subsidies? World Dev. 2017, 91, 11–27. [Google Scholar] [CrossRef]
- World Health Organization (WHO). The Global Health Observatory. Available online: https://www.who.int/data/gho/data/themes/road-safety (accessed on 21 December 2020).
- Delucchi, M.A.; McCubbin, D.R. External Costs of Transport in the U.S. 2010. Available online: https://escholarship.org/content/qt13n8v8gq/qt13n8v8gq.pdf (accessed on 21 December 2020).
- Moriarty, P.; Honnery, D. New approaches for ecological and social sustainability in a post-pandemic world. World 2020, 1, 191–204. [Google Scholar] [CrossRef]
- Campbell, C.J. The Rimini Protocol an oil depletion protocol: Heading off economic chaos and political conflict during the second half of the age of oil. Energy Pol. 2006, 34, 1319–1325. [Google Scholar] [CrossRef]
- Kitzes, J.; Peller, A.; Goldfinger, S.; Wackernagel, M. Shrink and share: Humanity’s present and future Ecological Footprint. Phil. Trans. R. Soc. B 2008, 363, 467–475. [Google Scholar] [CrossRef]
- Haldi, P.-A.; Favrat, D. Methodological aspects of the definition of a 2 kW society. Energy 2006, 31, 3159–3170. [Google Scholar] [CrossRef]
- US Department of Transportation (USDoT). 2020 Pocket Guide to Transportation; USDoT: Washington, DC, USA, 2020. Available online: https://www.bts.gov/browse-statistical-products-and-data/pocket-guide-transportation/pocket-guide-transportation (accessed on 21 December 2020).
- Urry, J. Mobility and Proximity. Sociology 2002, 36, 255–274. [Google Scholar] [CrossRef]
- Wikipedia. List of Countries by Vehicles per Capita. Available online: En.wikipedia.org/wiki/List_of_countries_by_vehicles_per_capita (accessed on 20 December 2020).
- Statistics Bureau Japan. Japan Statistical Yearbook 2021; Statistics Bureau Japan: Tokyo, Japan, 2021; Available online: http://www.stat.go.jp/english/data/nenkan/70nenkan/index.html (accessed on 22 December 2020).
- Moriarty, P.; Honnery, D. Reducing personal mobility for climate change mitigation. In Handbook of Climate Change Mitigation and Adaptation, 3rd ed.; Chen, W.-Y., Suzuki, T., Lackner, M., Eds.; Springer: New York, NY, USA, 2021. [Google Scholar]
- Bruun, E.; Givoni, M. Six research routes to steer transport policy. Nature 2015, 523, 29–31. [Google Scholar] [CrossRef] [PubMed]
- Davis, S.C.; Boundy, R.G. Transportation Energy Data Book: Edition 38.2 (ORNL/TM-2019/1333); ORNL: Oak Ridge, TN, USA, 2020.
- Moriarty, P.; Honnery, D. Forecasting world travel in the year 2050. Int. J. Veh. Design 2004, 35, 151–165. [Google Scholar] [CrossRef]
- Schafer, A.; Victor, D. The future mobility of the world population. Transport. Res. A 2000, 34, 171–205. [Google Scholar] [CrossRef]
- International Energy Agency (IEA). Key World Energy Statistics 2020; IEA/OECD: Paris, France, 2020; (Also, earlier editions). [Google Scholar]
- United Nations Department of Economic and Social Affairs Population Dynamics. Available online: https://population.un.org/wpp/ (accessed on 20 December 2020).
- BP. BP Statistical Review of World Energy 2020; BP: London, UK, 2020. [Google Scholar]
- NGV Global. Current Natural Gas Vehicle Statistics. Available online: http://www.iangv.org/current-ngv-stats/ (accessed on 9 December 2020).
- Moriarty, P.; Honnery, D. Prospects for hydrogen as a transport fuel. Int. J. Hydrog. Energy 2019, 44, 16029–16037. [Google Scholar] [CrossRef]
- Martin, B.; Pestiaux, J.; Schobbens, Q.; Emmrich, J.; Hagemann, M. A Radical Transformation of Mobility in Europe: Exploring the Decarbonisation of the Transport Sector by 2040. September 2020. Available online: http://newclimate.org/publications/ (accessed on 2 December 2020).
- International Energy Agency (IEA). Global EV Outlook 2020; IEA/OECD: Paris, France, 2020; Available online: https://www.iea.org/reports/global-ev-outlook-2020 (accessed on 1 December 2020).
- Timmers, V.R.J.H.; Achten, P.A.J. Non-exhaust PM emissions from electric vehicles. Atmos. Environ. 2016, 134, 10–17. [Google Scholar] [CrossRef]
- Laurance, W.F.; Arrea, I.R. Roads to riches or ruin? Science 2017, 358, 442–444. [Google Scholar] [CrossRef] [PubMed]
- Laurance, W.F.; Balmford, A. A global map for road building. Nature 2013, 495, 308–309. [Google Scholar] [CrossRef] [PubMed]
- Marshall, M. Light is leaking into vital habitats. New Sci. 2019, 241, 8. [Google Scholar] [CrossRef]
- Pecher, W.T.; Al Madadha, M.E.; DasSarma, P.; Ekulona, F.; Schott, E.J.; Crowe, K.; Gut, B.S.; DasSarma, S. Effects of road salt on microbial communities: Halophiles as biomarkers of road salt pollution. PLoS ONE 2019, 14, e0221355. [Google Scholar] [CrossRef]
- Stokstad, E. Why were salmon dying? The answer washed off the road. Science 2020, 370, 1145. [Google Scholar] [CrossRef] [PubMed]
- Gabrielli, G.; von Karman, T. What price speed? Specific power required for propulsion of vehicles. Mech. Eng. 1950, 72, 775–781. [Google Scholar]
- Millard-Ball, A.; Schipper, L. Are we reaching peak travel? Trends in passenger transport in eight industrialized countries. Transp. Rev. 2011, 31, 357–378. [Google Scholar] [CrossRef]
- Moriarty, P. Household travel time and money expenditures. Road Transp. Res. 2002, 11, 2–11. [Google Scholar]
- Garrett, T.J.; Grasselli, M.; Keen, S. Past world economic production constrains current energy demands: Persistent scaling with implications for economic growth and climate change mitigation. PLoS ONE 2020, 15, e0237672. [Google Scholar] [CrossRef]
- Moriarty, P.; Honnery, D. Rise and Fall of the Carbon Civilisation; Springer: London, UK, 2011. [Google Scholar]
- International Air Transportation Association (IATA). Deep Losses Continue Into 2021; IATA: Montreal, QC, Canada, 2020; Available online: https://www.iata.org/en/pressroom/pr/2020-11-24-01/ (accessed on 3 December 2020).
- Moriarty, P. Reducing levels of urban passenger travel. Int. J. Sustain. Transp. 2016, 10, 712–719. [Google Scholar] [CrossRef]
- Abbott, A. Virtual science conference tries to recreate social buzz. Nature 2020, 577, 13. [Google Scholar] [CrossRef]
- Gössling, S.; Hanna, P.; Higham, J.; Cohen, S.; Hopkins, D. Can we fly less? Evaluating the ‘necessity’ of air travel. J. Air Transp. Manag. 2019, 81, 101722. [Google Scholar]
- Price, M. Scientists discover upsides of virtual meetings. Nature 2020, 368, 457–458. [Google Scholar]
- Wang, S.J.; Moriarty, P. Big Data for Urban Sustainability: A Human-Centered Perspective; Springer: New York, NY, USA, 2020; ISBN 978-3-319-73608-2. [Google Scholar]
- Shaheen, S.; Bouzaghrane, M.A. Mobility and energy impacts of shared automated vehicles: A review of recent literature. Curr. Sustain. Renew. Energy Rep. 2019, 6, 193–200. [Google Scholar] [CrossRef]
- Moriarty, P.; Honnery, D. Feasibility of a 100% global renewable energy system. Energies 2020, 13, 5543. [Google Scholar] [CrossRef]
- Moriarty, P.; Honnery, D. Low-mobility: The future of transport. Futures 2008, 40, 865–872. [Google Scholar] [CrossRef]
- Hickel, J. The contradiction of the sustainable development goals: Growth versus ecology on a finite planet. Sustain. Dev. 2019, 27, 1–12. [Google Scholar] [CrossRef]
- Daly, H. Growthism: Its ecological, economic and ethical limits. Real World Econ. Rev. 2019, 87, 9–22. [Google Scholar]
- Trainer, T. De-growth: Some suggestions from the Simpler Way perspective. Ecol. Econ. 2020, 167, 106436. [Google Scholar] [CrossRef]


Table 1.
Global passenger travel-related data 1900, 1950 and 2018.
| Parameter | 1900 | 1950 | 2018 |
|---|---|---|---|
| Population (billion) | 1.563 | 2.525 | 7.630 |
| Total travel (tp-k) | 0.2 1 | 3.3 1 | 48.2 1 |
| Public surface transport (tp-k) | 0.2 | 1.62 | 11.5 |
| Private surface transport (tp-k) | 0 | 1.65 | 28.0 |
| Air transport (tp-k) | 0 | 0.03 | 8.7 |
| Passenger cars (m) | 0 | 51.3 | 1133 |
| Pass. cars/1000 pop. | 0 | 20.3 | 148 |
Table 2.
Global transport final energy demand by fuel, 1973 and 2018.
| Fuel | 1973 (%) | 2018 (%) |
|---|---|---|
| Petroleum-based | 94.3 | 91.7 |
| Natural gas | 1.6 | 4.0 |
| Biofuels | <0.1 | 3.1 |
| Electricity | 1.0 | 1.2 |
| Coal | 3.1 | <0.1 |
| All transport fuels | 100.0 | 100.0 |
Source: [19].
Publisher’s Note: MDPI stays neutral with regard to jurisdictional claims in published maps and institutional affiliations. |
© 2021 by the author. Licensee MDPI, Basel, Switzerland. This article is an open access article distributed under the terms and conditions of the Creative Commons Attribution (CC BY) license (http://creativecommons.org/licenses/by/4.0/).
Share and Cite
MDPI and ACS Style
Moriarty, P. Global Passenger Transport. Encyclopedia 2021, 1, 189-197. https://0-doi-org.brum.beds.ac.uk/10.3390/encyclopedia1010018
AMA Style
Moriarty P. Global Passenger Transport. Encyclopedia. 2021; 1(1):189-197. https://0-doi-org.brum.beds.ac.uk/10.3390/encyclopedia1010018
Chicago/Turabian StyleMoriarty, Patrick. 2021. "Global Passenger Transport" Encyclopedia 1, no. 1: 189-197. https://0-doi-org.brum.beds.ac.uk/10.3390/encyclopedia1010018