
Systemic Lupus Erythematosus Patients Exhibit Reduced Expression of CLEC16A Isoforms in Peripheral Leukocytes

Abstract
:1. Introduction
2. Results and Discussion
2.1. Results


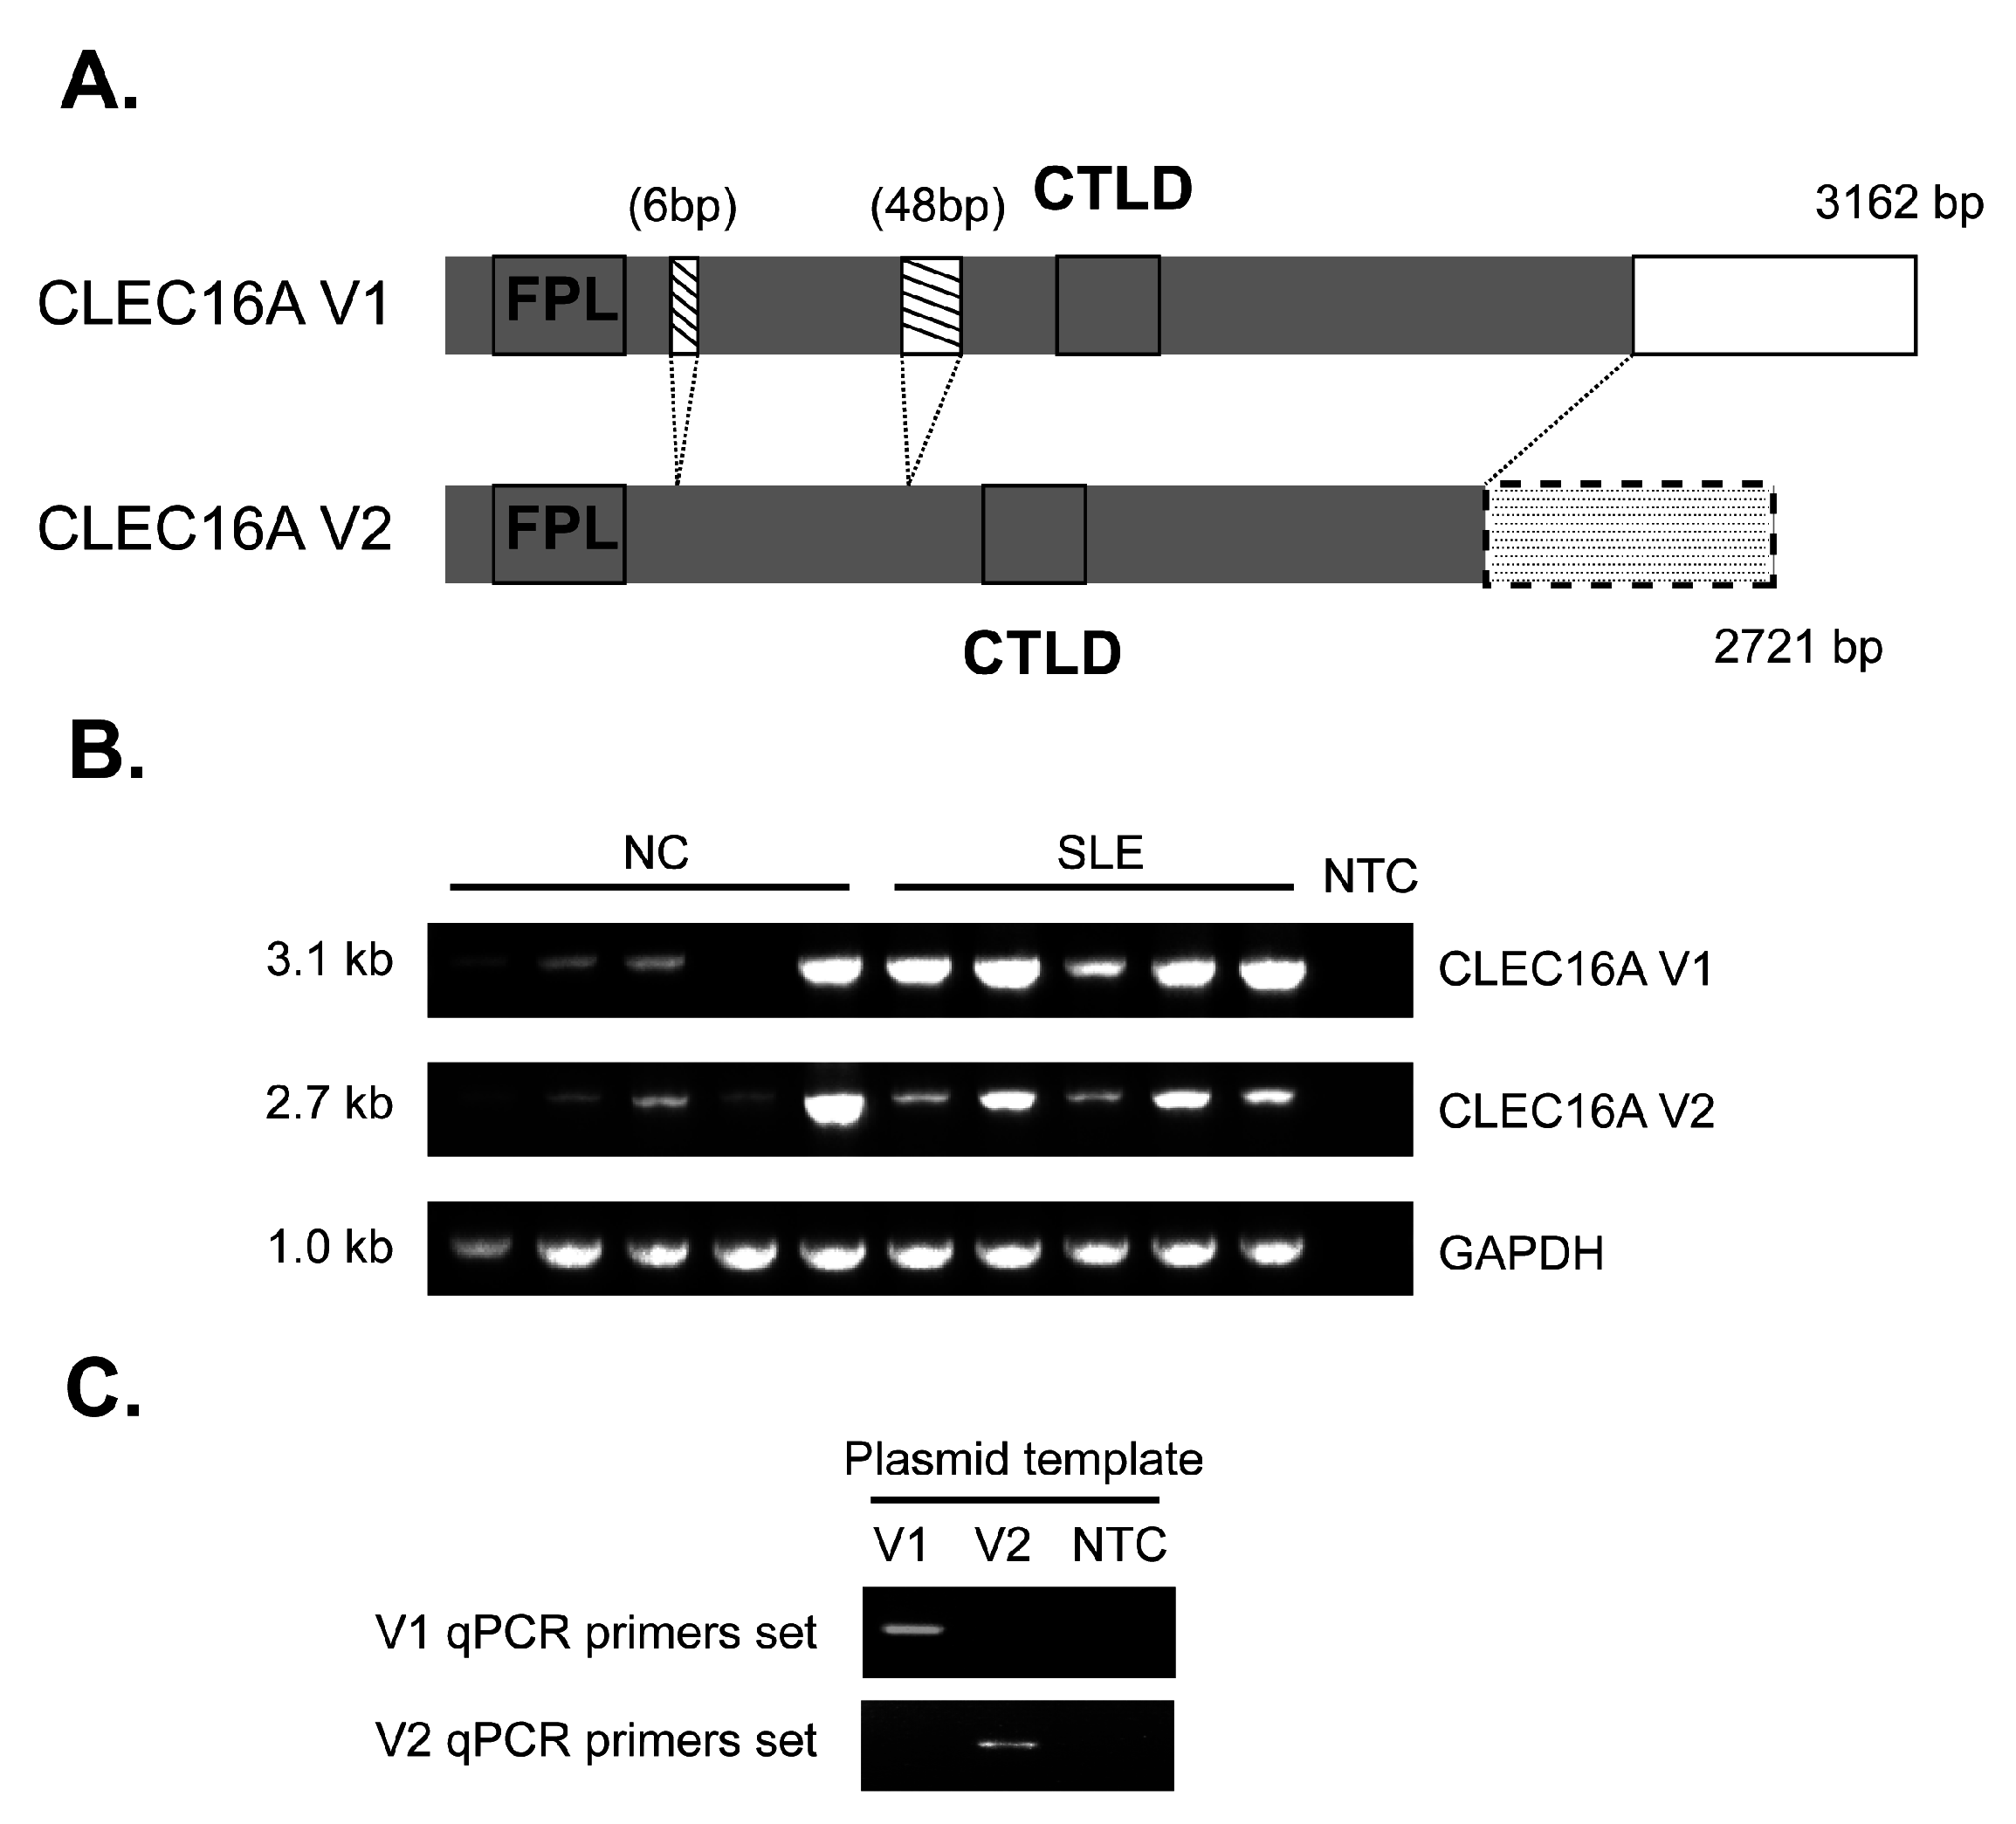
| Parameter | Value | Unit |
|---|---|---|
| Age | 46 (20–79) | median years (range) |
| Female:male | 181:9 | number |
| SLE duration | 17.5 (1–40) | median years (range) |
| Malar rash | 11.5 | % |
| Discoid rash | 0 | % |
| Photosensitivity | 0 | % |
| Oral ulcers | 5.7 | % |
| Arthritis | 3.1 | % |
| Serositis | 0.5 | % |
| Renal disorder | 14.6 | % |
| Neurological disorder | 0 | % |
| Hematological disorder | 10.4 | % |
| Immunological disorder | 43.2 | % |
| Antinuclear factor | 3.1 | % |
| SLEDAI score | 3.4 ± 3.7 | mean ± SD |
| Anti-dsDNA | 63.5 ± 80.7 | mean ± SD |
| C3 level | 82.0 ± 25.0 | mean ± SD |
| C4 level | 16.5 ± 7.9 | mean ± SD |
| CRP level | 0.5 ± 0.5 | mean ± SD |
| Group | CLEC16A V1 | CLEC16A V2 | CLEC16A V2/V1 Ratio |
|---|---|---|---|
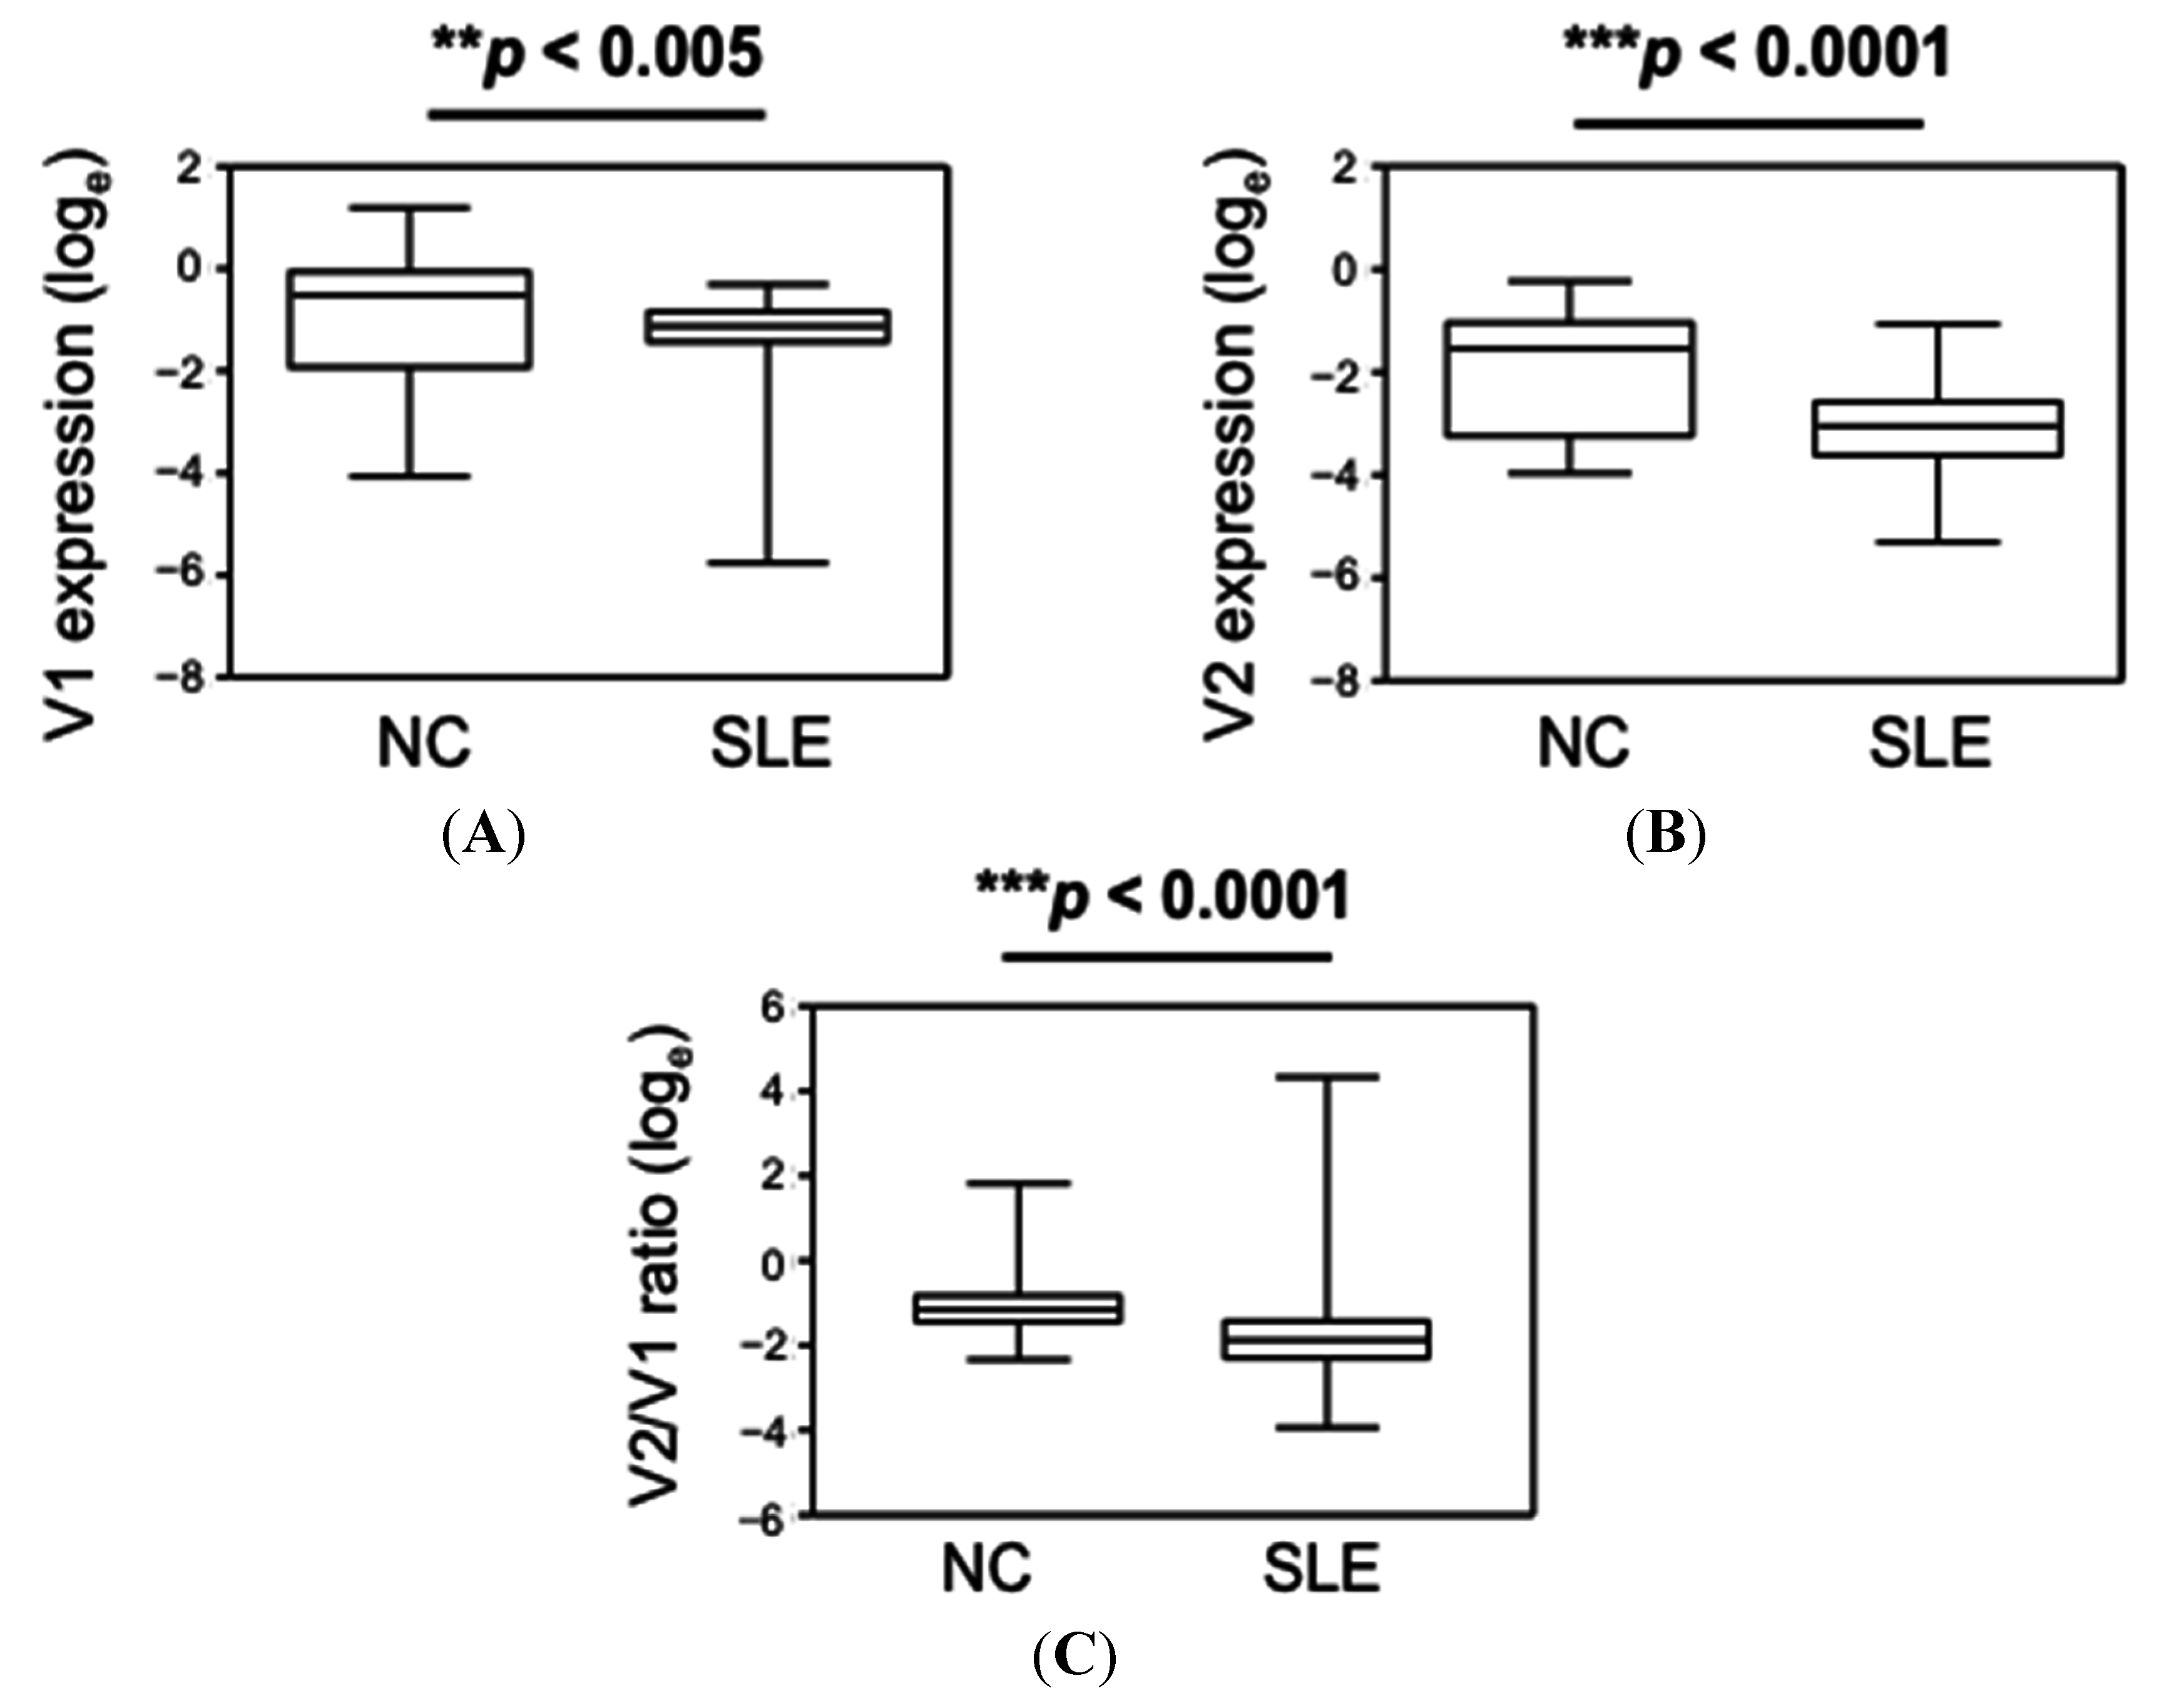
| NC | 0.61 (0.02–3.31) # | 0.22 (0.02–0.79) | 0.32 (0.10–6.1) |
| SLE | 0.33 (0.003–0.74) | 0.05 (0.005–0.35) | 0.15 (0.02–76.05) |
| p-value * | <0.005 | <0.0001 | <0.0001 |


| Clinical Parameter | CLEC16A V1 | CLEC16A V2 | CLEC16A V2/V1 | ||||||
|---|---|---|---|---|---|---|---|---|---|
| Rho * | p ** | Rho | p | Rho | p | ||||
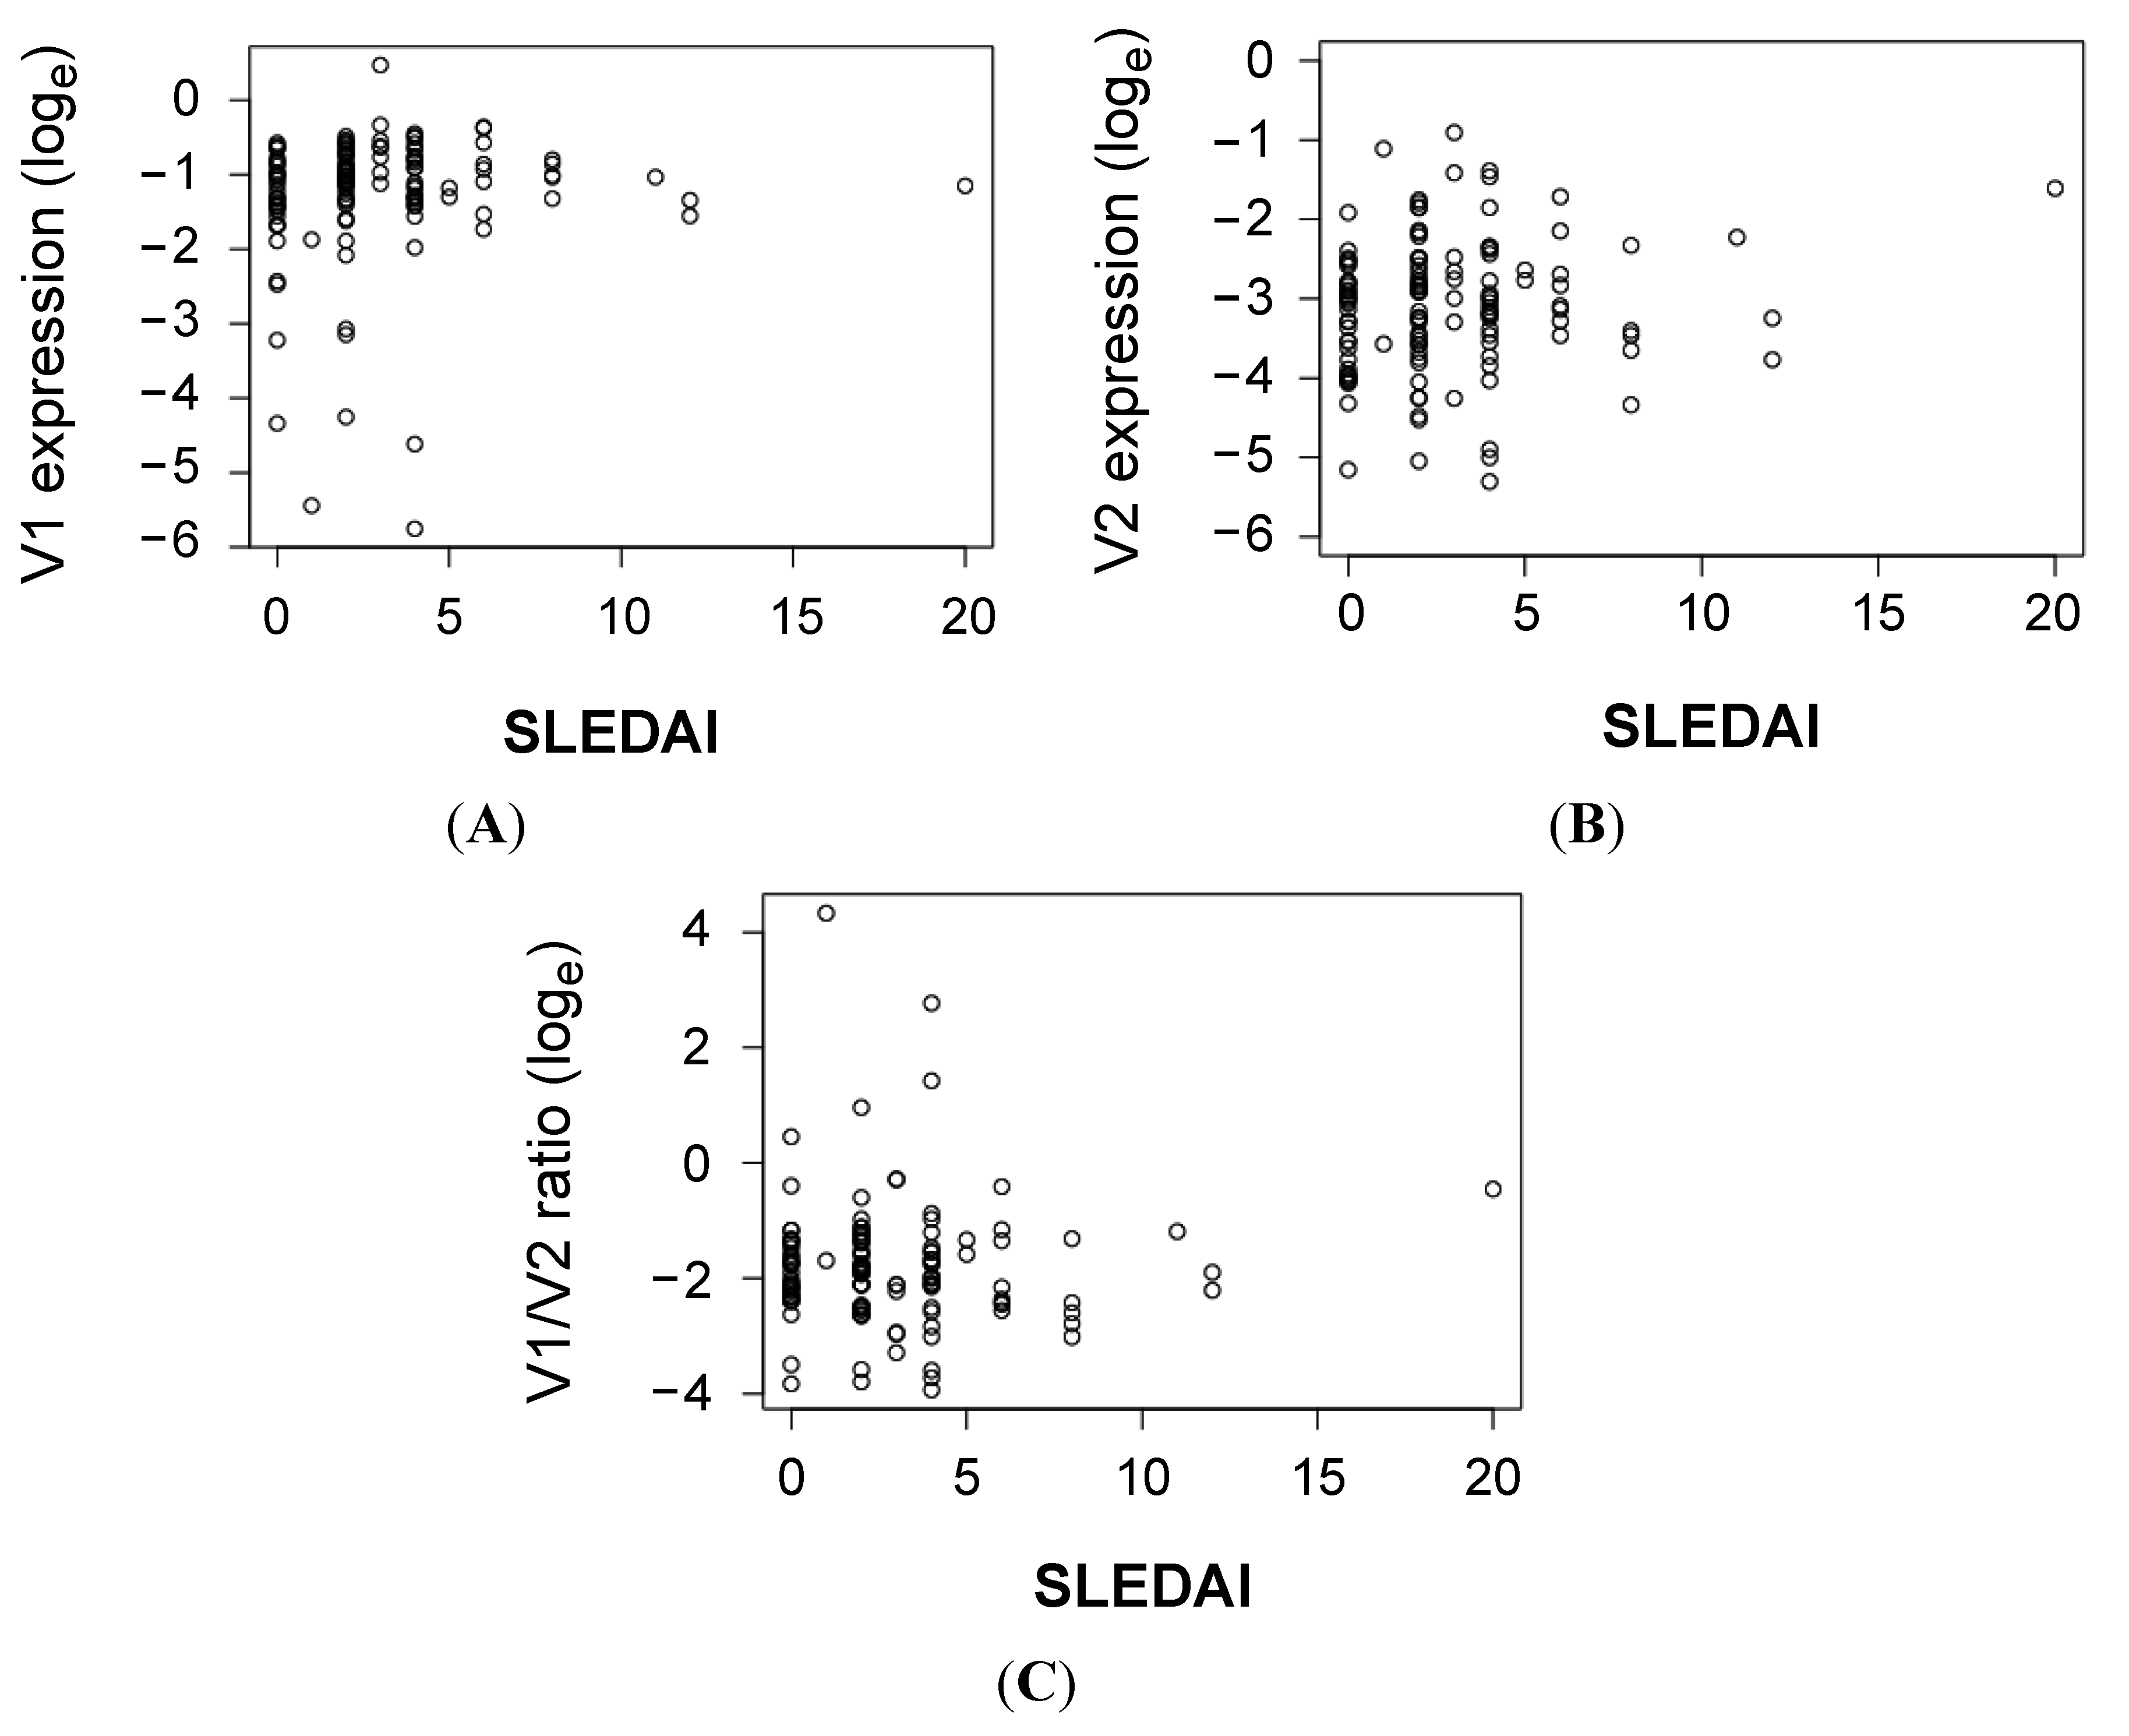
| Anti-dsDNA titer | 0.09 | 0.32 | 0.17 | 0.057 | 0.10 | 0.29 | |||
| C3 level | −0.06 | 0.53 | −0.23 | 0.0088 | −0.18 | 0.042 | |||
| C4 level | −0.08 | 0.40 | −0.17 | 0.053 | −0.12 | 0.18 | |||
| CRP level | −0.11 | 0.24 | −0.07 | 0.43 | −0.07 | 0.43 | |||
| Leukocyte count | −0.24 | 0.0077 | −0.23 | 0.0087 | −0.04 | 0.68 | |||
| Hemoglobin count | 0.07 | 0.45 | −0.06 | 0.51 | −0.05 | 0.57 | |||
| Platelet count | −0.19 | 0.035 | −0.12 | 0.19 | 0.08 | 0.37 | |||
| Neutrophil count | −0.16 | 0.076 | −0.13 | 0.14 | −0.01 | 0.95 | |||
| Lymphocyte count | −0.17 | 0.050 | −0.16 | 0.077 | −0.01 | 0.95 | |||
| IgG titer | −0.04 | 0.70 | 0.04 | 0.70 | 0.01 | 0.95 | |||
| IgA titer | 0.02 | 0.83 | 0.05 | 0.57 | 0.02 | 0.86 | |||
| IgM titer | −0.12 | 0.18 | −0.14 | 0.13 | 0.07 | 0.46 | |||
2.2. Discussion
3. Experimental Section
3.1. Subjects
3.2. Isolation of Peripheral Blood Mononuclear Cells
3.3. Expression Analyses
3.4. Statistical Analyses
4. Conclusions
Acknowledgments
Author Contributions
Conflicts of Interest
References
- Rahman, A.; Isenberg, D.A. Systemic lupus erythematosus. N. Engl. J. Med. 2008, 358, 929–939. [Google Scholar] [CrossRef] [PubMed]
- Deng, Y.; Tsao, B.P. Genetic susceptibility to systemic lupus erythematosus in the genomic era. Nat. Rev. Rheumatol. 2010, 6, 683–692. [Google Scholar] [CrossRef] [PubMed]
- Gateva, V.; Sandling, J.K.; Hom, G.; Taylor, K.E.; Chung, S.A.; Sun, X.; Ortmann, W.; Kosoy, R.; Ferreira, R.C.; Nordmark, G.; et al. A large-scale replication study identifies TNIP1, PRDM1, JAZF1, UHRF1bp1 and IL10 as risk loci for systemic lupus erythematosus. Nat. Genet. 2009, 41, 1228–1233. [Google Scholar] [CrossRef] [PubMed]
- Han, J.W.; Zheng, H.F.; Cui, Y.; Sun, L.D.; Ye, D.Q.; Hu, Z.; Xu, J.H.; Cai, Z.M.; Huang, W.; Zhao, G.P.; et al. Genome-wide association study in a chinese han population identifies nine new susceptibility loci for systemic lupus erythematosus. Nat. Genet. 2009, 41, 1234–1237. [Google Scholar] [CrossRef] [PubMed]
- Yang, W.; Shen, N.; Ye, D.Q.; Liu, Q.; Zhang, Y.; Qian, X.X.; Hirankarn, N.; Ying, D.; Pan, H.F.; Mok, C.C.; et al. Genome-wide association study in asian populations identifies variants in ETS1 and WDFY4 associated with systemic lupus erythematosus. PLoS Genet. 2010, 6, e1000841. [Google Scholar] [CrossRef] [PubMed] [Green Version]
- Zhang, Z.; Cheng, Y.; Zhou, X.; Li, Y.; Gao, J.; Han, J.; Quan, C.; He, S.; Lv, Y.; Hu, D.; et al. Polymorphisms at 16p13 are associated with systemic lupus erythematosus in the chinese population. J. Med. Genet. 2011, 48, 69–72. [Google Scholar] [CrossRef] [PubMed]
- Wang, S.; Adrianto, I.; Wiley, G.B.; Lessard, C.J.; Kelly, J.A.; Adler, A.J.; Glenn, S.B.; Williams, A.H.; Ziegler, J.T.; Comeau, M.E.; et al. A functional haplotype of UBE2L3 confers risk for systemic lupus erythematosus. Genes Immun. 2012, 13, 380–387. [Google Scholar] [CrossRef] [PubMed]
- Hakonarson, H.; Grant, S.F.; Bradfield, J.P.; Marchand, L.; Kim, C.E.; Glessner, J.T.; Grabs, R.; Casalunovo, T.; Taback, S.P.; Frackelton, E.C.; et al. A genome-wide association study identifies KIAA0350 as a type 1 diabetes gene. Nature 2007, 448, 591–594. [Google Scholar] [CrossRef] [PubMed]
- Wu, X.; Zhu, X.; Wang, X.; Ma, J.; Zhu, S.; Li, J.; Liu, Y. Intron polymorphism in the KIAA0350 gene is reproducibly associated with susceptibility to type 1 diabetes (T1D) in the han chinese population. Clin. Endocrinol. 2009, 71, 46–49. [Google Scholar] [CrossRef] [PubMed]
- Rubio, J.P.; Stankovich, J.; Field, J.; Tubridy, N.; Marriott, M.; Chapman, C.; Bahlo, M.; Perera, D.; Johnson, L.J.; Tait, B.D.; et al. Replication of KIAA0350, IL2RA, RPL5 and CD58 as multiple sclerosis susceptibility genes in australians. Genes Immun. 2008, 9, 624–630. [Google Scholar] [CrossRef] [PubMed]
- Hoppenbrouwers, I.A.; Aulchenko, Y.S.; Janssens, A.C.; Ramagopalan, S.V.; Broer, L.; Kayser, M.; Ebers, G.C.; Oostra, B.A.; van Duijn, C.M.; Hintzen, R.Q. Replication of CD58 and CLEC16A as genome-wide significant risk genes for multiple sclerosis. J. Hum. Genet. 2009, 54, 676–680. [Google Scholar] [CrossRef] [PubMed]
- Martinez, A.; Perdigones, N.; Cenit, M.C.; Espino, L.; Varade, J.; Lamas, J.R.; Santiago, J.L.; Fernandez-Arquero, M.; de la Calle, H.; Arroyo, R.; et al. Chromosomal region 16p13: Further evidence of increased predisposition to immune diseases. Ann. Rheum. Dis. 2010, 69, 309–311. [Google Scholar] [CrossRef] [PubMed]
- Marquez, A.; Varade, J.; Robledo, G.; Martinez, A.; Mendoza, J.L.; Taxonera, C.; Fernandez-Arquero, M.; Diaz-Rubio, M.; Gomez-Garcia, M.; Lopez-Nevot, M.A.; et al. Specific association of a CLEC16A/KIAA0350 polymorphism with NOD2/CARD15(−) crohn’s disease patients. Eur. J. Hum. Genet. 2009, 17, 1304–1308. [Google Scholar] [CrossRef] [PubMed]
- Yang, W.; Tang, H.; Zhang, Y.; Tang, X.; Zhang, J.; Sun, L.; Yang, J.; Cui, Y.; Zhang, L.; Hirankarn, N.; et al. Meta-analysis followed by replication identifies loci in or near CDKN1B, TET3, CD80, DRAM1, and ARID5B as associated with systemic lupus erythematosus in asians. Am. J. Hum. Genet. 2013, 92, 41–51. [Google Scholar] [CrossRef] [PubMed]
- Sancho, D.; Reis e Sousa, C. Signaling by myeloid C-type lectin receptors in immunity and homeostasis. Annu. Rev. Immunol. 2012, 30, 491–529. [Google Scholar] [CrossRef] [PubMed]
- Dambuza, I.M.; Brown, G.D. C-type lectins in immunity: Recent developments. Curr. Opin. Immunol. 2015, 32, 21–27. [Google Scholar] [CrossRef] [PubMed]
- Monrad, S.U.; Rea, K.; Thacker, S.; Kaplan, M.J. Myeloid dendritic cells display downregulation of C-type lectin receptors and aberrant lectin uptake in systemic lupus erythematosus. Arthritis. Res. Ther. 2008, 10, R114. [Google Scholar] [CrossRef] [PubMed]
- Monticielo, O.A.; Mucenic, T.; Xavier, R.M.; Brenol, J.C.; Chies, J.A. The role of mannose-binding lectin in systemic lupus erythematosus. Clin. Rheumatol. 2008, 27, 413–419. [Google Scholar] [CrossRef] [PubMed]
- Salazar-Aldrete, C.; Galan-Diez, M.; Fernandez-Ruiz, E.; Nino-Moreno, P.; Estrada-Capetillo, L.; Abud-Mendoza, C.; Layseca-Espinosa, E.; Baranda, L.; Gonzalez-Amaro, R. Expression and function of dectin-1 is defective in monocytes from patients with systemic lupus erythematosus and rheumatoid arthritis. J. Clin. Immunol. 2013, 33, 368–377. [Google Scholar] [CrossRef] [PubMed]
- Ip, W.K.; Chan, S.Y.; Lau, C.S.; Lau, Y.L. Association of systemic lupus erythematosus with promoter polymorphisms of the mannose-binding lectin gene. Arthritis. Rheum. 1998, 41, 1663–1668. [Google Scholar] [PubMed]
- Kim, S.; Wairkar, Y.P.; Daniels, R.W.; DiAntonio, A. The novel endosomal membrane protein Ema interacts with the class C Vps–HOPS complex to promote endosomal maturation. J. Cell Biol. 2010, 188, 717–734. [Google Scholar] [CrossRef] [PubMed]
- Kim, S.; Naylor, S.A.; DiAntonio, A. Drosophila Golgi membrane protein Ema promotes autophagosomal growth and function. Proc. Natl. Acad. Sci. USA 2012, 109, E1072–E1081. [Google Scholar] [CrossRef] [PubMed]
- Soleimanpour, S.A.; Gupta, A.; Bakay, M.; Ferrari, A.M.; Groff, D.N.; Fadista, J.; Spruce, L.A.; Kushner, J.A.; Groop, L.; Seeholzer, S.H.; et al. The diabetes susceptibility gene CLEC16A regulates mitophagy. Cell 2014, 157, 1577–1590. [Google Scholar] [CrossRef] [PubMed]
- Schuster, C.; Gerold, K.D.; Schober, K.; Probst, L.; Boerner, K.; Kim, M.J.; Ruckdeschel, A.; Serwold, T.; Kissler, S. The autoimmunity-associated gene clec16a modulates thymic epithelial cell autophagy and alters T cell selection. Immunity 2015, 42, 942–952. [Google Scholar] [CrossRef] [PubMed]
- Ibanez, D.; Urowitz, M.B.; Gladman, D.D. Summarizing disease features over time: I. Adjusted mean sledai derivation and application to an index of disease activity in lupus. J. Rheumatol. 2003, 30, 1977–1982. [Google Scholar] [PubMed]
- Wu, C.; Orozco, C.; Boyer, J.; Leglise, M.; Goodale, J.; Batalov, S.; Hodge, C.L.; Haase, J.; Janes, J.; Huss, J.W., III; et al. Biogps: An extensible and customizable portal for querying and organizing gene annotation resources. Genome Biol. 2009, 10, R130. [Google Scholar] [CrossRef] [PubMed]
- Berge, T.; Leikfoss, I.S.; Harbo, H.F. From identification to characterization of the multiple sclerosis susceptibility gene CLEC16A. Int. J. Mol. Sci. 2013, 14, 4476–4497. [Google Scholar] [CrossRef] [PubMed]
- Wu, X.; Li, J.; Chen, C.; Yan, Y.; Jiang, S.; Shao, B.; Xu, J.; Kang, L.; Huang, Y.; Zhu, L.; et al. Involvement of CLEC16A in activation of astrocytes after LPS treated. Neurochem. Res. 2012, 37, 5–14. [Google Scholar] [CrossRef] [PubMed]
- Mero, I.L.; Ban, M.; Lorentzen, A.R.; Smestad, C.; Celius, E.G.; Saether, H.; Saeedi, H.; Viken, M.K.; Skinningsrud, B.; Undlien, D.E.; et al. Exploring the CLEC16A gene reveals a MS-associated variant with correlation to the relative expression of CLEC16A isoforms in thymus. Genes Immun. 2011, 12, 191–198. [Google Scholar] [CrossRef] [PubMed]
- Leikfoss, I.S.; Mero, I.L.; Dahle, M.K.; Lie, B.A.; Harbo, H.F.; Spurkland, A.; Berge, T. Multiple sclerosis-associated single-nucleotide polymorphisms in CLEC16A correlate with reduced SOCS1 and DEXI expression in the thymus. Genes Immun. 2013, 14, 62–66. [Google Scholar] [CrossRef] [PubMed]
- Van Luijn, M.M.; Kreft, K.L.; Jongsma, M.L.; Mes, S.W.; Wierenga-Wolf, A.F.; van Meurs, M.; Melief, M.J.; der Kant, R.V.; Janssen, L.; Janssen, H.; et al. Multiple sclerosis-associated CLEC16A controls HLA class II expression via late endosome biogenesis. Brain J. Neurol. 2015, 138, 1531–1547. [Google Scholar] [CrossRef] [PubMed]
- Kim, S.; DiAntonio, A. A role for the membrane golgi protein ema in autophagy. Autophagy 2012, 8, 1269–1270. [Google Scholar] [CrossRef] [PubMed]
- Zouk, H.; D'Hennezel, E.; Du, X.; Ounissi-Benkalha, H.; Piccirillo, C.A.; Polychronakos, C. Functional evaluation of the role of C-type lectin domain family 16a at the chromosome 16p13 locus. Clin. Exp. Immunol. 2014, 175, 485–497. [Google Scholar] [CrossRef] [PubMed]
- Gros, F.; Arnold, J.; Page, N.; Decossas, M.; Korganow, A.S.; Martin, T.; Muller, S. Macroautophagy is deregulated in murine and human lupus T lymphocytes. Autophagy 2012, 8, 1113–1123. [Google Scholar] [CrossRef] [PubMed]
- Takahashi, R.; Tsutsumi, A.; Ohtani, K.; Muraki, Y.; Goto, D.; Matsumoto, I.; Wakamiya, N.; Sumida, T. Association of mannose binding lectin (MBL) gene polymorphism and serum MBL concentration with characteristics and progression of systemic lupus erythematosus. Ann. Rheum. Dis. 2005, 64, 311–314. [Google Scholar] [CrossRef] [PubMed]
© 2015 by the authors; licensee MDPI, Basel, Switzerland. This article is an open access article distributed under the terms and conditions of the Creative Commons Attribution license (http://creativecommons.org/licenses/by/4.0/).
Share and Cite
Tam, R.C.Y.; Lee, A.L.H.; Yang, W.; Lau, C.S.; Chan, V.S.F. Systemic Lupus Erythematosus Patients Exhibit Reduced Expression of CLEC16A Isoforms in Peripheral Leukocytes. Int. J. Mol. Sci. 2015, 16, 14428-14440. https://0-doi-org.brum.beds.ac.uk/10.3390/ijms160714428
Tam RCY, Lee ALH, Yang W, Lau CS, Chan VSF. Systemic Lupus Erythematosus Patients Exhibit Reduced Expression of CLEC16A Isoforms in Peripheral Leukocytes. International Journal of Molecular Sciences. 2015; 16(7):14428-14440. https://0-doi-org.brum.beds.ac.uk/10.3390/ijms160714428
Chicago/Turabian StyleTam, Rachel C. Y., Alfred L. H. Lee, Wanling Yang, Chak Sing Lau, and Vera S. F. Chan. 2015. "Systemic Lupus Erythematosus Patients Exhibit Reduced Expression of CLEC16A Isoforms in Peripheral Leukocytes" International Journal of Molecular Sciences 16, no. 7: 14428-14440. https://0-doi-org.brum.beds.ac.uk/10.3390/ijms160714428