Article

Characterization of QTLs for Seedling Resistance to Tan Spot and Septoria Nodorum Blotch in the PBW343/Kenya Nyangumi Wheat Recombinant Inbred Lines Population

1
International Maize and Wheat Improvement Center (CIMMYT), Apdo. Postal 6-641, México 06600, D.F., Mexico
2
State Key Laboratory of Crop Biology, Cooperation Innovation Center of Efficient Production with High Annual Yield of Wheat and Corn, Shandong Agricultural University, Taian 271018, China
*
Author to whom correspondence should be addressed.
Int. J. Mol. Sci. 2019, 20(21), 5432; https://0-doi-org.brum.beds.ac.uk/10.3390/ijms20215432
Submission received: 25 September 2019 / Revised: 25 October 2019 / Accepted: 28 October 2019 / Published: 31 October 2019
(This article belongs to the Special Issue Mapping Plant Genes that Confer Resistance to Biotic Stress)

Abstract

:
Tan spot (TS) and Septoria nodorum blotch (SNB) induced by Pyrenophora tritici-repentis and Parastagonospora nodorum, respectively, cause significant yield losses and adversely affect grain quality. The objectives of this study were to decipher the genetics and map the resistance to TS and SNB in the PBW343/Kenya Nyangumi (KN) population comprising 204 F6 recombinant inbred lines (RILs). Disease screening was performed at the seedling stage under greenhouse conditions. TS was induced by P. tritici-repentis isolate MexPtr1 while SNB by P. nodorum isolate MexSN1. Segregation pattern of the RILs indicated that resistance to TS and SNB in this population was quantitative. Diversity Array Technology (DArTs) and simple sequence repeats (SSRs) markers were used to identify the quantitative trait loci (QTL) for the diseases using inclusive composite interval mapping (ICIM). Seven significant additive QTLs for TS resistance explaining 2.98 to 23.32% of the phenotypic variation were identified on chromosomes 1A, 1B, 5B, 7B and 7D. For SNB, five QTLs were found on chromosomes 1A, 5A, and 5B, explaining 5.24 to 20.87% of the phenotypic variation. The TS QTL on 1B chromosome coincided with the pleiotropic adult plant resistance (APR) gene Lr46/Yr29/Pm39. This is the first report of the APR gene Lr46/Yr29/Pm39 contributing to TS resistance.

1. Introduction

Wheat (Triticum aestivum L.) is a cereal grain, originating from the Near East but now being grown all over the globe, occupying the largest land area compared to other commercial food crops, which, however, makes it face multiple biotic and abiotic stresses. The fungal leaf spotting diseases complex comprising tan spot (TS, caused by Pyrenophora tritici-repentis (Died.) Drechs.), Septoria nodorum blotch (SNB, Parastagonospora nodorum (Berk.) Quaedvlieg, Verkley & Crous), Septoria tritici blotch (STB, Zymoseptoria tritici (Desm.) Quaedvlieg & Crous) and spot blotch (SB, Cochliobolus sativus (Ito & Kuribayashi) Drechs. Ex Dastur) cause major damage to wheat production globally. Among these diseases, TS and SNB in recent decades have observed significant increases globally [1]. On average, TS and SNB cause generally 5 to 10% yield losses; however, under conditions favourable for disease development, yield losses of up to 50% have been reported [2,3]. Murray and Brennan [4] reported that in Australia the three most devastating pathogens were P. tritici-repentis, Puccinia striiformis and P. nodorum, with an average annual losses caused by the diseases induced by these pathogen amounting to $212 million, $127 million and $108 million, respectively. Serious yield losses due to TS and SNB occur due to a reduction in the photosynthetic area of leaves resulting in reduced grain fill, lower test weight, kernel shriveling, and lower number of kernel per head [3,5]. TS and SNB also render red or dark smudges and black points to the infected kernels, significantly downgrading wheat quality [5,6].
Isolates of the fungus P. tritici-repentis (Died.) Drechs. [anamorph Drechslera tritici-repentis (Died.) Shoem.] differ in virulence and have been race classified. Susceptibility of wheat to P. tritici-repentis is shown via the development of tan necrosis and/or extensive chlorosis symptoms depending on the race of the pathogen and the susceptibility in the host [5]. Presently, eight races of P. tritici-repentis have been identified worldwide based on their virulence pattern on a set of wheat differential cultivars involving Glenlea, 6B-365, 6B-662 and Salamouni/Erik [7] and on the presence of genes coding for specific host-selective toxins (HSTs) [8]. Race structure in the fungus P. nodorum (Berk.) Quaedvlieg, Verkley & Crous (anamorph Stagonospora nodorum (Berk.) E. Castell. & Germano) is not universally accepted; significant variation in aggressiveness among isolates is observed. P. nodorum produces multiple HSTs that contribute to variation in aggressiveness and for infection to occur, the host must produce the target receptor protein recognized by the toxin [9].
Genetic analysis of wheat-P. tritici-repentis interactions have revealed that host resistance ranges from qualitative [10,11,12,13,14] to quantitative control [15,16,17,18,19,20]. Some studies utilizing quantitative trait loci (QTL) analysis reported resistance to TS as polygenic, but observed that previously reported major genes frequently underline these QTLs [18,20,21]. Isolates of the fungus P. tritici-repentis are known to produce at least three HSTs; Ptr ToxA [22], Ptr ToxB [23] and Ptr ToxC [24] that interact with products of specific host sensitivity genes located on chromosome arm 5BL [10,11], 2BS [25] and 1AS [24], respectively, to cause disease. However, Friesen, et al. [26] observed that insensitivity to HST Ptr ToxA accounted for only a part of the resistance to the fungus and pointed out that Ptr ToxA was a virulence factor instead of a pathogenicity factor. Similar findings were observed by other studies [16,27], indicating that there may be other mechanisms than HSTs involved in disease development including non-toxin factors, host non-specific toxins, and unknown host-specific toxins [7].
For SNB, although several reports have identified a single dominant gene conferring resistance [28,29], there are studies that testified the genetics of adult plant resistance is quantitative [20,30,31,32,33,34]. So far, there have been 15 HSTs found, of which, eight (SnToxA, SnTox1, SnTox2, SnTox3, SnTox4, SnTox5, SnTox6 and SnTox7) were characterized from P. nodorum, which interacted with host genes such as Tsn1, Snn1, Snn2, Snn3, Snn4, Snn5, Snn6 and Snn7 [35,36,37]. In order to understand the inheritance of SNB resistance, genetic mapping and QTL analysis have been researched [9,20,32,38,39]. In the last decade, there were some reports on QTLs for seedling resistance and adult plant resistance [39,40]. The identified QTLs of seedling resistance were located on 1B, 2B, 2D, 3A, 4A, 4B, 5A, 5B, 5D, 6A, and 7A chromosomes [35,41,42]. Among them, some genomic regions contributed to adult plant resistance. For example, the QTL on 5BL at the Tsn1 locus for seedling resistance was in the same marker interval as the QTL for flag leaf resistance [35], similar to those on 2D, 4B and 5A chromosomes [35,40]. Some QTLs for flag leaf resistance have been found to be associated with the host genes, such as on 1B with Snn1, on 2D with Snn2, and on 5B with Tsn1.
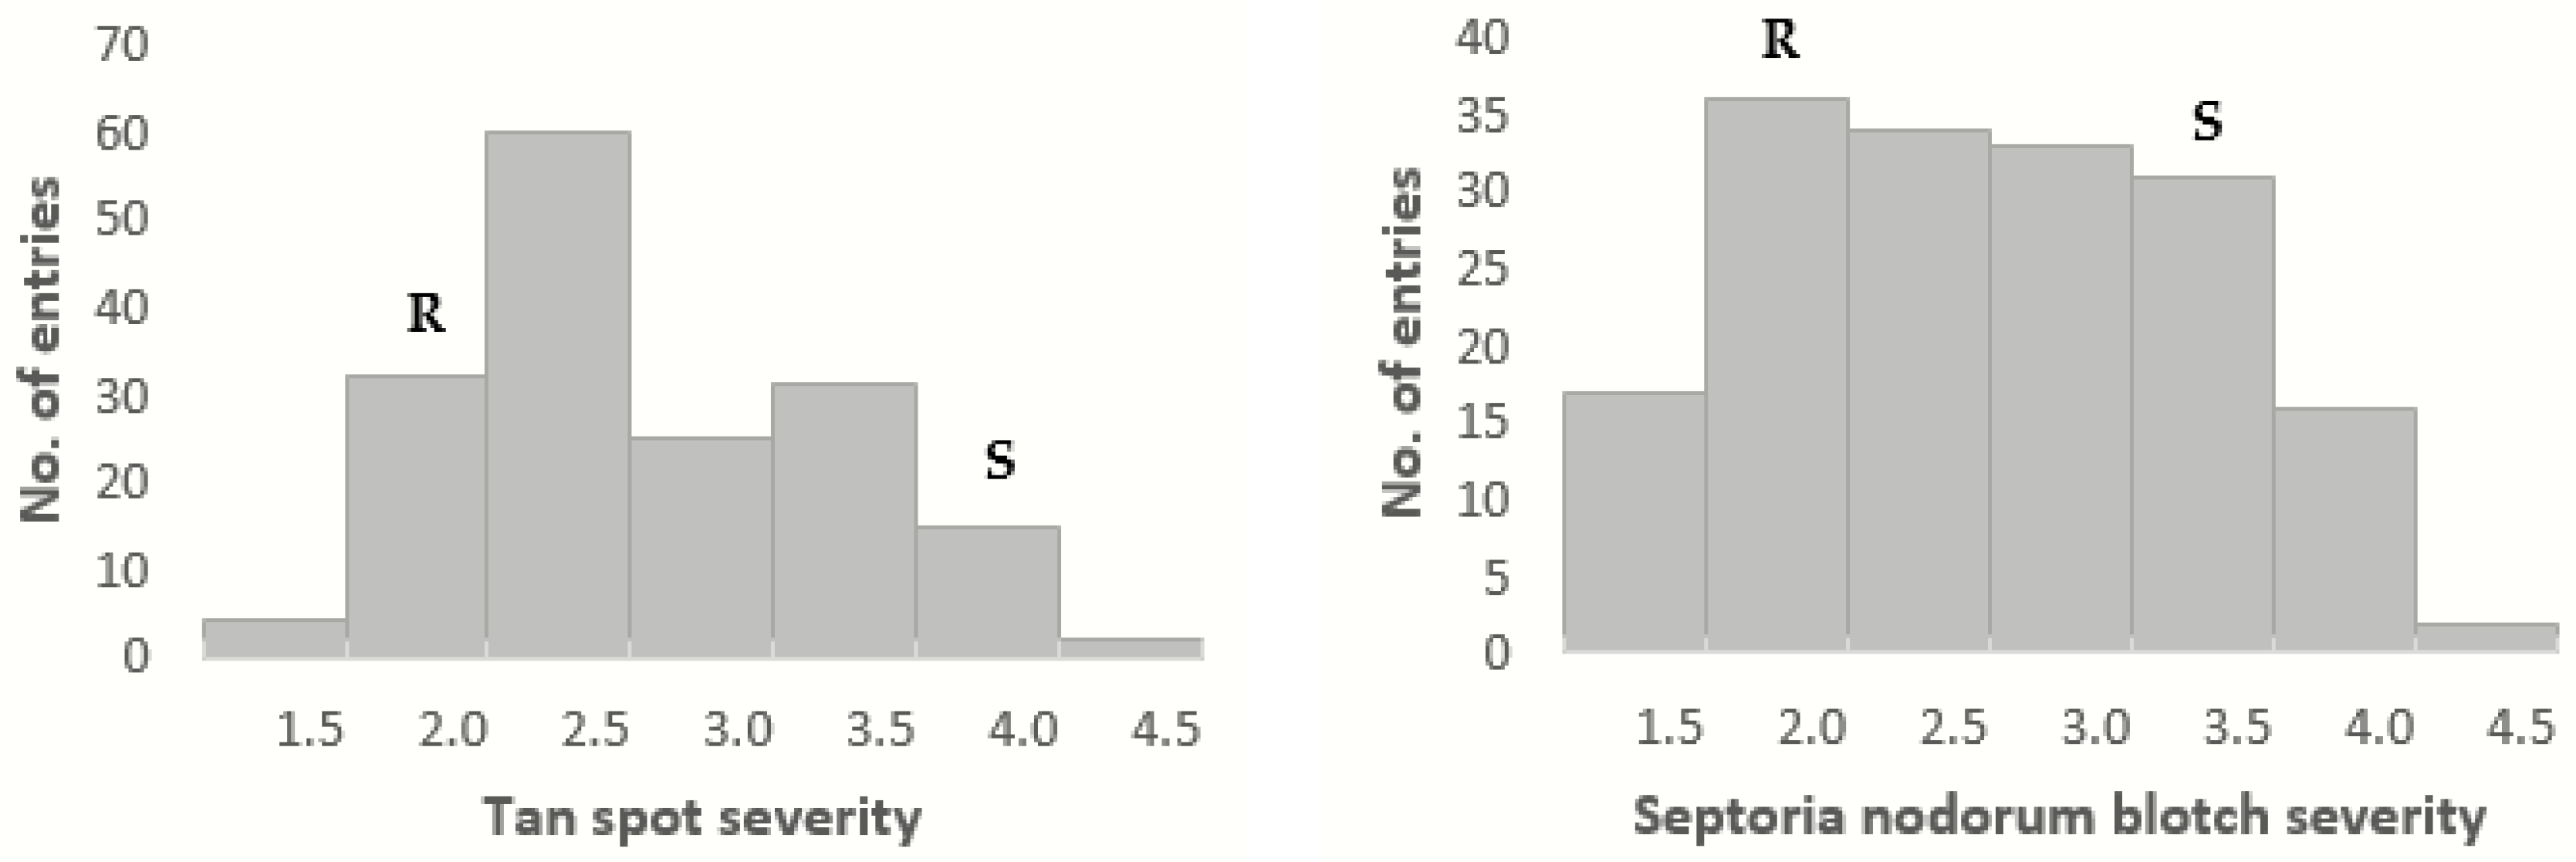
One of the major objectives of the CIMMYT’s wheat breeding program is to develop superior germplasm with durable resistance to multiple diseases including TS and SNB. Identification, characterization and transfer of new resistance genes from different resistant sources are always underway to enhance the level and diversity of resistance. These diverse genetic resources potentially possessing multiple resistance genes are then incorporated into breeding programs to develop durable multiple disease resistant germplasm. The mega variety PBW343 is a high yielding, widely adapted and very popular cultivar in India, which is resistant to TS and SNB but susceptible to stem rust Ug99. Kenya Nyangumi (KN) shows adult plant resistance to Ug99 but is susceptible to TS and SNB. Primarily, the population PBW343/KN was developed to decipher the adult plant resistance to Ug99; however, since this population segregates for TS and SNB as well, this study was initiated to determine and map the resistance to TS and SNB.

2. Results

2.1. Disease Phenotyping

The checks for the experiments gave consistent reaction for inoculation with P. tritici-repentis race 1, with Glenlea being susceptible-necrotic, 6B-365 being susceptible-chlorotic, and Erik and 6B-662 being resistant. The statistics showed a significant (p < 0.01) difference between resistant (Erik and 6B-662) and susceptible (Glenlea and 6B-365) checks and no significant difference between the two experiments (p = 0.63) for TS (Table 1). Almost 70% of the TS variability within the experiment was achieved by the RILs. The broad-sense heritability was observed to be 68.72% (Table 2). The parents of RILs showed contrasting reaction to TS, with the resistant parent PBW343 showing a BLUP (best linear unbiased predictions) value of 1.90 while the susceptible parent KN showed a BLUP value of 3.71 (Figure 1). The RILs showed normal distribution with some transgression observed, indicative of the quantitative nature of disease resistance. The BLUP mean of all the 204 RILs was 2.78 with a range of 1.55 to 4.50.
For SNB, there was also a significant (p < 0.01) difference between resistant (Erik and 6B-662) and susceptible (Glenlea and 6B-365) checks and no significant difference between the two experiments (p = 0.64) (Table 1). The broad-sense heritability was 63.62%. Moreover, the distribution of SNB resistance in this population was similar to that of TS resistance (Figure 1). The mean of this population was 2.52 with a range of 1.41 to 4.13. There was also transgressive distribution for SNB in this population.
The results showed significant variation in TS and SNB resistance among the parental genotypes and the RILs of the PBW343/KN population used in the present study, suggesting its suitability for conducting QTL analysis.

2.2. Molecular Analysis

Of the 1383 markers used for genotyping the RIL population, 475 were polymorphic, including 442 DArT (Diversity arrays technology) makers, 31 SSR (Simple sequence repeat) markers and 2 STS (Sequence-Tagged Sites) markers. Thirty-eight linkage groups were generated and assigned to wheat chromosomes using the available maps with DArT, SSR and STS markers. The linkage map covered 2208 centimorgan (cM) with an average density of one marker per 4.65 cM, which was then used to map QTLs for TS and SNB.

2.3. QTL Analysis

ICIM analysis revealed seven significant additive QTLs for TS resistance, explaining 2.98 to 23.32% of the phenotypic variation. These QTLs were distributed on 1A, 1B, 5B, 7B, and 7D chromosomes (Table 3 and Figure 2). The three major QTLs on 1A, 5B, and 7B with their respective percent variation explained (PVE) of 19.00%, 23.32%, and 11.75% (Table 3) were designated as QTs.cim-1A.2, QTs.cim-5B.2, and QTs.cim-7B, respectively. All the favorable alleles were contributed by PBW343, except for QTs.cim-7B and QTs.cim-1B. Two epistatic QTLs were detected, i.e., QTs.cim-5B.2/QTs.cim-1B.2 and QTs.cim-6A/QTs.cim-1A.2, but the PVEs were very small. These results indicated that the additive effects were more important than the epistatic effects for TS resistance in this population. The QTL on 7D was a new QTL for TS. In addition, the QTL QTs.cim-1B contributed by the susceptible parent KN was located between CSLV46-1B and wPt-1070, a region harboring the pleiotropic gene Lr46/Yr29/Pm39 for wheat rusts and powdery mildew.
Five QTLs for SNB were found on chromosomes 1A, 5A and 5B, explaining 5.24% to 20.87% of phenotypic variation (Table 4 and Figure 2). Of these, three with PVE greater than 10% were designated as QSnb.cim-1A.2, QSnb.cim-5A, and QSnb.cim-5B.2, with the resistance alleles all from PBW343. Of the two minor QTLs, QSnb.cim-1A.1 was contributed by KN and QSnb.cim-5B.1 by PBW343. It should be noted that QSnb.cim-5B.2 was located on the same marker interval as QTs.cim-5B.2, very close to XFCP393 for Tsn1. Despite controlling different diseases, these two QTLs were placed on the same marker interval.

2.4. Interaction among Important QTLs

The RILs with important QTLs and their combinations were identified according to the genotypes of flanking markers. The mean disease severities of RILs with single or combination of QTLs were found to be reduced in the presence of favorable alleles at the corresponding loci (Table 5 and Table 6). For instance, the 84 RILs with PBW343 allele showed 0.79 lower TS severity compared to the 58 with ‘KN’ allele at QTs.cim-5B.2, assessed by the nearest marker XFCP393 (Table 5). The same situation applied to QSnb.cim-5B.2 with an SNB severity reduction of 1.00 (Table 6). In addition, significant difference was also found between lines with and without QTs.cim-1A.2. It was very interesting that lines with any of the three above-mentioned QTLs always showed significantly reduced disease when compared to those without the corresponding QTLs, regardless the presence of other QTLs. Most of the QTL combinations were positively validated. TS resistance QTLs showed highly significant interactions in reducing the TS severity when in combination with QTs.cim-5B.2 on 5BL (Table 5), as did SNB resistance QTLs. The most significant reduction (1.63) of TS disease severity was observed in RILs positive for the combination of QTs.cim-5B.2 and QTs.cim-1A.2, indicating the additive effects of these two QTLs in reducing disease severity. Similarly, severity was reduced from 3.18 to 1.58 with QTs.cim-5B.2, QTs.cim-7B and QTs.cim-1A.2. While for SNB, the combination of three QTLs showed the maximum significant reduction from 3.11 to 1.70, followed by the combination of QSnb.cim-5B.2 and QSnb.cim-5A. The QTLs from chromosome 5BL reduced the TS and SNB by 0.79 and 1, respectively.

3. Discussion

Since its inception, CIMMYT’s primary goal has been to develop superior wheat germplasm incorporating broad-spectrum disease resistance, homogeneity in agronomic traits that impart high yields, superior quality, adaptability and stability. One of the strategies of developing disease resistant germplasm involves breeding for adult plant resistance (APR), which is associated with non-hypersensitive reaction, race-nonspecific resistance, quantitatively inherited and possibly effective against multiple diseases. The focus on APR was based on the fact that stacking multiple genes of small effects leads to high levels of resistance, which is highly durable due to its quantitative resistance nature [43]. Previous reports have indicated that the race-nonspecific resistance genes Lr34 and Lr46 confer broad-spectrum resistance to biotrophic diseases like rusts and powdery mildew and hemi-biotrophic disease like spot blotch [44].
TS and SNB are two major components of the destructive leaf-spotting diseases complex of wheat. Resistant varieties are regarded as the most efficient and effective strategies of disease management, but the information on resistance genes or QTLs is a prerequisite for development of broad genetic based durable resistant cultivars. Additionally, to hasten the process and progress of marker-assisted selection (MAS) it is paramount that new resistance genes are precisely tagged. Many studies on QTL mapping for TS and SNB have been reported [9,19,35,45,46,47], but most of them were aimed at single diseases. The RIL population used in this study was not only characterized for TS and SNB, but also for stem rust [
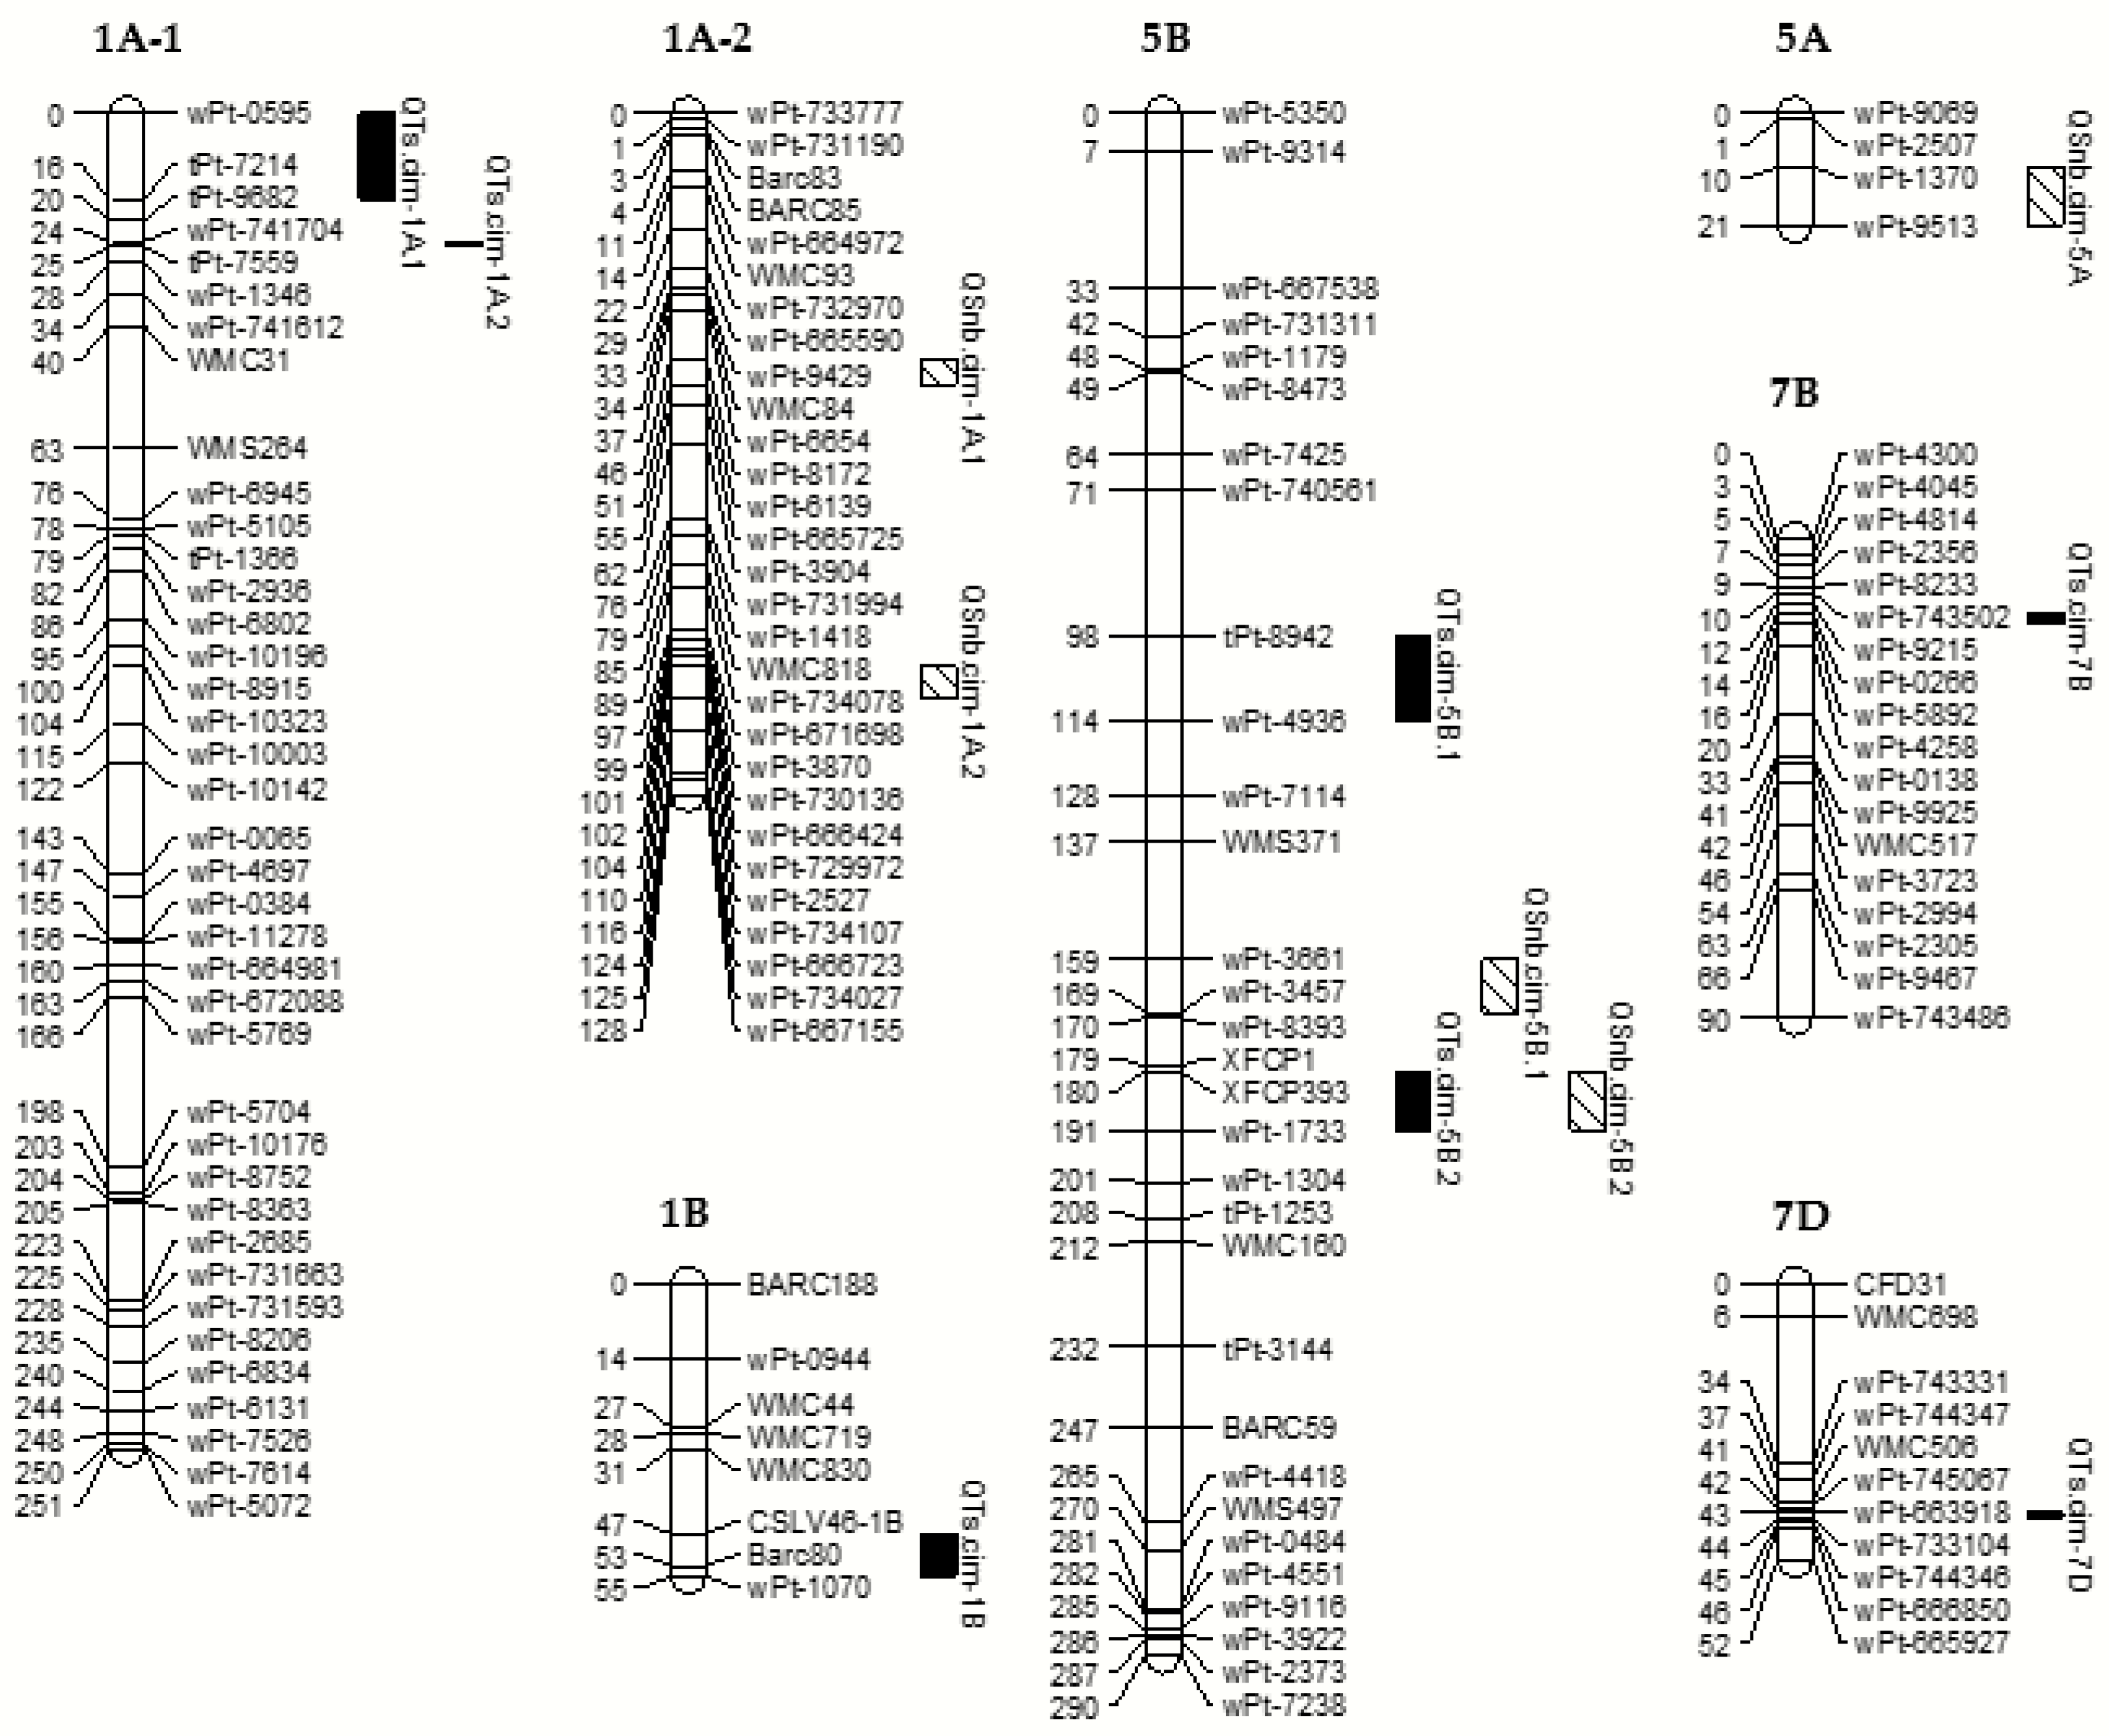
48]. It is interesting to note that some important QTLs found on 5BL were associated with all three diseases, which implied multi-disease resistance QTLs.
In this research, we identified seven TS QTLs, contributed mostly by PBW343, of which QTs.cim-5B.2 on chromosome 5BL showed the biggest phenotypic effects. This QTL was reported in previous research and corresponds to Tsn1 [14,20,46,49]. Cheong et al. [15] and Singh et al. [18] also found QTLs corresponding or close to the location of Tsn1 (Tsr1) with PVE of 39% and 18%, respectively. Molecular markers closely linked to this locus have been identified and are available for MAS [50]. Another major QTL was detected on 1AS, where QTsc.ndsu-1A was initially reported by Faris et al. [27] and validated by Effertz et al. [21,24] to be associated with chlorosis in both adult plants and seedlings. Sun et al. [51] identified QTs.ksu-1AS in this region, whose position coincided with Tsc1, and its effect was attributed to the Tsc1-Ptr ToxC interaction. Faris et al. [46] identified molecular markers linked to Tsc1, of which several STS makers could be useful in MAS. QTLs on 1BS, 7BS and 7DS chromosomes with lower PVE were detected in the current study, some of which might be the same as reported previously. On 1BS, Faris and Friesen [17] identified a race-nonspecific QTL, explaining from 13 to 29% of the phenotypic variation. On 7BS, Faris, et al. [52] identified a race-nonspecific QTL with PVE ranging from 5 to 8%. On 7DS, Faris and Friesen [17] detected a minor QTL, but it was specific for race 3, suggesting that the 7DS QTL found in our study might be a new one.
There were also many reports on QTLs for SNB resistance in both seedling and adult plant. Most of them were located on 1BS, 2AS, 2BS, 2D, 3BS, 4BL, 5AL, 5BL, 5DL, 6AL and 7BL chromosomes [35], of which, the 5BL QTL was the most frequently reported, for which four out of six reports were on seedling resistance. Similarly, two QTLs on 5BL were identified in the present study, with one being a major and the other a minor QTL. The major QTL was close to the Tsn1 locus according to their linked markers. Additionally, a major QTL was found on 5AS, which has not been reported so far and thus may be a new QTL for SNB resistance. Two more possible new QTLs were detected on the 1A chromosome, one of which showed major effects.
In this population, we detected QTLs on 5BL for both TS and SNB resistance, and Singh et al. [48] also found a QTL, QSr.cim-5B for stem rust resistance, in a similar region. These results indicated that the 5BL QTL region could be very important for multi-disease resistance, and further studies are needed to see if it confers resistance to other diseases. PCR-based markers linked to this locus are available for MAS [48]. Another possible multi-disease resistant locus in this population was QTs.cim-1B for TS resistance, which was closely linked to the resistance gene Lr46/Yr29/Pm39 for rusts and powdery mildew, suggesting that Lr46/Yr29/Pm39 might also be able to contribute to TS resistance, but their mechanism of interaction needs to be further studied. Despite this, the functional marker for this locus is available for MAS [53].
The findings of this study suggest that the genomic regions contributing to TS and SNB resistance may also confer resistance to other diseases, such as rusts and powdery mildew resistance [47,54], which perhaps indicates there are some race/pathogen-nonspecific resistance genes. Therefore, utilization of those broad-spectrum resistance genes/QTLs is recommended for breeding superior multi-disease resistant wheat cultivars, whereas the disease-specific QTLs identified in the current study are useful for breeding programs aimed at TS and SNB resistance.

4. Materials and Methods

4.1. Plant Material

A segregating population of 204 F6 RILs was developed at CIMMYT, Mexico, from a cross between cultivars PBW343 and KN. The male parent KN, pedigree TEZANOS-PINTOS-PRECOZ//SELKIRK-ENANO*6/LERMA-ROJO-64/3/AFRICA-MAYO48/4/KENYA-SWARA/KENYA-4500, is from Kenya and the pedigree of the female parent PBW343 is ND/VG9144//KAL/BB/3/YACO/4/VEE#5. The RIL population was used for genetic analysis and mapping of resistance to TS and SNB.

4.2. Experimental Design

The three experiments for TS and SNB reaction were conducted under controlled conditions in a greenhouse, and each experiment comprised two replications arranged in a completely randomized design. Each replication contained a complete set of RILs planted in trays. The experimental unit comprised four plants per RIL, and parents and checks (Erik, Glenlea, 6B-365, and 6B-662) were included in each experiment to verify the inoculation process and the race of the inoculum used.

4.3. Disease Screening

Spore inoculum of P. tritici-repentis was produced using the method of Lamari and Bernier [55] with minor modifications. Briefly, dried mycelial plugs of isolate MexPtr1 (race 1) of 0.5-cm-diameter were placed on 10-cm Petri plates with V8-potato dextrose agar (V8-PDA) (150 mL V8-juice, 10 g PDA, 10 g agar, 3 g CaCO3, and 850 mL distilled water). The plates were incubated in the dark at room temperature (20 to 22 °C) for six days. Subsequently, the plates were flooded with sterile distilled water, and the mycelium was flattened with the bottom of a sterile test tube. Excess water was drained from the dishes, which were then incubated under continuous light at 22–24 °C for one day followed by one day in the dark in an incubator at 16 °C to induce conidiophore and conidia production, respectively. For spore collection, about 25 mL sterile distilled water was added to the plates and a camel-hair brush was used to dislodge conidia. Spore concentration was measured with a haemocytometer and adjusted to 4 × 10⁴ conidia/mL before inoculation.
A spore suspension of P. nodorum isolate MexSN-4 was used as inoculum for SNB experiments using a method modified from Ma and Hughes [28]. The isolate was grown in 10-cm-diameter Petri dishes with V8-agar medium (150 mL V8-juice, 15 g agar, 1.5 g CaCO3, and 850 mL distilled water) at room temperature and under continuous illumination. Fresh cultures of the P. nodorum isolate were made by transferring stock cultures onto the surface of fresh V8-agar medium. Seven days later, pink pycnidia of 0.5–1.0 mm diameter appeared on the surface of V8-agar media, and subsequently a spore suspension was prepared by firstly flooding the plates with sterile distilled water and then gently brushing the medium surface with a camel-hair brush so that the spores were released. The obtained spore suspension was filtered through two layers of cheesecloth to eliminate mycelium. The spore concentration was finally adjusted to 1 × 10⁷ spores/mL prior to inoculation.
The seedlings were grown and maintained in the greenhouse at a temperature of 22/18 °C (day/night) with a photoperiod of 16 h. The seedlings were watered and fertilized as needed. Inoculation took place at the two-leaf stage, when the conidial suspension was sprayed onto seedlings until runoff, with a hand sprayer. After inoculation, the seedlings were kept in a mist chamber for 24 h under continuous misting and then moved back onto benches in the same greenhouse. Disease evaluation was performed at eight days after inoculation, based on a 1 to 5 scale [54,55].

4.4. Molecular Marker Analysis

DNA extraction followed the procedure described by Singh and Bowden [56]. A Nano-Drop ND1000 spectrophotometer (Thermo Fisher Scientific Inc., Waltham, MA, USA) was used for DNA quantification. For DArT genotyping, 500–1000 ng of high quality DNA in 50–100 ng/µL was shipped to Triticarte Pty. Ltd., Canberra, Australia (www.triticarte.com.au) for genome profiling [57,58]. Allele calling was made as present (1) or absent (0), and the overall call rate was approximately 95% and Q values for marker quality were above 80% for most markers. The markers were designated with ‘w’ as the prefix if the clone was from wheat; ‘t’ if it was from triticale and ‘r’ if it was from rye libraries.

4.5. Linkage Mapping and QTL Analysis

ICIMapping software was used in the current study for constructing linkage maps with the default parameter settings [59], and a total of 1383 markers including 1350 DArT markers, 31 SSR markers and 2 STS markers were used for linkage mapping in the MAP functionality of the software. QTL mapping was performed with the same software using the ICIM algorithm in the BIP functionality [59]. An LOD score of 2.5 was chosen as a threshold for declaring significant QTL.

4.6. Statistical Analysis

Analysis of variance for lesion type disease score in the experiments was performed using Genstat 15th edition (Hempstead, UK). The best linear unbiased predictors (BLUPs) are appropriate for estimation of test line effects as this method has a minimum mean squared error property [60]. A linear mixed model was fitted to the TS and SNB variables to estimate the BLUPs for each of the RILs and parents. Checks were assumed to be fixed effects. The broad-sense heritability was defined as H2 = σ g 2 / σ p 2 , where σ g 2 is the genotypic variance and σ p 2 is the phenotypic variance.

Author Contributions

P.K.S. and S.S. designed the research; R.P.S. provided plant materials; P.K.S., Z.D. and X.H. conducted the greenhouse experiments; S.S. contributed to the genotyping work; Z.D., X.H. and Z.K. analyzed the data, and all authors contributed in writing the paper.

Funding

The authors gratefully acknowledge the financial support for this project from The Bill and Melinda Gates Foundation, USA, through the Durable Rust Resistance Wheat project and Seeds of Discovery, through the MasAgro project, Mexico.

Conflicts of Interest

The authors declare no conflict of interest.

References

  1. Savary, S.; Willocquet, L.; Pethybridge, S.J.; Esker, P.; McRoberts, N.; Nelson, A. The global burden of pathogens and pests on major food crops. Nat. Ecol. Evol. 2019, 3, 430–439. [Google Scholar] [CrossRef] [PubMed]
  2. Rees, R.; Platz, G.; Mayer, R. Susceptibility of Australian wheats to Pyrenophora tritici-repentis. Crop Pasture Sci. 1988, 39, 141–151. [Google Scholar] [CrossRef]
  3. Shabeer, A.; Bockus, W. Tan spot effects on yield and yield components relative to growth stage in winter wheat. Plant Dis. 1988, 72, 599–602. [Google Scholar] [CrossRef]
  4. Murray, G.; Brennan, J. Estimating disease losses to the Australian wheat industry. Australas. Plant Pathol. 2009, 38, 558–570. [Google Scholar] [CrossRef]
  5. De Wolf, E.D.; Effertz, R.J.; Ali, S.; Francl, L.J. Vistas of tan spot research. Can. J. Plant Pathol. 1998, 20, 349–370. [Google Scholar] [CrossRef]
  6. Fernandez, M.R.; DePauw, R.M.; Clarke, J.M.; Fox, S.L. Discoloration of wheat kernels by Pyrenophora tritici-repentis. Can. J. Plant Pathol. 1998, 20, 380–383. [Google Scholar] [CrossRef]
  7. Singh, P.K.; Singh, R.P.; Duveiller, E.; Mergoum, M.; Adhikari, T.B.; Elias, E.M. Genetics of wheat–Pyrenophora tritici-repentis interactions. Euphytica 2010, 171, 1–13. [Google Scholar] [CrossRef]
  8. Andrie, R.M.; Pandelova, I.; Ciuffetti, L.M. A combination of phenotypic and genotypic characterization strengthens Pyrenophora tritici-repentis race identification. Phytopathology 2007, 97, 694–701. [Google Scholar] [CrossRef]
  9. Ruud, A.K.; Windju, S.; Belova, T.; Friesen, T.L.; Lillemo, M. Mapping of SnTox3–Snn3 as a major determinant of field susceptibility to Septoria nodorum leaf blotch in the SHA3/CBRD × Naxos population. Theor. Appl. Genet. 2017, 130, 1361–1374. [Google Scholar] [CrossRef]
  10. Faris, J.D.; Anderson, J.A.; Francl, L.J.; Jordahl, J.G. Chromosomal location of a gene conditioning insensitivity in wheat to a necrosis-inducing culture filtrate from Pyrenophora tritici-repentis. Phytopathology 1996, 86, 459–463. [Google Scholar] [CrossRef]
  11. Anderson, J.A.; Effertz, R.J.; Faris, J.D.; Franel, L.J.; Meinhardt, S.W.; Gill, B.S. Genetic analysis of sensitivity to a Pyrenophora tritici-repentis necrosis-inducing toxin in durum and common wheat. Phytopathology 1999, 89, 293–297. [Google Scholar] [CrossRef] [PubMed]
  12. Singh, P.K.; Hughes, G.R. Inheritance of resistance to the chlorosis component of tan spot of wheat caused by Pyrenophora tritici-repentis, races 1 and 3. Euphytica 2006, 152, 413–420. [Google Scholar] [CrossRef]
  13. Tadesse, W.; Schmolke, M.; Hsam, S.L.K.; Mohler, V.; Wenzel, G.; Zeller, F.J. Molecular mapping of resistance genes to tan spot [Pyrenophora tritici-repentis race 1] in synthetic wheat lines. Theor. Appl. Genet. 2007, 114, 855–862. [Google Scholar] [CrossRef] [PubMed]
  14. Singh, P.K.; Mergoum, M.; Ali, S.; Adhikari, T.B.; Hughes, G.R. Genetic analysis of resistance to Pyrenophora tritici-repentis races 1 and 5 in tetraploid and hexaploid wheat. Phytopathology 2008, 98, 702–708. [Google Scholar] [CrossRef] [PubMed]
  15. Cheong, J.; Wallwork, H.; Williams, K.J. Identification of a major QTL for yellow leaf spot resistance in the wheat varieties Brookton and Cranbrook. Aust. J. Agric. Res. 2004, 55, 315–319. [Google Scholar] [CrossRef]
  16. Friesen, T.L.; Faris, J.D. Molecular mapping of resistance to Pyrenophora tritici-repentis race 5 and sensitivity to Ptr ToxB in wheat. Theor. Appl. Genet. 2004, 109, 464–471. [Google Scholar] [CrossRef] [PubMed]
  17. Faris, J.D.; Friesen, T.L. Identification of quantitative trait loci for race-nonspecific resistance to tan spot in wheat. Theor. Appl. Genet. 2005, 111, 386–392. [Google Scholar] [CrossRef]
  18. Singh, S.; Bockus, W.W.; Sharma, I.; Bowden, R.L. A novel source of resistance in wheat to Pyrenophora tritici-repentis race 1. Plant Dis. 2008, 92, 91–95. [Google Scholar] [CrossRef]
  19. Juliana, P.; Singh, R.P.; Singh, P.K.; Poland, J.A.; Bergstrom, G.C.; Huerta-Espino, J.; Bhavani, S.; Crossa, J.; Sorrells, M.E. Genome-wide association mapping for resistance to leaf rust, stripe rust and tan spot in wheat reveals potential candidate genes. Theor. Appl. Genet. 2018. [Google Scholar] [CrossRef]
  20. Hu, W.; He, X.; Dreisigacker, S.; Sansaloni, C.P.; Juliana, P.; Singh, P.K. A wheat chromosome 5AL region confers seedling resistance to both tan spot and Septoria nodorum blotch in two mapping populations. Crop J. 2019, in press. [Google Scholar] [CrossRef]
  21. Effertz, R.J.; Anderson, J.A.; Francl, L.J. Restriction fragment length polymorphism mapping of resistance to two races of Pyrenophora tritici-repentis in adult and seedling wheat. Phytopathology 2001, 91, 572–578. [Google Scholar] [CrossRef] [PubMed]
  22. Ciuffetti, L.M.; Tuori, R.P.; Gaventa, J.M. A single gene encodes a selective toxin causal to the development of tan spot of wheat. Plant Cell 1997, 9, 135–144. [Google Scholar] [PubMed]
  23. Orolaza, N.P.; Lamari, L.; Ballance, G.M. Evidence of a host-specific chlorosis toxin from Pyrenophora tritici-repentis, the causal agent of tan spot of wheat. Phytopathology 1995, 85, 1282–1287. [Google Scholar] [CrossRef]
  24. Effertz, R.J.; Meinhardt, S.W.; Anderson, J.A.; Jordahl, J.G.; Francl, L.J. Identification of a chlorosis-inducing toxin from Pyrenophora tritici-repentis and the chromosomal location of an insensitivity locus in wheat. Phytopathology 2002, 92, 527–533. [Google Scholar] [CrossRef] [PubMed]
  25. Singh, P.K.; Mergoum, M.; Adhikari, T.B.; Shah, T.; Ghavami, F.; Kianian, S.F. Genetic and molecular analysis of wheat tan spot resistance effective against Pyrenophora tritici-repentis races 2 and 5. Mol. Breed. 2010, 25, 369–379. [Google Scholar] [CrossRef]
  26. Friesen, T.L.; Ali, S.; Kianian, S.; Francl, L.J.; Rasmussen, J.B. Role of host sensitivity to Ptr ToxA in development of tan spot of wheat. Phytopathology 2003, 93, 397–401. [Google Scholar] [CrossRef]
  27. Faris, J.D.; Anderson, J.A.; Francl, L.J.; Jordahl, J.G. RFLP mapping of resistance to chlorosis induction by Pyrenophora tritici-repentis in wheat. Theor. Appl. Genet. 1997, 94, 98–103. [Google Scholar] [CrossRef]
  28. Ma, H.; Hughes, G.R. Genetic control and chromosomal location of Triticum timopheevii-derived resistance to septoria nodorum blotch in durum wheat. Genome 1995, 38, 332–338. [Google Scholar] [CrossRef]
  29. Murphy, N.E.A.; Loughman, R.; Wilson, R.; Lagudah, E.S.; Appels, R.; Jones, M.G.K. Resistance to septoria nodorum blotch in the Aegilops tauschii accession RL5271 is controlled by a single gene. Euphytica 2000, 113, 227–233. [Google Scholar] [CrossRef]
  30. Nelson, L.; Gates, C. Genetics of host plant resistance of wheat to Septoria nodorum. Crop Sci. 1982, 22, 771–773. [Google Scholar] [CrossRef]
  31. Fried, P.; Meister, E. Inheritance of leaf and head resistance of winter wheat to Septoria nodorum in a diallel cross. Phytopathology 1987, 77, 1371–1375. [Google Scholar] [CrossRef]
  32. Bostwick, D.E.; Ohm, H.W.; Shaner, G. Inheritance of Septoria glume blotch resistance in wheat. Crop Sci. 1993, 33, 439–443. [Google Scholar] [CrossRef]
  33. Wicki, W.; Winzeler, M.; Schmid, J.E.; Stamp, P.; Messmer, M. Inheritance of resistance to leaf and glume blotch caused by Septoria nodorum Berk. in winter wheat. Theor. Appl. Genet. 1999, 99, 1265–1272. [Google Scholar] [CrossRef]
  34. Ruud, A.K.; Dieseth, J.A.; Lillemo, M. Effects of three necrotrophic effectors on spring wheat under Norwegian field conditions. Crop Sci. 2017. [Google Scholar] [CrossRef]
  35. Francki, M.G. Improving Stagonospora nodorum resistance in wheat: A review. Crop Sci. 2013, 53, 355–365. [Google Scholar] [CrossRef]
  36. Friesen, T.L.; Chu, C.; Xu, S.S.; Faris, J.D. SnTox5-Snn5: A novel Stagonospora nodorum effector-wheat gene interaction and its relationship with the SnToxA-Tsn1 and SnTox3-Snn3-B1 interactions. Mol. Plant Pathol. 2012, 13, 1101–1109. [Google Scholar] [CrossRef]
  37. Shi, G.; Friesen, T.L.; Saini, J.; Xu, S.S.; Rasmussen, J.B.; Faris, J.D. The wheat snn7 gene confers susceptibility on recognition of the Parastagonospora nodorum necrotrophic effector SnTox7. Plant Genome 2015, 8. [Google Scholar] [CrossRef]
  38. Liu, Z.H.; Friesen, T.L.; Rasmussen, J.B.; Ali, S.; Meinhardt, S.W.; Faris, J.D. Quantitative trait loci analysis and mapping of seedling resistance to Stagonospora nodorum leaf blotch in wheat. Phytopathology 2004, 94, 1061–1067. [Google Scholar] [CrossRef]
  39. Singh, P.K.; Mergoum, M.; Adhikari, T.B.; Kianian, S.F.; Elias, E.M. Chromosomal location of genes for seedling resistance to tan spot and Stagonospora nodorum blotch in tetraploid wheat. Euphytica 2007, 155, 27–34. [Google Scholar] [CrossRef]
  40. Shankar, M.; Walker, E.; Golzar, H.; Loughman, R.; Wilson, R.E.; Francki, M.G. Quantitative trait loci for seedling and adult plant resistance to Stagonospora nodorum in wheat. Phytopathology 2008, 98, 886–893. [Google Scholar] [CrossRef]
  41. Adhikari, T.B.; Jackson, E.W.; Gurung, S.; Hansen, J.M.; Bonman, J.M. Association mapping of quantitative resistance to Phaeosphaeria nodorum in spring wheat landraces from the USDA National Small Grains Collection. Phytopathology 2011, 101, 1301–1310. [Google Scholar] [CrossRef] [PubMed]
  42. Phan, H.T.T.; Rybak, K.; Bertazzoni, S.; Furuki, E.; Dinglasan, E.; Hickey, L.T.; Oliver, R.P.; Tan, K.C. Novel sources of resistance to Septoria nodorum blotch in the Vavilov wheat collection identified by genome-wide association studies. Theor. Appl. Genet. 2018, 131, 1223–1238. [Google Scholar] [CrossRef] [PubMed] [Green Version]
  43. Parlevliet, J.E. Durability of resistance against fungal, bacterial and viral pathogens; present situation. Euphytica 2002, 124, 147–156. [Google Scholar] [CrossRef]
  44. Lillemo, M.; Joshi, A.K.; Prasad, R.; Chand, R.; Singh, R.P. QTL for spot blotch resistance in bread wheat line Saar co-locate to the biotrophic disease resistance loci Lr34 and Lr46. Theor. Appl. Genet. 2013, 126, 711–719. [Google Scholar] [CrossRef]
  45. Singh, P.K.; Duveiller, E.; Singh, R.P. Resistance breeding for tan spot (Pyrenophora tritici-repentis) of wheat. In Disease Resistance in Wheat; Sharma, I., Ed.; CABI: Wallingford, UK, 2012; pp. 136–150. [Google Scholar]
  46. Faris, J.D.; Liu, Z.; Xu, S.S. Genetics of tan spot resistance in wheat. Theor. Appl. Genet. 2013, 126, 2197–2217. [Google Scholar] [CrossRef]
  47. Singh, P.K.; Crossa, J.; Duveiller, E.; Singh, R.P.; Djurle, A. Association mapping for resistance to tan spot induced by Pyrenophora tritici-repentis race 1 in CIMMYTs historical bread wheat set. Euphytica 2016, 207, 515–525. [Google Scholar] [CrossRef]
  48. Singh, S.; Singh, R.P.; Bhavani, S.; Huerta-Espino, J.; Eugenio, L.-V.E. QTL mapping of slow-rusting, adult plant resistance to race Ug99 of stem rust fungus in PBW343/Muu RIL population. Theor. Appl. Genet. 2013, 126, 1367–1375. [Google Scholar] [CrossRef]
  49. Chu, C.G.; Friesen, T.L.; Xu, S.S.; Faris, J.D. Identification of novel tan spot resistance loci beyond the known host-selective toxin insensitivity genes in wheat. Theor. Appl. Genet. 2008, 117, 873–881. [Google Scholar] [CrossRef]
  50. Lu, H.J.; Fellers, J.P.; Friesen, T.L.; Meinhardt, S.W.; Faris, J.D. Genomic analysis and marker development for the Tsn1 locus in wheat using bin-mapped ESTs and flanking BAC contigs. Theor. Appl. Genet. 2006, 112, 1132–1142. [Google Scholar] [CrossRef]
  51. Sun, X.C.; Bockus, W.; Bai, G. Quantitative trait loci for resistance to Pyrenophora tritici-repentis race 1 in a Chinese wheat. Phytopathology 2010, 100, 468–473. [Google Scholar] [CrossRef]
  52. Faris, J.D.; Abeysekara, N.S.; McClean, P.E.; Xu, S.S.; Friesen, T.L. Tan spot susceptibility governed by the Tsn1 locus and race-nonspecific resistance quantitative trait loci in a population derived from the wheat lines Salamouni and Katepwa. Mol. Breed. 2012, 30, 1669–1678. [Google Scholar] [CrossRef]
  53. Lagudah, E.S.; Krattinger, S.G.; Herrera-Foessel, S.; Singh, R.P.; Huerta-Espino, J.; Spielmeyer, W.; Brown-Guedira, G.; Selter, L.L.; Keller, B. Gene-specific markers for the wheat gene Lr34/Yr18/Pm38 which confers resistance to multiple fungal pathogens. Theor. Appl. Genet. 2009, 119, 889–898. [Google Scholar] [CrossRef] [PubMed]
  54. Crossa, J.; Burgueno, J.; Dreisigacker, S.; Vargas, M.; Herrera-Foessel, S.A.; Lillemo, M.; Singh, R.P.; Trethowan, R.; Warburton, M.; Franco, J.; et al. Association analysis of historical bread wheat germplasm using additive genetic covariance of relatives and population structure. Genetics 2007, 177, 1889–1913. [Google Scholar] [CrossRef] [PubMed]
  55. Lamari, L.; Bernier, C.C. Evaluation of wheat lines and cultivars to tan spot (Pyrenophora tritici-repentis) based on lesion type. Can. J. Plant Pathol. 1989, 11, 49–56. [Google Scholar] [CrossRef]
  56. Singh, S.; Bowden, R.L. Molecular mapping of adult-plant race-specific leaf rust resistance gene Lr12 in bread wheat. Mol. Breed. 2011, 28, 137–142. [Google Scholar] [CrossRef]
  57. Wenzl, P.; Li, H.; Carling, J.; Zhou, M.; Raman, H.; Paul, E.; Hearnden, P.; Maier, C.; Xia, L.; Caig, V.; et al. A high-density consensus map of barley linking DArT markers to SSR, RFLP and STS loci and agricultural traits. BMC Genom. 2006, 7, 206. [Google Scholar] [CrossRef]
  58. Neumann, K.; Kobiljski, B.; Denčić, S.; Varshney, R.; Börner, A. Genome-wide association mapping: A case study in bread wheat (Triticum aestivum L.). Mol. Breed. 2011, 27, 37–58. [Google Scholar] [CrossRef]
  59. Li, H.; Ribaut, J.-M.; Li, Z.; Wang, J. Inclusive composite interval mapping (ICIM) for digenic epistasis of quantitative traits in biparental populations. Theor. Appl. Genet. 2008, 116, 243–260. [Google Scholar] [CrossRef]
  60. Smith, A.; Cullis, B.R.; Thompson, R. The analysis of crop cultivar breeding and evaluation trials: An overview of current mixed model approaches. J. Agric. Sci. 2005, 143, 449–462. [Google Scholar] [CrossRef]
Figure 1. Histogram of best linear unbiased predictions (BLUPs) of 204 recombinant inbred lines (RILs) derived from the cross PBW343 (R-Parent)/KN (S-Parent) after inoculation with P. tritici-repentis isolate MexPtr1 and P. nodorum isolate MexSN4.
Ijms 20 05432 g001
Figure 2. Linkage groups with significant QTLs for seedling resistance to tan spot and Septoria nodorum blotch in the PBW343/KN population. Refer to Table 3 and Table 4 for the naming of the linkage groups.
Ijms 20 05432 g002
Table 1. Analysis of variation for fixed effects in TS and SNB experiments of the PBW343/Kenya Nyangumi population.
ExperimentSourceDegree of FreedomF Statisticp Values
TSCheck3107.14<0.001
Exp10.530.634
SNBCheck473.59<0.001
Exp20.520.642
Table 2. Variance components of TS and SNB in 204 RILs of the PBW343/Kenya Nyangumi population.
ExperimentSourceVariance Component% Total VarianceStandard Error
TSRILs0.39068.7200.042
Exp.Rep0.0010.1230.001
RIL.Exp.Rep0.0569.8570.030
Residuals0.12121.2990.029
Total0.568100
SNBRILs0.473763.6180.0514
Exp.Rep0.00350.470.0039
RIL.Exp.Rep0.134418.050.0335
Residuals0.13317.8620.0314
Total0.7446100
Table 3. QTLs for TS resistance in the population of PBW343 (−)/Kenya Nyangumi (+).
QTLChr.Pos. aFlanking MarkersLODPVE (%) bAdd c
LeftRight
QTs.cim-5B.15B112wPt-8942wPt-49364.332.98−0.11
QTs.cim-5B.25B180XFCP393wPt-173317.7323.32−0.213
QTs.cim-7B7B14wPt-0266wPt-589235.2711.750.23
QTs.cim-1B1B52.8CSLV46-1BwPt-10704.833.000.11
QTs.cim-7D7D43wPt-663918wPt-7331048.865.78−0.15
QTs.cim-1A.11A0wPt-0595tPt-72146.023.69−0.12
QTs.cim-1A.21A25wPt-741704tPt-755923.1819.00−0.29
a position in cM; b percent variation explained; c additive effect.
Table 4. QTLs for SNB resistance in the population of PBW343 (−)/Kenya Nyangumi (+).
QTLChr.Pos. aFlanking MarkersLODPVE (%) bAdd c
LeftRight
QSnb.cim-5B.15B168wPt-3661wPt-34574.888.00−0.20
QSnb.cim-5B.25B180XFCP393wPt-173311.3819.51−0.32
QSnb.cim-1A.11A47wPt-8172wPt-61395.705.240.17
QSnb.cim-1A.21A104wPt-729972wPt-252712.0511.45−0.26
QSnb.cim-5A5A10wPt-1370wPt-951311.2410.69−0.25
a position in cM; b percent variation explained; c additive effect.
Table 5. Comparison of RILs having different tan spot QTLs.
QTLAbsencePresenceDifferencep ValueR2
QTs.cim-5B.22.942.150.79<0.00010.31
QTs.cim-7B2.752.490.260.01270.04
QTs.cim-1B2.832.490.340.00450.06
QTs.cim-1A.22.852.230.62<0.00010.20
QTs.cim-5B.2 + QTs.cim-7B2.802.230.57<0.00010.33
QTs.cim-7B + QTs.cim-1B3.142.440.700.00020.15
QTs.cim-5B.2 + QTs.cim-1B2.802.260.55<0.00010.36
QTs.cim-1B + QTs.cim-1A.22.812.570.25<0.00010.30
QTs.cim-7B + QTs.cim-1A.22.702.270.43<0.00010.22
QTs.cim-5B.2 + QTs.cim-1A.23.261.631.63<0.00010.59
QTs.cim-5B.2 + QTs.cim-7B + QTs.cim-1B2.852.480.36<0.00010.41
QTs.cim-5B.2 + QTs.cim-7B + QTs.cim-1A.23.181.581.60<0.00010.59
QTs.cim-7B + QTs.cim-1B + QTs.cim-1A.22.952.710.24<0.00010.37
QTs.cim-5B.2 + QTs.cim-7B + QTs.cim-1B + QTs.cim-1A.23.072.670.40<0.00010.66
Table 6. Comparison of RILs having different Septoria nodorum blotch QTLs.
QTLAbsencePresenceDifferencep ValueR2
QSnb.cim-5B.23.002.011.00<0.00010.43
QSnb.cim-1A.22.532.600.070.55620.00
QSnb.cim-5A2.622.400.220.06300.02
QSnb.cim-5B.2 + QSnb.cim-1A.22.981.990.99<0.00010.40
QSnb.cim-5B.2 + QSnb.cim-5A3.151.861.28<0.00010.44
QSnb.cim-1A.2 + QSnb.cim-5A2.582.250.330.12220.04
QSnb.cim-5B.2 + QSnb.cim-1A.2 + QSnb.cim-5A3.111.701.41<0.00010.49

