Early Detection of Pancreatic Intraepithelial Neoplasias (PanINs) in Transgenic Mouse Model by Hyperpolarized 13C Metabolic Magnetic Resonance Spectroscopy

 , , ,
, , ,
Abstract
:1. Introduction
2. Results
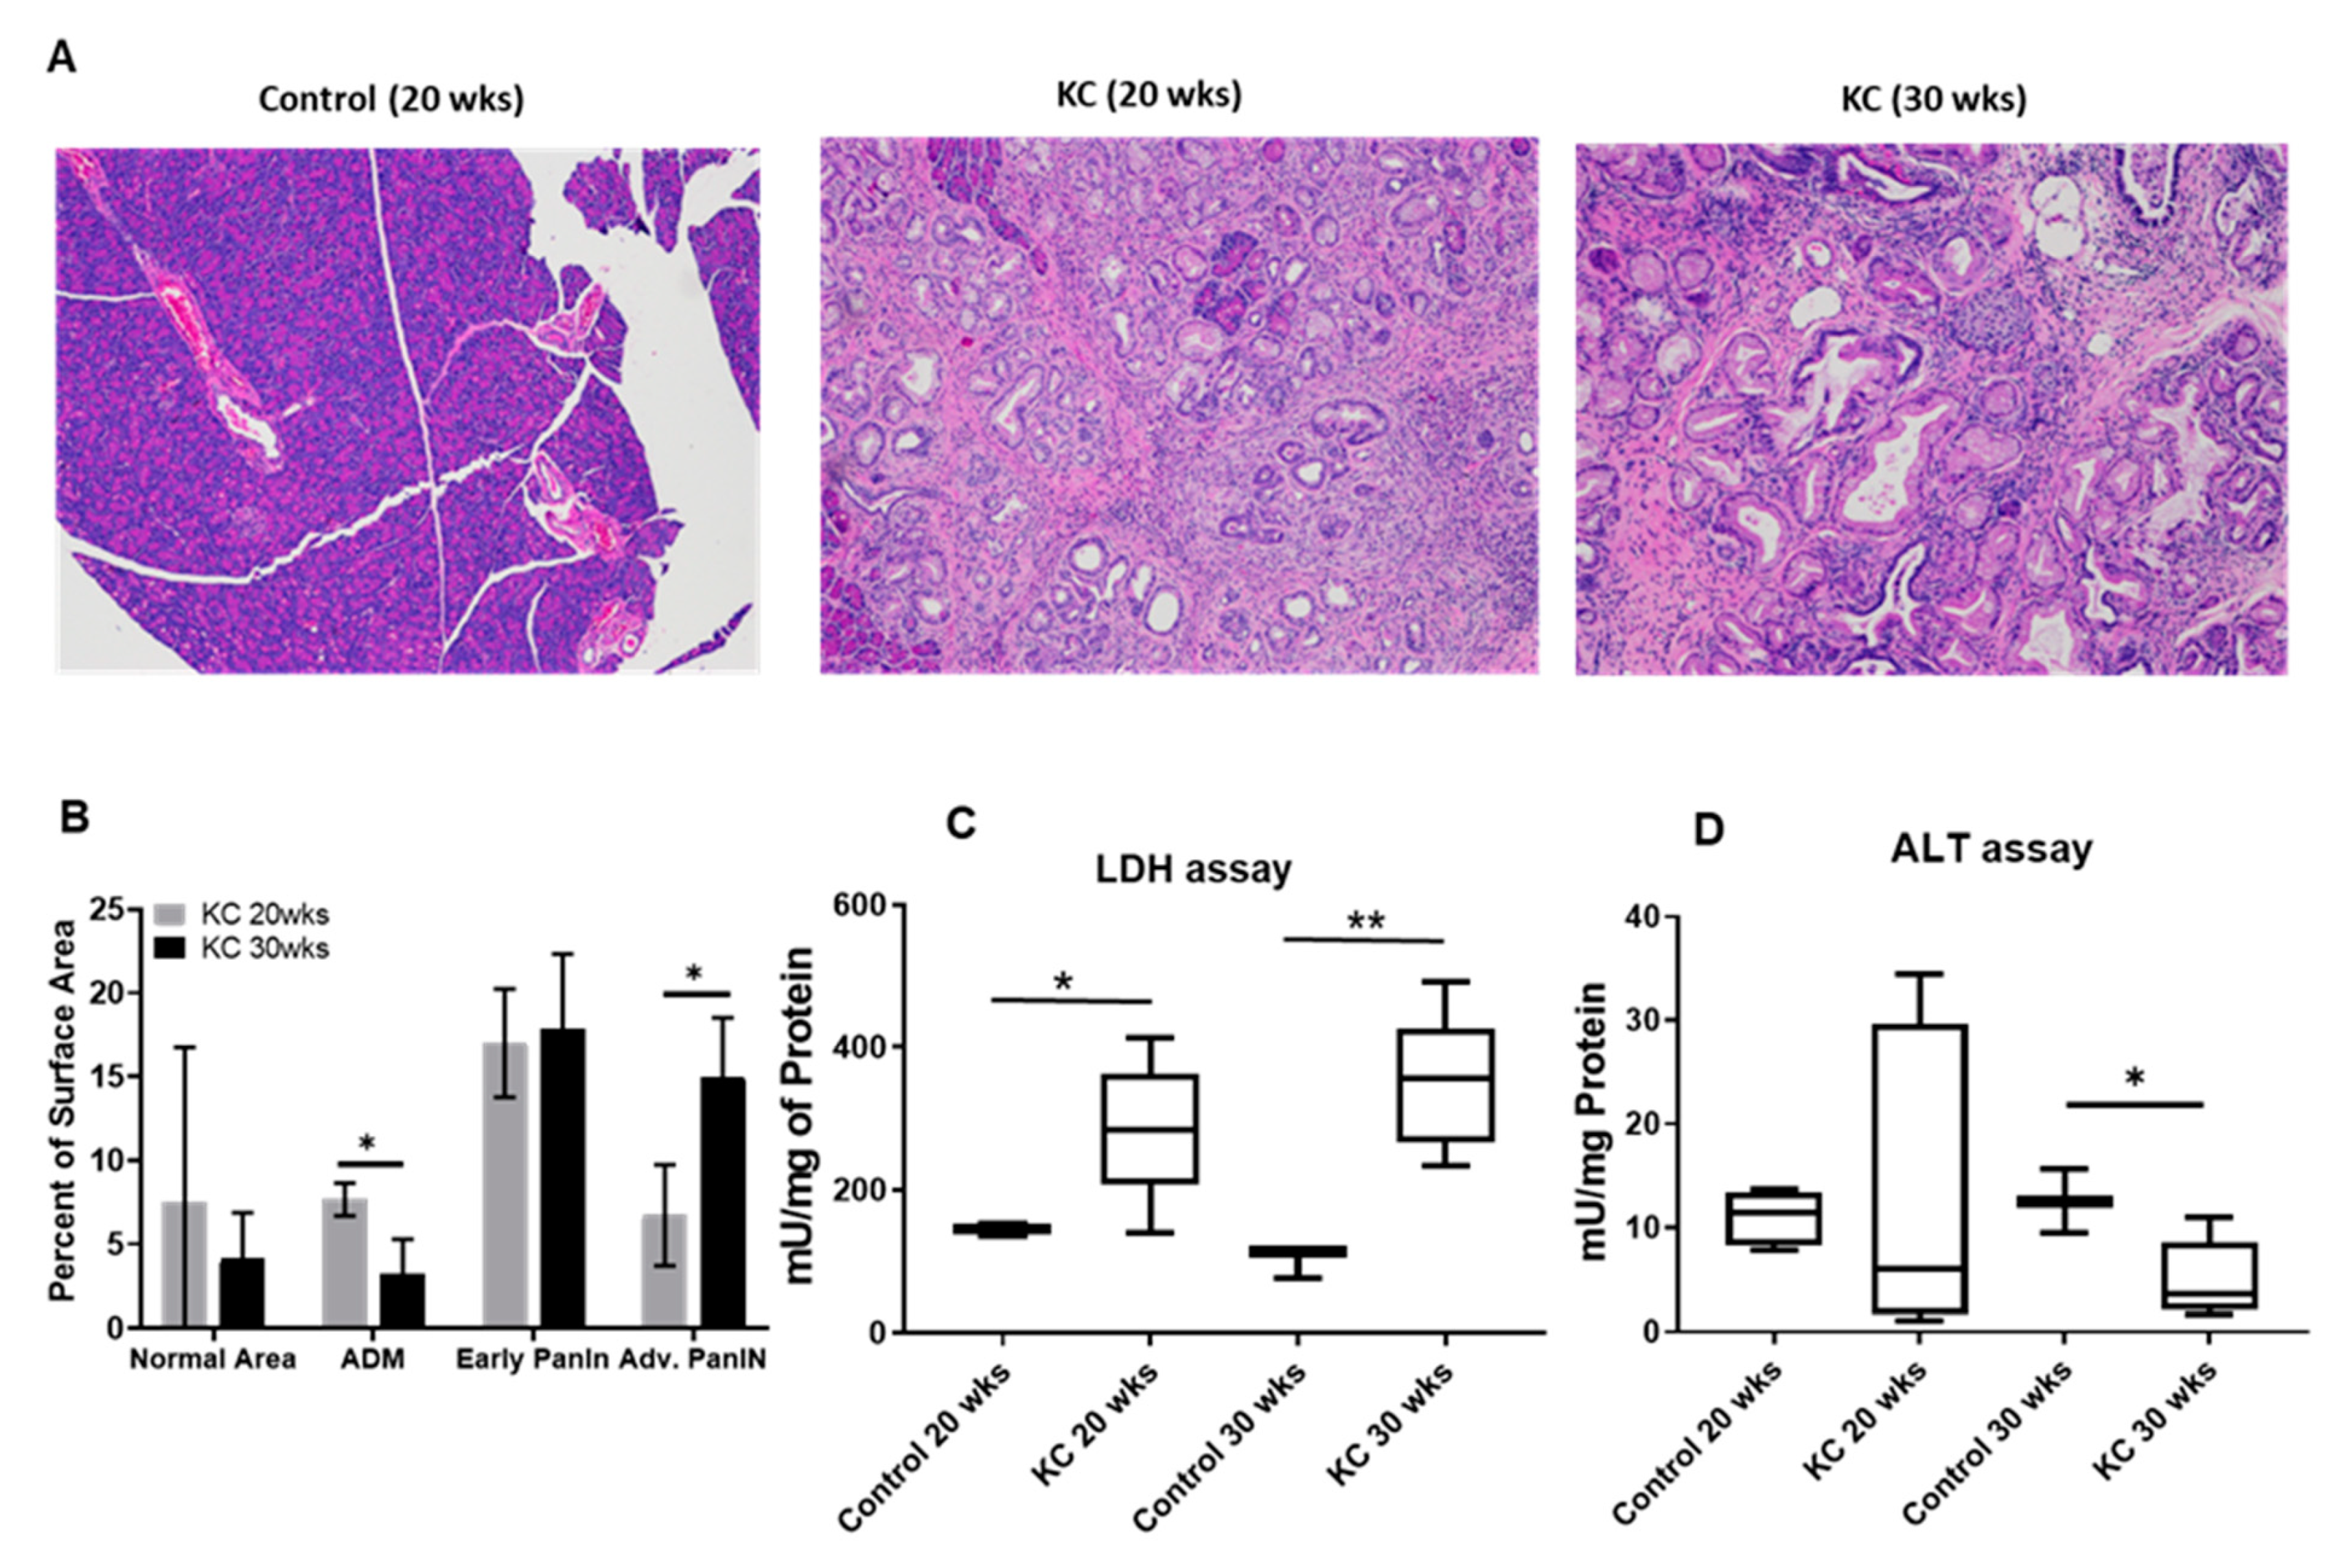
2.1. Histology
2.2. Active LDH and ALT Enzymes Assay
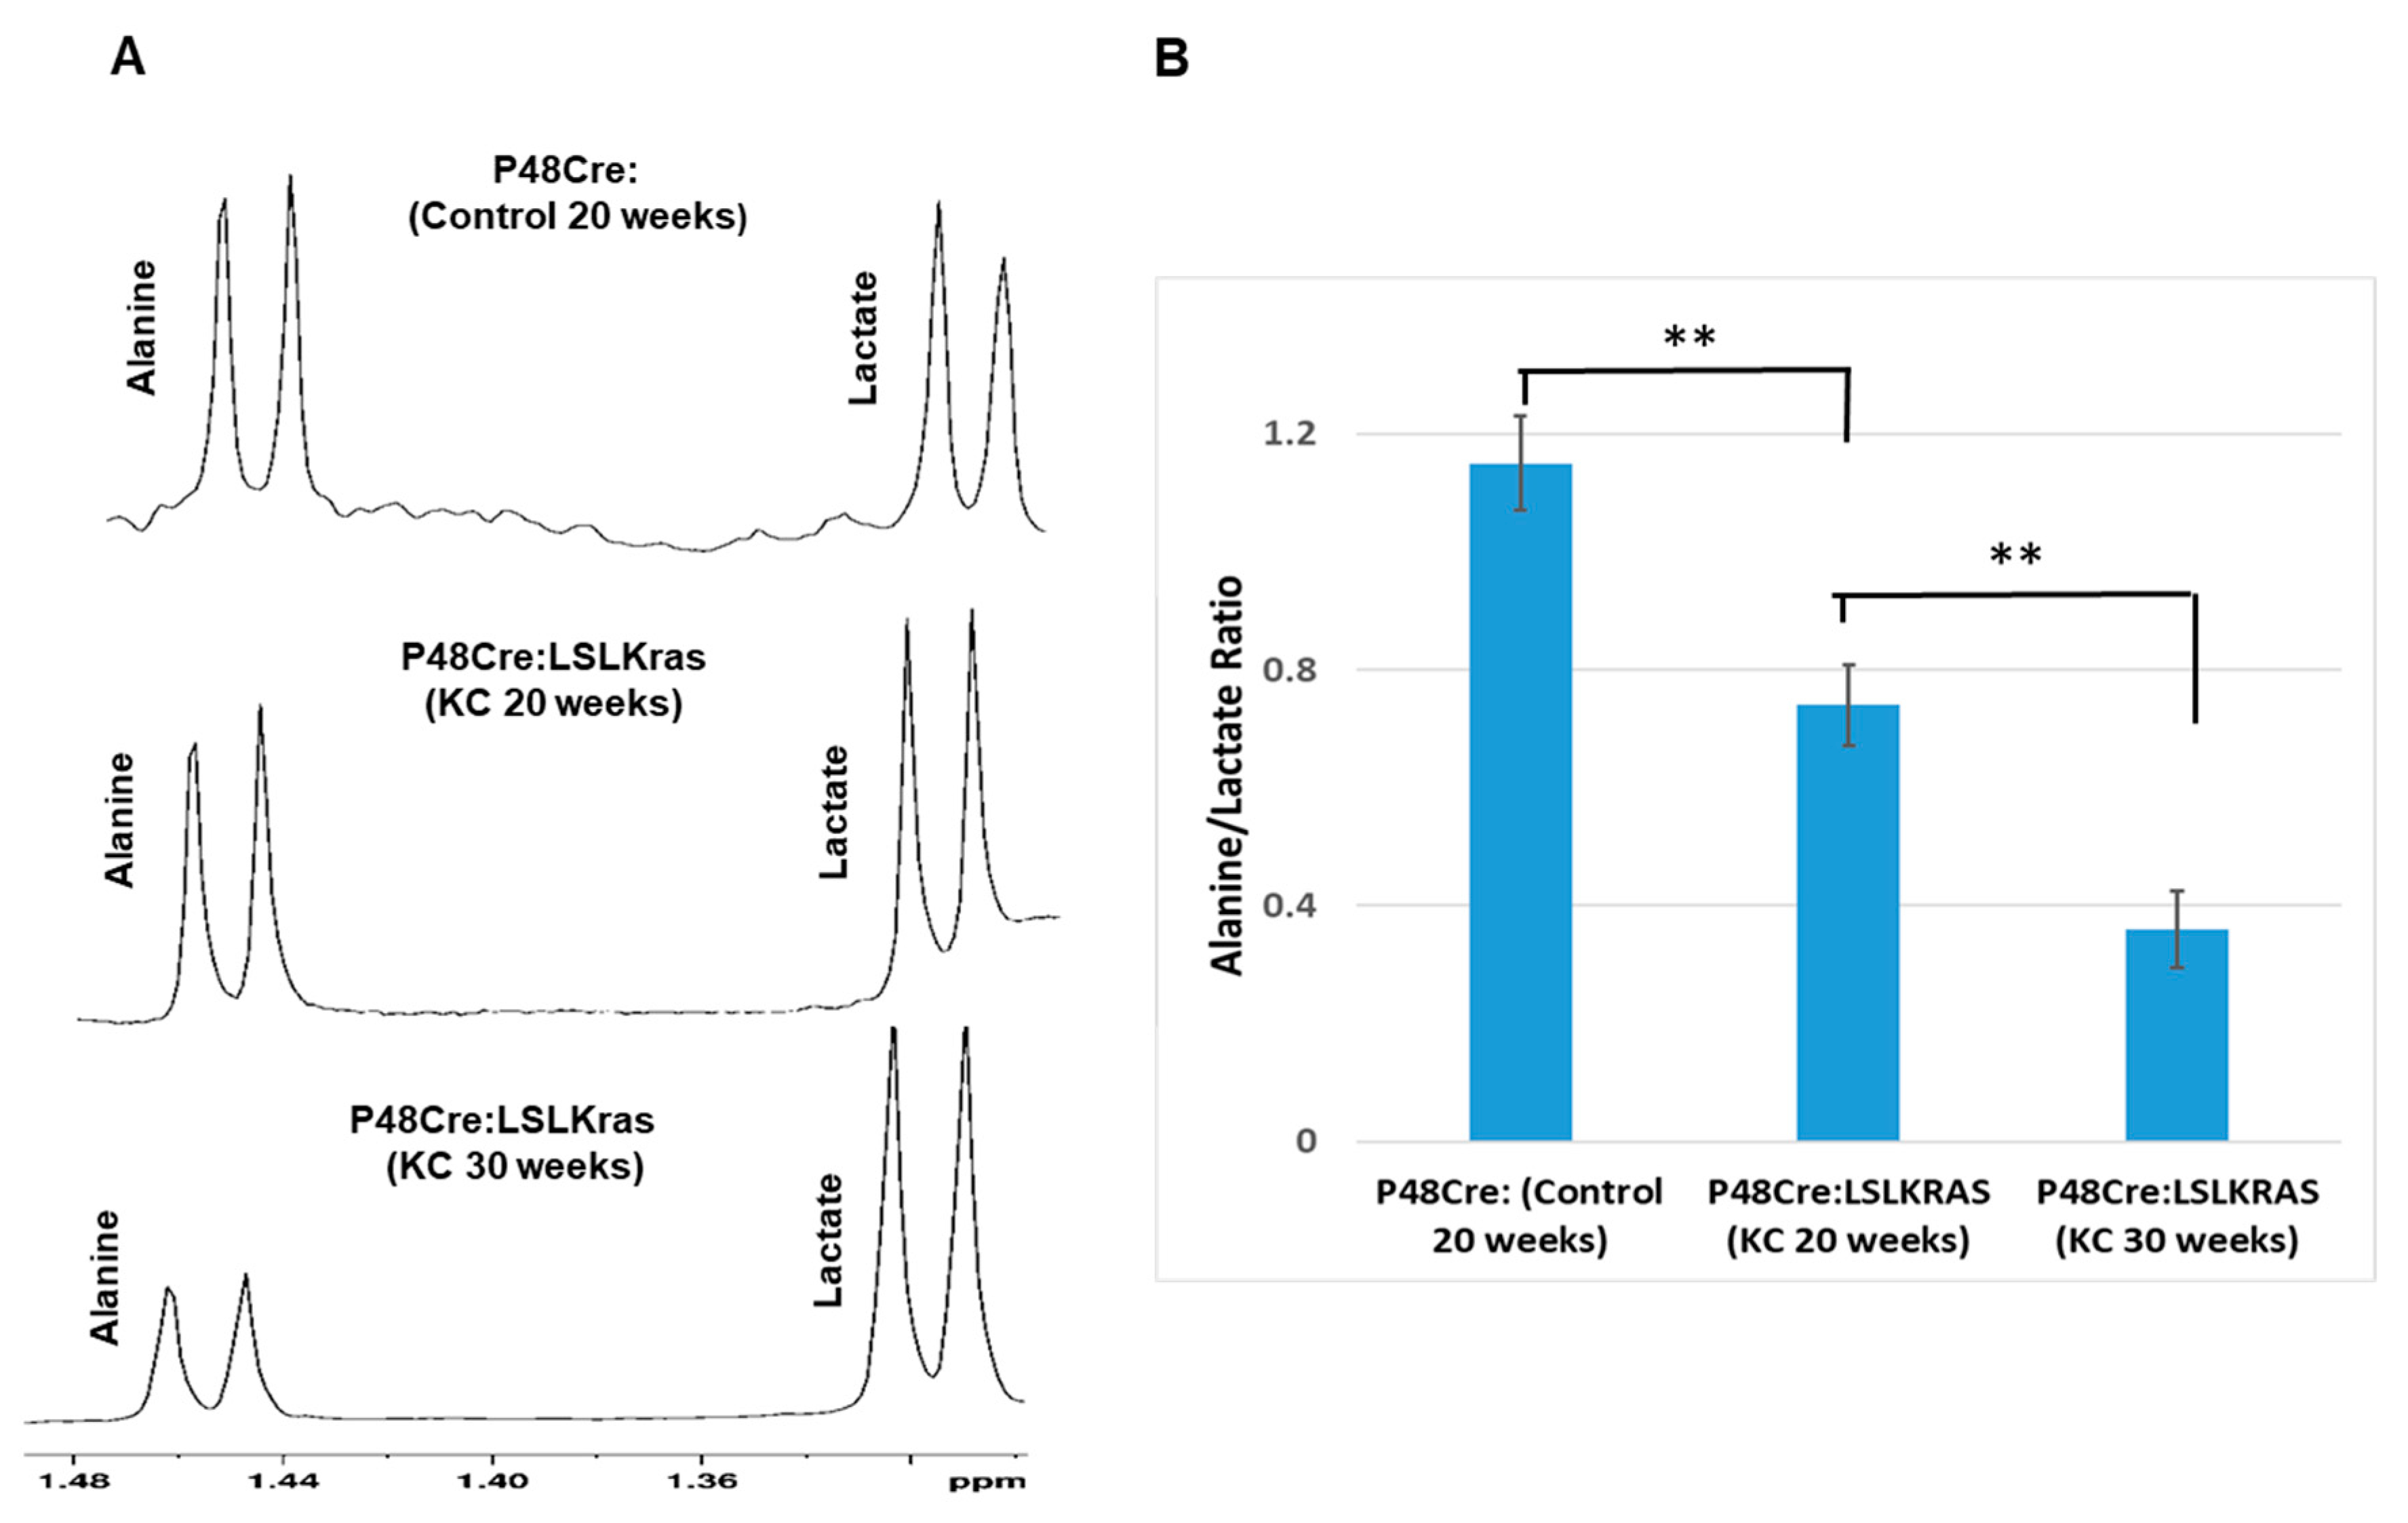
2.3. Ex Vivo 1H NMR Metabolomics Study
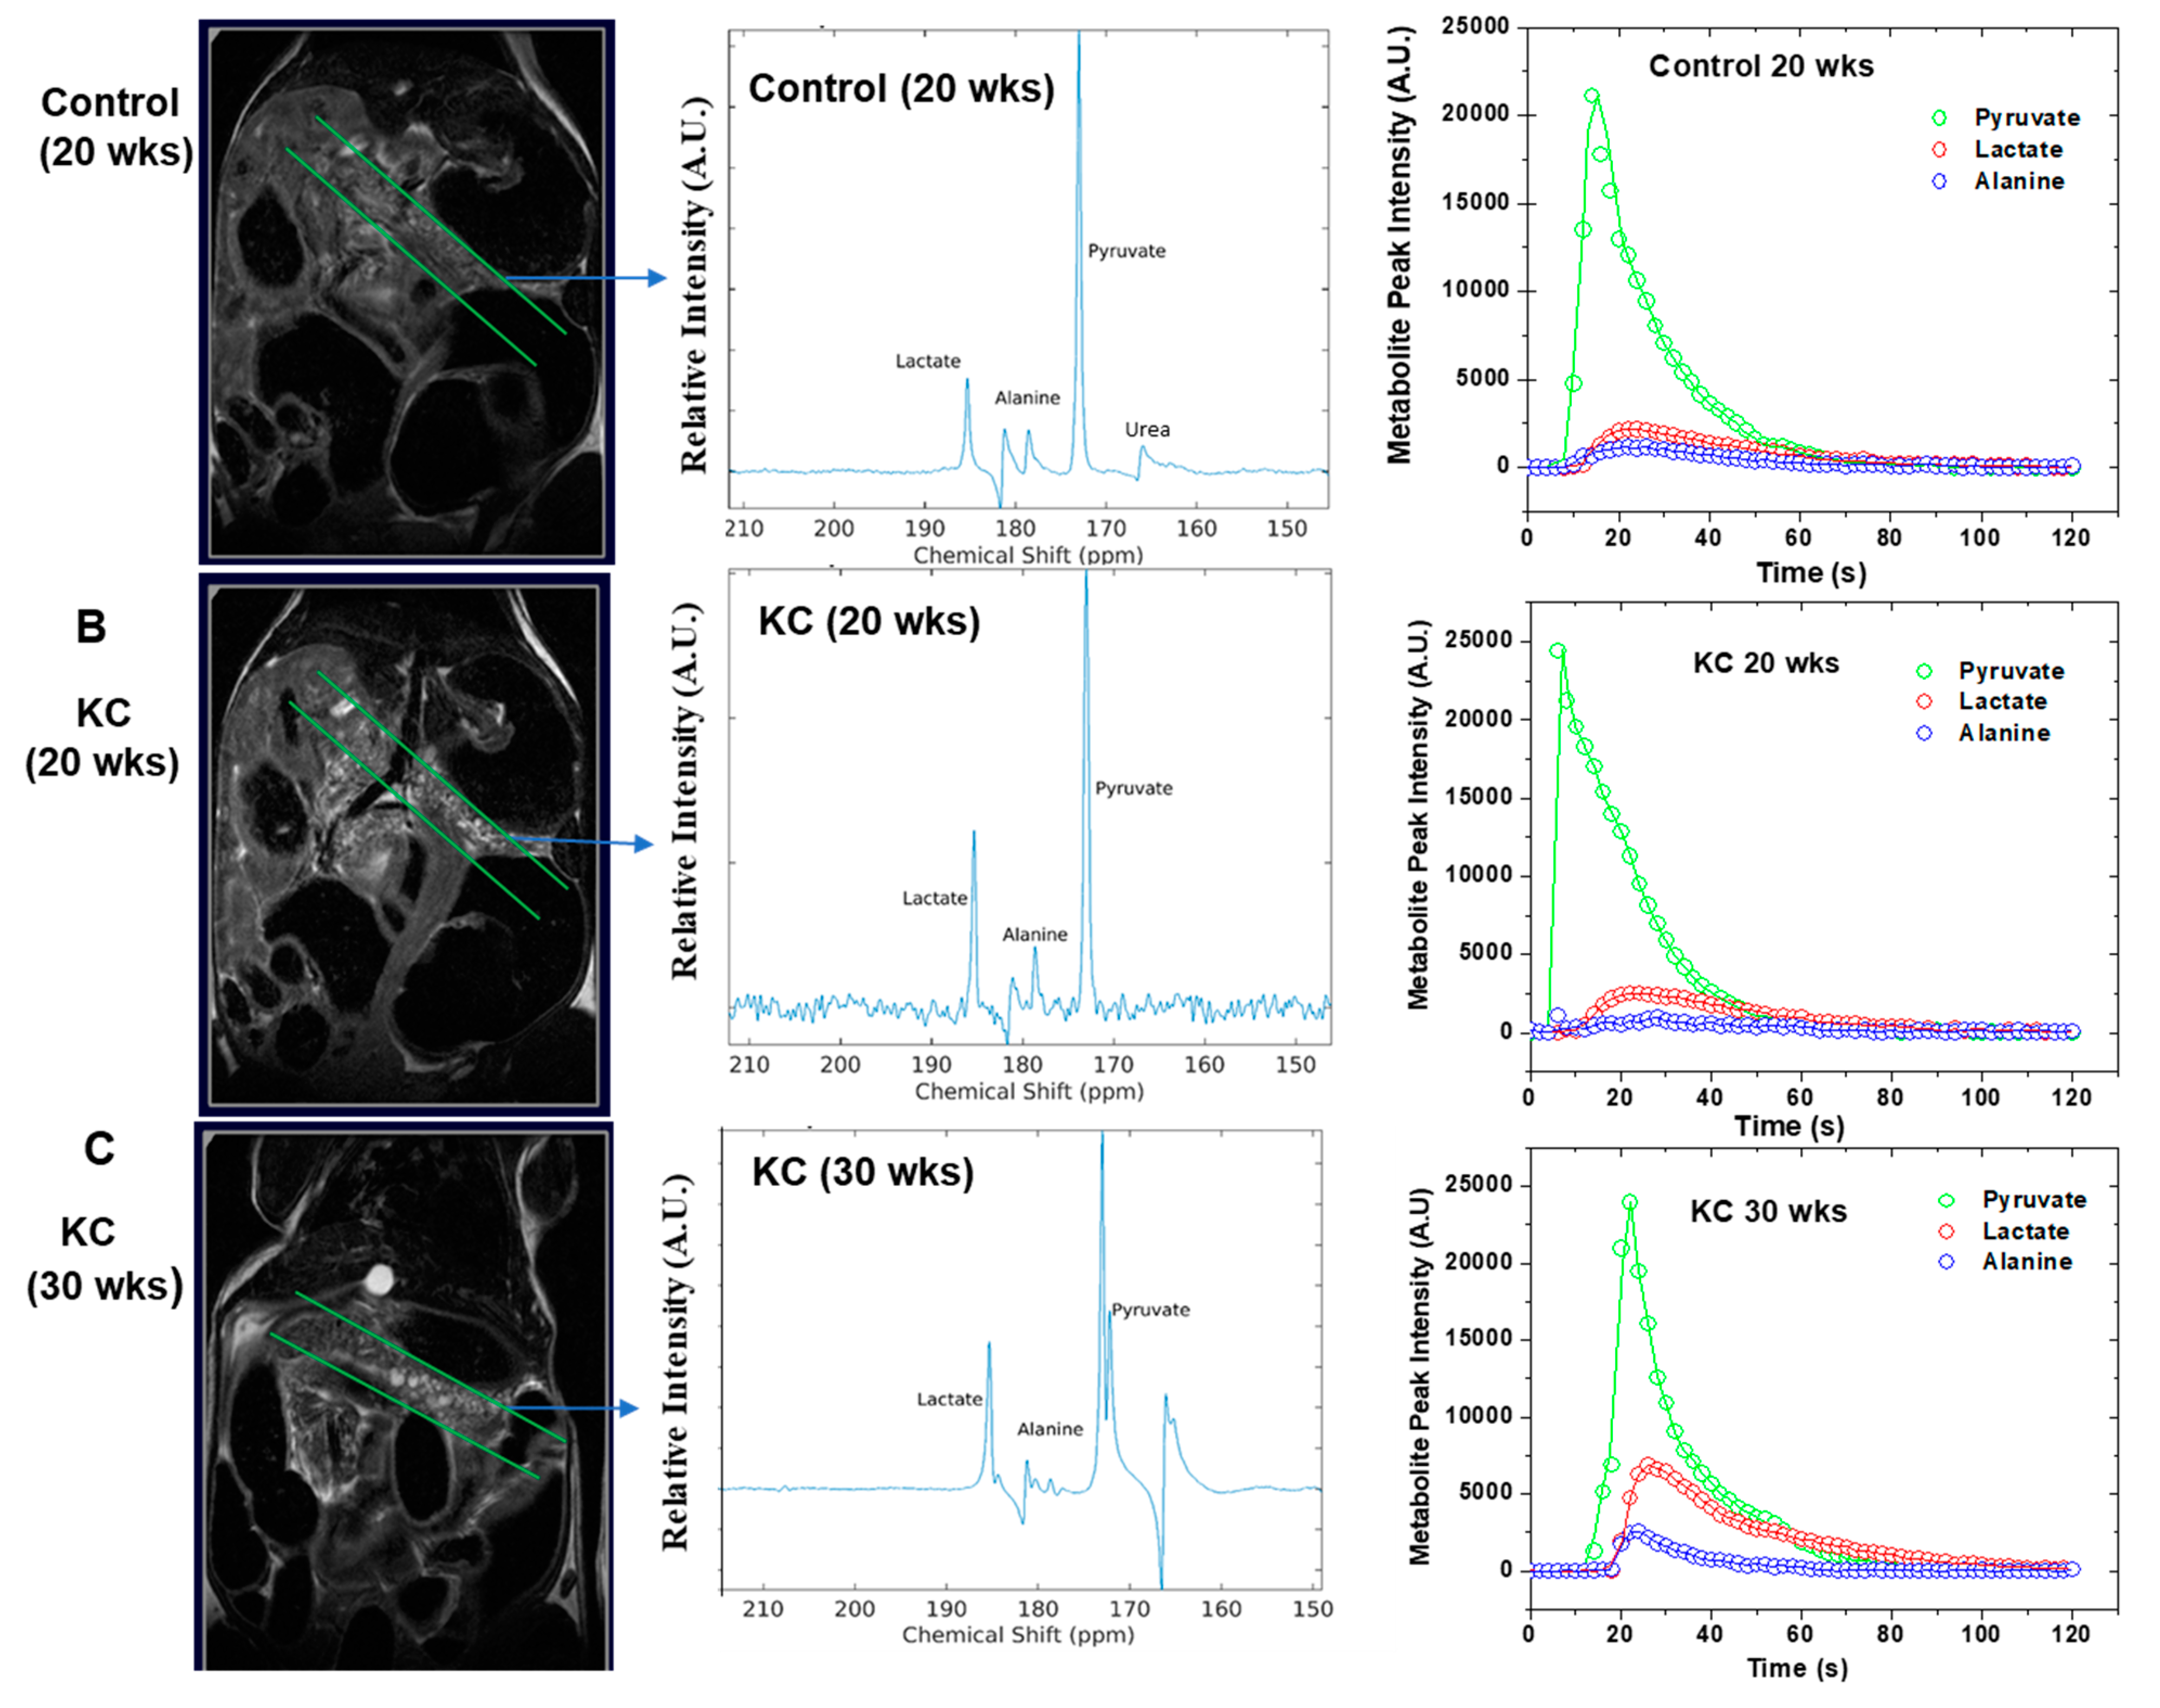
2.4. In Vivo 13C MRS of Pyruvate
2.5. Kinetic Modeling
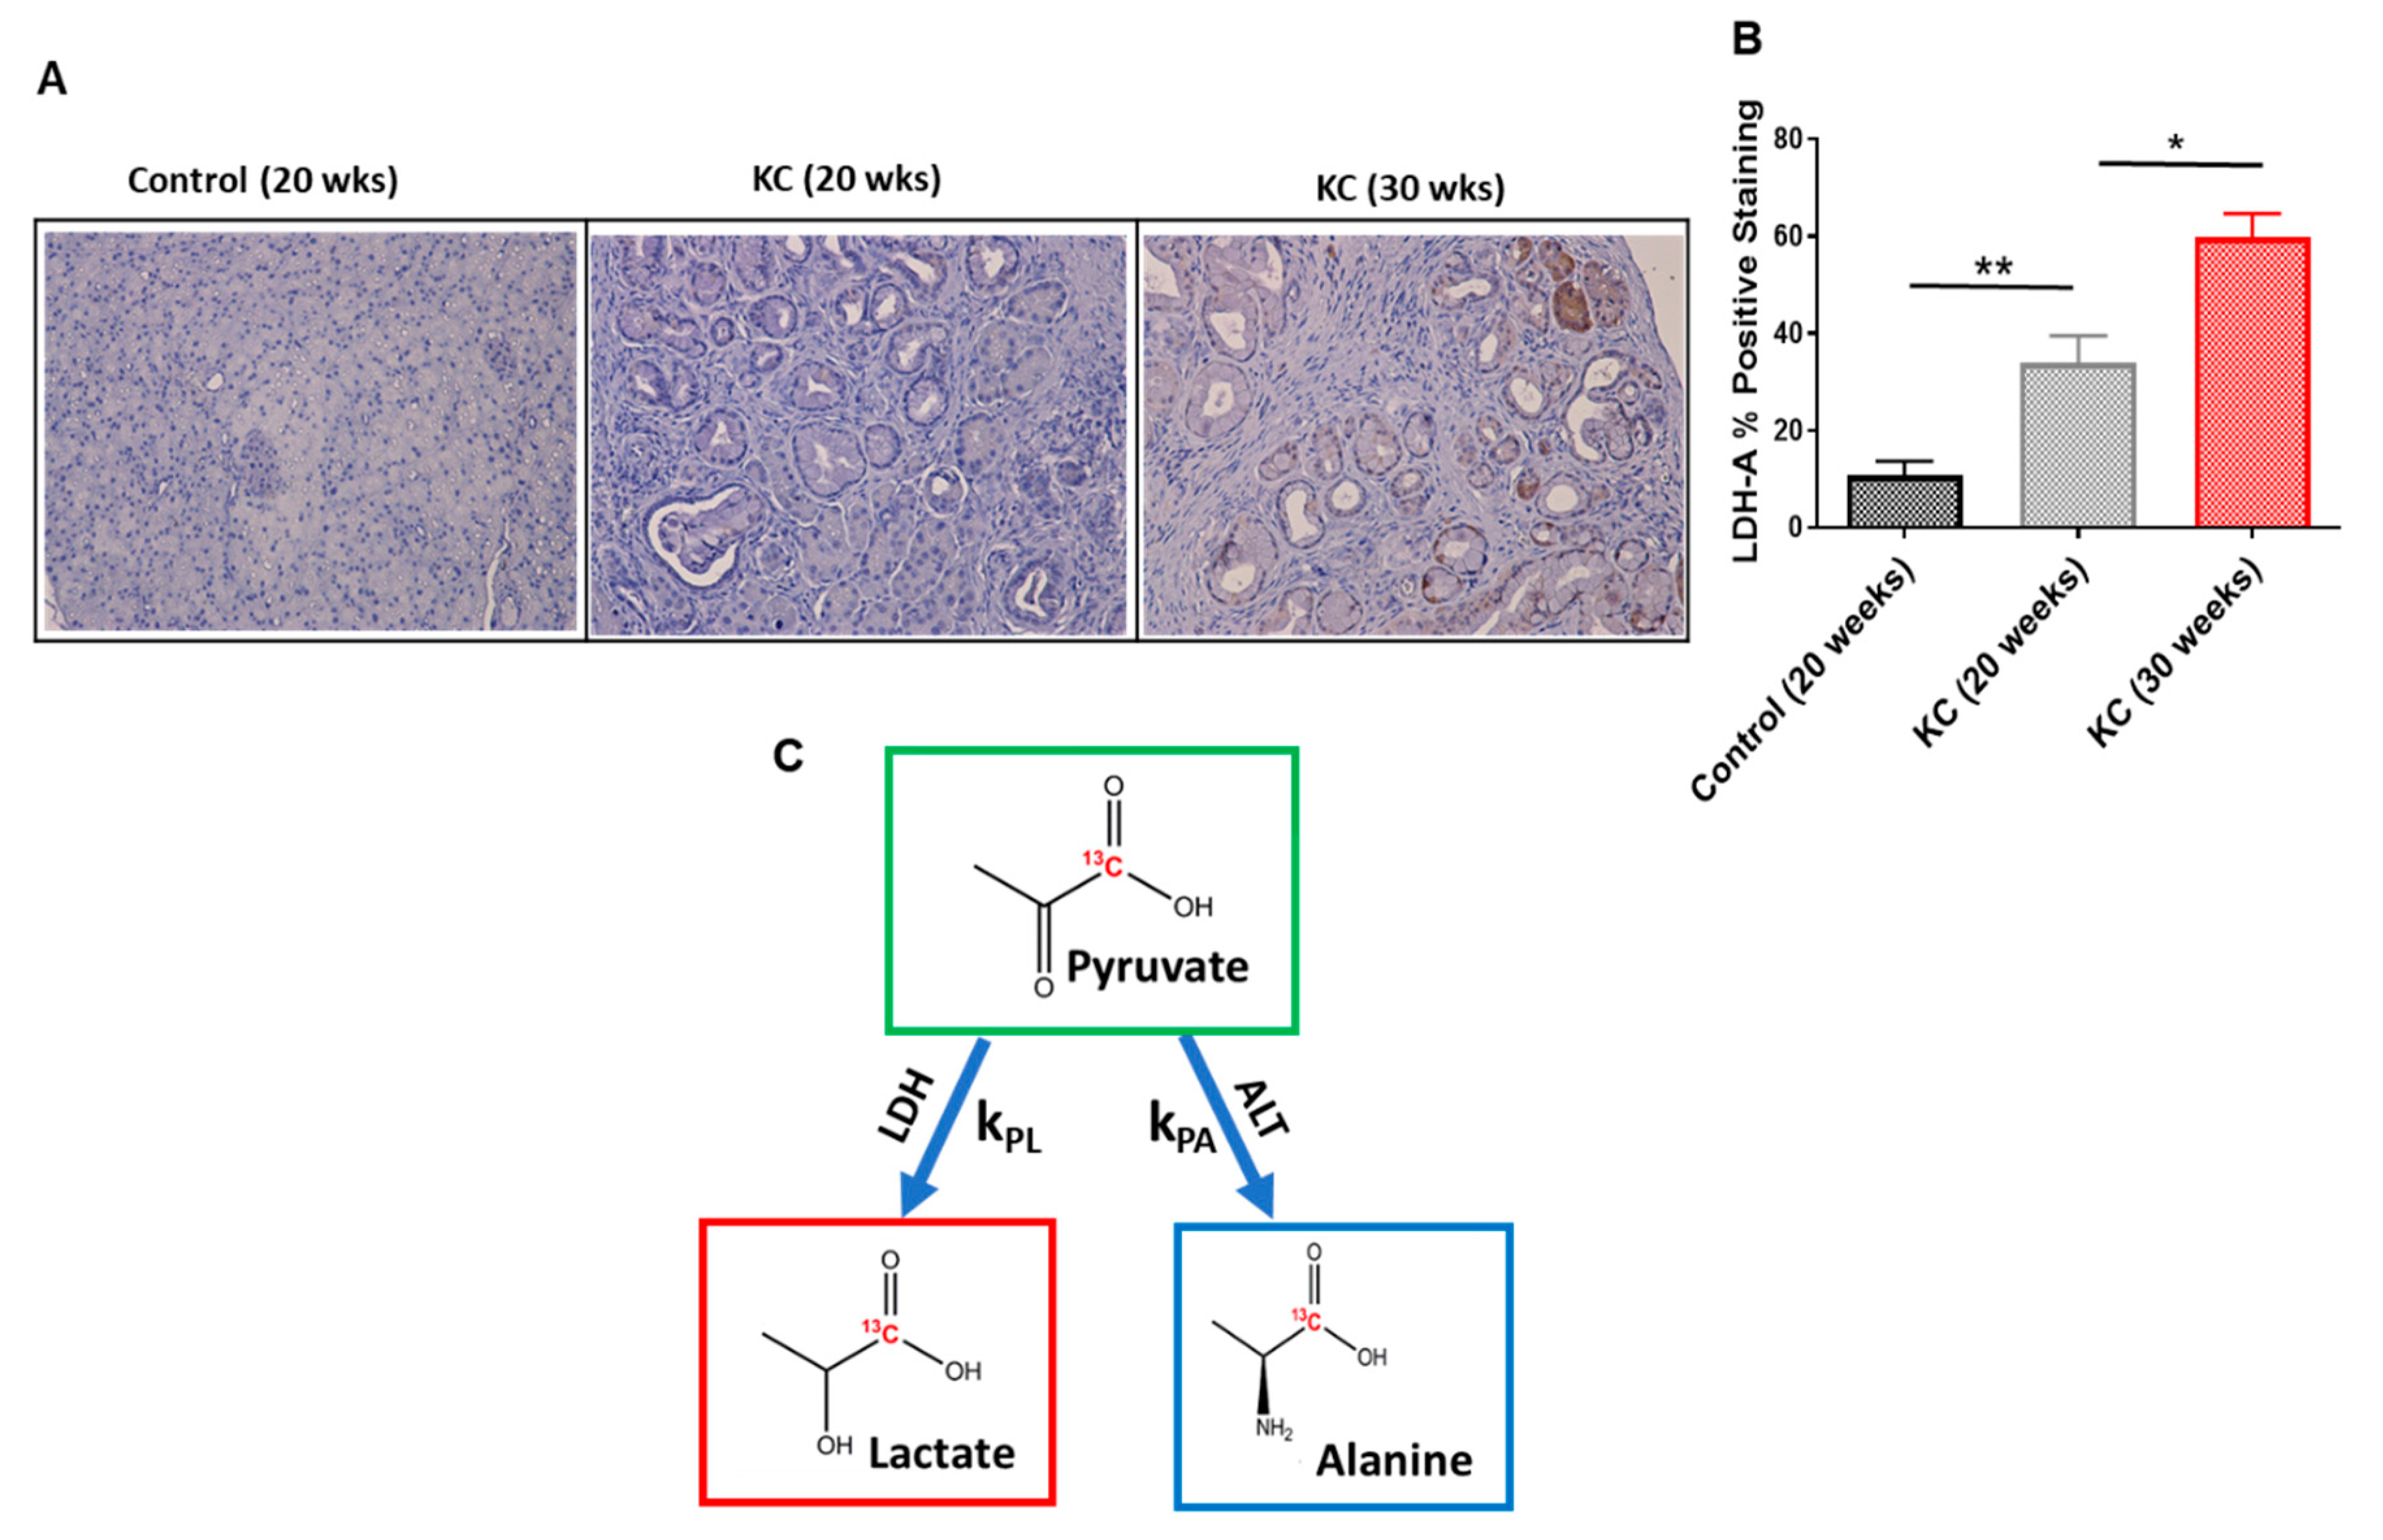
2.6. Immunohistochemistry
3. Discussion
4. Materials and Methods
4.1. Development of Genetically Engineered Mice
4.2. Histology and Quantification of PanINs Progression
4.3. Immunohistochemistry
4.4. Lactate Dehydrogenase (LDH) and Alanine Aminotransferase (ALT) Enzymes Assay
4.5. 13C Pyruvate Hyperpolarization
4.6. T2-weighted proton MRI
4.7. In Vivo 13C MRS
4.8. Ex Vivo 1H NMR Spectroscopy
4.9. Statistical Method
5. Conclusions
Supplementary Materials
Author Contributions
Funding
Conflicts of Interest
References
- Rahib, L.; Smith, B.D.; Aizenberg, R.; Rosenzweig, A.B.; Fleshman, J.M.; Matrisian, L.M. Projecting Cancer Incidence and Deaths to 2030: The Unexpected Burden of Thyroid, Liver, and Pancreas Cancers in the United States. Cancer Res. 2014, 74, 2913–2921. [Google Scholar] [CrossRef] [Green Version]
- McAllister, F.; Bailey, J.M.; Alsina, J.; Nirschl, C.J.; Sharma, R.; Fan, H.; Rattigan, Y.; Roeser, J.C.; Lankapalli, R.H.; Zhang, H.; et al. Oncogenic Kras Activates a Hematopoietic-to-Epithelial IL-17 Signaling axis in Preinvasive Pancreatic Neoplasia. Cancer Cell 2014, 25, 621–637. [Google Scholar] [CrossRef] [Green Version]
- Rhim, A.D.; Mirek, E.T.; Aiello, N.M.; Maitra, A.; Bailey, J.M.; McAllister, F.; Reichert, M.; Beatty, G.L.; Rustgi, A.K.; Vonderheide, R.H.; et al. EMT and Dissemination Precede Pancreatic Tumor Formation. Cell 2012, 148, 349–361. [Google Scholar] [CrossRef] [Green Version]
- Bailey, J.M.; Hendley, A.M.; Lafaro, K.J.; Pruski, M.A.; Jones, N.C.; Alsina, J.; Younes, M.; Maitra, A.; McAllister, F.; Iacobuzio-Donahue, C.A. p53 Mutations Cooperate with Oncogenic Kras to Promote Adenocarcinoma from Pancreatic Ductal Cells. Oncogene 2015, 35, 4282–4288. [Google Scholar] [CrossRef]
- McAllister, F.; Leach, S.D. Targeting IL-17 for Pancreatic Cancer Prevention. Oncotarget 2014, 5, 9530–9531. [Google Scholar] [CrossRef]
- Cancer Society; Cancer Facts & Figures 2020 Report. Available online: https://www.cancer.org/research/cancer-facts-statistics/all-cancer-facts-figures/cancer-facts-figures-2020.html (accessed on 24 May 2020).
- Siegel, R.L.; Miller, K.D.; Jemal, A. Cancer Statistics, 2020. CA Cancer J Clin. 2020, 70, 7–30. [Google Scholar] [CrossRef]
- Chari, S.T.; Kelly, K.; Hollingsworth, M.A.; Thayer, S.P.; Ahlquist, D.A.; Andersen, D.K.; Batra, S.K.; Brentnall, T.A.; Canto, M.; Cleeter, D.F.; et al. Early Detection of Sporadic Pancreatic Cancer: Summative Review. Pancreas 2015, 44, 693–712. [Google Scholar] [CrossRef] [PubMed] [Green Version]
- Lennon, A.M.; Wolfgang, C.L.; Canto, M.I.; Klein, A.P.; Herman, J.M.; Goggins, M.; Fishman, E.K.; Kamel, I.; Weiss, M.J.; Diaz, L.A.; et al. The Early Detection of Pancreatic Cancer: What Will It Take to Diagnose and Treat Curable Pancreatic Neoplasia? Cancer Res. 2014, 74, 3381–3389. [Google Scholar] [CrossRef] [PubMed] [Green Version]
- Blackford, A.L.; Canto, M.I.; Klein, A.P.; Hruban, R.H.; Goggins, M. Recent Trends in the Incidence and Survival of Stage 1A Pancreatic Cancer: A Surveillance, Epidemiology, and End Results analysis. JNCI J. Natl. Cancer Inst. 2020, 112, djaa00. [Google Scholar] [CrossRef] [PubMed]
- Canto, M.I.; Almario, J.A.; Schulick, R.D.; Yeo, C.J.; Klein, A.; Blackford, A.; Shin, E.J.; Sanyal, A.; Yenokyan, G.; Lennon, A.M.; et al. Risk of Neoplastic Progression in Individuals at High Risk for Pancreatic Cancer Undergoing Long-term Surveillance. Gastroenterology 2018, 155, 740–751. [Google Scholar] [CrossRef] [Green Version]
- Hingorani, S.R.; Petricoin, E.F.; Maitra, A.; Rajapakse, V.; King, C.; Jacobetz, M.A.; Ross, S.; Conrads, T.P.; Veenstra, T.D.; Hitt, B.A.; et al. Preinvasive and Invasive Ductal Pancreatic Cancer and its Early Detection in the Mouse. Cancer Cell 2003, 4, 437–450. [Google Scholar] [CrossRef] [Green Version]
- Sipos, B.; Frank, S.; Gress, T.; Hahn, S.; Kloppel, G. Pancreatic Intraepithelial Neoplasia Revisited and Updated. Pancreatology 2009, 9, 45–54. [Google Scholar] [CrossRef] [PubMed]
- Ottenhof, N.A.; Milne, A.N.; Morsink, F.H.; Drillenburg, P.; Ten Kate, F.J.; Maitra, A.; Offerhaus, G.J. Pancreatic Intraepithelial Neoplasia and Pancreatic Tumorigenesis: Of Mice and Men. Arch. Pathol. Lab. Med. 2009, 133, 375–381. [Google Scholar]
- Waddell, N.; Pajic, M.; Patch, A.M.; Chang, D.K.; Kassahn, K.S.; Bailey, P.; Johns, A.L.; Miller, D.; Nones, K.; Quek, K.; et al. Whole Genomes Redefine the Mutational Landscape of Pancreatic Cancer. Nature 2015, 518, 495–501. [Google Scholar] [CrossRef] [PubMed] [Green Version]
- Ideno, N.; Yamaguchi, H.; Ghosh, B.; Gupta, S.; Okumura, T.; Steffen, D.J.; Fisher, C.G.; Wood, L.D.; Singhi, A.D.; Nakamura, M.; et al. GNASR201C Induces Pancreatic Cystic Neoplasms in Mice That Express Activated KRAS by Inhibiting YAP1 Signaling. Gastroenterology 2018, 155, 1593–1607. [Google Scholar] [CrossRef] [PubMed]
- Dey, P.; Li, J.; Zhang, J.; Chaurasiya, S.; Strom, A.; Wang, H.; Liao, W.T.; Cavallaro, F.; Denz, P.; Bernard, V.; et al. Oncogenic Kras Driven Metabolic Reprogramming in Pancreas Cancer Cells Utilizes Cytokines 2 from the Tumor Microenvironment. Cancer Discov. 2020, 10, 608–625. [Google Scholar] [CrossRef] [PubMed]
- Kurhanewicz, J.; Vigneron, D.B.; Brindle, K.; Chekmenev, E.Y.; Comment, A.; Cunningham, C.H.; Deberardinis, R.J.; Green, G.G.; Leach, M.O.; Rajan, S.S.; et al. Analysis of Cancer Metabolism by Imaging Hyperpolarized Nuclei: Prospects for Translation to Clinical Research. Neoplasia 2011, 13, 81–97. [Google Scholar] [CrossRef] [Green Version]
- Ardenkjaer-Larsen, J.H.; Fridlund, B.; Gram, A.; Hansson, G.; Hansson, L.; Lerche, M.H.; Servin, R.; Thaning, M.; Golman, K. Increase in Signal-to-Noise Ratio of > 10,000 Times in Liquid-state NMR. Proc. Natl. Acad. Sci. USA 2003, 100, 10158–10163. [Google Scholar] [CrossRef] [Green Version]
- Dutta, P.; Martinez, G.V.; Gillies, R.J. A New Horizon of DNP technology: Application to in-vivo 13C Magnetic Resonance Spectroscopy and Imaging. Biophys. Rev. 2013, 5, 271–281. [Google Scholar] [CrossRef]
- Nelson, S.J.; Kurhanewicz, J.; Vigneron, D.B.; Larson, P.E.; Harzstark, A.L.; Ferrone, M.; Criekinge, M.V.; Chang, J.W.; Bok, R.; Park, I.; et al. Metabolic Imaging of Patients with Prostate Cancer using Hyperpolarized [1−13C] Pyruvate. Sci. Transl. Med. 2013, 5, 198ra108. [Google Scholar] [CrossRef] [Green Version]
- Stødkilde-Jørgensen, H.; Laustsen, C.; Hansen, E.S.S.; Schulte, R.; Ardenkjaer-Larsen, J.H.; Comment, A.; Frøkiær, J.; Ringgaard, S.; Bertelsen, L.B.; Ladekarl, M.; et al. Pilot Study Experiences with Hyperpolarized [1-13C] Pyruvate MRI in Pancreatic Cancer Patients. J. Magn. Reson. Imaging 2020, 51, 961–963. [Google Scholar] [CrossRef] [PubMed]
- Vander Heiden, M.G.; Locasale, L.W.; Swanson, K.D.; Sharfi, H.; Heffron, G.J.; Amador-Noguez, D.; Christofk, H.R.; Wagner, G.; Rabinowitz, J.D.; Asara, J.M.; et al. Evidence for an Alternative Glycolytic Pathway in Rapidly Proliferating Cells. Science 2010, 329, 1492–1499. [Google Scholar] [CrossRef] [PubMed] [Green Version]
- Timm, K.N.; Kennedy, B.W.C.; Brindle, K.M. Imaging Tumor Metabolism to Assess Disease Progression and Treatment Response. Clin. Cancer Res. 2016, 22, 5196–5203. [Google Scholar] [CrossRef] [PubMed] [Green Version]
- Dutta, P.; Salzillo, T.C.; Pudakalakatti, S.; Gammon, S.T.; Kaipparettu, B.A.; McAllister, F.; Wagner, S.; Frigo, D.E.; Logothetis, C.J.; Zacharias, N.M.; et al. Assessing Therapeutic Efficacy in Real-Time by Hyperpolarized Magnetic Resonance Metabolic Imaging. Cells 2019, 8, 340. [Google Scholar] [CrossRef] [PubMed] [Green Version]
- Kurhanewicz, J.; Vigneron, D.B.; Ardenkjaer-Larsen, J.H.; Bankson, J.A.; Brindle, K.; Cunningham, C.H.; Gallagher, F.A.; Keshari, K.R.; Kjaer, A.; Laustsen, C.; et al. Hyperpolarized 13C MRI: Path to Clinical Translation in Oncology. Neoplasia 2019, 1, 1–16. [Google Scholar] [CrossRef] [PubMed]
- Serrao, E.M.; Kettunen, M.I.; Rodrigues, T.B.; Dzien, P.; Wright, A.J.; Gopinathan, A.; Gallagher, F.A.; Lewis, D.Y.; Frese, K.K.; Almeida, J.; et al. MRI with Hyperpolarised [1-13C] Pyruvate Detects Advanced Pancreatic Preneoplasia Prior to Invasive Disease in a Mouse Model. GUT 2016, 65, 465–475. [Google Scholar] [CrossRef] [Green Version]
- Dutta, P.; Perez, M.R.; Lee, J.; Kang, Y.; Pratt, M.; Salzillo, T.C.; Weygand, J.; Zacharias, N.M.; Gammon, S.T.; Koay, E.J.; et al. Combining Hyperpolarized Real-Time Metabolic Imaging and NMR Spectroscopy to Identify Metabolic Biomarkers in Pancreatic Cancer. J. Proteome Res. 2019, 18, 2826–2834. [Google Scholar] [CrossRef]
- Chen, H.Y.; Larson, P.E.; Bok, R.A.; Morze, C.V.; Sriram, R.; Santos, R.D.; Santos, J.D.; Gordon, J.W.; Bahrami, N.; Ferrone, M.; et al. Assessing Prostate Cancer Aggressiveness with Hyperpolarized Dual-Agent 3D Dynamic Imaging of Metabolism and Perfusion. Cancer Res. 2017, 77, 3207–3216. [Google Scholar] [CrossRef] [Green Version]
- Dolensek, J.; Rupnik, M.S.; Stozer, A. Structural similarities and differences between the human and the mouse pancreas. Islets 2015, 7, e1024405. [Google Scholar] [CrossRef] [Green Version]
- Zhang, Y.; Zoltan, M.; Riquelme, E.; Xu, H.; Sahin, I.; Castro-Pando, S.; Montiel, M.F.; Chang, K.; Jiang, Z.; Ling, J.; et al. Immune Cell Production of Interleukin 17 Induces Stem Cell Features of Pancreatic Intraepithelial Neoplasia Cells. Gastroenterology 2018, 155, 210–223. [Google Scholar] [CrossRef]
- Dutta, P.; Le, A.; Vander Jagt, D.L.; Tsukamoto, T.; Martinez, G.V.; Dang, C.V.; Gillies, R.J. Evaluation of LDH-A and Glutaminase Inhibition in vivo by Hyperpolarized 13C Pyruvate Magnetic Resonance Spectroscopy of Tumors. Cancer Res. 2013, 73, 4190–4195. [Google Scholar] [CrossRef] [PubMed] [Green Version]
- Rajeshkumar, N.V.; Dutta, P.; Yabuuchi, S.; De Wilde, R.F.; Martinez, G.V.; Le, A.; Kamphorst, J.J.; Rabinowitz, J.D.; Jain, S.K.; Hidalgo, M.; et al. Therapeutic Targeting of the Warburg Effect in Pancreatic Cancer Relies on an Absence of p53 Function. Cancer Res. 2015, 75, 3355–3364. [Google Scholar] [CrossRef] [PubMed] [Green Version]
- Day, S.E.; Kettunen, M.I.; Gallagher, F.A.; Hu, D.E.; Lerche, M.; Wolber, J.; Golman, K.; Ardenkjaer-Larsen, J.H.; Brindle, K.M. Detecting Tumor Response to Treatment using Hyperpolarized 13C Magnetic Resonance Imaging and Spectroscopy. Nat. Med. 2007, 13, 1382–1387. [Google Scholar] [CrossRef] [PubMed]
- Zierhut, M.L.; Yen, Y.F.; Chen, A.P.; Bok, R.; Albers, M.J.; Zhang, V.; Tropp, J.; Park, I.; Vigneron, D.B.; Kurhanewicz, J.; et al. Kinetic Modeling of Hyperpolarized 13C1-Pyruvate Metabolism in Normal Rats and TRAMP Mice. J. Magn. Res. 2010, 202, 85–92. [Google Scholar] [CrossRef] [PubMed] [Green Version]


| Mice Group (n = 10) | Ala/Pyr | Lac/Pyr | Kinetic Constant kPA, (s−1) | Kinetic Constant kPL, (s−1) |
|---|---|---|---|---|
| Control (20 weeks) | 0.195 ± 0.004 | 0.261 ± 0.003 | 0.0098 ± 0.0005 | 0.0125 ± 0.0005 |
| KC (20 weeks) | 0.132 ± 0.005 | 0.452 ± 0.002 | 0.0076 ± 0.0006 | 0.0224 ± 0.0004 |
| KC (30 weeks) | 0.096 ± 0.006 | 0.643 ± 0.003 | 0.0055 ± 0.0005 | 0.0296 ± 0.0004 |
© 2020 by the authors. Licensee MDPI, Basel, Switzerland. This article is an open access article distributed under the terms and conditions of the Creative Commons Attribution (CC BY) license (http://creativecommons.org/licenses/by/4.0/).
Share and Cite
Dutta, P.; Castro Pando, S.; Mascaro, M.; Riquelme, E.; Zoltan, M.; Zacharias, N.M.; Gammon, S.T.; Piwnica-Worms, D.; Pagel, M.D.; Sen, S.; et al. Early Detection of Pancreatic Intraepithelial Neoplasias (PanINs) in Transgenic Mouse Model by Hyperpolarized 13C Metabolic Magnetic Resonance Spectroscopy. Int. J. Mol. Sci. 2020, 21, 3722. https://0-doi-org.brum.beds.ac.uk/10.3390/ijms21103722
Dutta P, Castro Pando S, Mascaro M, Riquelme E, Zoltan M, Zacharias NM, Gammon ST, Piwnica-Worms D, Pagel MD, Sen S, et al. Early Detection of Pancreatic Intraepithelial Neoplasias (PanINs) in Transgenic Mouse Model by Hyperpolarized 13C Metabolic Magnetic Resonance Spectroscopy. International Journal of Molecular Sciences. 2020; 21(10):3722. https://0-doi-org.brum.beds.ac.uk/10.3390/ijms21103722
Chicago/Turabian StyleDutta, Prasanta, Susana Castro Pando, Marilina Mascaro, Erick Riquelme, Michelle Zoltan, Niki M. Zacharias, Seth T. Gammon, David Piwnica-Worms, Mark D. Pagel, Subrata Sen, and et al. 2020. "Early Detection of Pancreatic Intraepithelial Neoplasias (PanINs) in Transgenic Mouse Model by Hyperpolarized 13C Metabolic Magnetic Resonance Spectroscopy" International Journal of Molecular Sciences 21, no. 10: 3722. https://0-doi-org.brum.beds.ac.uk/10.3390/ijms21103722