Article

Transcriptomic Changes in Endothelial Cells Triggered by Na,K-ATPase Inhibition: A Search for Upstream Na+i/K+i Sensitive Genes

by
Elizaveta A. Klimanova
1,*,
Svetlana V. Sidorenko
1,
Polina A. Abramicheva
1,
Artem M. Tverskoi
1,2,
Sergei N. Orlov
1,† and
Olga D. Lopina
1
1
Faculty of Biology, Lomonosov Moscow State University, 119234 Moscow, Russia
2
Engelhardt Institute of Molecular Biology, Russian Academy of Sciences (RAS), 119991 Moscow, Russia
*
Author to whom correspondence should be addressed.
Deceased.
Int. J. Mol. Sci. 2020, 21(21), 7992; https://0-doi-org.brum.beds.ac.uk/10.3390/ijms21217992
Submission received: 29 September 2020 / Revised: 20 October 2020 / Accepted: 25 October 2020 / Published: 27 October 2020
(This article belongs to the Special Issue Cardiotonic Steroids: From Toxins to Hormones)

Abstract

:
Stimulus-dependent elevation of intracellular Ca2+ affects gene expression via well-documented calmodulin-mediated signaling pathways. Recently, we found that the addition of extra- and intracellular Ca2+ chelators increased, rather than decreased, the number of genes expressed, and that this is affected by the elevation of [Na+]i/[K+]i-ratio. This assumes the existence of a novel Na+i/K+i-mediated Ca2+i-independent mechanism of excitation-transcription coupling. To identify upstream Na+i/K+i-sensitive genes, we examined the kinetics of transcriptomic changes in human umbilical vein endothelial cells (HUVEC) subjected to Na,K-ATPase inhibition by ouabain or K+-free medium. According to our data, microRNAs, transcription factors, and proteins involved in immune response and inflammation might be considered as key components of Na+i/K+i-mediated excitation-transcription coupling. Special attention was focused on the FOS gene and the possible mechanism of transcription regulation via G-quadruplexes, non-canonical secondary structures of nucleic acids, whose stability depends on [Na+]i/[K+]i-ratio. Verification of the [Na+]i/[K+]i-sensitive transcription regulation mechanism should be continued in forthcoming studies.

1. Introduction

Gene expression is controlled by various stimuli in order to coordinate cellular metabolism and achieve cell-specific responses that ensure cell adaptation to the changed environment [1]. New technologies and approaches, developed over the past 25 years, have led to a more detailed understanding of the mechanisms, which provide different patterns of gene expression, evoked by the multiple stimuli in different types of cells [2]. The transcriptional response is usually very complex and often affects the activity of many hundreds of genes (the so-called transcription program). The response to environmental stimuli typically involves activation of immediate early response genes (the so-called “first wave” of expression) which encode transcription factors that affect activity of other genes (“second wave”). However, it is still difficult to discern the effect of a single stimulus on gene expression, because when applied to a cell the stimulus usually triggers several different signaling pathways that produce multiple messengers, which also induce gene expression.
The electrochemical gradient of Na+ and K+, existing across the plasma membrane in all animal cells, is maintained by Na,K-ATPase (Na-pump). This gradient is used by animal cells to support numerous physiological processes: generation of action membrane potentials (spikes), cell volume regulation, and secondary transport of ions (calcium, proton, phosphate, chloride) and nutrients (amino acids, nucleotides, sugars) [3]. An imbalance of intracellular Na+i and K+i concentrations, in response to different stimuli (e.g., hypoxia, inflammation, osmolality changes of extracellular fluids), can affect transcription and translation processes, thus contributing to the development of various diseases. Indeed, it has recently been demonstrated that an increase in [Na+]i/[K+]i-ratio in various types of cells results in differential expression of immediate early response genes, including FOS [4], as well as cell-specific genes, in particular, Na,K-ATPase α1-, α2-, and α3-subunits [5], tumor growth factor-β, skeletal muscle actin, myosin light chains, atrial natriuretic factor [6], and mortalin [7]. It was initially suggested that the alteration of gene expression caused by an increase in [Na+]i/[K+]i-ratio is associated with a change in the intracellular Ca2+ concentration, which is mediated by Na+/Ca2+ exchanger [8] and/or voltage dependent Ca2+-channels [9]. However, we have recently shown that ouabain, Na,K-ATPase inhibitor, triggers similar gene expression alterations in the presence of Ca2+ channel blockers and extra- and intracellular Ca2+ chelators in rat vascular smooth muscle cells (RVSM), human adenocarcinoma cell line (HeLa), and human umbilical vein endothelial cells (HUVEC) [10].
The data suggest that an increase in [Na+]i/[K+]i-ratio affects gene transcription through Ca2+i-independent mechanism(s), and that alteration of this parameter may be considered as a trigger of gene expression. Dissipation of the Na+i/K+i gradient in endothelial cells can lead to their dysfunction, and thus contribute to the development of cardiovascular diseases. The object of this study was human umbilical vein endothelial cells. These cells are a convenient model for the investigations of pathophysiological aspects that contribute to the development of cardiovascular diseases [11]. Using Affymetrix technology, we tried to identify the first gene targets (upstream genes), whose expression change was induced by the elevation of [Na+]i/[K+]i-ratio. We performed a comparative analysis of time-dependent modulation of the [Na+]i/[K+]i-ratio and transcriptomic changes in HUVEC triggered by ouabain and K+-free medium, i.e., two independent approaches to Na,K-ATPase inhibition, with a final goal of identifying intermediates of the upstream signaling pathway. It is known that ouabain not only inhibits Na,K-ATPase, but, being bound to the pump molecule, also triggers some signaling pathways through protein–protein interactions [12]. This signaling affects gene expression too. We considered the differentially expressed genes common to both stimuli as Na+i/K+i sensitive genes. Our results revealed upstream [Na+]i/[K+]i sensitive gene targets, and allowed us to suggest how they might be regulated by the change in [Na+]i/[K+]i-ratio.

2. Results

2.1. Intracellular Na+ and K+ Content

In order to identify Na+i/K+i sensitive genes, we investigated the kinetics of changes in their expression in endothelial cells in response to an increase in the intracellular [Na+]i/[K+]i-ratio. For this purpose, HUVEC were incubated in the presence of 3 μM ouabain or in K+-free medium for 0.5, 1, 2, and 6 h. Both stimuli provide inhibition of Na,K-ATPase and lead to the dissipation of the transmembrane gradient of monovalent cations.
Figure 1 shows that the dissipation of this gradient develops over time. In both cases (incubation with 3 μM ouabain and K+-free medium) the increase in the intracellular Na+i content was approximately the same. In 6 h of Na,K-ATPase inhibition, this parameter increased five-fold relative to the control. Significant differences in the action of both stimuli were observed in the case of changes in the intracellular K+i content. Thus, a drastic K+i leakage occurred in the K+-free medium in 0.5 h (two-fold); this parameter reached its maximum value (20-fold) in 2 h. In the case of addition of 3 μM ouabain, a dramatic change in the intracellular K+i content was observed in 2 h (three-fold). Both stimuli provided maximum inhibition of Na,K-ATPase in 6 h (Table S1). This significant difference in the dissipation of the monovalent cations’ gradient can be explained by the fact that in the presence of ouabain only Na,K-ATPase is inhibited, while the Na,K,Cl-cotransporter, which provides about 20% of K+ transport into the cell, continues to work. Under conditions where cells are incubated in a K+-free medium, both systems providing intracellular K+ transport cease to function. At the same time, an increase in the intracellular Na+i content leads to a change in the intracellular [Ca2+]i concentration, which mediates the activation of small and intermediate conductance Ca2+-sensitive K+-channels, providing K+i leakage [13].

2.2. Transcriptomic Changes Triggered by [Na+]i/[K+]i-Ratio Augmentation

In the current experiments, we examined the gene expression profile of HUVEC after 0.5, 1, 2, and 6 h of exposure to 3 µM ouabain and K+-free medium. The transcriptomic data obtained in three independent experiments were normalized, and then analyzed by principal component analysis (PCA), as described elsewhere [10]. This approach clearly demonstrated the dissimilarity between different experimental samples (Figure 2). Table 1 shows that 0.5 and 1 h incubation of HUVEC with ouabain resulted in the appearance of 30 and 16 genes, respectively, whose expression was changed by more than 20%, with p < 0.05. The number of differentially expressed genes was sharply increased in 2 and 6 h after ouabain addition (111 and 3415, respectively). With time-dependent inhibition of Na,K-ATPase in K+-free medium, the number of these genes was 64, 219, 507, and 3628, respectively. It can be noted that the number of genes that change their expression, as well as their fold of change, depend on [Na+]i/[K+]i-ratio, as we showed earlier [14,15].
Despite the fact that both stimuli (3 μM ouabain and K+-free medium) lead to the inhibition of Na,K-ATPase in HUVEC, we found some differences in their transcriptomic profiles. Figure 3 shows the distribution of common differentially expressed genes identified in cells exposed to 3 μM ouabain or subjected to K+-free medium vs. control. It is clear that with inhibition of Na,K-ATPase in 0.5 and 1 h, the number of common differentially expressed genes (DEGs) was eight. This value augmented with the increase of inhibition time and amounted to 53 and 2401 DEGs in 2 and 6 h, respectively. Importantly, the transcription changes evoked by ouabain and K+-free medium demonstrated remarkable positive correlation (Figure 4).
Thus, it can be assumed that the effect of ouabain on HUVEC leads to a change in gene transcription, not only mediated by augmentation of [Na+]i/[K+]i-ratio as a result of Na,K-ATPase inhibition. Nevertheless, an increase in [Na+]i/[K+]i-ratio is a sufficient condition for the transcriptomic changes. For the identification of upstream sensors involved in overall transcriptomic changes, we subdivided genes on three time-dependent categories. Early response genes (ERG) were defined as genes whose expression changed in 0.5 or 1 h of Na,K-ATPase inhibition by more than 1.2-fold. Intermediate response genes (IRG) were defined as genes whose expression changed in 2 h by more than 1.5-fold, with the exception of ERG. The rest of the differentially expressed genes detected in 6 h of Na,K-ATPase inhibition were defined as late response genes (LRG).

2.3. Analysis of Early Response Transcriptomic Changes Triggered by [Na+]i/[K+]i-Ratio Augmentation

Table 2 lists common genes whose expression changed by more than 1.2-fold upon inhibition of Na,K-ATPase by 3 μM ouabain and K+-free medium in 0.5 and 1 h (early response genes, ERG). After 0.5 h of Na,K-ATPase inhibition, the expression of the two genes, RNU6-447P and RNU6-747P, was increased. These genes encode U6 small nuclear RNAs which are the key components of spliceosome. Another six common genes showed reduced expression, among them SNORD32B, SNORA20, MLF1, NR4A2, FOSB, and FOS. SNORD32B and SNORA20 encode the corresponding small nucleolar RNAs that are required for the maturation of other RNA molecules [16]. MLF1, NR4A2, FOSB, and FOS encode transcription factors. It should be noted that among these genes there are those that are associated with the regulation of cell passage through cell cycle. The product of MLF-1 inhibits cell cycle passage via a p53-dependent mechanism [17]. In addition, some genes (MLF1, SNORA20) are associated with carcinogenesis, and are considered as tumor markers [18,19,20].
The number of differentially expressed genes increases as [Na+]i/[K+]i-ratio augments (Table 1). In addition, the set of common genes whose expression was triggered by both stimuli was changed. Thus, after 1 h of Na,K-ATPase inhibition, there was a statistically significant increase in EGR1, FOS, LSMEM1, SNORA67, SNORA21, PPP1R10, and WDR47 expression, and a decrease in MIR27B expression. The products of the majority of these genes provide transcription regulation: EGR1 and FOS encode the corresponding transcription factors, SNORA67 and SNORA21 small nucleolar RNAs, and MIR27B encodes microRNAs that are involved in the regulation of gene expression at the post-transcriptional level [21]. Thus, it can be assumed that at the early stages of dissipation of the Na+/K+ transmembrane gradient, the “rearrangement” of the transcription factors system takes place.

2.4. Analysis of Intermediate and Late Response Transcriptomic Changes Triggered by [Na+]i/[K+]i-Ratio Augmentation

After 2-h suppression of Na,K-ATPase by 3 μM ouabain or K+-free medium, a further increase in [Na+]i/[K+]i-ratio occurred, which was accompanied by an increase in the number of differentially expressed genes (Table 1). Among 53 common genes whose expression was evoked by both stimuli (Table S2), we found genes whose products are involved in mRNA splicing and transcriptional regulation (e.g., RNU-1263P, SNORD13E, TSC22D2, SNAPC1, HOXA9), in the formation of pro-inflammatory response (e.g., Il1𝛼, CXCL8, Il1RL1, KITLG), carcinogenesis (e.g., SPRY4, CD274), and intracellular signaling (e.g., OR7E115P, GEM, GPR75, RND3, KITLG). In addition, among them there were genes which encode molecules of the K+-channel, providing K+ entry into cells (KCNJ2), and Ca2+-dependent mitochondrial transporter of metabolites, nucleotides, and coenzymes (SLC25A5). Among the most upregulated genes we found RN7SL600P, RN7SL473P, and RN7SL849P, which are pseudogenes. Their biological functions are multiple, and often not detectable. However, it was shown that pseudogenes can affect chromatin and genomic structural organization, and are involved in the development of human diseases [22]. KEGG analysis showed that intermediate response transcriptomic changes in HUVEC generate a pro-inflammatory response (Figure S1).
A more significant dissipation of the transmembrane gradient of monovalent cations (after 6 h) led to a sharp increase in the number of genes whose expression was altered by more than 1.2-fold. Annotation of differentially expressed late response genes on the KEGG database demonstrated signaling pathways which respond for cell death activation (Figure S1). Thus, we could identify a general transcriptomic changes trend, depending on [Na+]i/[K+]i-ratio. Intermediate response genes are involved in the formation of a pro-inflammatory response and, possibly, in the reorganization of the chromatin structure. The late response genes set is characterized by an increase in the expression of proapoptotic factors, in contrast to the early response genes, among which there are those which encode proteins controlling cell division and also preventing apoptosis. Table 3 lists the top 10 intermediate and late response genes.

2.5. FOS Is a Conceivable Upstream Na+i/K+i-Sensitive Gene

The main question that arises during the study of Na+i/K+i sensitive genes is: how do these cations regulate gene expression or, in other words, through which regulatory elements of DNA can Na+i/K+i-dependent transcriptomic changes occur? We focused our attention on the so-called G-quadruplexes, non-canonical secondary structures formed by guanine-rich regions of nucleic acids. It is known that G-quadruplexes are widespread in the genomes of prokaryotes and eukaryotes. It is assumed that they are involved in the regulation of transcription. It was also shown that their structure is stabilized by the monovalent cations, and that this depends on the ion radius in the following sequence K+ > Na+, NH4+ > > > Li+ [23]. Thus, it cannot be ruled out that an increase in [Na+]i/[K+]i-ratio leads to destabilization of these structures, and to subsequent transcriptomic changes. We examined early response genes (Table 2) for the possible presence of G-quadruplexes within their sequences. Using G4Catchall, an online tool for prediction of G-quadruplexes, we found that, hypothetically, these structures could be formed within FOS, FOSB, LSMEM1, PPP1R10, WDR47, EGR1, NR4A2, and MLF1 genes, in 1–16 regions (Table 4 and Table S3).
The FOS gene deserves special attention in this list. In the initial experiments, we observed that [Na+]i elevation in HUVEC results in rapid accumulation of the RNAs encoding FOS [24]. In addition, according to our previous data, FOS expression in C2C12 myotubes occurs in a Ca2+i-independent manner [25]. These results, as well as early reports on Ca2+-independent FOS expression in RVSMC [4] and HeLa cells [26], allowed us to conclude that, along with canonical Ca2+i-mediated signaling, sustained elevation of [Na+]i/[K+]i-ratio affects gene transcription via unknown Ca2+i-independent mechanism(s). In this study, FOS expression decreased in cells in 0.5 h of exposure to 3 µM ouabain and K+-free medium. It began to increase in 1 h of Na,K-ATPase inhibition (the fold of change increased from −1.73 to + 1.96, and from −2.17 to 2.52, respectively). A further augment in [Na+]i/[K+]i-ratio in the presence of 3 µM ouabain elevated the expression of FOS. A similar, but more significant change in its expression was detected in the K+-free medium. Conversely, the time-dependent monovalent cations gradient dissipation in this case was accompanied by an increase in FOS expression for 1–2 h, and a subsequent decrease in its expression for 6 h (Table 5). FOS gene is an immediate early response gene, its protein products form one of the subfamilies of the AP-1 transcription factors family [27]. Transcription of a number of genes is carried out via FOS. Our study shows that FOS gene can be considered as an upstream Na+i/K+i sensitive gene. Indeed, at the early stages of Na+i/K+i gradient dissipation, a number of genes are controlled by FOS (Figure 5). Furthermore, their number and fold of change correlate with the [Na+]i/{K+]i-ratio. As mentioned above, FOS transcription decreased in 0.5 h of Na,K-ATPase inhibition in both cases. It should be noted that the total number of differentially expressed genes in ouabain-treated cells decreased in 1 h compared to 0.5 h of incubation (Table 1).
Figure 5 illustrates the network visualization of potential transcriptional regulation by FOS in HUVEC, triggered by Na,K-ATPase inhibition. As we can see, the 0.5 h HUVEC exposure to 3 µM ouabain downregulates FOS, FOSB, MLF1, and NR4A2 (Table 2). In agreement with the transcriptional regulation network, these genes, including FOS, are regulated by FOS (Figure 5A). A similar situation is observed when cells are subjected to the K+-free medium (Table 2). However, in this case, the number of genes regulated by FOS is much larger (Figure 5B). Further augmentation of [Na+]i/[K+]i-ratio upregulates FOS expression, and leads to the multiplicity of early response genes set, regulated by FOS (Table 2, Figure 5B,C).

2.6. Activation of Signaling Pathways Involving Act, CREB, JNK, and ERK

In the current study, we also analyzed the activation of signaling pathways involving protein kinase B (Akt) and its target, the transcription factor CREB. It is known that activation of these signaling pathways leads to cell survival. In our experiments, we observed an increase in Akt phosphorylation at Ser473 with an increase in [Na+]i/[K+]i-ratio starting at 0.5 h of expose in the presence of ouabain and in K+-free medium; however, in 6 h the level of phosphorylation of this kinase significantly decreased (Figure 6A). Drastic activation of CREB, as in the case of Akt, occurred after 2 h of the Na+i/K+i gradient dissipation, then the level of CREB phosphorylation also decreased (Figure 6B). Considering these data, it may be assumed that signaling pathways ensuring cell survival are activated at the early stages of dissipation of the gradient of Na+ and K+ ions.
It is well documented that the c-Fos/c-Jun complex becomes active under c-Fos and c-Jun phosphorylation by mitogen-activated protein kinases (MAPK), such as ERK and JNK [28,29]. MAPK/ERK and MAPK/JNK signaling pathways are essential for cellular responses to different stimuli [30]. Ouabain-induced activation of this signaling has been shown [31]. We observed that JNK increasing phosphorylation occurred in HUVEC treated by 3 µM ouabain for 0.5, 1, and 6 h. At the same time, the 2-h exposure of cells to ouabain did not have a similar effect (Figure 6C). On the contrary, in cells subjected to the K+-free medium, JNK activation was observed in 0.5, 1, and 2 h, but not in 6 h (Figure 6C). The most obvious activation of JNK in HUVEC was detected in 2 h in K+-free medium and in 6 h in the presence of ouabain. These data correlate with FOS gene expression changes (Table 5). Besides this, we may conclude that the observed effects were not primarily mediated by dissipation of the Na+i/K+i gradient. ERK activation was marked in ouabain-treated cells in 0.5, 2, and 6 h (Figure 6D). Incubation of cells in K+-free medium led to increased ERK phosphorylation in 1, 2, and 6 h (Figure 6D). It should be noted that in 0.5 h of [Na+]i/[K+]i-ratio augmentation, caused by both stimuli, no significant ERK phosphorylation was detected (Figure 6D). Our recent findings showed that ERK, JNK, and CREB are implicated in Ca2+-independent signaling [25]. Summarizing these data, it may be assumed that FOS gene expression at the early stages of monovalent ions transmembrane gradient dissipation is regulated directly by [Na+]i/[K+]i-ratio changes. JNK and ERK kinases, most likely act indirectly, and display a cumulative effect in this case.
Thus, we can speculate that FOS is a potential Na+i/K+I sensitive upstream gene, responsible for the subsequent transcriptomic changes in HUVEC.

3. Discussions

Numerous studies have shown that inhibition of Na,K-ATPase, resulting in the elevation of [Na+]i/[K+]i-ratio, leads to the alteration of gene expression in various types of cells. Among them were found RVSM, HUVEC, HeLa [10], cardiomyocytes [6], renal epithelial cells [32], hepatocytes [33], and neuronal cells [34]. Treatment of these cells by ouabain at concentrations that completely inhibit Na,K-ATPase induces expression of immediate early response genes, in particular, 
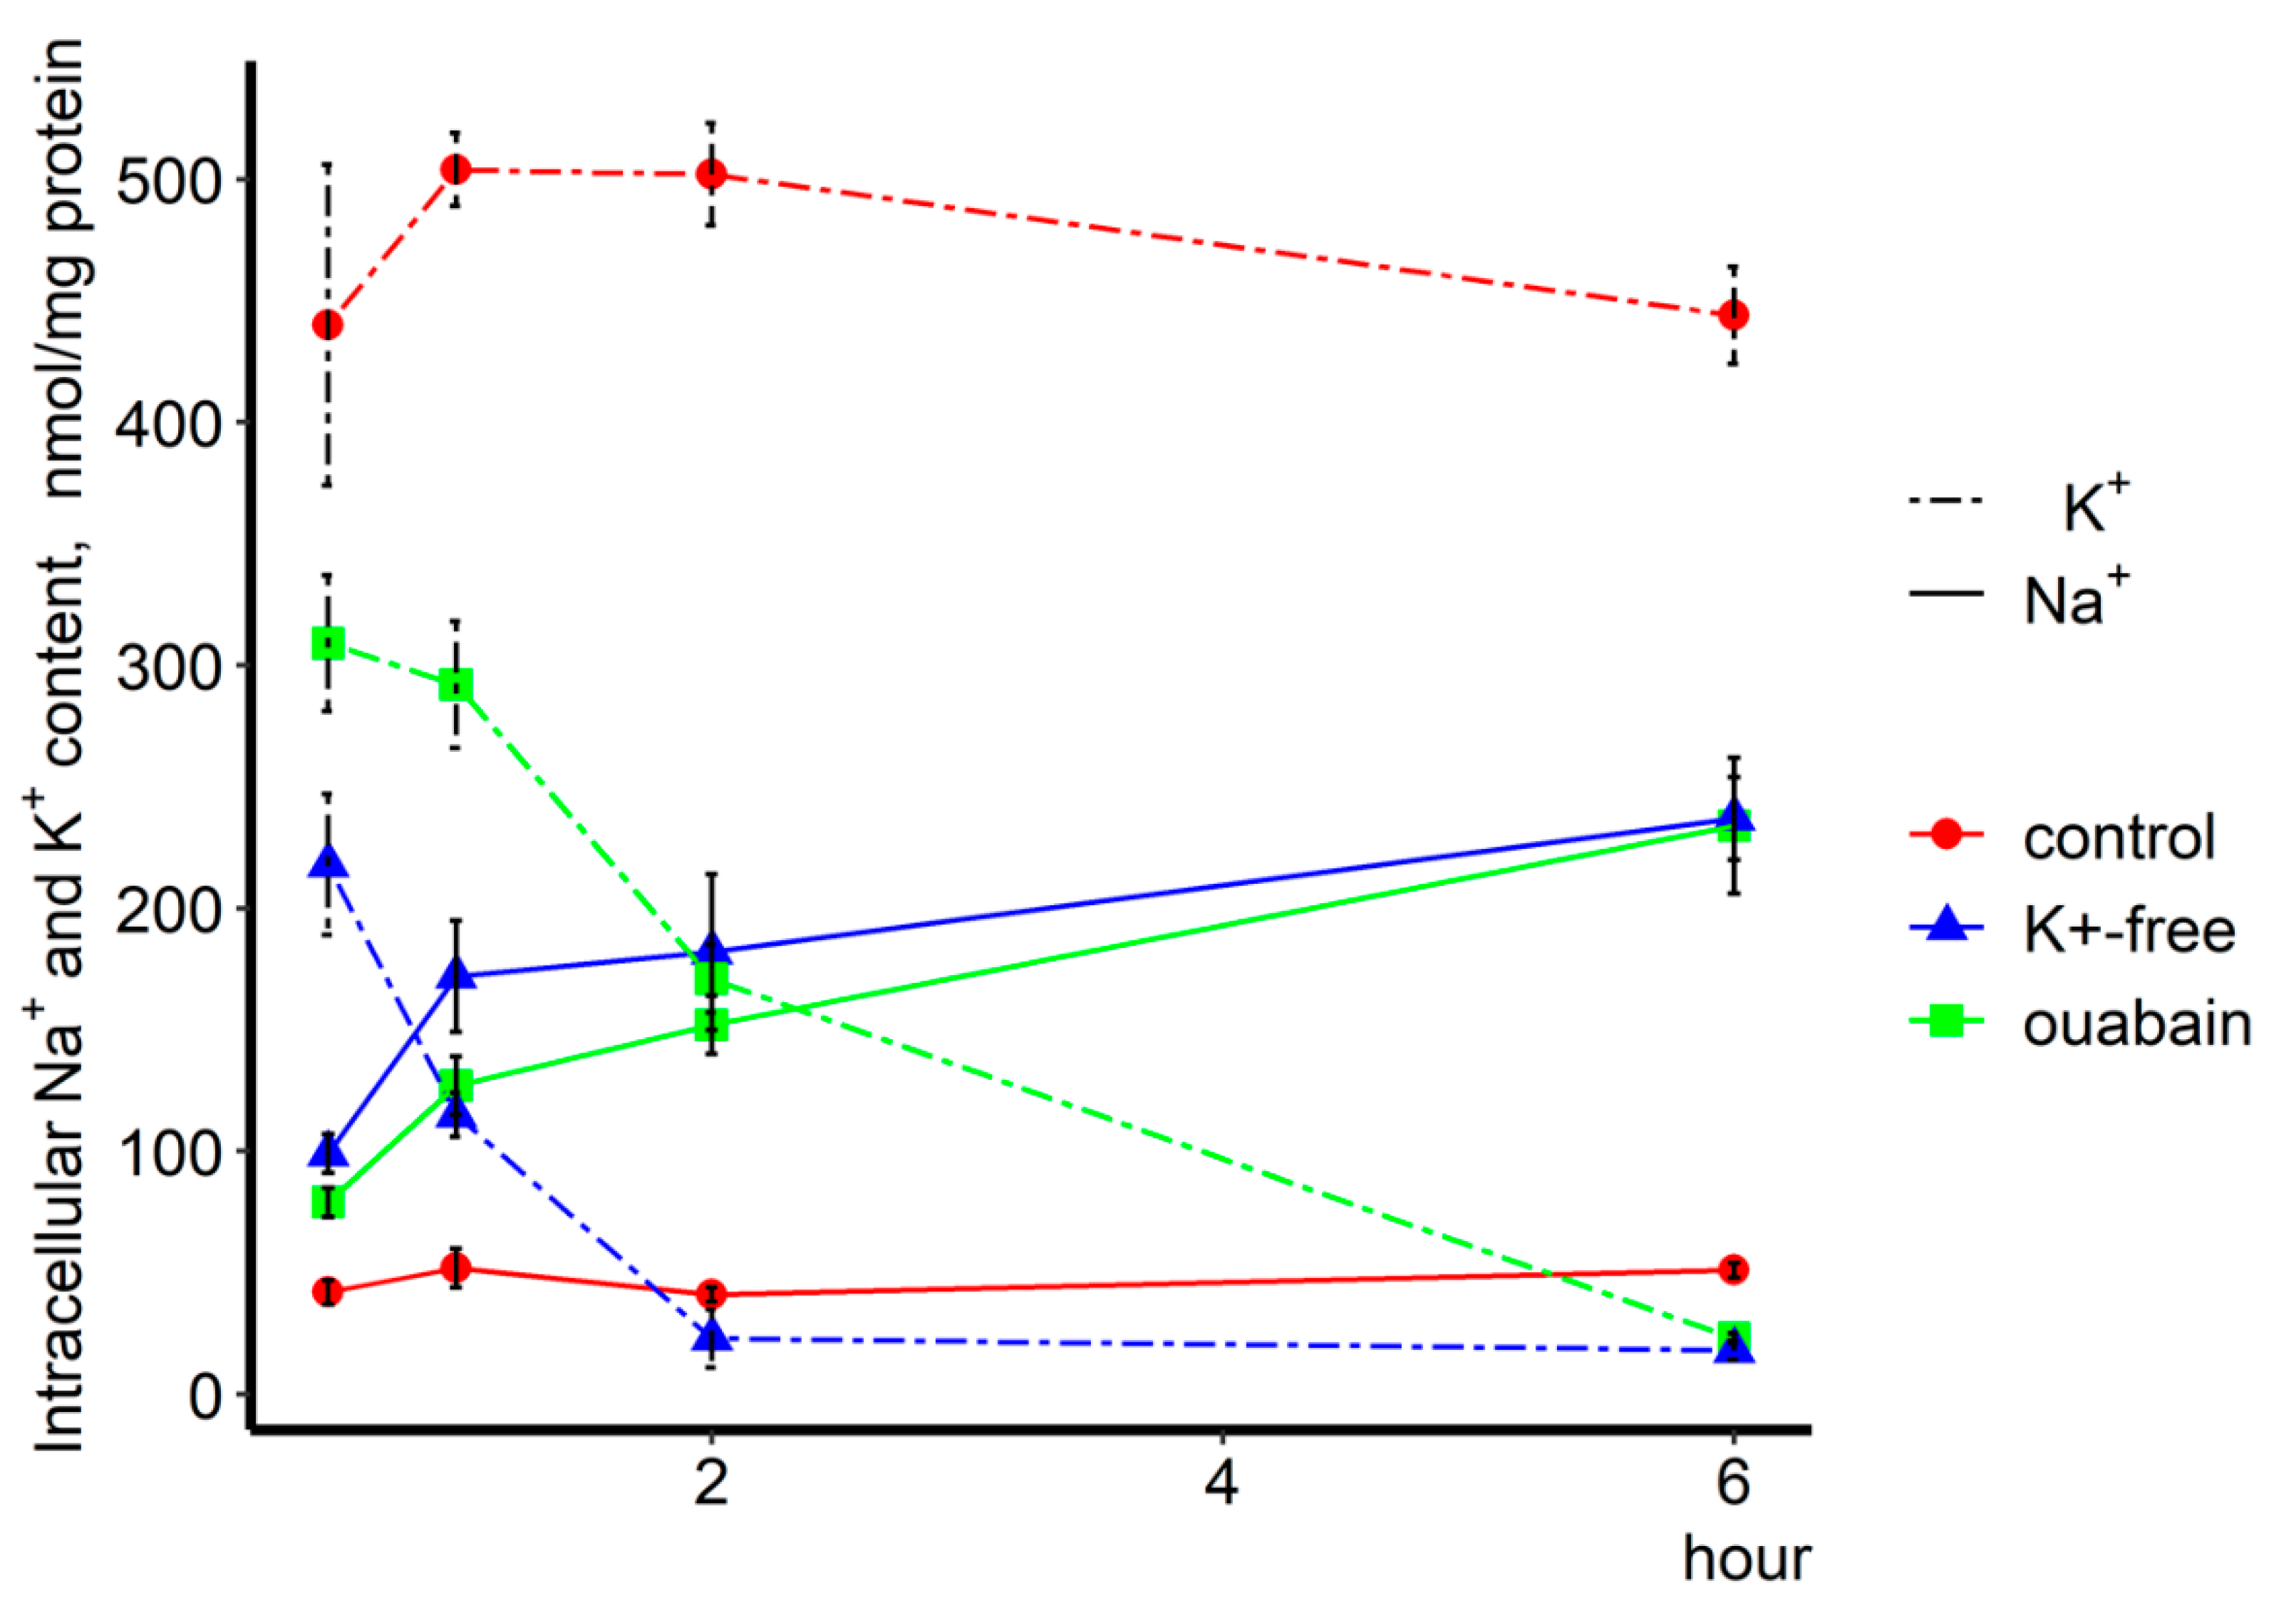
FOS. In this study we confirmed that 0.5–6 h incubation of HUVEC with ouabain or K+-free medium, i.e., two independent approaches to Na,K-ATPase suppression, affects gene expression. These transcriptomic changes are accompanied by the gain of Na+i and loss of K+i, thus suggesting a key role of [Na+]i/[K+]i-mediated, rather than [Na+]i/[K+]i-independent, signaling.
According to the currently accepted paradigm, inhibition of Na,K-ATPase by ouabain and subsequent increase of [Na+]i/[K+]i-ratio results in the elevation of intracellular Ca2+ concentration, through the activation of Na+/Ca2+ exchanger [8], or conductivity of L-type voltage-gated Ca2+-channels [9]. Both types of these transporters were found in endothelial cells [35]. It is known that increase of Ca2+i, in turn, controls gene expression, mainly by CaMKI (II, III)/NFκB, calcineurine/NFAT, and CaMKII (IV)/CREB signaling pathways [36]. However, we previously found that Ca2+ depletion, triggered by addition of extra-and intracellular Ca2+ chelators, increased rather than decreased the number of ubiquitous and cell-type specific Na+i/K+i sensitive genes in RVSM, HeLa, and HUVEC. These results as well as early reports of Ca2+-independent c-Fos expression in RVSMC [4] and HeLa cells [26] allowed us to conclude that, along with the canonical Ca2+i-mediated signaling, a sustained increase in [Na+]i/[K+]i-ratio affects gene transcription via unknown Ca2+i-independent mechanism(s).
Another method of gene expression activation by ouabain was disclosed by Xie and Askari for cardiomyocytes [12]. They demonstrated that after ouabain binding to Na,K-ATPase, the enzyme interacts with membrane protein-partners that, in turn, trigger signal cascades. The signaling pathways start from the interaction of Na,K-ATPase with Src kinase, phosphorylation of the epidermal growth factor receptor, and consequent activation of Ras and p42/44 mitogen-activated protein kinases.
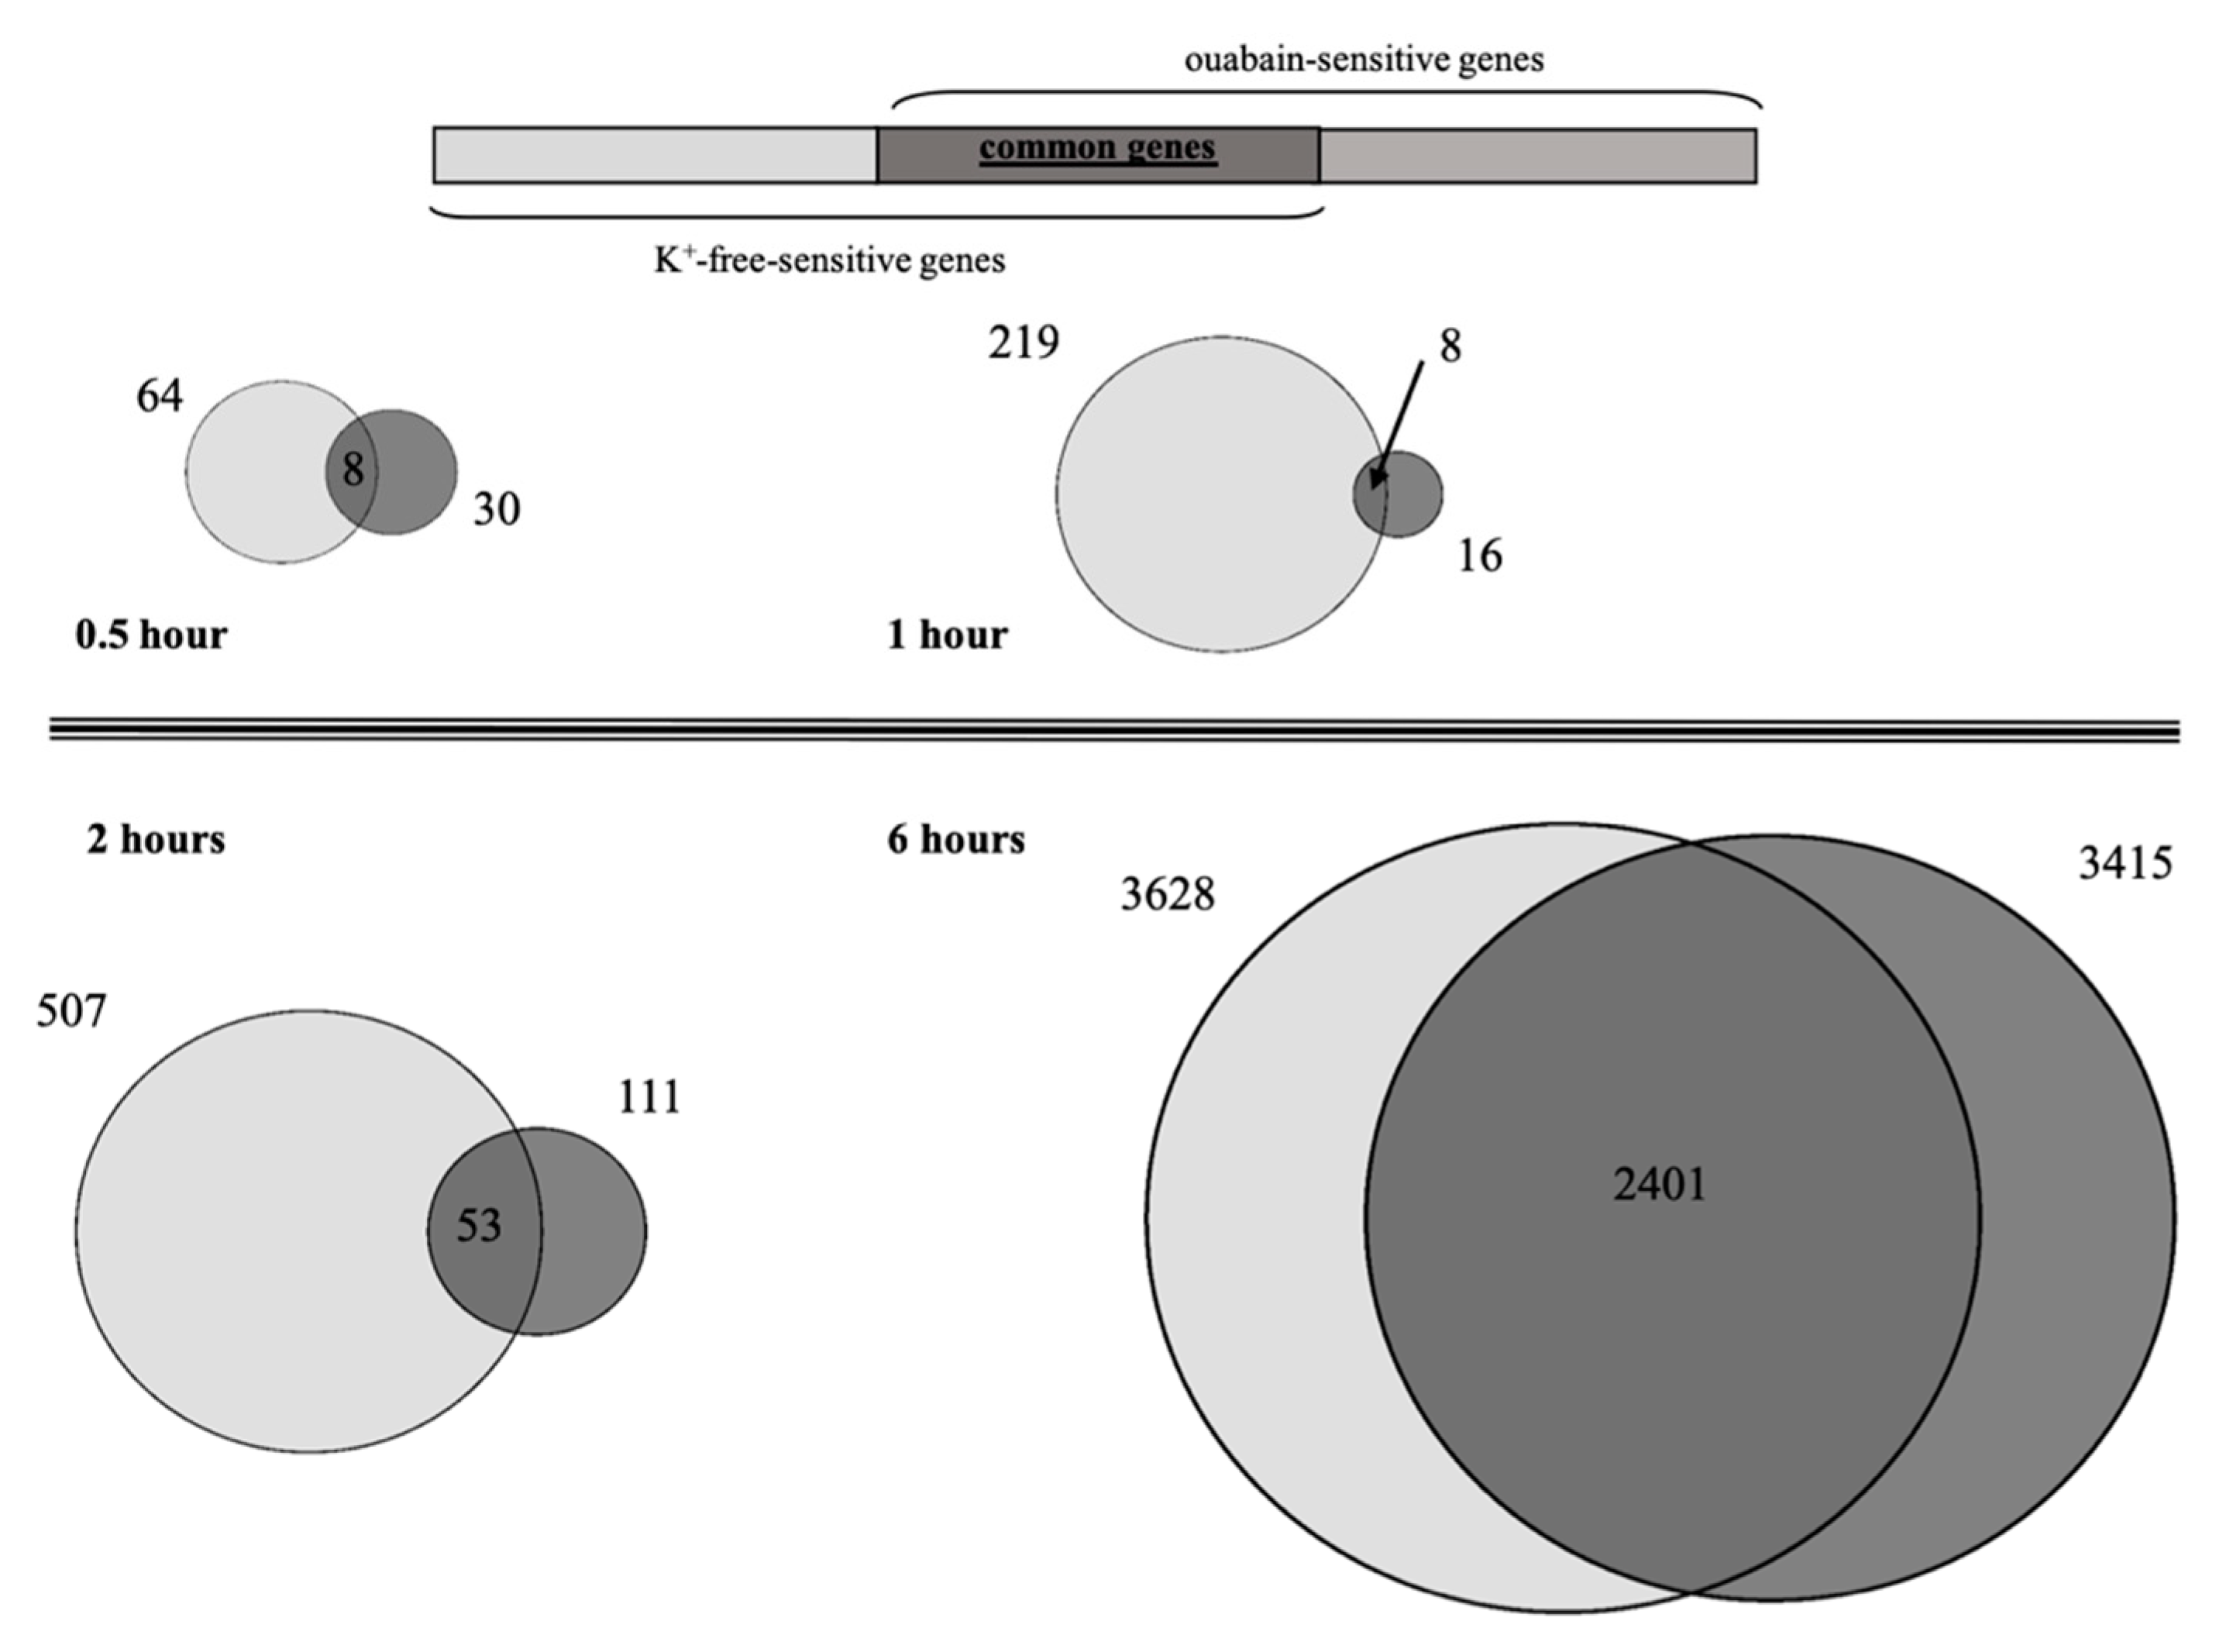
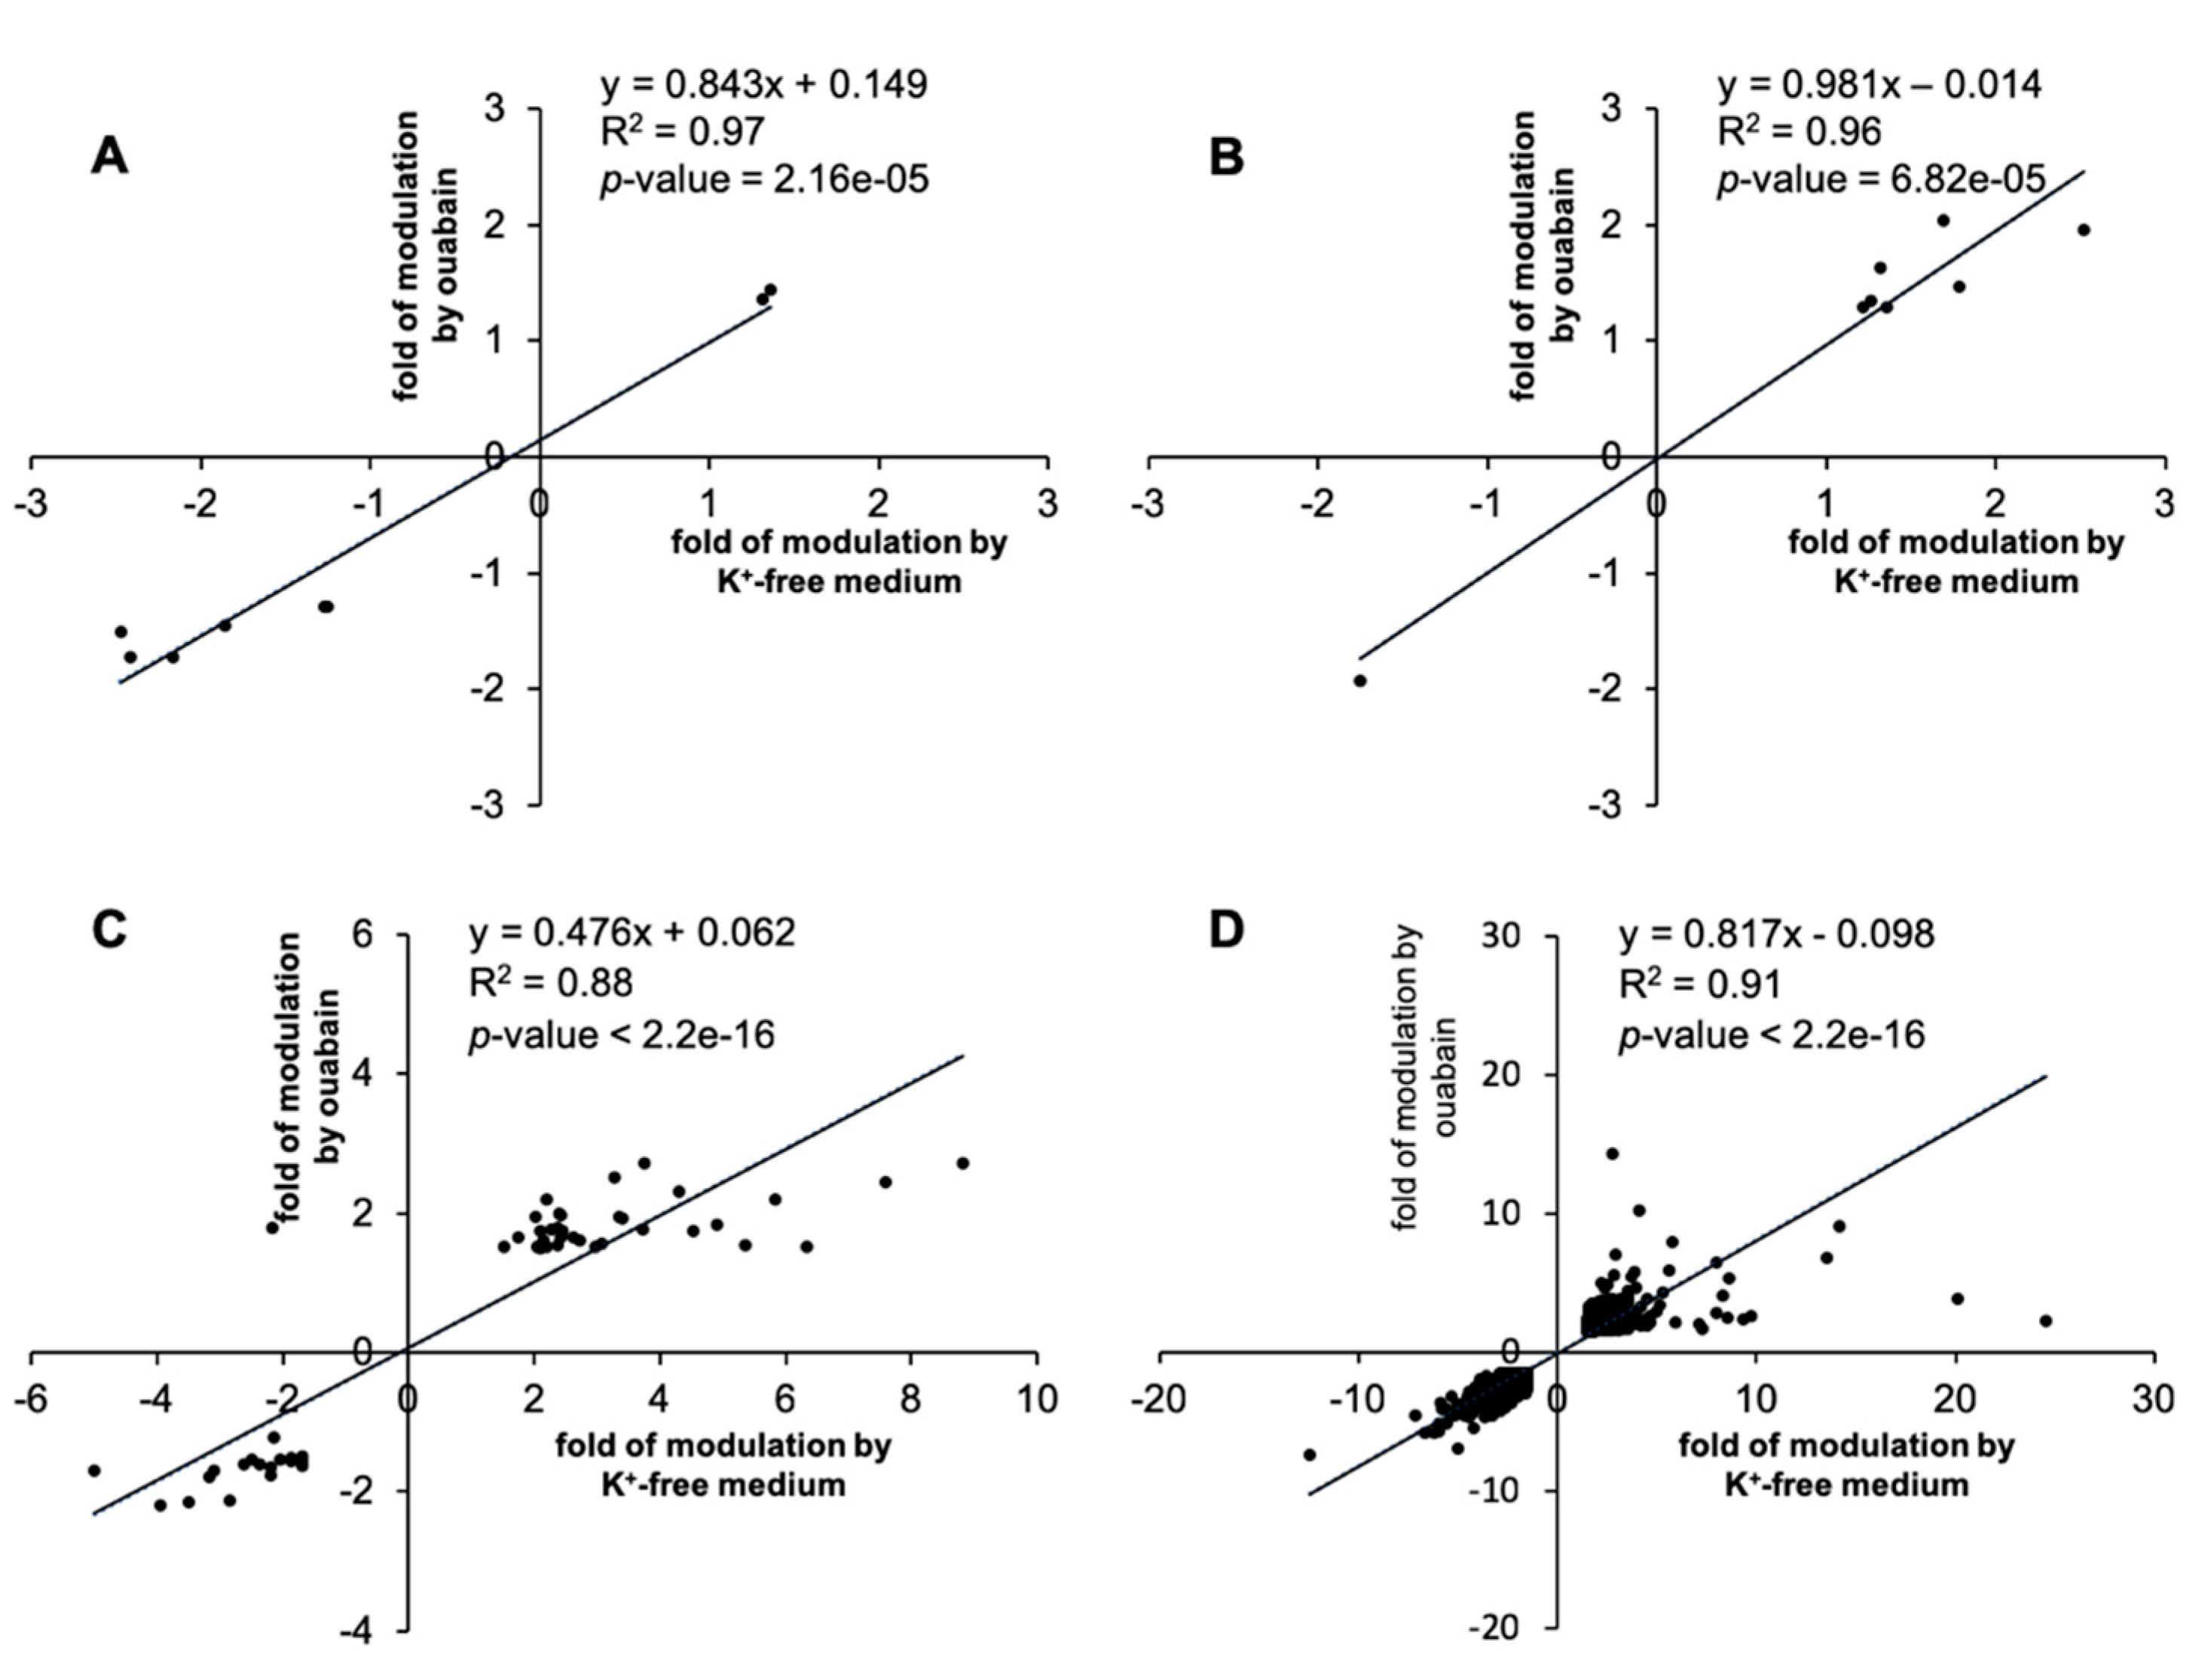
Taking into account that ouabain itself can evoke signaling pathways that affect gene expression, we compared transcriptomic changes triggered by ouabain and K+-free medium. Thus, we were able to identify common genes, whose expression is caused by both stimuli and mainly depends on changes in [Na+]i/[K+]i-ratio (see Figure 3). This suggests that in both cases, there was basically a common (identical) trigger for the transcriptomic changes.
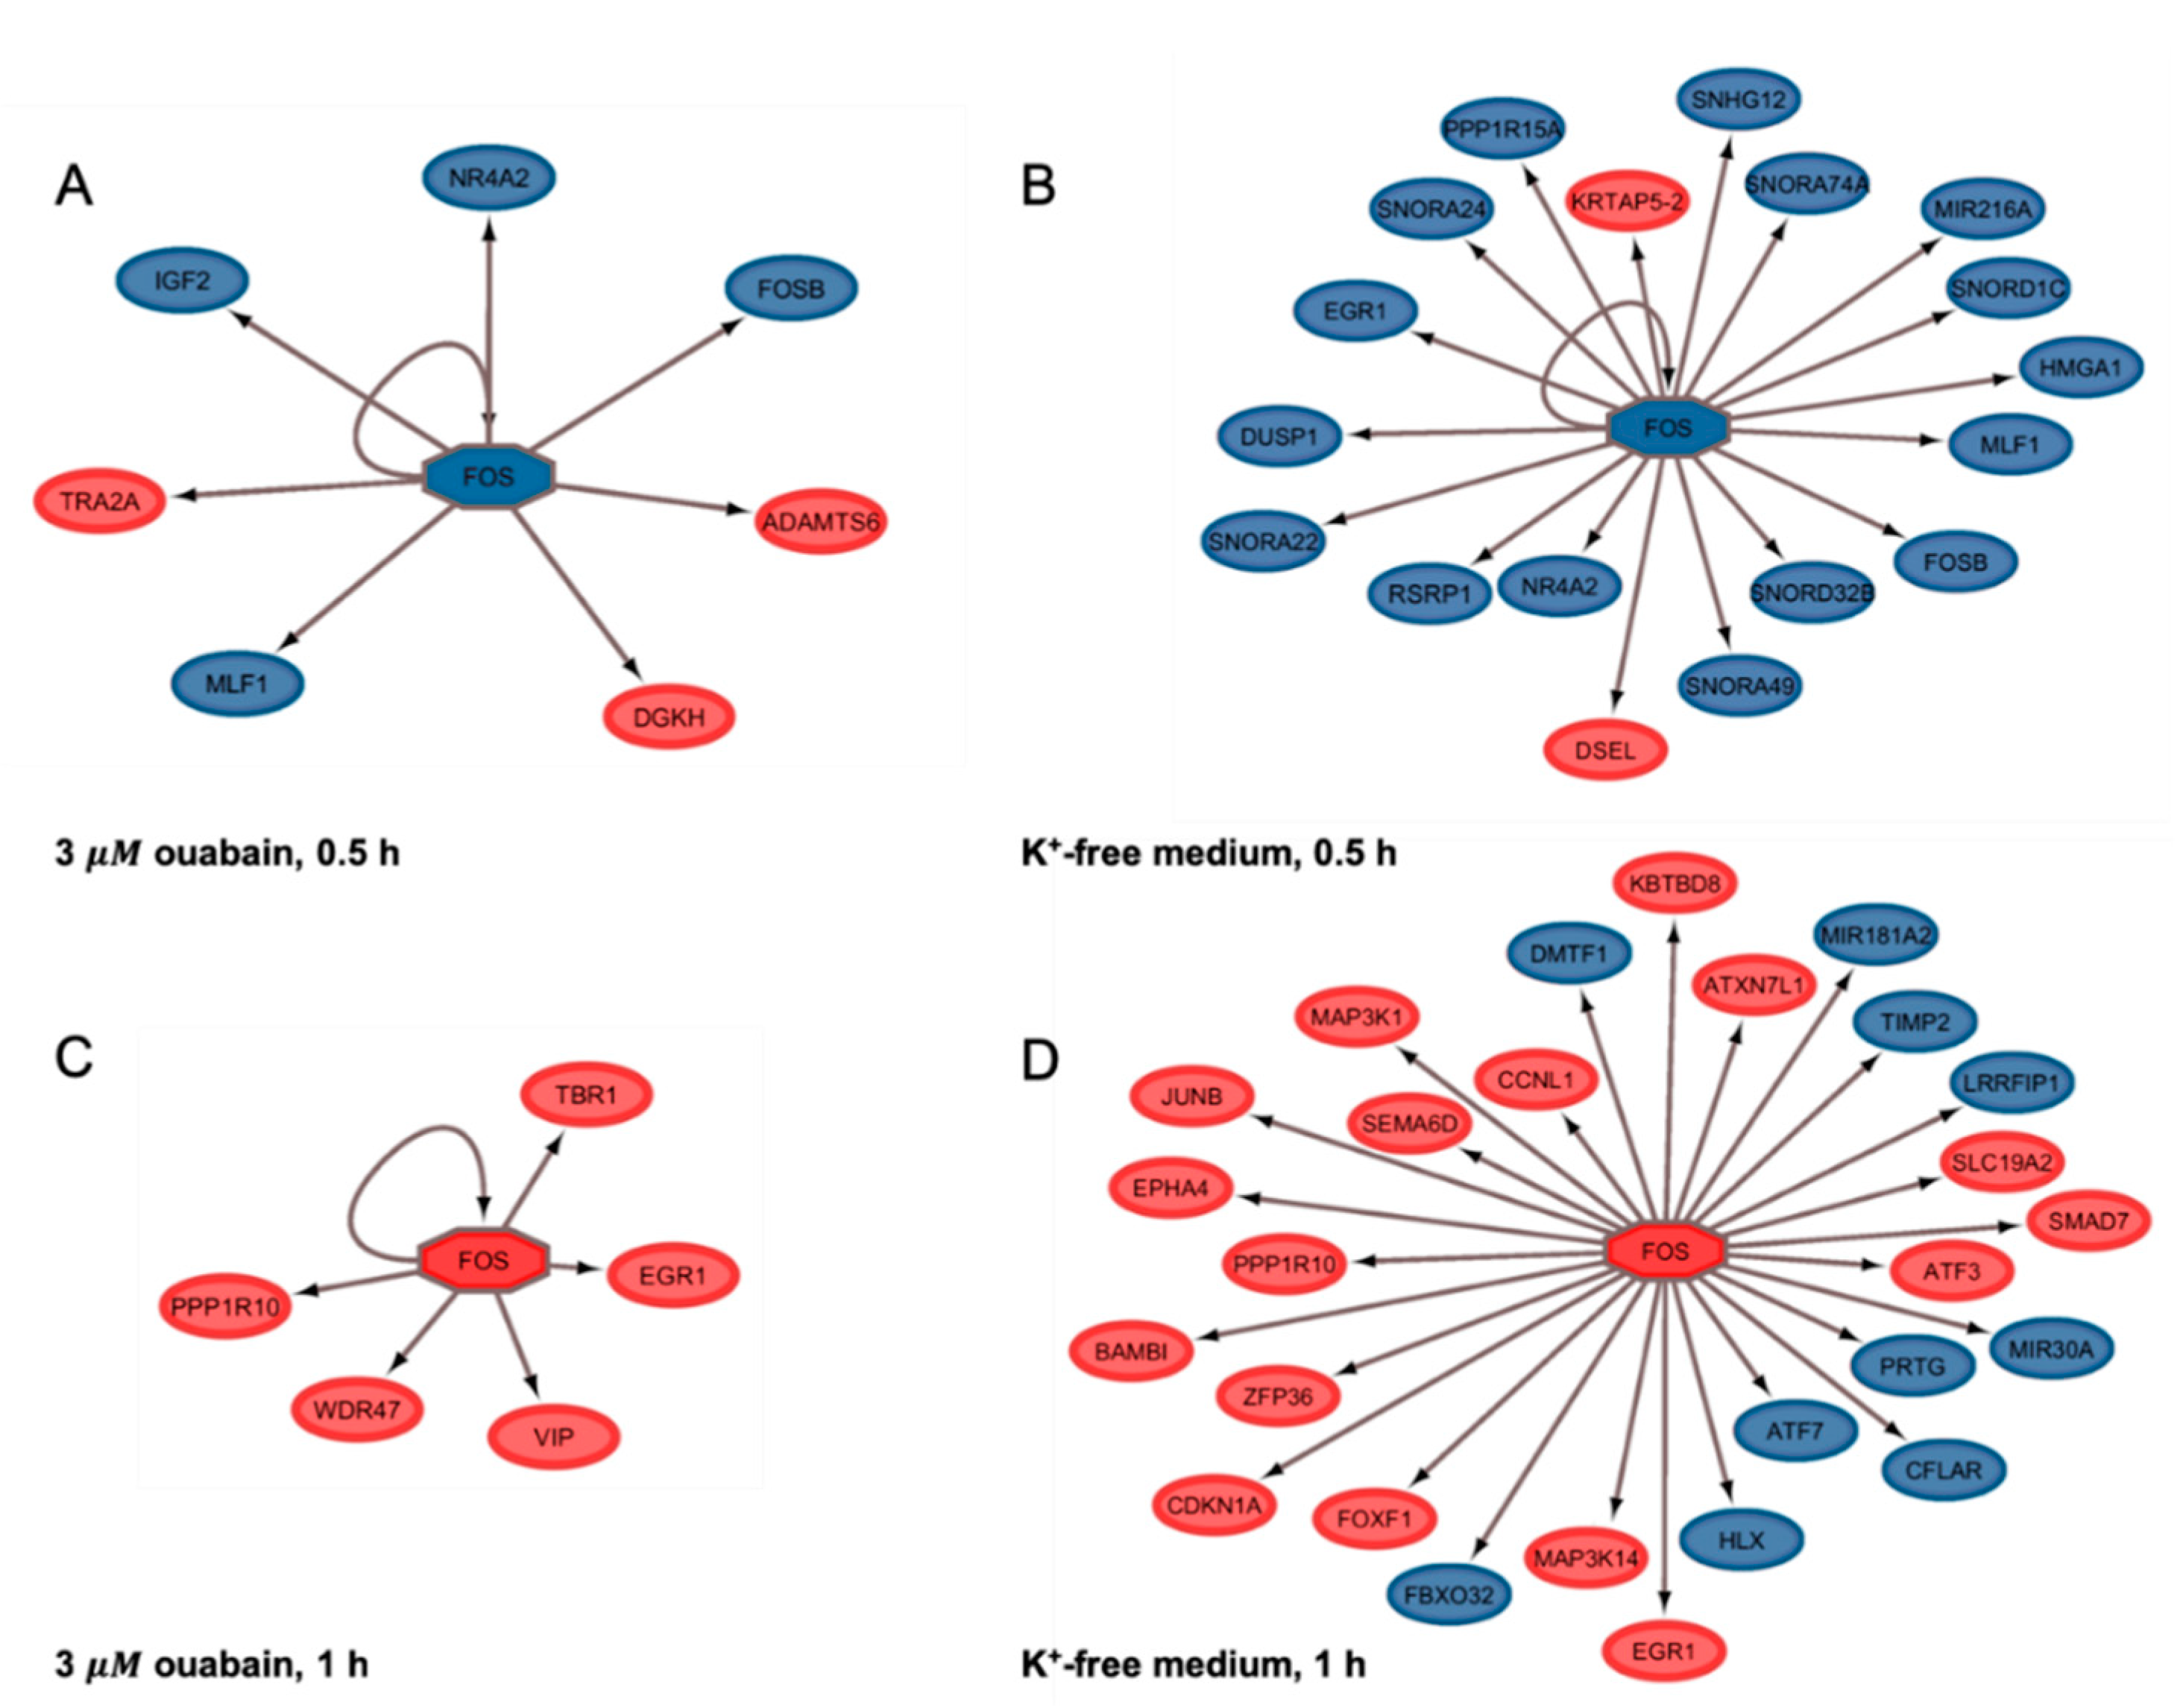
The main goal of this study was to reveal upstream Na+i/K+i sensitive genes, namely, the genes that are the first targets of a trigger that induces the alteration of gene expression. We found that eight common, differentially expressed, genes were the same for both stimuli after 0.5 h of Na,K-ATPase inhibition by ouabain or in K+-free medium (Table 3). Furthermore, all of them have a similar expression pattern (activation or suppression). After 1 h of Na,K-ATPase inhibition, we also detected only eight common genes with a similar expression pattern for both stimuli. However, the set of common genes at this time point was altered compared to the set found after 0.5 h of Na,K-ATPase inhibition. The expression of seven of these genes was increased, while the expression of only one of them was decreased (Table 3). The sets and expression patterns of the eight revealed common genes, triggered after 0.5 and 1 h of Na,K-ATPase inhibition, were the same, and did not depend on whether inhibition was produced by ouabain or K+-free medium. Thus, we can conclude that these transcriptomic changes are triggered by the common (identical) starting stimulus, namely, the alteration of [Na+]i/[K+]i-ratio.
All genes whose expression changed after 0.5 and 1 h of Na,K-ATPase inhibition are “first wave” genes that are necessary for the alteration of the expression of other genes. Among their products we can see RNAs required for splicing, small nucleolar RNA, microRNAs which are involved in the regulation processes at the post-transcriptional level, and proteins which are transcriptional regulation factors. The data demonstrating that expression of some of them (e.g., FOS and FOSB) was downregulated after 0.5 h and then upregulated later, apparently demonstrates that during the first hour after Na,K-ATPase inhibition we observed the “reorganization” of the expression pattern of cells.
Special attention was focused on the FOS gene. This gene encodes one of the immediately expressed transcription factors, which induce a “second wave” of gene transcription. The FOS gene product (c-Fos protein) is a member of the leucine zipper proteins family, which, as homo- or heterodimers, bind to a specific region of double-stranded DNA, and which leads to varying effects on transcription. It is believed that c-Fos acts by combining short-term extracellular signals with long-term changes, through coordinated changes in the expression of target genes. Curiously, c-Fos is currently considered as a marker of neuronal activity [37]. It is known that neuronal activity is coupled with a significant change of [Na+]i/[K+]i-ratio. Activation of FOS expression was also observed in contracting C2C12 myotubes, where it also correlates with an increase in this parameter [38]. We have previously shown that FOS gene expression occurs via Ca2+-independent mechanism(s) [4,25]. It should be noted that this phenomenon was also noticed earlier. For example, Nakagawa et al., in the experiments with deletion within FOS gene promoter, have demonstrated that expression of this gene is mediated by ouabain via Na,K-ATPase inhibition, regardless of the cAMP/Ca2+ response element ability [39]. In another study, these authors noted that ouabain-induced FOS gene expression is due to intracellular monovalent cations perturbations [40].
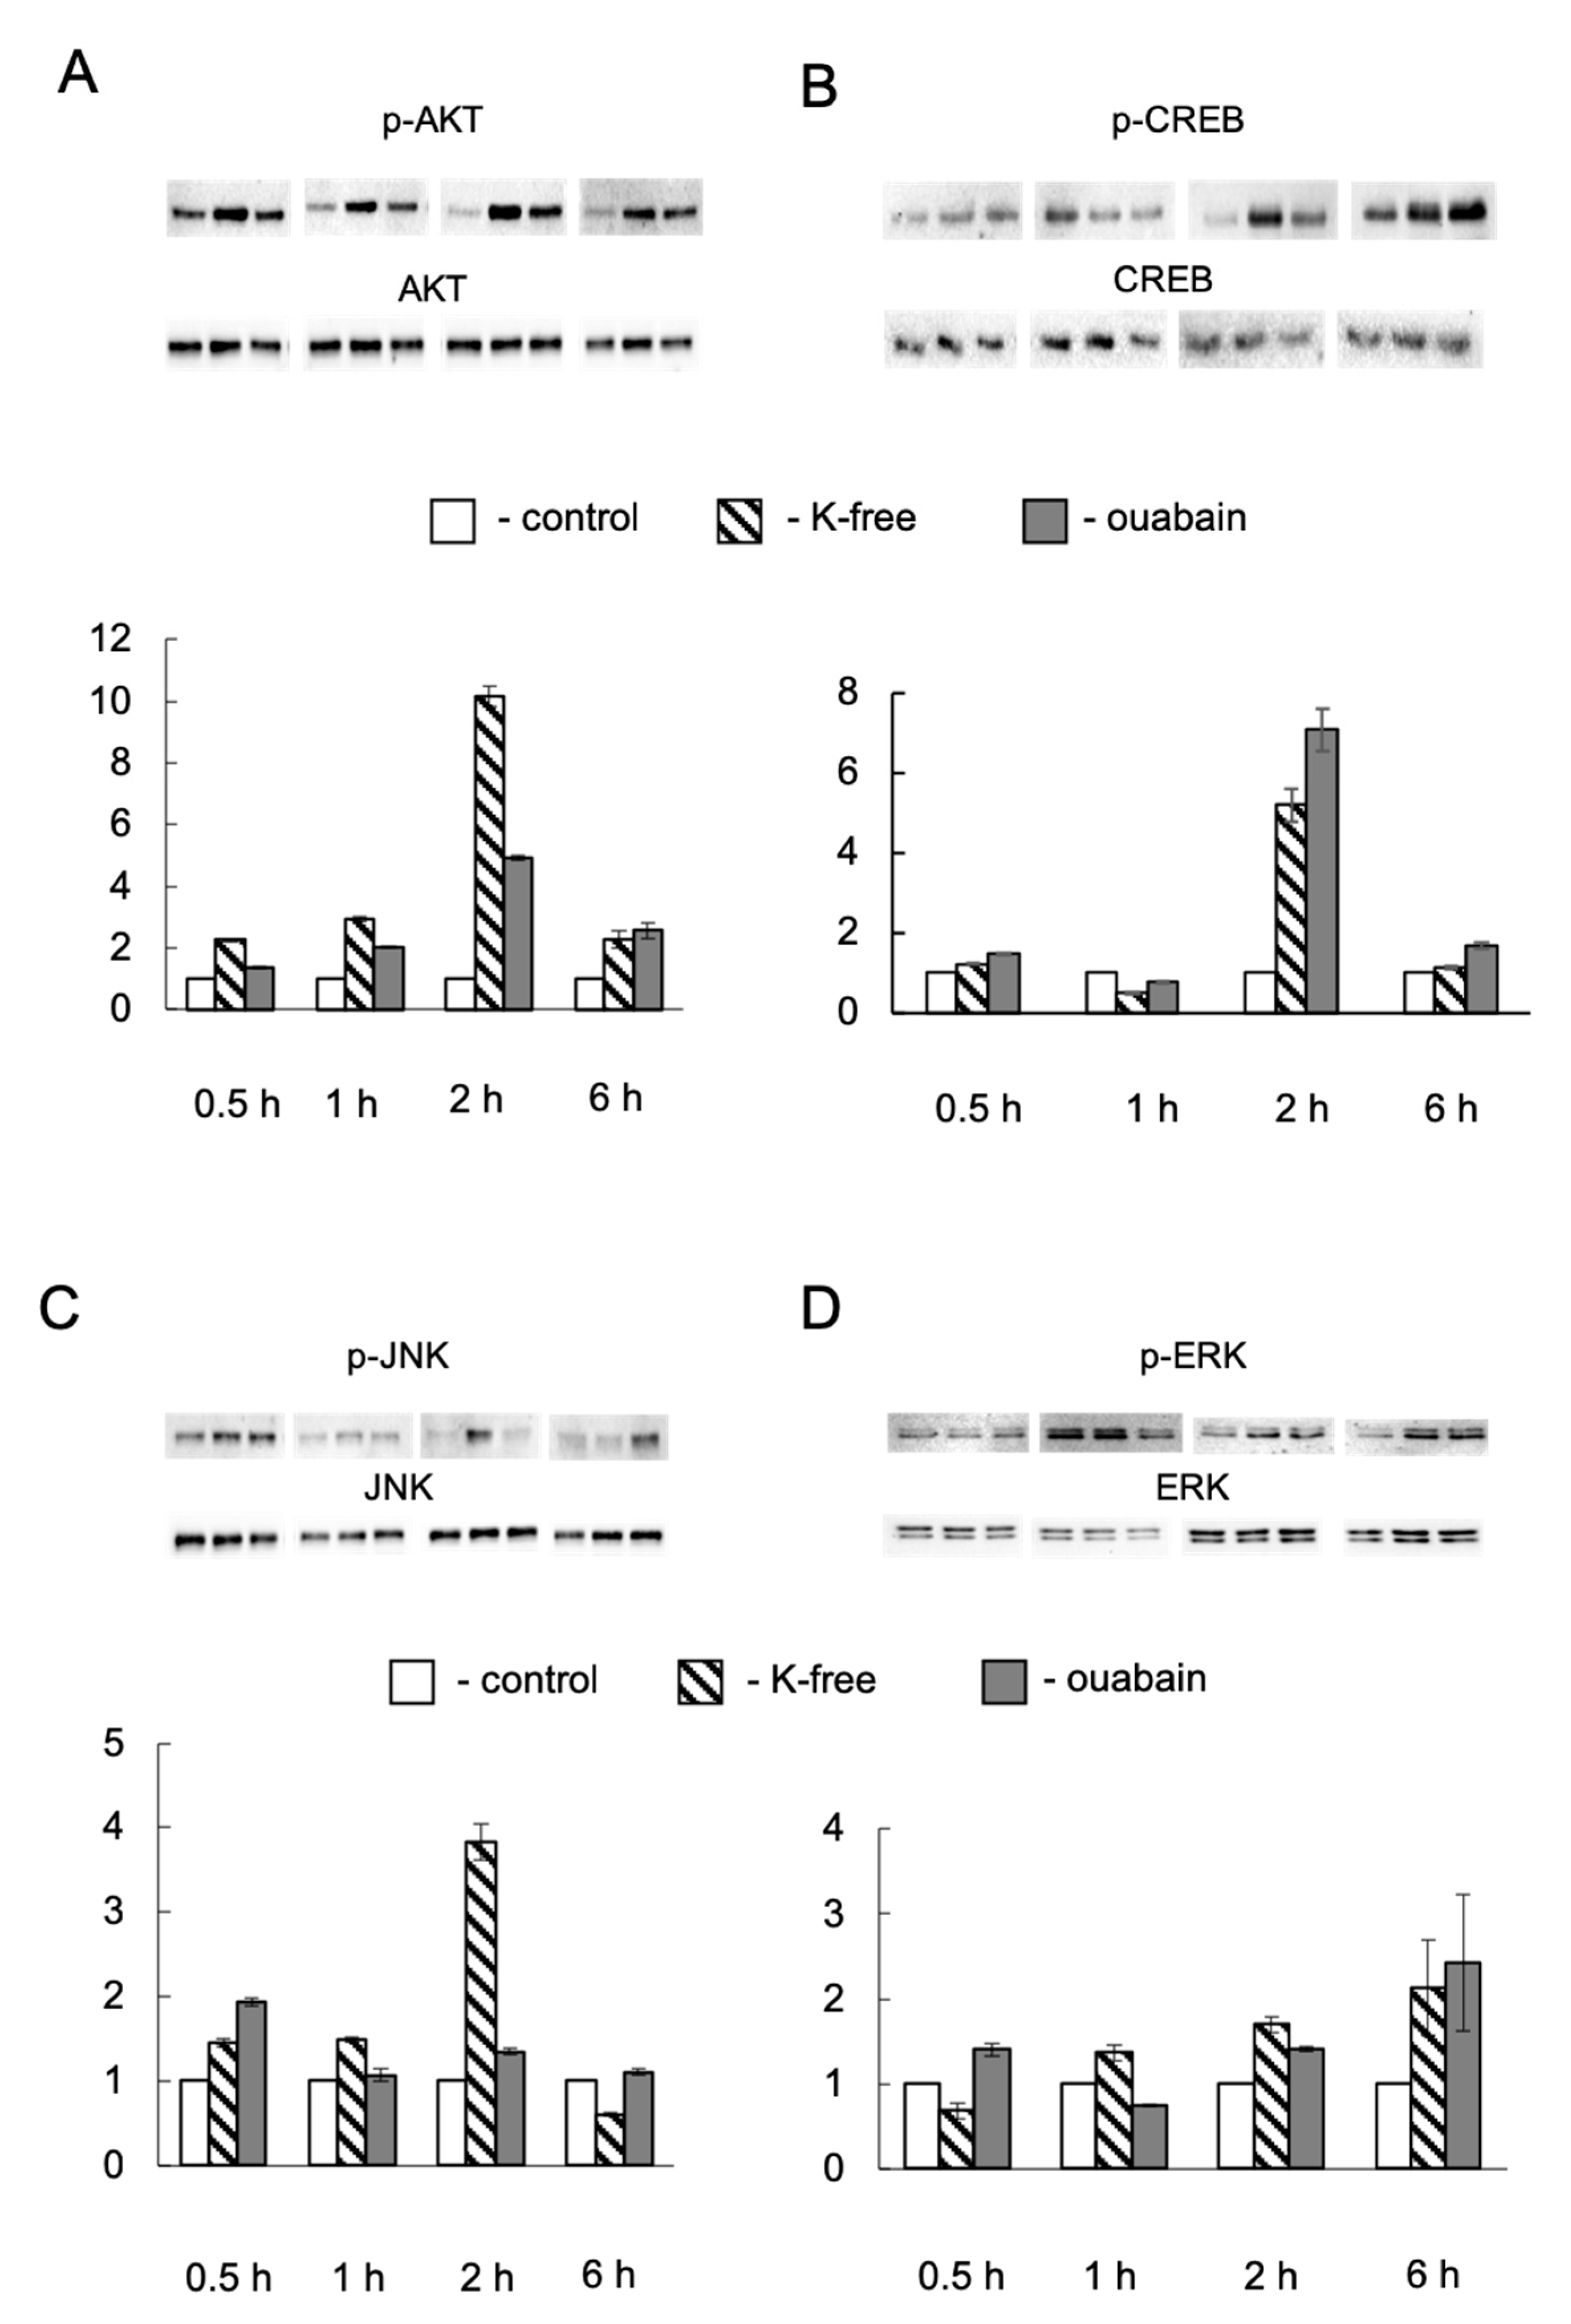
The c-Fos proteins form heterodimers with Jun family proteins, and thus regulate transcription of many cellular genes through mitogen-activated protein kinases (MAPKs). It is known that Akt modulates FOS gene transcription [41]. It has also been shown that FOS gene promoters contain a serum response element (SRE) and a Ca2+/cAMP response element (CRE), which are activated by [Ca2+]i increments in the cytoplasm and nucleus, respectively [42], as well as protein kinase B (Akt) and its target, the transcription factor CREB. Our data demonstrated CREB activation only in 2 h of Na,K-ATPase inhibition. Thus, we can assume that in the early stages of Na+i/K+i gradient dissipation, the coordination of the transcription factors network is likely to occur, which, probably, is not mediated primarily by Ca2+ signaling.
It is well known that monovalent ions intracellular concentrations change temporarily in response to various stimuli. Orlov and Hamet have formulated a hypothesis which proposes monovalent ions as secondary messengers [43]. Data on monovalent cation intracellular sensors has been reviewed in recent publication [44]. In our opinion, G-quadruplexes are the most suitable candidate for this role [45]. These structures are abundant in the human genome and formed within guanine-rich regions of nucleic acids, DNA, and RNA. It was also shown that their structure is stabilized by monovalent cations [23]. Telomeres and the promoter region of genes are the main locations of DNA G-quadruplexes [46]. The formation, or the reorganization, of these structures within gene promoters can affect transcription processes sterically. We speculate that Na+i/K+i imbalance mediates transcriptomic changes directly, via change of DNA conformation G-quadruplexes. Sen and Gilbert were the first to show that the ratio of Na+ and K+ ions is critical for the DNA G-quadruplexes’ formation, the so-called “sodium–potassium switch” [47]. These non-canonical structures occur in promoters of oncogenes, such as MYC, MYB, FOS, and ABL [48]. In addition, experimental data show that G-quadruplexes are more frequent in cancer cells in comparison with normal cells [49]. In this regard, these structures are currently considered as molecular anti-cancer targets. It is worth mentioning that viruses also have G-quadruplexes in the regulatory regions of the genome, which are the anti-viral targets [50]. These observations are consistent with the data demonstrated by the application of cardiotonic steroids (CTS) in anti-cancer [51,52,53] and anti-viral therapy [54,55,56,57]. It is well documented that different members of the CTS family have different affinities to the Na,K-ATPase and, as a consequence, different inhibitory properties [58,59]. It is likely that the various therapeutic effects of these compounds are due to these parameters.

4. Materials and Methods

4.1. Cell Culture

The human umbilical vein endothelial cells (HUVEC) were purchased from Lonza (Maryland, Walkersville, MD, USA) and passaged up to 6 times. Cells were cultured in complete endothelial cell growth medium-2 (EGM-2 BulletKit, CC3162, Lonza, Maryland, Walkersville, MD, USA) containing 10% fetal bovine serum (FBS), and maintained in a humidified atmosphere with 5% CO2/balance air at 37 °C. To establish quiescence, cells were incubated for 24 h in media in which concentration of FBS was reduced to 0.2%.

4.2. Intracellular Na+ and K+ Content

Intracellular content of exchangeable Na+ and K+ was measured as the steady-state distribution of extra- and intracellular 86Rb and 22Na, respectively. To establish isotope equilibrium, cells growing in 12-well plates were preincubated for 3 h in control medium containing 0.5 µCi/mL 86RbCl or 3 µCi/mL 22NaCl, and then with or without 3 µM ouabain, and in K+-free medium for 0.5, 1, 2, and 6 h. The cells were transferred onto ice, washed 4 times with 2 mL of ice-cold medium W containing 100 mM MgCl2 and 10 mM HEPES-tris buffer (pH 7.4). The medium was aspirated and cells were lysed with 1% SDS and 4 mM EDTA solution. Radioactivity of incubation media and cell lysates was quantified, and intracellular cation content was calculated as A/a × m, where A was the radioactivity of the samples (cpm), a was the specific radioactivity of 86Rb (K+ congener) and 22Na in the medium (cpm/nmol), and m was the protein content. For more details, see [10].

4.3. RNA Isolation

Total RNA was extracted from cells grown in 6-well plates, using TRIzol® reagent (Invitrogen, California, Carlsbad, CA, USA) and purified with a RNeasy® MinElute cleanup kit (Qiagen, California, Valencia, CA, USA), following the manufacturers’ protocols. Only the RNA samples that had a more than 7.0 RNA integrity number (RIN) and no detectable genomic DNA contamination were used for the subsequent gene array analyses. RNA quality was assessed by 2100 Bioanalyzer (Agilent Technologies, Palo Alto, CA, USA). Microarray experiments were performed with GeneChip® Human Gene 1.0 ST array (which detects 28,869 gene products). In this case, each gene was represented by approximately 26 probes along the entire length of the transcript (Affymetrix, California, Santa Clara, CA, USA). 100 ng of total RNA for each sample was processed with Ambion® WT Expression Kit (Invitrogen). This kit uses a reverse transcription priming method that specifically primes non-ribosomal RNA, including both poly(A) and non-poly(A) mRNA, and generates sense-strand cDNA as the final product. 5.5 µg of the single-stranded cDNA was fragmented and labeled using a Affymetrix GeneChip® WT Terminal Labeling Kit, and 2.0 µg of the resulting cDNA was hybridized on the chip.

4.4. Gene Chip Expression Analysis

The whole hybridization procedure was conducted with the Affymetrix GeneChip® system, according to the protocol recommended by the manufacturer. The hybridization results were evaluated with Affymetrix GeneChip
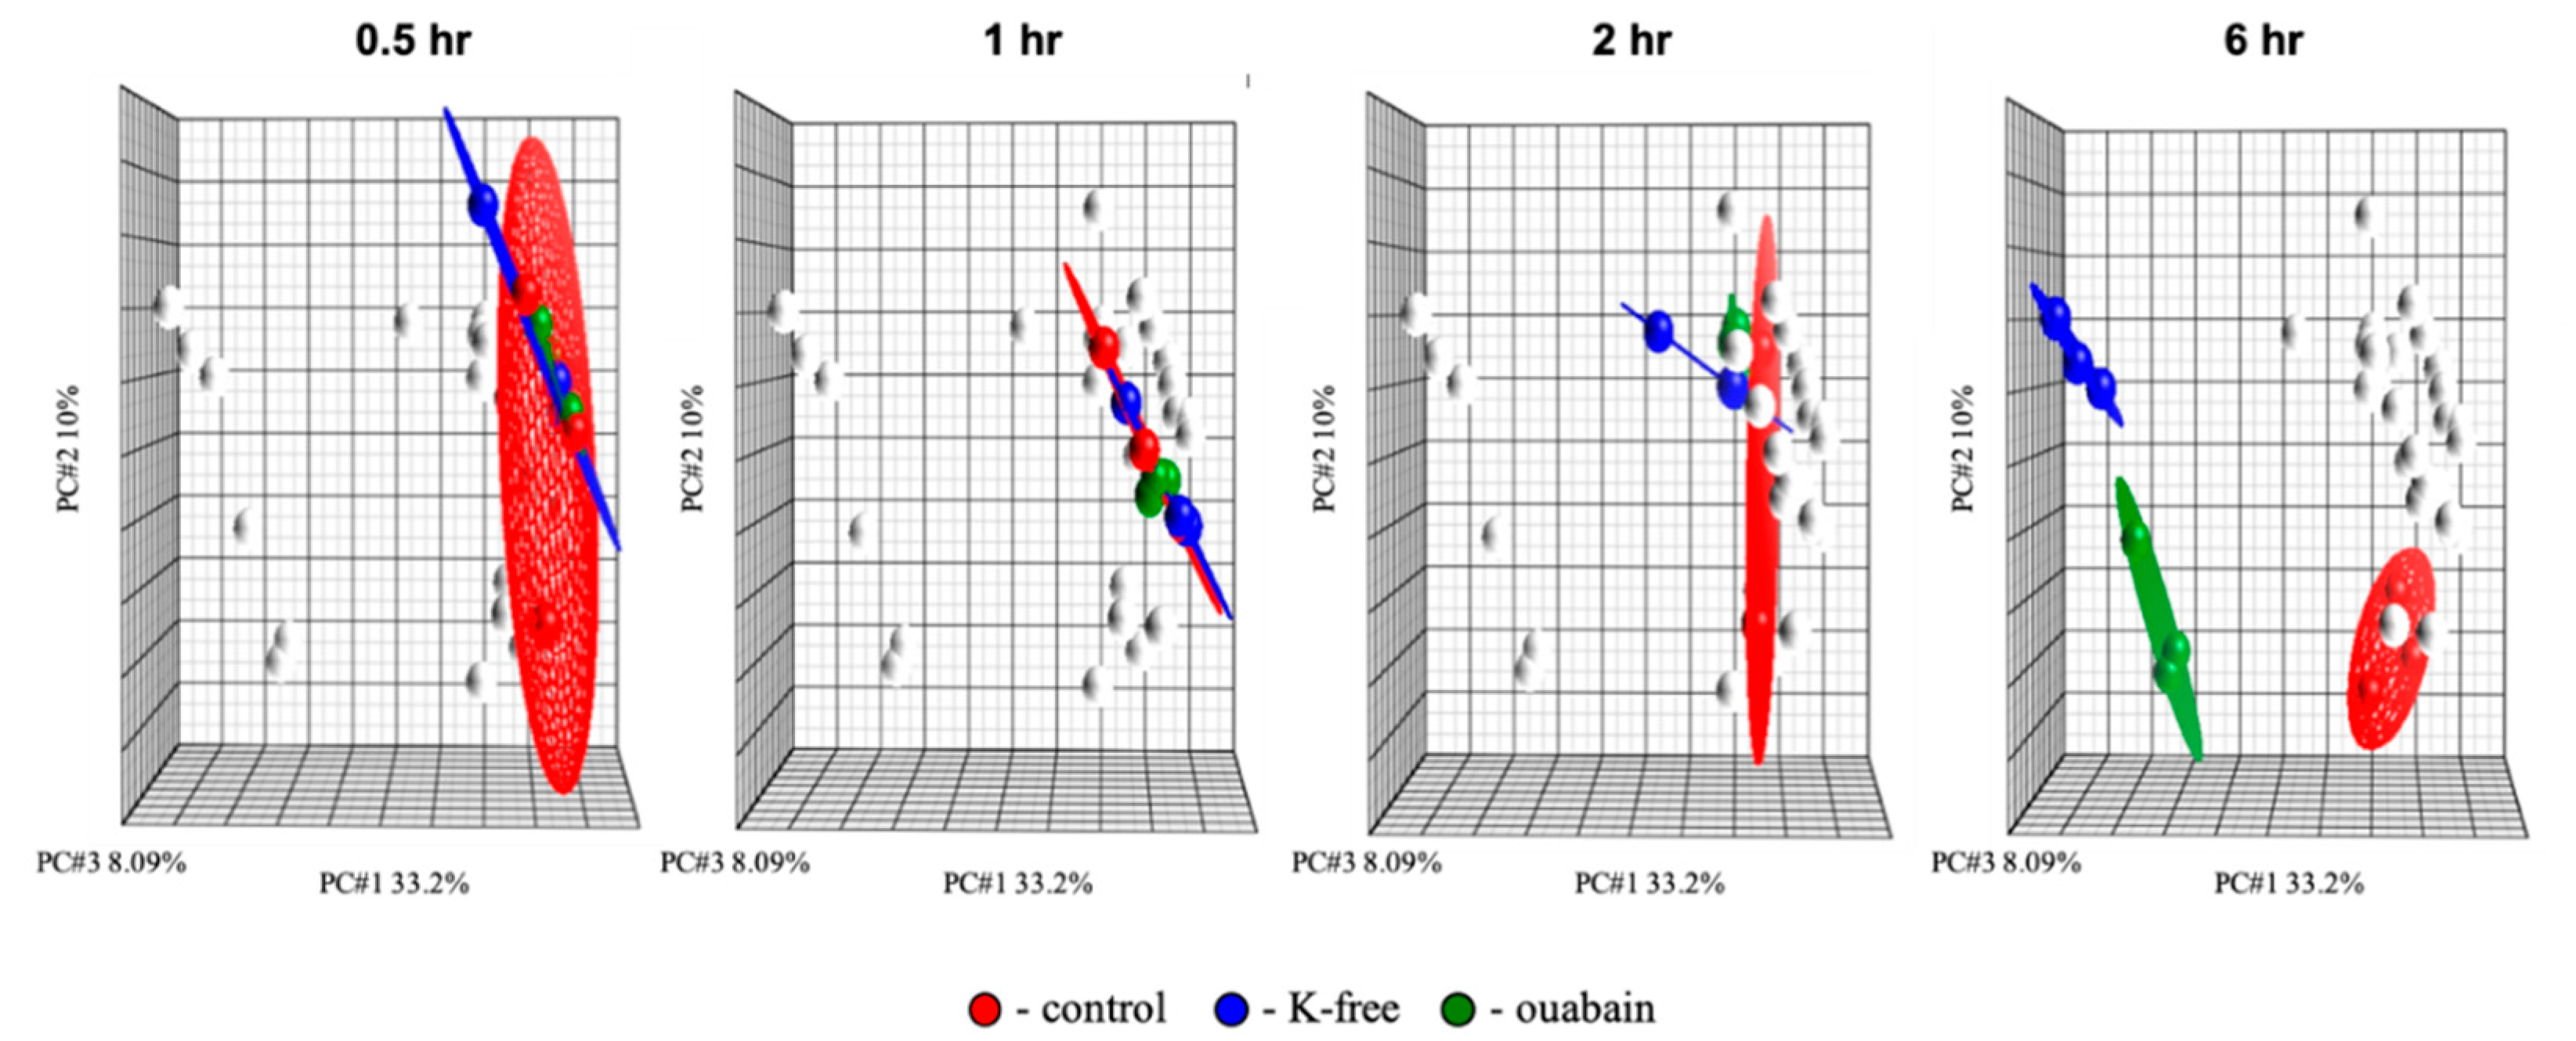
® Command Console software (AGCC, version 0.0.0.676). Quality of the chips was determined using Affymetrix Expression Console. Data analysis was performed within Partek Genomics Suite (Partek, Missouri, St. Louis, MO, USA). The data were initially normalized by the robust multichip average (RMA) algorithm, which uses background adjustment, quantile normalization, and summarization. Then, normalized data were analyzed by principal component analysis (PCA) [60] to identify patterns in the dataset, and highlight similarities and differences among the samples. Major sources of variability identified within the dataset by PCA were used as grouping variabilities for analysis of variance (ANOVA), with n = 3 for each group of samples. The ensuing data were filtered to identify transcripts with statistically significant variation of expression among the groups that are modulated by at least 20%, with multiple testing correction by the false discovery rate (p-VALUE).

4.5. GO and KEGG Pathways Analysis

Active subnetwork search and enrichment analysis was provided by the pathfindR package in R [61]. Biogrid and KEGG sets were used for the identification of protein–protein interaction network (PIN) and necessary gene sets to obtain for enrichment analysis, respectively. A greedy search (GR) algorithm was used to perform an active subnetwork search. Network of the set of co-regulated genes was predicted by using iRegulon in Cytoscope software [62]. The Ggplot2 package was used for data visualization [63].

4.6. G-Quadruplex-Forming Region Analysis

The search for quadruplexes within the DNA sequences of early response genes (0.5 and 1 h) was performed using the G4Catchall online tool [64], NCBI Nucleotide, and Gene databases. Values with a score greater than 0 were considered reliable.

4.7. Western Blot Analysis

The harvested lysates of cells were prepared by solubilization in RIPA buffer, containing cocktails of proteases and phosphatases inhibitors (Thermo Fisher Scientific, Massachusetts, Waltham, MA, USA). Protein concentrations were determined using the Lowry protein assay [65]. SDS-PAGE was performed in accordance with the Laemmli method [66], with 6% stacking gel and 10% running gel. Proteins were transferred from gel to nitrocellulose membrane (BioRad, California, Hercules, CA, USA), followed by blocking with 5% fat-free milk (Valio, Helsinki, Finland) in PBST 1X (PBS supplemented with Tween 20 0.1%) for 1 h at room temperature. Akt, CREB, and their phosphorylated forms were detected by overnight incubation with the corresponding antibodies (#9272S, #4060S, #4820S, #9198S, #9252S, #4668S, #4695S #4377S, Cell Signaling, Massachusetts, Danvers, MA, USA) at 4 °C in 5% milk powder in PBST. These samples were then incubated with HRP-conjugated secondary antibodies monoclonal anti-rabbit IgG (a1949, Sigma-Aldrich, Missouri, St. Louis, MO, USA) for 1 h at room temperature in 5% milk powder in PBST. GAPDH (#2118S, Cell Signaling, Massachusetts, Danvers, MA, USA) was chosen as the house-keeping protein. Antigen-antibody complexes were visualized using an ECL kit and ChemiDoc XRS+ Molecular Imager (BioRad, California, Hercules, CA, USA).

4.8. Chemicals

22NaCl and 86RbCl were obtained from PerkinElmer (Massachusetts, Waltham, MA, USA) and Isotope (St-Petersburg, Russia). The remaining chemicals were supplied by Gibco BRL (Missouri, Gaithersburg, MO, USA), Calbiochem (California, La Jolla, CA, USA), Sigma-Aldrich (Missouri, St. Louis, MO, USA), and Anachemia Canada Inc. (Quebec, Montreal, QC, Canada).

5. Conclusions

Our study shows that changes in the expression of major early, and intermediate, response genes are mediated almost exclusively by an increase in [Na+]i/[K+]i-ratio, rather than Na+i/K+i-independent signaling. Among Na+i/K+i-sensitive genes, there are those that deserve special attention. These genes, encoding microRNAs, transcription factors, and proteins, are involved in the formation of the immune and inflammatory response. They can be key in the system of excitation-transcription coupling, due to the dissipation of the gradient of monovalent cations. Na+i/K+i-dependent changes in gene transcription can be carried out with the participation of G-quadruplexes, non-canonical secondary structures of nucleic acids formed by guanine-rich regions of these acids. It was shown that their structure is stabilized by the monovalent cations. Thus, it cannot be ruled out that an increase in [Na+]i/[K+]i-ratio leads to destabilization of these structures and a subsequent change in gene transcription. However, this assumption needs to be experimentally confirmed.

Supplementary Materials

Supplementary materials can be found at https://0-www-mdpi-com.brum.beds.ac.uk/1422-0067/21/21/7992/s1. Table S1: Time-dependent actions of Na,K-ATPase inhibition on Na+i/K+i-content and [Na+]i/[K+]i-ratio. Table S2: Common differentially expressed genes triggered by Na,K-ATPase inhibition by 3 μM ouabain or K+-free medium in 2h. Table S3: Prediction of G-quadruplexes within early response genes’ DNA. Figure S1: KEGG pathways of differentially expressed genes triggered by Na,K-ATPase inhibition by 3 µM ouabain (A,C,E,G) or K+-free medium (B,D,F,H) in 0.5 h,1 h, 2 h and 6 h, respectively.

Author Contributions

Conceptualization, S.N.O. and O.D.L.; methodology, E.A.K., S.V.S., A.M.T., P.A.A.; software, S.V.S., P.A.A.; validation, E.A.K., S.V.S. and P.A.A.; formal analysis, E.A.K., S.V.S.; investigation, S.N.O., O.D.L., E.A.K.; resources, S.N.O.; data curation, S.N.O., O.D.L., E.A.K.; writing-original draft preparation, E.A.K., S.V.S., P.A.A.; writing-review and editing, O.D.L., E.A.K.; visualization, S.V.S.; supervision, S.N.O., O.D.L.; project administration, S.N.O.; funding acquisition, E.A.K. All authors have read and agreed to the published version of the manuscript

Funding

This research was funded by Russian Science Foundation, grant number 19–75–10009.

Acknowledgments

The authors are deeply grateful to Yakovenko L.V. for a fruitful discussion.

Conflicts of Interest

The authors declare no conflict of interest. The funders had no role in the design of the study; in the collection, analyses, or interpretation of data; in the writing of the manuscript, or in the decision to publish the results.

Abbreviations

Aktprotein kinase B
AP-1activator protein-1
CaMKI, II or IIICa2+/calmodulin-dependent protein kinase
CBPCREB-binding protein
CRECa2+/cAMP-response element
DEGsdifferentially expressed genes
EGM-2endothelial cell growth medium-2
ERGEarly response genes
FBSfetal bovine serum
FOXOforkhead box protein O
HeLahuman adenocarcinoma cell line
HUVEChuman umbilical vein endothelial cells
INFκBinhibitor of nuclear factor kappa-B
IRGIntermediate response genes
LRGlate response genes
MAPKmitogen-activated protein kinases
mTORmammalian target of rapamycin
NFATnuclear factor of activated T-cells
PCAprincipal component analysis
PI (3)Kphosphatidyl inositol 3-kinase
PKAcAMP-dependent protein kinase A
PKCcAMP-dependent protein kinase C
PtdIns3 ps or PI3Pphosphatidylinositol 3-phosphate
RVSMrat vascular smooth muscle cells
SREserum response element
UTR5′-untranslated region

References

  1. Komili, S.; Silver, P.A. Coupling and coordination in gene expression processes: A systems biology view. Nat. Rev. Genet. 2008, 9, 38–48. [Google Scholar] [CrossRef] [PubMed]
  2. Pope, S.D.; Medzhitov, R. Emerging Principles of Gene Expression Programs and Their Regulation. Mol. Cell 2018, 71, 389–397. [Google Scholar] [CrossRef] [PubMed] [Green Version]
  3. Scheiner-Bobis, G.; Schreiber, S. Glutamic Acid 472 and Lysine 480 of the Sodium Pump α1 Subunit Are Essential for Activity. Their Conservation in Pyrophosphatases Suggests Their Involvement in Recognition of ATP Phosphates. Biochemistry 1999, 38, 9198–9208. [Google Scholar] [CrossRef] [PubMed]
  4. Taurin, S.; Dulin, N.O.; Pchejetski, D.; Grygorczyk, R.; Tremblay, J.; Hamet, P.; Orlov, S.N. c-Fos Expression in Ouabain-Treated Vascular Smooth Muscle Cells from rat Aorta: Evidence for an Intracellular-Sodium-Mediated, Calcium-Independent Mechanism. J. Physiol. 2002, 543, 835–847. [Google Scholar] [CrossRef] [PubMed]
  5. Wang, H.; Yuan, W.; Lu, Z. Effects of ouabain and digoxin on gene expression of sodium pump alpha-subunit isoforms in rat myocardium. Chin. Med. J. 2001, 114, 1055–1059. [Google Scholar]
  6. Huang, L.; Li, H.; Xie, Z. Ouabain-induced Hypertrophy in Cultured Cardiac Myocytes is Accompanied by Changes in Expression of Several Late Response Genes. J. Mol. Cell. Cardiol. 1997, 29, 429–437. [Google Scholar] [CrossRef]
  7. Taurin, S.; Seyrantepe, V.; Orlov, S.N.; Tremblay, T.-L.; Thibault, P.; Bennett, M.R.; Hamet, P.; Pshezhetsky, A.V. Proteome Analysis and Functional Expression Identify Mortalin as an Antiapoptotic Gene Induced by Elevation of [Na+]i/[K+]i Ratio in Cultured Vascular Smooth Muscle Cells. Circ. Res. 2002, 91, 915–922. [Google Scholar] [CrossRef] [Green Version]
  8. Blaustein, M.P.; Lederer, W.J. Sodium/Calcium Exchange: Its Physiological Implications. Physiol. Rev. 1999, 79, 763–854. [Google Scholar] [CrossRef]
  9. McDonald, T.F.; Pelzer, S.; Trautwein, W.; Pelzer, D.J. Regulation and modulation of calcium channels in cardiac, skeletal, and smooth muscle cells. Physiol. Rev. 1994, 74, 365–507. [Google Scholar] [CrossRef]
  10. Koltsova, S.V.; Trushina, Y.; Haloui, M.; Akimova, O.A.; Tremblay, J.; Hamet, P.; Orlov, S.N. Ubiquitous [Na+]i/[K+]i-Sensitive Transcriptome in Mammalian Cells: Evidence for Ca2+i-Independent Excitation-Transcription Coupling. PLoS ONE 2012, 7, e38032. [Google Scholar] [CrossRef]
  11. Medina-Leyte, D.J.; Domínguez-Pérez, M.; Mercado, I.; Villarreal-Molina, M.T.; Jacobo-Albavera, L. Use of Human Umbilical Vein Endothelial Cells (HUVEC) as a Model to Study Cardiovascular Disease: A Review. Appl. Sci. 2020, 10, 938. [Google Scholar] [CrossRef] [Green Version]
  12. Xie, Z.; Askari, A. Na+/K+-ATPase as a signal transducer. J. Biol. Inorg. Chem. 2002, 269, 2434–2439. [Google Scholar] [CrossRef] [PubMed] [Green Version]
  13. Garland, C.J.; Hiley, C.R.; A Dora, K. EDHF: Spreading the influence of the endothelium. Br. J. Pharmacol. 2011, 164, 839–852. [Google Scholar] [CrossRef]
  14. Klimanova, E.A.; Tverskoi, A.M.; Koltsova, S.V.; Sidorenko, S.V.; Lopina, O.D.; Tremblay, J.; Hamet, P.; Kapilevich, L.V.; Orlov, S.N. Time- and dose dependent actions of cardiotonic steroids on transcriptome and intracellular content of Na+ and K+: A comparative analysis. Sci. Rep. 2017, 7, 45403. [Google Scholar] [CrossRef] [PubMed]
  15. Klimanova, E.A.; Sidorenko, S.V.; Smolyaninova, L.V.; Kapilevich, L.V.; Gusakova, S.V.; Lopina, O.D.; Orlov, S.N. Ubiquitous and cell type-specific transcriptomic changes triggered by dissipation of monovalent cation gradients in rodent cells: Physiological and pathophysiological implications. In Current Topics in Membranes; Elsevier BV: Amsterdam, The Netherlands, 2019; Volume 83, pp. 107–149. [Google Scholar]
  16. Williams, G.T.; Farzaneh, F. Are snoRNAs and snoRNA host genes new players in cancer? Nat. Rev. Cancer 2012, 12, 84–88. [Google Scholar] [CrossRef]
  17. Yoneda-Kato, N.; Tomoda, K.; Umehara, M.; Arata, Y.; Kato, J.-Y. Myeloid leukemia factor 1 regulates p53 by suppressing COP1 via COP9 signalosome subunit 3. EMBO J. 2005, 24, 1739–1749. [Google Scholar] [CrossRef]
  18. Ronchetti, D.; Mosca, L.; Cutrona, G.; Tuana, G.; Gentile, M.; Fabris, S.; Agnelli, L.; Ciceri, G.; Matis, S.; Massucco, C.; et al. Small nucleolar RNAs as new biomarkers in chronic lymphocytic leukemia. BMC Med. Genom. 2013, 6, 27. [Google Scholar] [CrossRef] [Green Version]
  19. Williams, J.H.; Daly, L.N.; Ingley, E.; Beaumont, J.G.; Tilbrook, P.A.; LaLonde, J.; Stillitano, J.P.; Klinken, S.P. HLS7, a hemopoietic lineage switch gene homologous to the leukemia-inducing gene MLF1. EMBO J. 1999, 18, 5559–5566. [Google Scholar] [CrossRef] [Green Version]
  20. Sun, W.; Zhang, K.; Zhang, X.; Lei, W.; Xiao, T.; Ma, J.; Guo, S.; Shao, S.; Zhang, H.; Liu, Y.; et al. Identification of differentially expressed genes in human lung squamous cell carcinoma using suppression subtractive hybridization. Cancer Lett. 2004, 212, 83–93. [Google Scholar] [CrossRef]
  21. Ding, L.; Ni, J.; Yang, F.; Huang, L.; Deng, H.; Wu, Y.; Ding, X.; Tang, J. Promising therapeutic role of miR-27b in tumor. Tumor Biol. 2017, 39, 1010428317691657. [Google Scholar] [CrossRef] [Green Version]
  22. Cheetham, S.W.; Faulkner, G.J.; Dinger, M.E. Overcoming challenges and dogmas to understand the functions of pseudogenes. Nat. Rev. Genet. 2019, 21, 191–201. [Google Scholar] [CrossRef] [PubMed]
  23. Kharel, P.; Balaratnam, S.; Beals, N.; Basu, S. The role of RNA G-quadruplexes in human diseases and therapeutic strategies. Wiley Interdiscip. Rev. RNA 2019, 11, e1568. [Google Scholar] [CrossRef] [PubMed]
  24. Shiyan, A.A.; Sidorenko, S.V.; Fedorov, D.; Klimanova, E.A.; Smolyaninova, L.V.; Kapilevich, L.V.; Grygorczyk, R.; Orlov, S.N. Elevation of Intracellular Na+ Contributes to Expression of Early Response Genes Triggered by Endothelial Cell Shrinkage. Cell. Physiol. Biochem. 2019, 53, 638–647. [Google Scholar] [PubMed]
  25. Sidorenko, S.V.; Klimanova, E.A.; Milovanova, K.G.; Lopina, O.D.; Kapilevich, L.V.; Chibalin, A.V.; Orlov, S.N. Transcriptomic changes in C2C12 myotubes triggered by electrical stimulation: Role of Ca2+i-mediated and Ca2+i-independent signaling and elevated [Na+]i/[K+]i ratio. Cell Calcium 2018, 76, 72–86. [Google Scholar] [CrossRef] [PubMed]
  26. Haloui, M.; Taurin, S.; Akimova, O.A.; Guo, D.-F.; Tremblay, J.; Dulin, N.O.; Hamet, P.; Orlov, S.N. [Na+]i-induced c-Fos expression is not mediated by activation of the 5′-promoter containing known transcriptional elements. FEBS J. 2007, 274, 3557–3567. [Google Scholar] [CrossRef] [PubMed]
  27. Curran, T.; Franza, B. Fos and jun: The AP-1 connection. Cell 1988, 55, 395–397. [Google Scholar] [CrossRef]
  28. Whitmarsh, A.J.; Davis, R.J. Transcription factor AP-1 regulation by mitogen-activated protein kinase signal transduction pathways. J. Mol. Med. 1996, 74, 589–607. [Google Scholar] [CrossRef]
  29. Piechaczyk, M.; Blanchard, J.-M. c-fos proto-oncogene regulation and function. Crit. Rev. Oncol. 1994, 17, 93–131. [Google Scholar] [CrossRef]
  30. Papa, S.; Choy, P.M.; Bubici, C. The ERK and JNK pathways in the regulation of metabolic reprogramming. Oncogene 2018, 38, 2223–2240. [Google Scholar] [CrossRef] [Green Version]
  31. Lopachev, A.V.; Lopacheva, O.M.; Osipova, E.A.; Vladychenskaya, E.A.; Smolyaninova, L.V.; Fedorova, T.N.; Koroleva, O.V.; Akkuratov, E.E. Ouabain-induced changes in MAP kinase phosphorylation in primary culture of rat cerebellar cells. Cell Biochem. Funct. 2016, 34, 367–377. [Google Scholar] [CrossRef]
  32. Akimova, O.A.; Hamet, P.; Orlov, S.N. [Na+] i /[K+] i -independent death of ouabain-treated renal epithelial cells is not mediated by Na+,K+-ATPase internalization and de novo gene expression. Pflug. Arch. Eur. J Phy. 2007, 455, 711–719. [Google Scholar] [CrossRef] [PubMed]
  33. Kolkhof, P.; Geerts, A.; Schäfer, S.; Torzewski, J. Cardiac glycosides potently inhibit C-reactive protein synthesis in human hepatocytes. Biochem. Biophys. Res. Commun. 2010, 394, 233–239. [Google Scholar] [CrossRef] [PubMed]
  34. Smolyaninova, L.V.; Shiyan, A.A.; Kapilevich, L.V.; Lopachev, A.V.; Fedorova, T.N.; Klementieva, T.S.; Moskovtsev, A.A.; Kubatiev, A.A.; Orlov, S.N. Transcriptomic changes triggered by ouabain in rat cerebellum granule cells: Role of α3- and α1-Na+,K+-ATPase-mediated signaling. PLoS ONE 2019, 14, e0222767. [Google Scholar] [CrossRef] [Green Version]
  35. Liang, G.H.; Kim, J.A.; Seol, G.H.; Choi, S.; Suh, S.H. The Na+/Ca2+ exchanger inhibitor KB-R7943 activates large-conductance Ca2+-activated K+ channels in endothelial and vascular smooth muscle cells. Eur. J. Pharmacol. 2008, 582, 35–41. [Google Scholar] [CrossRef] [PubMed]
  36. Coulon, V.; Blanchard, J. Flux calciques et expression génique. Médecine/Sciences 2001, 17, 969. [Google Scholar] [CrossRef]
  37. Zhang, J.; Zhang, D.; McQuade, J.S.; Behbehani, M.; Tsien, J.Z.; Xu, M. c-Fos regulates neuronal excitability and survival. Nat. Genet. 2002, 30, 416–420. [Google Scholar] [CrossRef]
  38. Kapilevich, L.V.; Kironenko, T.A.; Zaharova, A.N.; Kotelevtsev, Y.; Dulin, N.O.; Orlov, S.N. Skeletal muscle as an endocrine organ: Role of [Na+]i/[K+]i-mediated excitation-transcription coupling. Genes Dis. 2015, 2, 328–336. [Google Scholar] [CrossRef] [Green Version]
  39. Nakagawa, Y.; Rivera, V.; Larner, A.C. A role for the Na/K-ATPase in the control of human c-fos and c-jun transcription. J. Biol. Chem. 1992, 267, 8785–8788. [Google Scholar]
  40. Nakagawa, Y.; Petricoin, E.F.; Akai, H.; Grimley, P.M.; Rupp, B.; Larner, A.C. Interferon-alpha-induced gene expression: Evidence for a selective effect of ouabain on activation of the ISGF3 transcription complex. Virology 1992, 190, 210–220. [Google Scholar] [CrossRef]
  41. Choudhury, G.G. Akt Serine Threonine Kinase Regulates Platelet-derived Growth Factor-induced DNA Synthesis in Glomerular Mesangial Cells. J. Biol. Chem. 2001, 276, 35636–35643. [Google Scholar] [CrossRef] [Green Version]
  42. He, H.; Ping, F. The SIE, SRE, CRE, and FAP-1 four intracellular signal pathways between stimulus and the expression of c-fos promoter. J. Cell. Biochem. 2009, 106, 764–768. [Google Scholar] [CrossRef]
  43. Orlov, S.N.; Hamet, P. Intracellular Monovalent Ions as Second Messengers. J. Membr. Biol. 2006, 210, 161–172. [Google Scholar] [CrossRef] [PubMed]
  44. Klimanova, E.A.; Sidorenko, S.V.; Tverskoi, A.M.; Shiyan, A.A.; Smolyaninova, L.V.; Kapilevich, L.V.; Gusakova, S.V.; Maksimov, G.V.; Lopina, O.D.; Orlov, S.N. Search for Intracellular Sensors Involved in the Functioning of Monovalent Cations as Secondary Messengers. Biochemistry 2019, 84, 1280–1295. [Google Scholar] [CrossRef]
  45. Lopina, O.D.; Tverskoi, A.M.; Klimanova, E.A.; Sidorenko, S.V.; Orlov, S.N. Ouabain-Induced Cell Death and Survival. Role of α1-Na,K-ATPase-Mediated Signaling and [Na+]i/[K+]i-Dependent Gene Expression. Front. Physiol. 2020, 11, 1060. [Google Scholar] [CrossRef]
  46. Huppert, J.L. Four-stranded DNA: Cancer, gene regulation and drug development. Philos. Trans. R. Soc. A Math. Phys. Eng. Sci. 2007, 365, 2969–2984. [Google Scholar] [CrossRef]
  47. Sen, D.; Gilbert, W. A sodium-potassium switch in the formation of four-stranded G4-DNA. Nat. Cell Biol. 1990, 344, 410–414. [Google Scholar] [CrossRef]
  48. Pandith, A.; Siddappa, R.G.; Seo, Y.-J. Recent developments in novel blue/green/red/NIR small fluorescent probes for in cellulo tracking of RNA/DNA G-quadruplexes. J. Photochem. Photobiol. C Photochem. Rev. 2019, 40, 81–116. [Google Scholar] [CrossRef]
  49. Spiegel, J.; Adhikari, S.; Balasubramanian, S. The Structure and Function of DNA G-Quadruplexes. Trends Chem. 2020, 2, 123–136. [Google Scholar] [CrossRef] [PubMed] [Green Version]
  50. Ruggiero, E.; Richter, S.N. G-quadruplexes and G-quadruplex ligands: Targets and tools in antiviral therapy. Nucleic Acids Res. 2018, 46, 3270–3283. [Google Scholar] [CrossRef] [PubMed]
  51. Mijatovic, T.; Van Quaquebeke, E.; Delest, B.; Debeir, O.; Darro, F.; Kiss, R. Cardiotonic steroids on the road to anti-cancer therapy. Biochim. Biophys. Acta (BBA)—Bioenerg. 2007, 1776, 32–57. [Google Scholar] [CrossRef]
  52. Pessôa, M.T.C.; Cortes, V.F.; Barbosa, L.A. Na, K-ATPase Cell Signaling Pathways and Cancer. In Regulation of Membrane Na+-K+ ATPase; Springer Science and Business Media LLC: Berlin/Heidelberg, Germany, 2015; pp. 51–61. [Google Scholar]
  53. Bagrov, A.Y.; Shapiro, J.I.; Fedorova, O.V. Endogenous Cardiotonic Steroids: Physiology, Pharmacology, and Novel Therapeutic Targets. Pharmacol. Rev. 2009, 61, 9–38. [Google Scholar] [CrossRef]
  54. Amarelle, L.; Katzen, J.; Shigemura, M.; Welch, L.C.; Cajigas, H.; Peteranderl, C.; Celli, D.; Herold, S.; Lecuona, E.; Sznajder, J.I. Cardiac glycosides decrease influenza virus replication by inhibiting cell protein translational machinery. Am. J. Physiol. Cell. Mol. Physiol. 2019, 316, L1094–L1106. [Google Scholar] [CrossRef] [PubMed]
  55. Wong, R.W.; Balachandran, A.; Ostrowski, M.A.; Cochrane, A. Digoxin Suppresses HIV-1 Replication by Altering Viral RNA Processing. PLoS ONE Pathog. 2013, 9, e1003241. [Google Scholar] [CrossRef] [PubMed]
  56. Wong, R.W.; Lingwood, C.A.; Ostrowski, M.A.; Cabral, T.; Cochrane, A. Cardiac glycoside/aglycones inhibit HIV-1 gene expression by a mechanism requiring MEK1/2-ERK1/2 signaling. Sci. Rep. 2018, 8, 850. [Google Scholar] [CrossRef] [Green Version]
  57. Grosso, F.; Stoilov, P.; Lingwood, C.; Brown, M.; Cochrane, A. Suppression of Adenovirus Replication by Cardiotonic Steroids. J. Virol. 2016, 91, 91. [Google Scholar] [CrossRef] [Green Version]
  58. Dvela, M.; Rosen, H.; Feldmann, T.; Nesher, M.; Lichtstein, D. Diverse biological responses to different cardiotonic steroids. Pathophysiology 2007, 14, 159–166. [Google Scholar] [CrossRef] [PubMed]
  59. Triana-Martínez, F.; Picallos-Rabina, P.; Da Silva-Álvarez, S.; Pietrocola, F.; Llanos, S.; Rodilla, V.; Soprano, E.; Pedrosa, P.; Ferreirós, A.; Barradas, M.; et al. Identification and characterization of Cardiac Glycosides as senolytic compounds. Nat. Commun. 2019, 10, 1–12. [Google Scholar] [CrossRef] [PubMed]
  60. Pearson, K. LIII. On lines and planes of closest fit to systems of points in space. Lond. Edinb. Dublin Philos. Mag. J. Sci. 1901, 2, 559–572. [Google Scholar] [CrossRef] [Green Version]
  61. Ülgen, E.; Ozisik, O.; Sezerman, O.U. pathfindR: An R Package for Comprehensive Identification of Enriched Pathways in Omics Data Through Active Subnetworks. Front. Genet. 2019, 10, 858. [Google Scholar] [CrossRef]
  62. Shannon, P.; Markiel, A.; Ozier, O.; Baliga, N.S.; Wang, J.T.; Ramage, D.; Amin, N.; Schwikowski, B.; Ideker, T. Cytoscape: A Software Environment for Integrated Models of Biomolecular Interaction Networks. Genome Res. 2003, 13, 2498–2504. [Google Scholar] [CrossRef]
  63. Wickham, H. Ggplot2: Elegant Graphics for Data Analysis; Springer: New York, NY, USA, 2009. [Google Scholar]
  64. Doluca, O. G4Catchall: A G-quadruplex prediction approach considering atypical features. J. Theor. Biol. 2019, 463, 92–98. [Google Scholar] [CrossRef]
  65. Bennett, G.F. Lowry’s handbook of right-to-know emergency planning. J. Hazard. Mater. 1992, 30, 361–362. [Google Scholar] [CrossRef]
  66. Laemmli, U.K. Cleavage of Structural Proteins during the Assembly of the Head of Bacteriophage T4. Nat. Cell Biol. 1970, 227, 680–685. [Google Scholar] [CrossRef] [PubMed]
Figure 1. Kinetics of modulation of intracellular Na+ and K+ content by Na,K-ATPase inhibition in human umbilical vein endothelial cells. Cells were exposed to 3 µM ouabain and K+-free medium for 0.5, 1, 2, and 6 h. The Na+i and K+i content in cells for each time point in the absence of treatment was taken as 100%. Means ± S.E. from three experiments performed in quadruplicate are shown.
Ijms 21 07992 g001
Figure 2. Principal component analysis (PCA) of the transcriptomic changes in human umbilical vein endothelial cells (HUVEC) triggered by Na,K-ATPase inhibition by 3 µM ouabain and incubation in K+-free medium for 0.5, 1, 2, and 6 h. Ellipsoids highlight portioning of samples based on the type of treatment. The principal components in the three-dimensional graphs (PC #1, PC #2, and PC #3) represent the variability of gene expression level within the datasets. Each point on the PCA represents the gene expression profile of an individual sample. Samples that are near each other in the resulting three-dimensional plot have a similar transcriptome, while those that are further apart have dissimilar transcriptional profiles. White dots, as well as green, red and blue, represent overall statistically significant transcriptomic changes. In turn, green, red and blue dots show the differentially expressed genes sets specific to each stimulus which change at different time points. All experiments were repeated three times.
Ijms 21 07992 g002
Figure 3. Venn diagram representing the distribution of common differentially expressed genes identified in HUVEC exposed to 3 μM ouabain, or subjected to K+-free medium, vs. control samples in 0.5, 1, 2, and 6 h. The number of common differentially expressed genes are shown within overlapping areas. The total number of upregulated and downregulated genes identified in ouabain- or K+-free medium-treated cells is shown in Table 1.
Ijms 21 07992 g003
Figure 4. Correlation analysis of genes whose expression was changed by Na,K-ATPase inhibition in the presence of 3 μM ouabain or K+-free medium in 0.5 (A), 1 (B), 2 (C), and 6 h (D) by more than 1.2-fold with p < 0.05. The total number of genes subjected to analysis is shown in Figure 2.
Ijms 21 07992 g004
Figure 5. Potential transcriptional regulation in HUVEC by FOS, triggered by Na,K-ATPase inhibition by 3 µM ouabain (A,C) or K+-free medium (B,D) at the early stages of Na+i/K+i gradient dissipation. Upregulated and downregulated genes are shown in red and blue, respectively.
Ijms 21 07992 g005
Figure 6. Representative western blots and relative content of phosphorylated Akt (A), CREB (B), JNK (C), and Erk (D) in control HUVEC and after 0.5-, 1-, 2-, and 6-h exposure to 3 µM ouabain or K+-free medium. The content of proteins in control cells was taken as 1.0. Data obtained in three independent experiments are reported as means ± S.E.
Ijms 21 07992 g006
Table 1. Time-dependent effect of Na,K-ATPase inhibition on genes expression in HUVEC.
OuabainK+-Free Medium
0.5 h1 h2 h6 h0.5 h1 h2 h6 h
Number of differentially expressed genes30161113415642195073628
Number of up-regulated genes221564123161332801011
Maximal fold of activation1.562.042.7314.491.482.5517.2224.57
Number of down-regulated genes8144218458862272617
Maximal fold of inhibition−1.731.93−2.20−7.49−2.47−3.44−4.99−12.42
Genes whose expression was altered by more than 1.2-fold with p < 0.05 for 0.5 h and 1 h, and more than 1.5-fold with p < 0.05 for 2 h and 6 h were subjected to analysis.
Table 2. Common differentially expressed genes triggered by Na,K-ATPase inhibition by 3 μM ouabain or K+-free medium in 0.5 and 1 h.
HoursGene Symbol3 μM OuabainK+-Free Medium
FCp-ValueFCp-Value
0.5RNU6–447P1.441.23 × 1031.365.26 × 103
RNU6–747P1.361.48 × 1031.325.26 × 103
SNORD32B−1.291.21 × 102−1.262.43 × 102
MLF1−1.296.26 × 103−1.279.23 × 103
SNORA20−1.45476 × 10²−1.866.49 × 104
NR4A2−1.516.26 × 103−2.477.12 × 108
FOSB−1.733.11 × 103−2.425.16 × 106
FOS−1.733.71 × 102−2.172.72 × 103
1EGR12.041.90 × 1031.698.07 × 103
FOS1.961.19 × 1032.523.65 × 105
LSMEM11.631.41 × 1031.322.92 × 102
SNORA671.475.42 × 1031.783.33 × 106
SNORA211.351.06 × 1021.262.23 × 102
PPP1R101.291.90 × 1031.216.48 × 103
WDR471.293.80 × 1021.367.36 × 104
MIR27B−1.931.49 × 103−1.759.21 × 104
Genes whose expression was altered by more than 1.2-fold with p < 0.05 were subjected to analysis.
Table 3. Top 10 common differentially expressed transcripts triggered by Na,K-ATPase inhibition by 3 µM ouabain or K+-free medium in 2 and 6 h.
HoursGene Symbol3 µM OuabainK+-Free Medium
FCp-ValueFCp-Value
2RN7SL600P2.718.26 × 1068.819.24 × 1013
RN7SL473P2.451.03 × 1077.581.26 × 1015
RN7SL849P1.536.66 × 1036.336.76 × 1014
IL1A2.218.31 × 1095.831.18 × 1016
KITLG1.535.75 × 1055.361.11 × 1016
FLJ35409−2.132.02 × 103−2.855.98 × 106
AC002350.1−1.783.43 × 103−3.164.24 × 108
LOC100130713−2.149.38 × 107−3.491.12 × 1011
SNORD52−2.201.72 × 106−3.967.64 × 1012
DEPP1−1.698.84 × 106−4.999.57 × 1016
6FLJ4339014.332.91 × 10172.743.40 × 109
TFPI29.074.76 × 101814.218.28 × 1020
HIVEP26.839.42 × 101913.521.80 × 1021
PLA2G4C6.481.63 × 10188.031.19 × 1019
TRAF13.852.23 × 101520.123.62 × 1022
AGGF1−5.687.59 × 1021−5.942.60 × 1021
GCNT1−5.782.51 × 1016−6.168.77 × 1017
NMI−5.865.04 × 1019−6.648.28 × 1020
SAMD9L−6.921.61 × 1019−5.013.19 × 1018
GIMAP2−7.382.77 × 1019−12.422.03 × 1021
Genes whose expression was altered by more than 1.5-fold with p < 0.05 were subjected to analysis.
Table 4. Prediction of G-quadruplexes within early response genes’ DNA.
Sequence DefinitionNCBI Reference SequenceBeginning of G4 Sequence (First Nucleotide = 0)End of G4 SequenceLengthG4-Forming SequenceG4HScore
FOSNC_000014.934136827ggggccgggggcttggggtcgcggagg2
FOSNC_000014.91405142722gggaatgtgggggctgggtggg2.136
FOSNC_000014.92755277823gtgagggggcagggaaggggagg2.174
FOSBNC_000019.102242226523ggggtgggggtggggtgttgtgg2.522
FOSBNC_000019.103910393020gggaggtagagagggagggg2
FOSBNC_000019.105323534825ggggatgggtggggaggggggcggg2.92
LSMEM1NC_000007.145835585823gggtgtggtggagggggaggggg2.522
LSMEM1NC_000007.146220624424gggttggagaaagggggtgggggg2.417
LSMEM1NC_000007.149144916723gggttgggactgggagggagggg2.217
PPP1R10NC_000006.123449347324ggggtgtggggggggggttgcagg2.542
PPP1R10NC_000006.124975499520ggagcagttgggtggggggg2
WDR47NC_000001.11619816201534gggtggggtgggaaggggtagggatggatggtttaggg2
MLF1NC_000003.122170222555ggggcggggcggggggaggggggcgggaggagggaggagggaggagggcggcgggggggggggggcggcgggggggggggggtgtgtgtg2.633
MLF1NC_000003.12271142715541ggtggggggacaggagggaggtgtgggggttgggggtaagg2.171
G-quadruplex-forming regions with G4HScore ≥ 2 are listed.
Table 5. Kinetics of FOS gene expression triggered by Na,K-ATPase inhibition.
Hours3 µM OuabainK+-Free Medium
FCp-ValueFCp-Value
0.5 −1.733.71 × 102−2.172.72 × 103
1 1.961.19 × 1022.523.65 × 105
2 2.471.80 × 10518.071.00 × 1015
6 8.148.44 × 10145.682.64 × 1012
Publisher’s Note: MDPI stays neutral with regard to jurisdictional claims in published maps and institutional affiliations.

