Optimization of the Biocatalysis for D-DIBOA Synthesis Using a Quick and Sensitive New Spectrophotometric Quantification Method

 , ,
, ,  and
and
Abstract
:1. Introduction
2. Results
2.1. Development of a Spectrophotometric Method for D-DIBOA Quantification
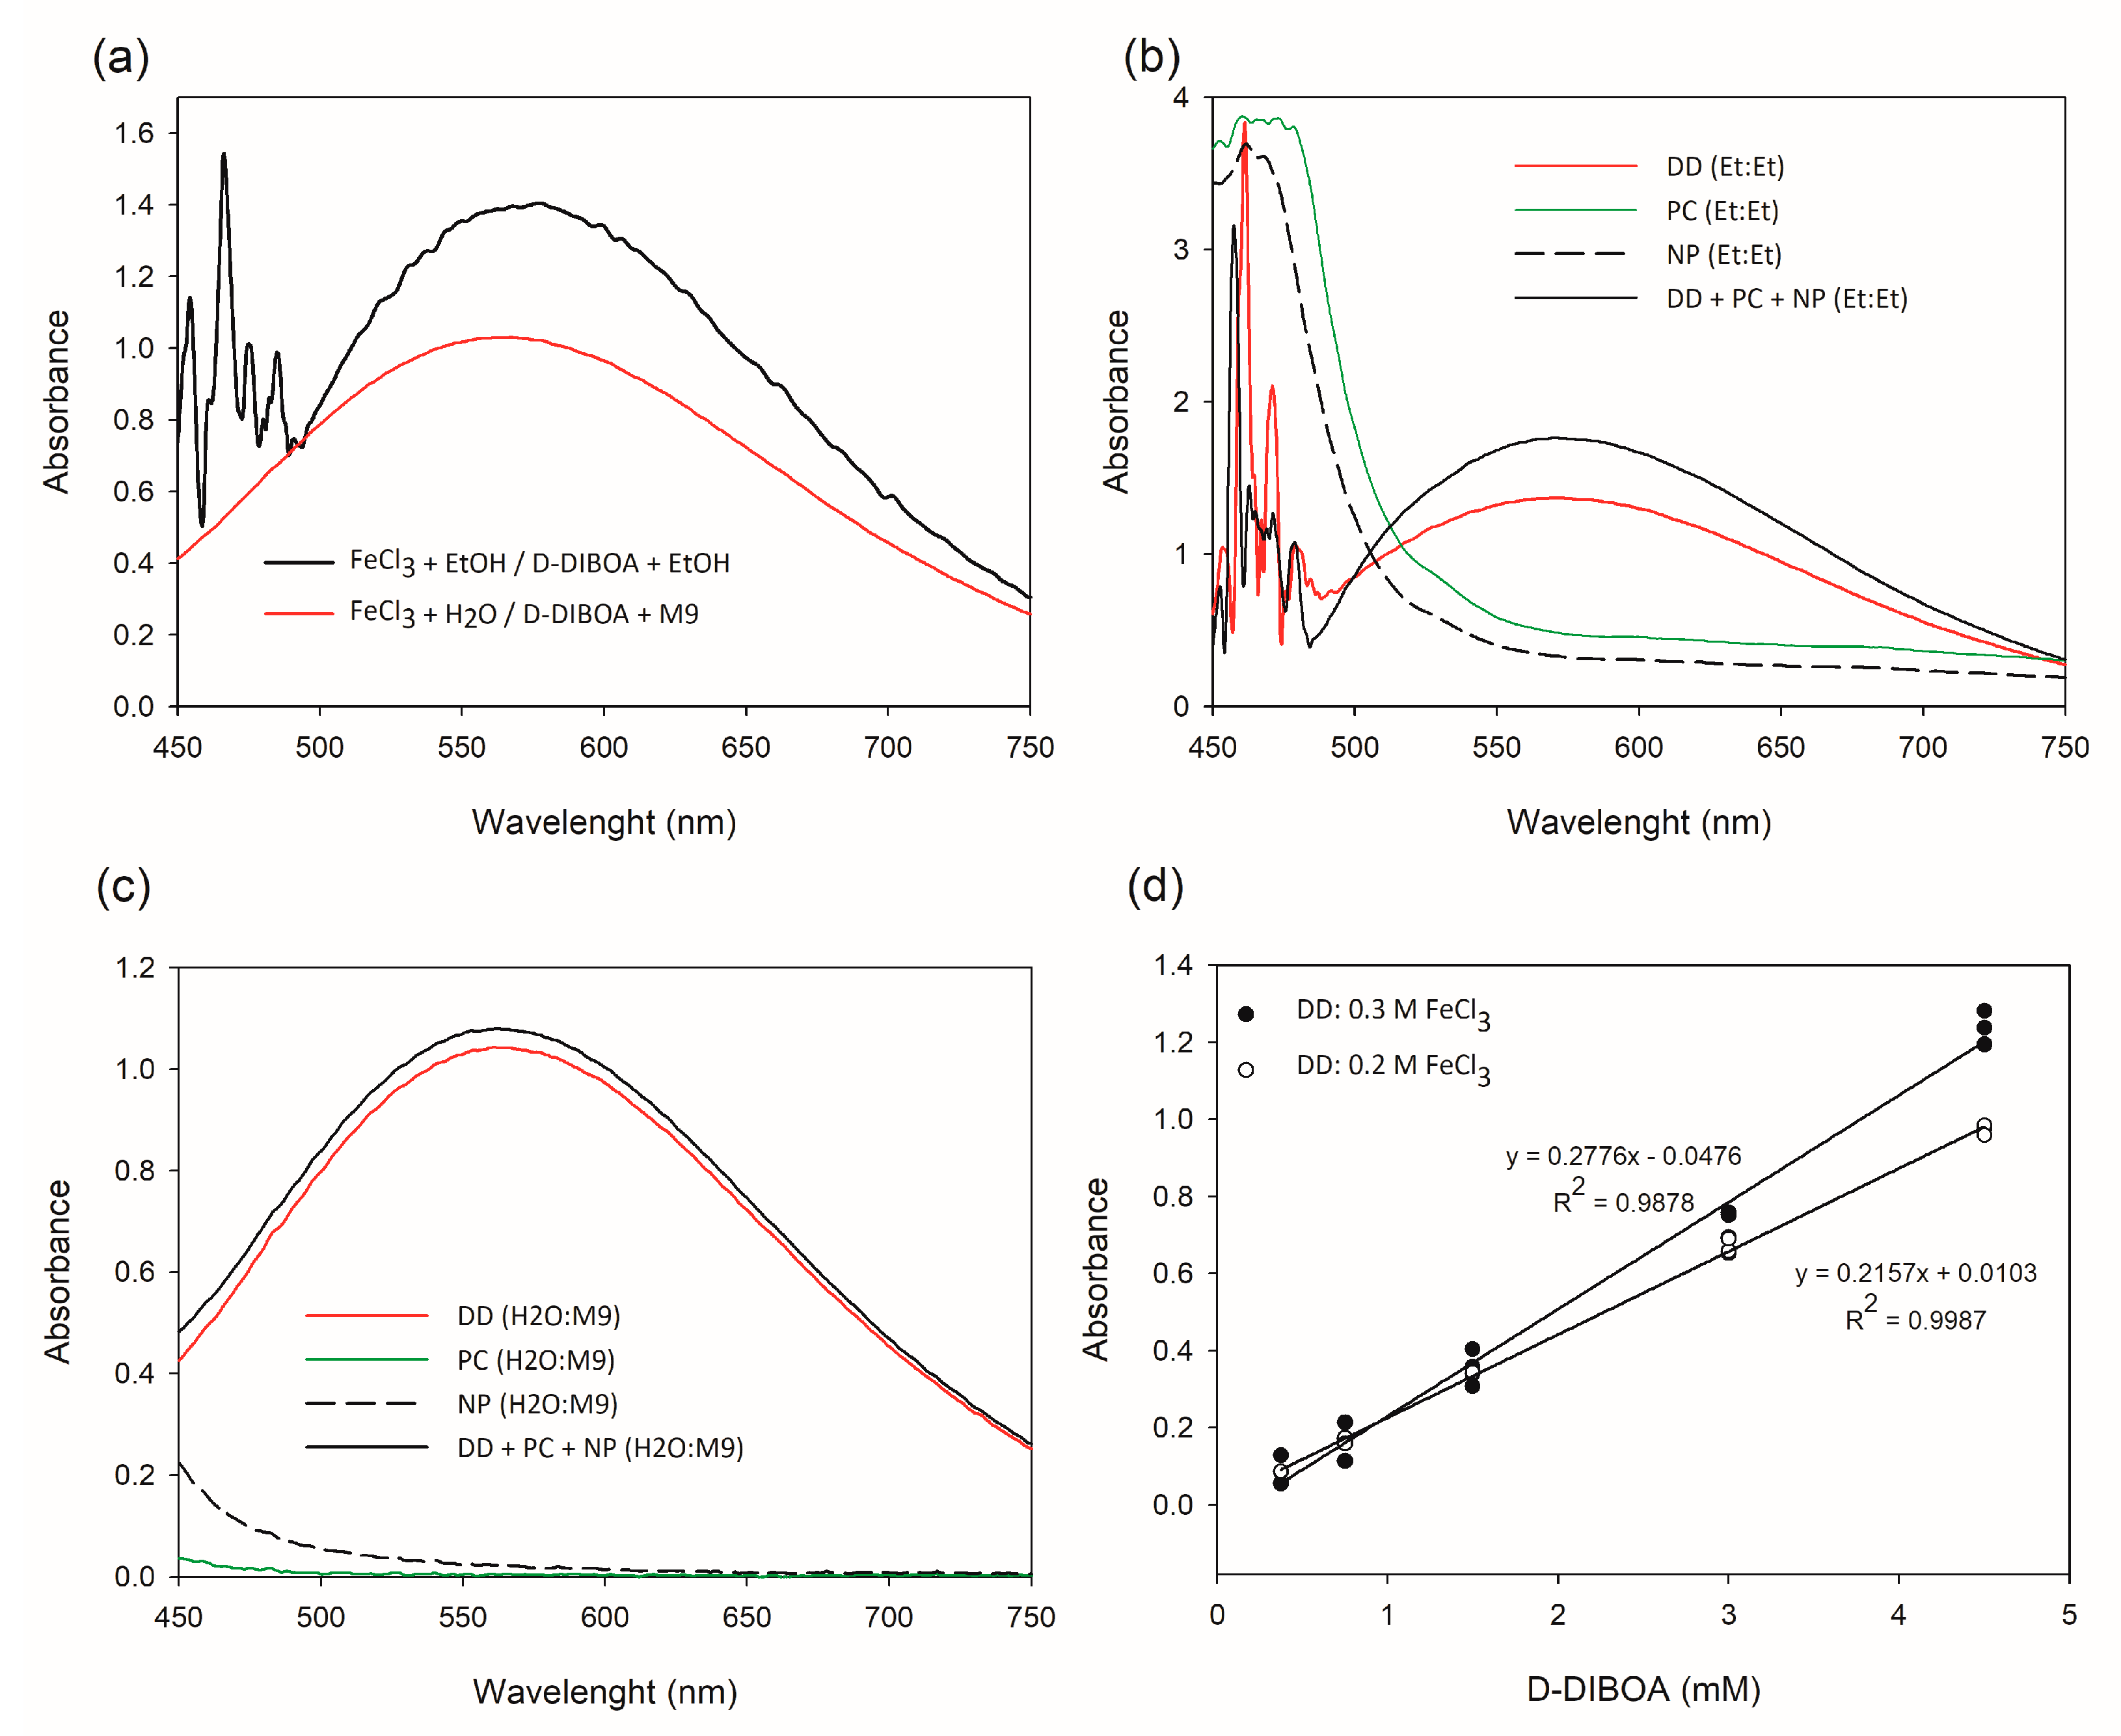
2.1.1. Assessment of Maximum Wavelength (λmax) Range for Absorbance of the Fe (III)-(D-DIBOA)3 Complex
2.1.2. Specificity
2.1.3. Optimization of the Calibration Curve
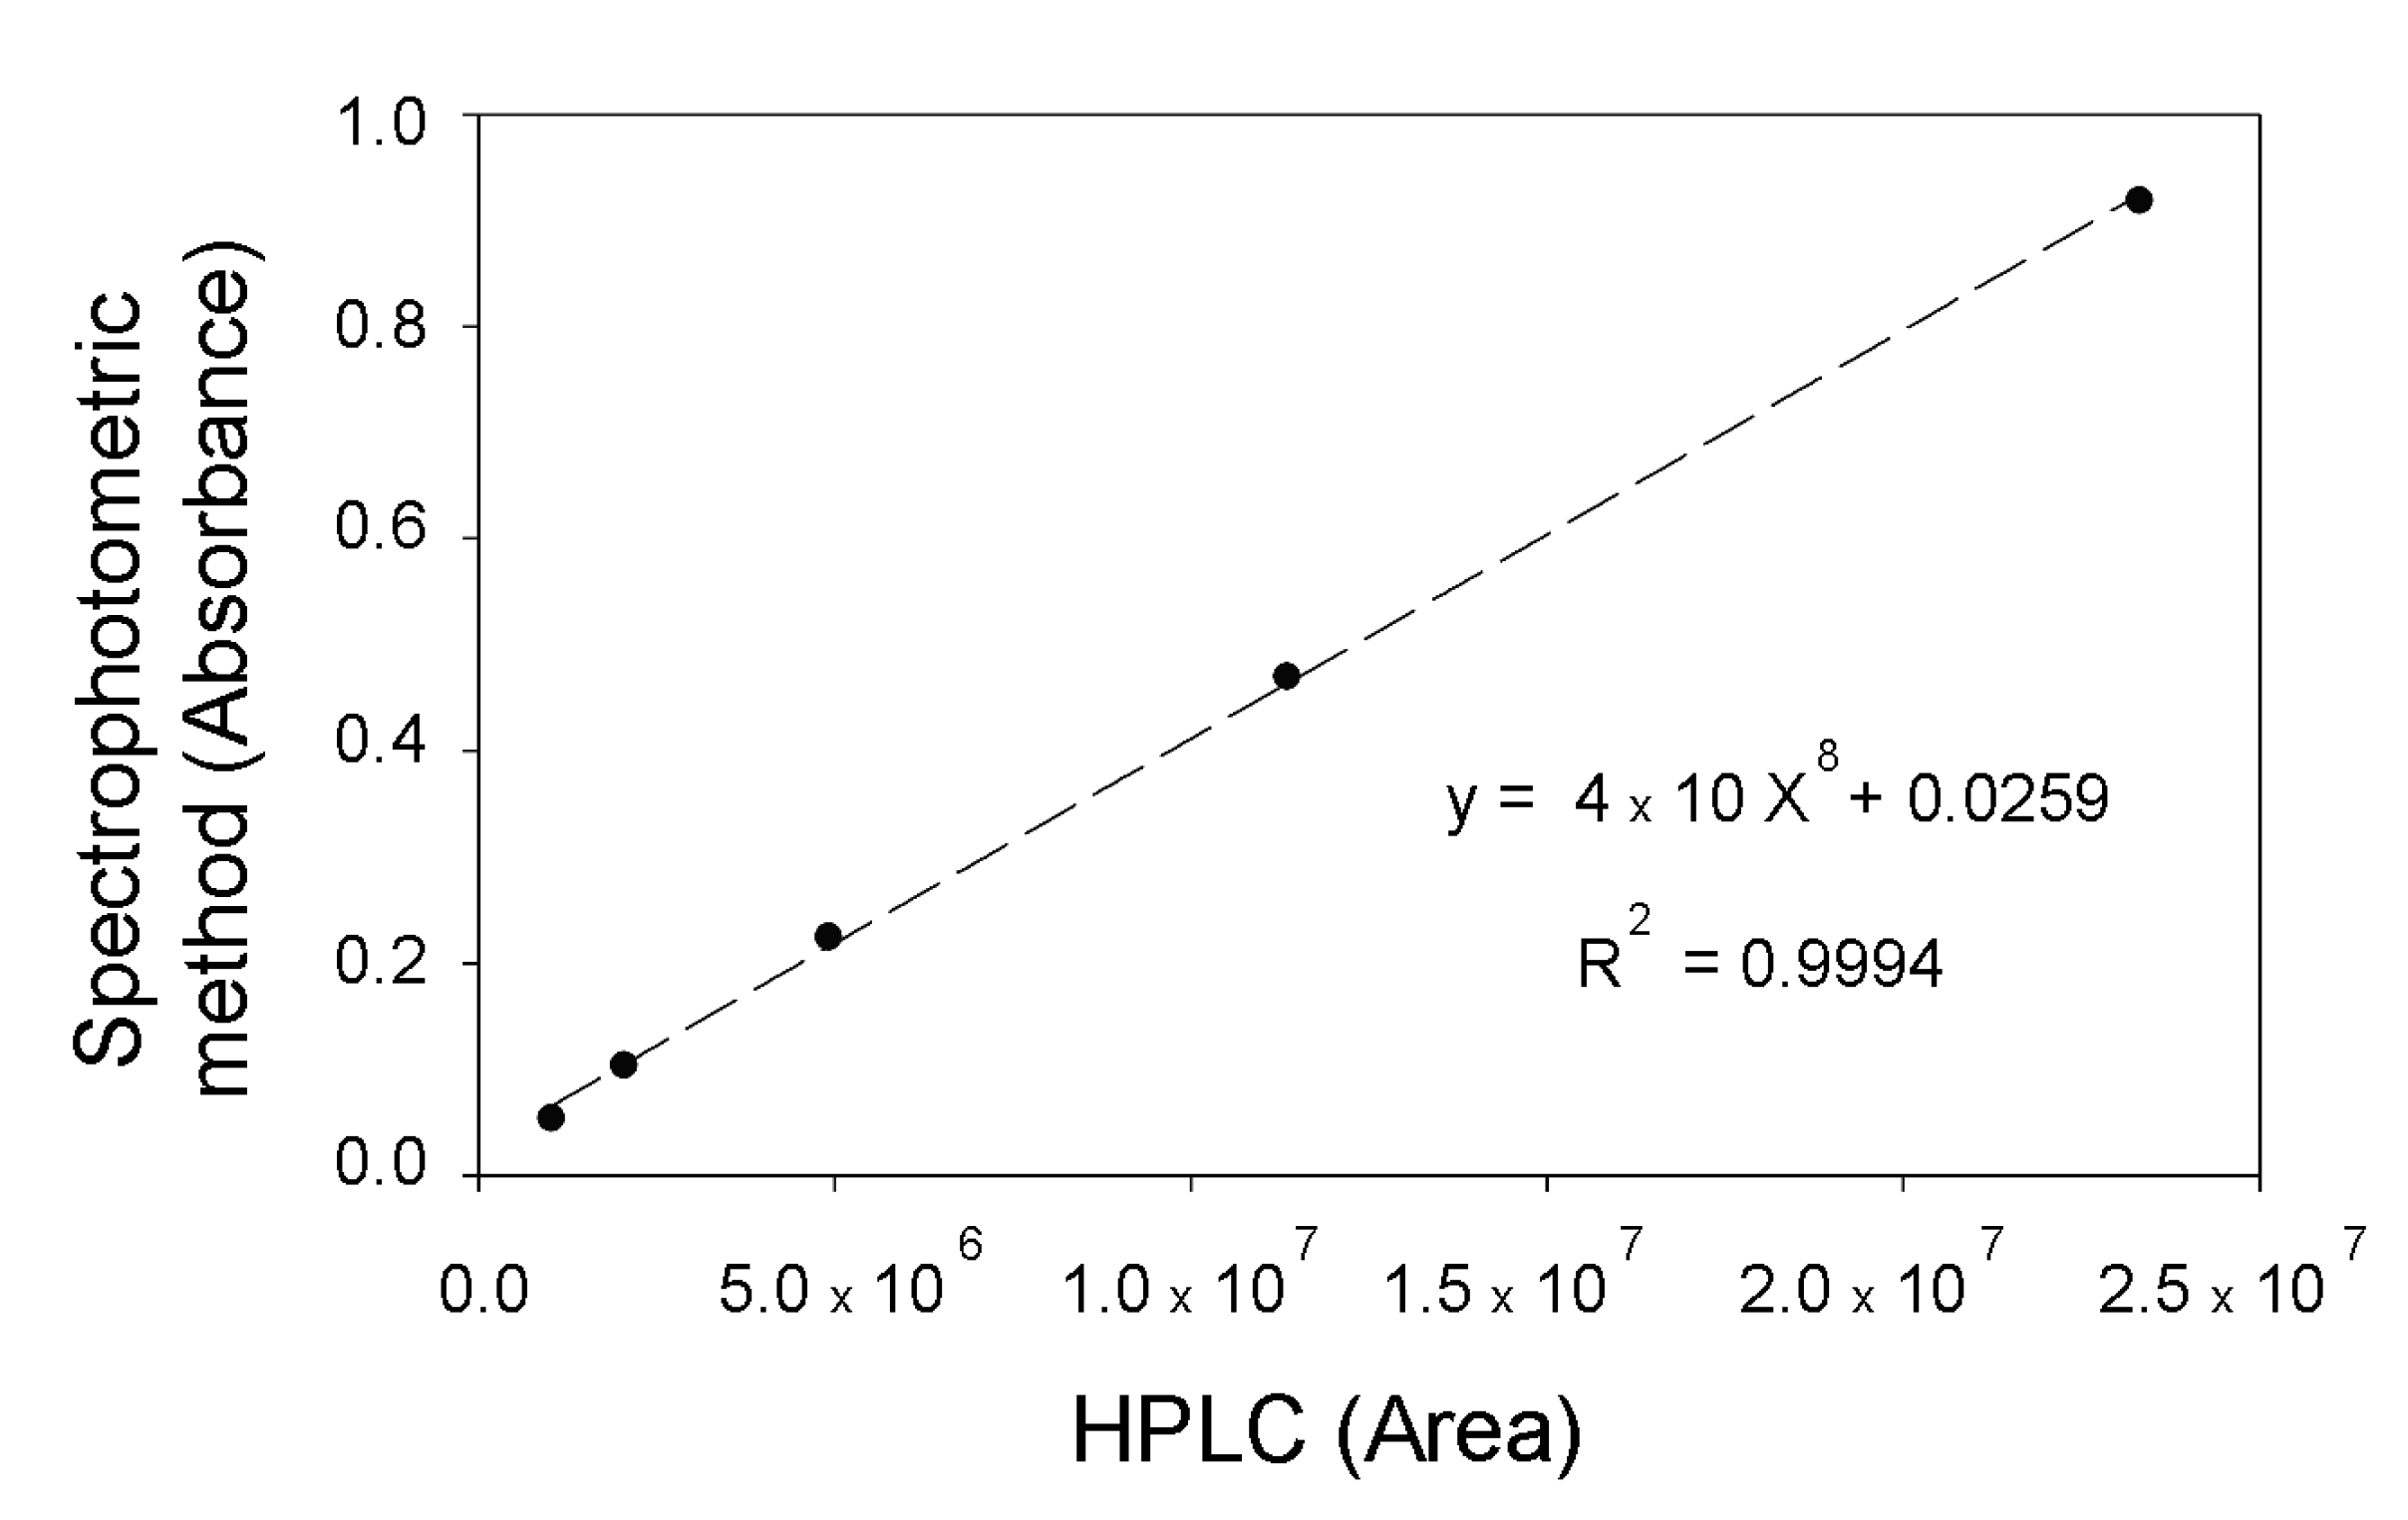
2.1.4. Method Validation
2.1.5. Method Reliability
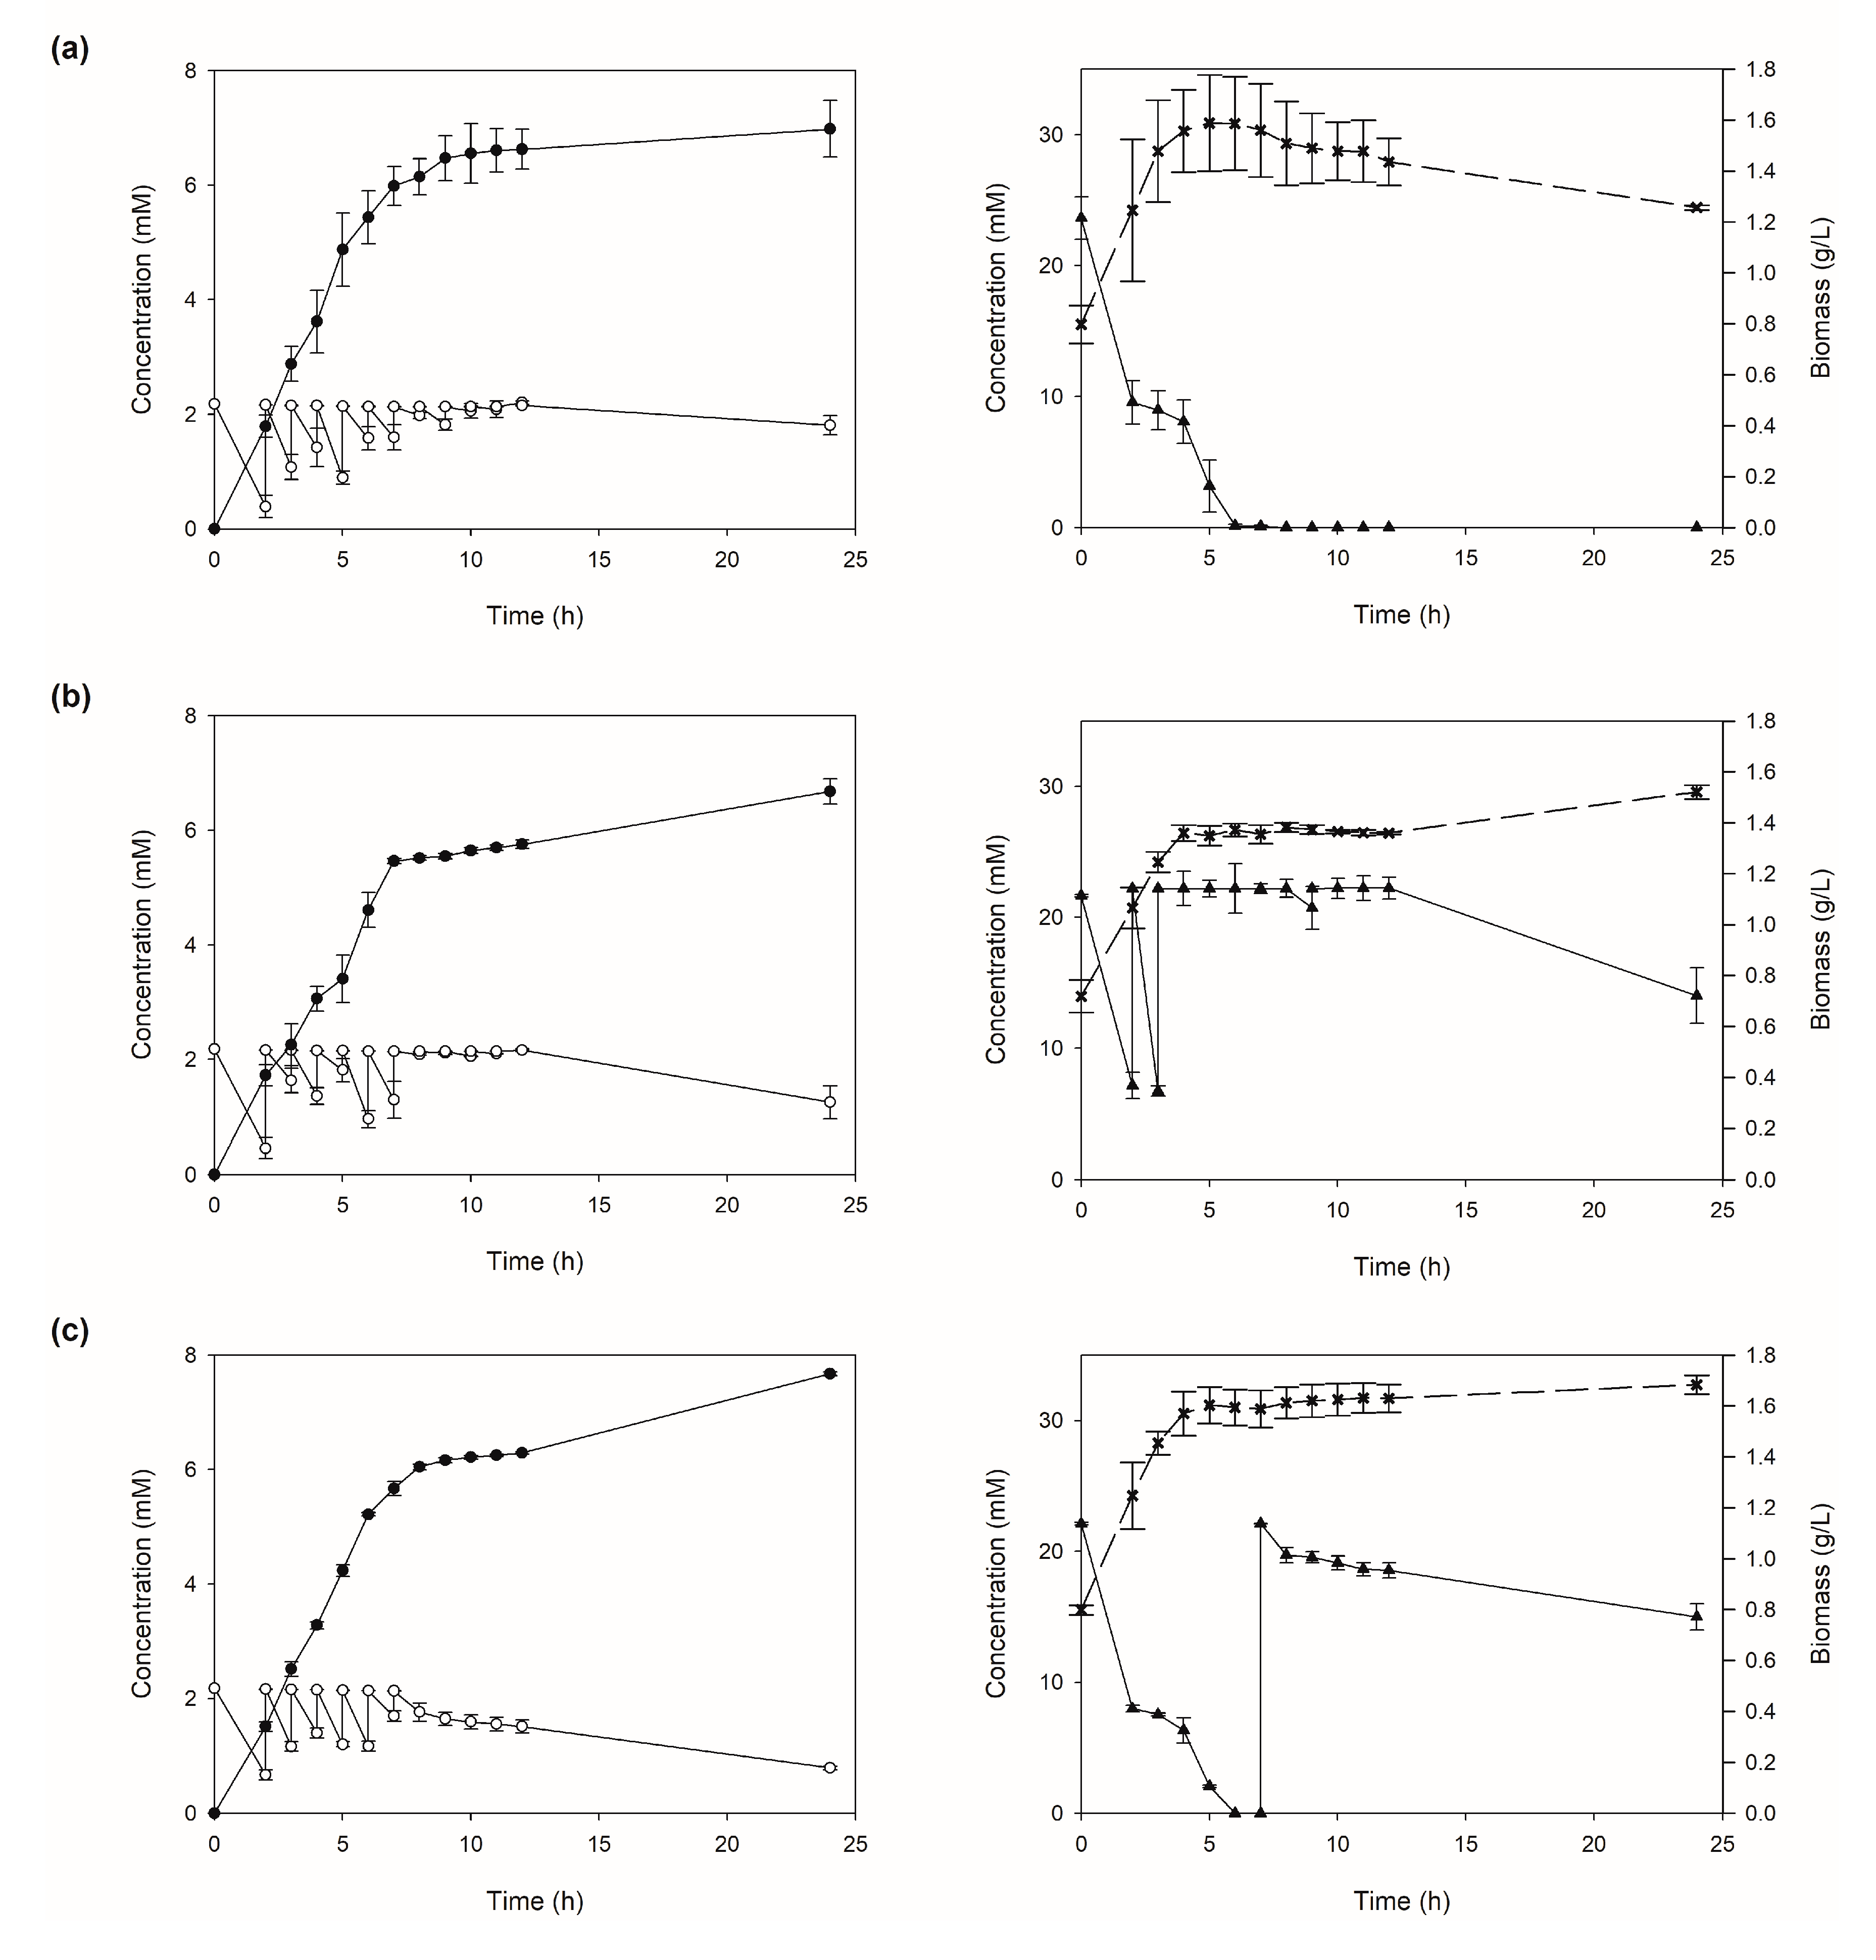
2.2. Optimization of the Whole-Cell Biocatalysis for D-DIBOA Using the Spectrophotometric Quantification Method
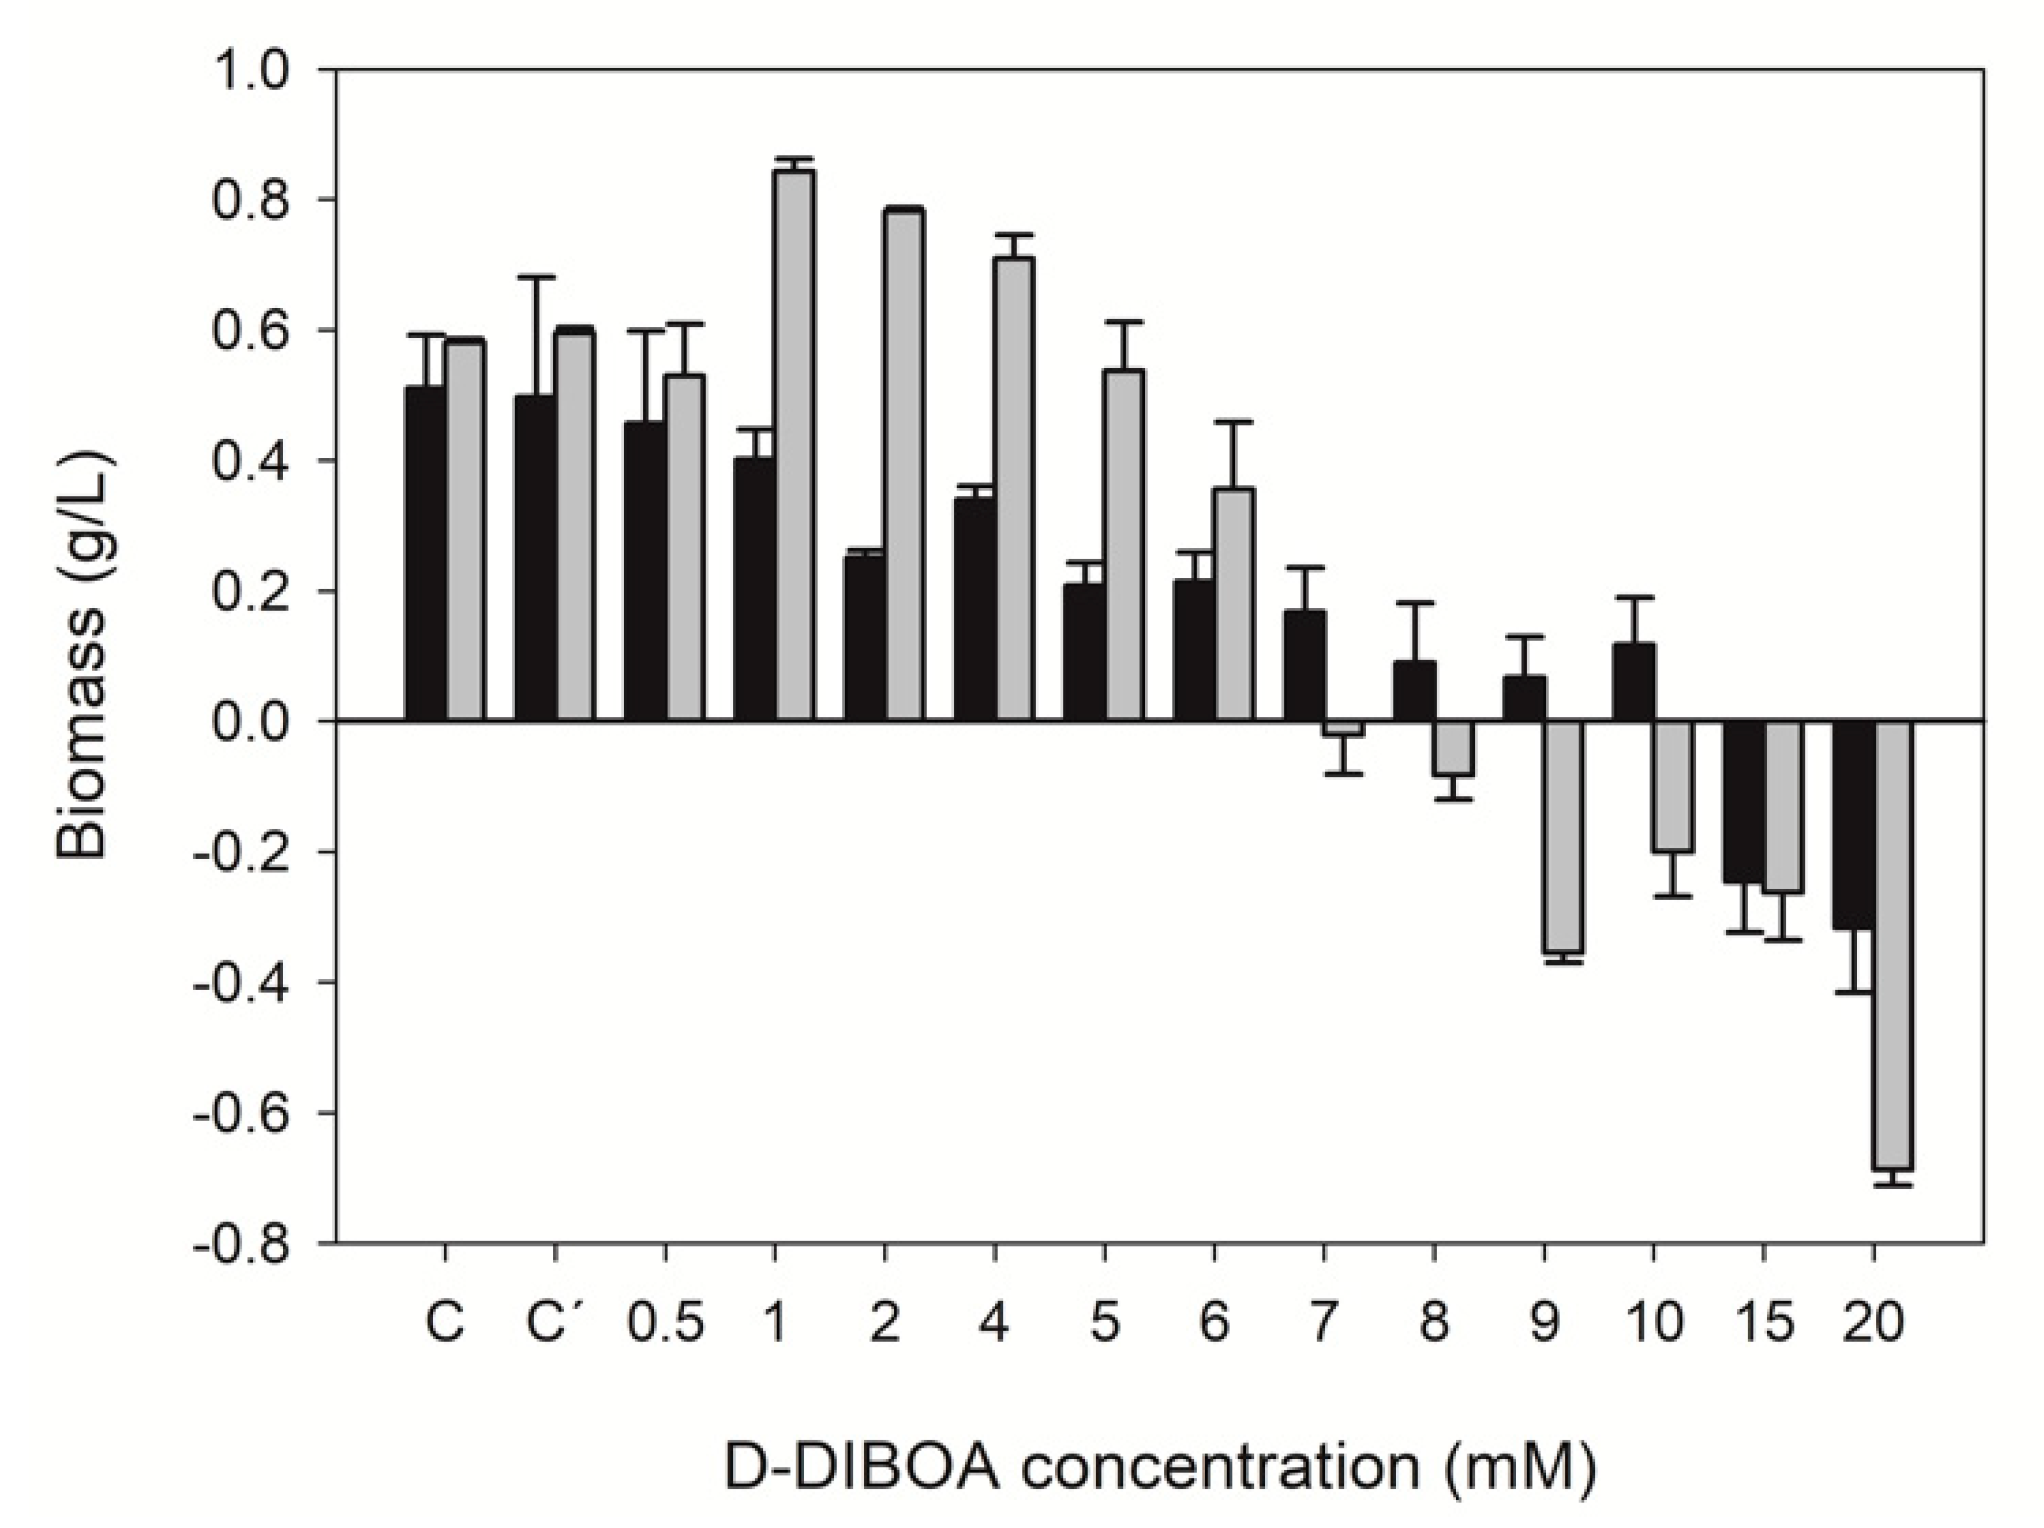
2.3. Tolerance of the E. coli ΔlapAΔfliQ/pBAD-NfsB Strain to D-DIBOA
3. Discussion
4. Materials and Methods
4.1. Bacterial Strains
4.2. Culture Media and Chemicals
4.3. Biotransformation Assays
4.4. Chemicals for Benzohydroxamic Acid Determination and Quantification
4.5. Analytical Instruments and Techniques, Calculation of Parameters, and Statistical Analysis
4.6. Method Validation
5. Conclusions
Supplementary Materials
Author Contributions
Funding
Acknowledgments
Conflicts of Interest
Abbreviations
| CV | coefficient of variation |
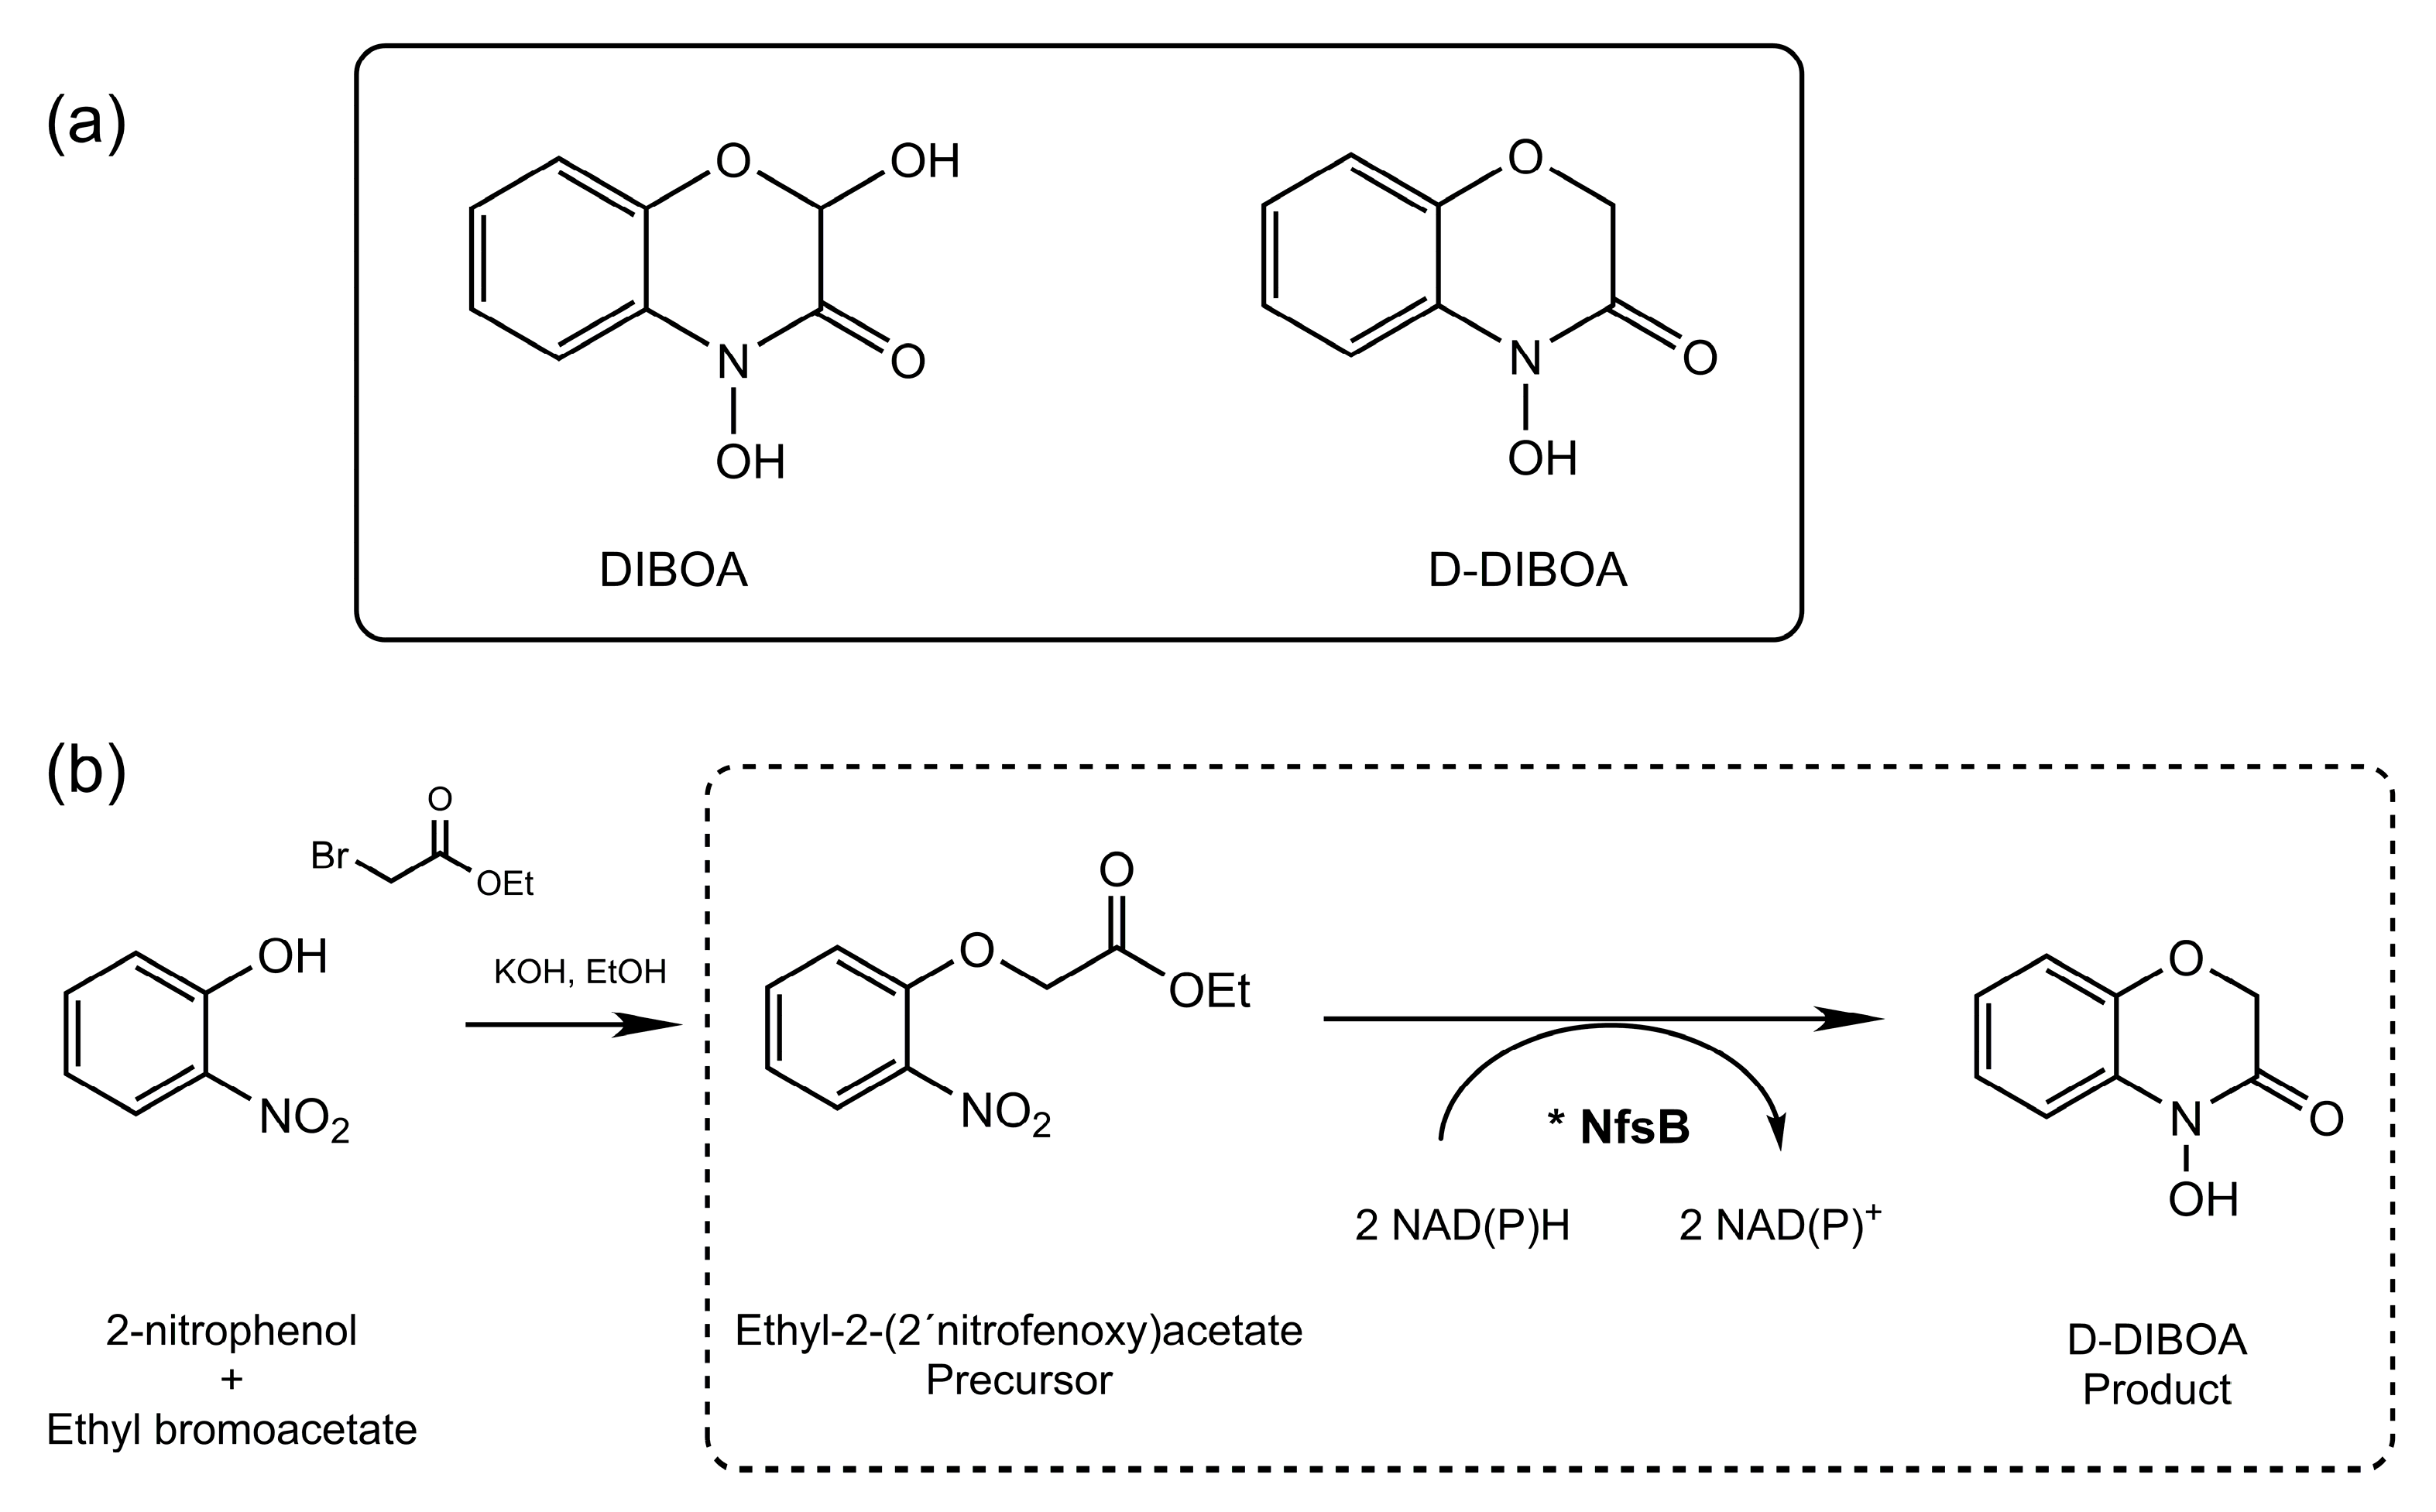
| DIBOA | 2,4-dihydroxy-(2H)-1,4-benzoxazin-3(4H)-one |
| D-DIBOA | 4-hydroxy-(2H)-1,4-benzoxazin-3(4H)-one |
| HPLC | high performance liquid chromatography |
| LOD | limit of detection |
| LOQ | Limit of quantification |
| NfsB | NAD(P)H-dependent nitroreductase |
| RSD | relative standard deviation |
References
- Rimando, A.M.; Duke, S.O. Natural Products for Pest Management; ACS Publications: Washington, DC, USA, 2006; pp. 2–21. [Google Scholar]
- Macías, F.A.; De Siqueira, J.M.; Chinchilla, N.; Marín, D.; Varela, R.M.; Molinillo, J.M.G. New herbicide models from benzoxazinones: Aromatic ring functionalization effects. J. Agric. Food Chem. 2006, 54, 9843–9851. [Google Scholar] [CrossRef]
- Fomsgaard, I.S.; Mortensen, A.G.; Carlsen, S.C.K. Microbial transformation products of benzoxazolinone and benzoxazinone allelochemicals—A review. Chemosphere 2004, 54, 1025–1038. [Google Scholar] [CrossRef]
- Macías, F.A.; Marín, D.; Oliveros-Bastidas, A.; Castellano, D.; Simonet, A.M.; Molinillo, J.M.G. Structure-Activity Relationship (SAR) Studies of Benzoxazinones, Their Degradation Products, and Analogues. Phytotoxicity on Problematic Weeds Avena fatua L. and Lolium rigidum Gaud. J. Agric. Food Chem. 2006, 54, 1040–1048. [Google Scholar] [CrossRef] [PubMed]
- Macías, F.A.; Marín, D.; Oliveros-Bastidas, A.; Castellano, D.; Simonet, A.M.; Molinillo, J.M.G. Structure−Activity Relationships (SAR) studies of benzoxazinones, their degradation products and analogues. Phytotoxicity on standard target species (STS). J. Agric. Food Chem. 2005, 53, 538–548. [Google Scholar] [CrossRef] [PubMed] [Green Version]
- Chinchilla, N.; Marín, D.; Oliveros-Bastidas, A.; Molinillo, J.M.G.; Macías, F.A. Soil biodegradation of a benzoxazinone analog proposed as a natural products-based herbicide. Plant Soil 2015, 393, 207–214. [Google Scholar] [CrossRef] [Green Version]
- Macías, F.A.; Marín, D.; Oliveros-Bastidas, A.; Chinchilla, D.; Simonet, A.M.; Molinillo, J.M.G. Isolation and synthesis of allelochemicals from gramineae: Benzoxazinones and related compounds. J. Agric. Food Chem. 2006, 54, 991–1000. [Google Scholar] [CrossRef]
- Valle, A.; Le Borgne, S.; Bolívar, J.; Cabrera, G.; Cantero, D. Study of the role played by NfsA, NfsB nitroreductase and NemA flavin reductase from Escherichia coli in the conversion of ethyl 2-(2′-nitrophenoxy)acetate to 4-hydroxy-(2H)-1,4-benzoxazin-3(4H)-one (D-DIBOA), a benzohydroxamic acid with interesting biol. Appl. Microbiol. Biotechnol. 2012, 94, 163–171. [Google Scholar] [CrossRef]
- de la Calle, M.E.; Cabrera, G.; Cantero, D.; Valle, A.; Bolivar, J. A genetically engineered Escherichia coli strain overexpressing the nitroreductase NfsB is capable of producing the herbicide D-DIBOA with 100% molar yield. Microb. Cell Fact. 2019, 18, 86. [Google Scholar] [CrossRef]
- Ferraz, R.S.; Mendonça, E.A.M.; Silva, J.P.A.; Cavalcanti, I.M.F.; Lira-Nogueira, M.C.B.; Galdino, S.L.; Pitta, I.R.; do Lima, M.C.A.; Santos-Magalhães, N.S.; Ferraz, R.S.; et al. Validation of a UV-spectrophotometric analytical method for determination of LPSF/AC04 from inclusion complex and liposomes. Braz. J. Pharm. Sci. 2015, 51, 183–191. [Google Scholar] [CrossRef] [Green Version]
- Lowry, O.H.; Rosebrough, N.J.; Farr, A.L.; Randall, R.J. Protein measurement with the Folin phenol reagent. J. Biol. Chem. 1951, 193, 265–275. [Google Scholar] [CrossRef]
- Bradford, M.M. A rapid and sensitive method for the quantitation of microgram quantities of protein utilizing the principle of protein-dye binding. Anal. Biochem. 1976, 72, 248–254. [Google Scholar] [CrossRef]
- Miller, G.L. Use of dinitrosalicylic acid reagent for determination of reducing sugar. Anal. Chem. 1959, 31, 426–428. [Google Scholar] [CrossRef]
- Cravatt, B.F.; Simon, G.M.; Yates, J.R. The biological impact of mass-spectrometry-based proteomics. Nature 2007, 450, 991–1000. [Google Scholar] [CrossRef] [PubMed]
- Méndez-Albores, A.; Tarín, C.; Rebollar-Pérez, G.; Dominguez-Ramirez, L.; Torres, E. Biocatalytic spectrophotometric method to detect paracetamol in water samples. J. Environ. Sci. Health Part A Toxic/Hazard. Subst. Environ. Eng. 2015, 50, 1046–1056. [Google Scholar] [CrossRef] [PubMed]
- Berríos, J.; Illanes, A.; Aroca, G. Spectrophotometric method for determining gibberellic acid in fermentation broths. Biotechnol. Lett. 2004, 26, 67–70. [Google Scholar] [CrossRef] [PubMed]
- Bartos, J. Colorimetric determination of organic compounds by formation of hydroxamic acids. Talanta 1980, 27, 583–590. [Google Scholar] [CrossRef]
- Corcuera, L.J.; Woodward, M.D.; Helgeson, J.P.; Kelman, A.; Upper, C.D. 2,4-Dihydroxy-7-methoxy-2H-1,4-benzoxazin-3(4H)-one, an Inhibitor from Zea mays with Differential Activity against Soft Rotting Erwinia Species. Plant Physiol. 1978, 61, 791–795. [Google Scholar] [CrossRef] [Green Version]
- Tipton, C.L.; Buell, E.L. Ferric iron complexes of hydroxamic acids from maize. Phytochemistry 1970, 9, 1215–1217. [Google Scholar] [CrossRef]
- Gálvez, N.; Ruiz, B.; Cuesta, R.; Colacio, E.; Domínguez-Vera, J.M. Release of Iron from Ferritin by Aceto-and Benzohydroxamic Acids. Inorg. Chem. 2005. [Google Scholar] [CrossRef]
- Villagrasa, M.; Eljarrat, E.; Barceló, D.; Barceló, D. Analysis of benzoxazinone derivatives in plant tissues and their degradation products in agricultural soils. Trends Anal. Chem. 2009, 28, 1103–1114. [Google Scholar] [CrossRef]
- ICH Harmonised Tripartite Guideline. Validation of analytical procedures: Text and methodology. In Q2 (R1) International Conference on Harmonization; IFPMA: Geneva, Switzerland, 2005; pp. 1–13. [Google Scholar]
- Horwitz, W.; Albert, R. The Horwitz ratio (HorRat): A useful index of method performance with respect to precision. J. AOAC Int. 2006, 4, 1095–1109. [Google Scholar] [CrossRef]
- Lin, B.; Tao, Y. Whole-cell biocatalysts by design. Microb. Cell Fact. 2017, 16, 106. [Google Scholar] [CrossRef] [PubMed] [Green Version]
- Fathi, Z.; Doustkhah, E.; Rostamnia, S.; Darvishi, F.; Ghodsi, A.; Ide, Y. Interaction of Yarrowia lipolytica lipase with dithiocarbamate modified magnetic carbon Fe3O4@C-NHCS2H core-shell nanoparticles. Int. J. Biol. Macromol. 2018, 117, 218–224. [Google Scholar] [CrossRef] [PubMed]
- de la Calle, M.E.; Cabrera, G.; Cantero, D.; Valle, A.; Bolivar, J. Overexpression of the nitroreductase NfsB in an E. coli strain as a whole-cell biocatalyst for the production of chlorinated analogues of the natural herbicide DIBOA. N. Biotechnol. 2019. [Google Scholar] [CrossRef] [PubMed]
- Greenberg, A.E.; Clesceri, L.; Eaton, A. Standard Methods for the Examination of Water and Wastewater, 18th ed.; American Public Health Association: Washington, DC, USA, 1992; ISBN 0875530915. [Google Scholar]


| Parameter | Range |
|---|---|
| λmax | 570 nm |
| Beer´s law range | 0.75–3 mM |
| Slope | 0.2181 |
| Intercept | 0.0104 |
| Correlation coefficient | 0.9997 |
| Accuracy | 98.24–102.22% |
| Precision (%RSD) | 0.95–2.07% |
| LOD | 0.0165 mM |
| LOQ | 0.0501 mM |
| Added D-DIBOA (mM) | Detected D-DIBOA Mean ± SD a (mM) | Mean Recovery (%) ± SD a (mM) |
|---|---|---|
| 0.75 | 0.7368 ± 0.0090 | 98.24 ± 1.20 |
| 1.5 | 1.5451 ± 0.0149 | 101.67 ± 1.00 |
| 3 | 3.0667 ± 0.0645 | 102.22 ± 2.15 |
| Precision | Added (µmol·mL−1) | Found (µmol·mL−1) ± SD a | RSDR (%) | Horrat Parameter |
|---|---|---|---|---|
| Method | ||||
| 0.75 | 0.7368 ± 0.0090 | 1.1476 | 0.2345 | |
| 1.5 | 1.5251 ± 0.0149 | 0.9505 | 0.2117 | |
| 3 | 3.0667 ± 0.0645 | 2.0697 | 0.4998 | |
| Inter-day | ||||
| Same analyst, day 1 and day 2 | 0.75 | 0.7347 ± 0.0141 | 2.2833 | 0.4666 |
| 1.5 | 1.5270 ± 0.0204 | 1.1055 | 0.2463 | |
| 3 | 3.0412 ± 0.0532 | 1.8961 | 0.4579 | |
| Intra-day | ||||
| Same analyst, day 1, different test | 0.75 | 0.7373 ± 0.0111 | 2.1773 | 0.4449 |
| 1.5 | 1.5283 ± 0.0224 | 1.1790 | 0.2626 | |
| 3 | 3.0698 ± 0.0456 | 1.7387 | 0.4198 | |
| Inter-analyst | ||||
| Analyst 1 and 2, day 1 | 0.75 | 0.7646 ± 0.0180 | 3.2860 | 0.6715 |
| 1.5 | 1.5973 ± 0.0818 | 4.2308 | 0.9424 | |
| 3 | 3.0908 ± 0.0886 | 2.4372 | 0.5885 |
Publisher’s Note: MDPI stays neutral with regard to jurisdictional claims in published maps and institutional affiliations. |
© 2020 by the authors. Licensee MDPI, Basel, Switzerland. This article is an open access article distributed under the terms and conditions of the Creative Commons Attribution (CC BY) license (http://creativecommons.org/licenses/by/4.0/).
Share and Cite
Cabrera, G.; Linares, T.; de la Calle, M.E.; Cantero, D.; Valle, A.; Bolivar, J. Optimization of the Biocatalysis for D-DIBOA Synthesis Using a Quick and Sensitive New Spectrophotometric Quantification Method. Int. J. Mol. Sci. 2020, 21, 8523. https://0-doi-org.brum.beds.ac.uk/10.3390/ijms21228523
Cabrera G, Linares T, de la Calle ME, Cantero D, Valle A, Bolivar J. Optimization of the Biocatalysis for D-DIBOA Synthesis Using a Quick and Sensitive New Spectrophotometric Quantification Method. International Journal of Molecular Sciences. 2020; 21(22):8523. https://0-doi-org.brum.beds.ac.uk/10.3390/ijms21228523
Chicago/Turabian StyleCabrera, Gema, Teresa Linares, Maria Elena de la Calle, Domingo Cantero, Antonio Valle, and Jorge Bolivar. 2020. "Optimization of the Biocatalysis for D-DIBOA Synthesis Using a Quick and Sensitive New Spectrophotometric Quantification Method" International Journal of Molecular Sciences 21, no. 22: 8523. https://0-doi-org.brum.beds.ac.uk/10.3390/ijms21228523