Article

From Inflammation to the Onset of Fibrosis through A2A Receptors in Kidneys from Deceased Donors

by
Elena Guillén-Gómez
1,2,3,*,
Irene Silva
2,3,4,
Núria Serra
2,3,4,
Francisco Caballero
5,
Jesús Leal
5,
Alberto Breda
6,
Rody San Martín
7,
Marçal Pastor-Anglada
8,9,
José A. Ballarín
2,3,
Lluís Guirado
2,4 and
Montserrat M. Díaz-Encarnación
2,3,*
1
Molecular Biology Laboratory, Fundació Puigvert, 08025 Barcelona, Spain
2
Nephrology Department, Fundació Puigvert, 08025 Barcelona, Spain
3
Institut Investigació Biosanitaria Sant Pau, Fundación Renal Iñigo Álvarez de Toledo (FRIAT), REDinREN, Autonomous University of Barcelona (UAB), 08025 Barcelona, Spain
4
Renal Transplant Unit, Fundació Puigvert, 08025 Barcelona, Spain
5
Department of Emergency Medicine and Transplant Coordination, Hospital de la Santa Creu i Sant Pau, Universitat Autònoma de Barcelona, 08041 Barcelona, Spain
6
Urology Department, Autonomous University of Barcelona (UAB), Fundació Puigvert, 08025 Barcelona, Spain
7
Molecular Pathology Laboratory, Institute of Biochemistry and Microbiology, Faculty of Sciences, Universidad Austral de Chile, 5110566 Valdivia, Chile
8
Department of Biochemistry and Molecular Biomedicine, Institute of Biomedicine (IBUB), University of Barcelona, National Biomedical Research Institute of Liver and Gastrointestinal Diseases (CIBER EHD), 08028 Barcelona, Spain
9
Institut de Recerca Sant Joan de Déu (IR SJD), 08950 Esplugues de Llobregat Barcelona, Spain
*
Authors to whom correspondence should be addressed.
Int. J. Mol. Sci. 2020, 21(22), 8826; https://0-doi-org.brum.beds.ac.uk/10.3390/ijms21228826
Submission received: 15 October 2020 / Revised: 16 November 2020 / Accepted: 20 November 2020 / Published: 21 November 2020
(This article belongs to the Special Issue Dissecting the Purinergic Signaling Puzzle)

Abstract

:
Pretransplant graft inflammation could be involved in the worse prognosis of deceased donor (DD) kidney transplants. A2A adenosine receptor (A2AR) can stimulate anti-inflammatory M2 macrophages, leading to fibrosis if injury and inflammation persist. Pre-implantation biopsies of kidney donors (47 DD and 21 living donors (LD)) were used to analyze expression levels and activated intracellular pathways related to inflammatory and pro-fibrotic processes. A2AR expression and PKA pathway were enhanced in DD kidneys. A2AR gene expression correlated with TGF-β1 and other profibrotic markers, as well as CD163, C/EBPβ, and Col1A1, which are highly expressed in DD kidneys. TNF-α mRNA levels correlated with profibrotic and anti-inflammatory factors such as TGF-β1 and A2AR. Experiments with THP-1 cells point to the involvement of the TNF-α/NF-κB pathway in the up-regulation of A2AR, which induces the M2 phenotype increasing CD163 and TGF-β1 expression. In DD kidneys, the TNF-α/NF-κB pathway could be involved in the increase of A2AR expression, which would activate the PKA–CREB axis, inducing the macrophage M2 phenotype, TGF-β1 production, and ultimately, fibrosis. Thus, in inflamed DD kidneys, an increase in A2AR expression is associated with the onset of fibrosis, which may contribute to graft dysfunction and prognostic differences between DD and LD transplants.

1. Introduction

Many factors specific to kidney transplant recipients (KTR) and donors influence the outcome of kidney transplantation [1,2,3] and prognostic differences between living and deceased grafts are well known. Despite this, little is known about the basal inflammatory status of donors at the time of donation [4]. Immunological activation during brain death results in infiltration of leukocytes, macrophages, and dendritic cells prior to kidney procurement [5,6,7], which can damage kidneys [8] and impact on short- and long-term renal graft function [9,10]. We showed previously that circulating monocytes from KTR are associated with prognosis in kidney transplantation [11]. Furthermore, different studies indicated macrophages accumulation in allograft biopsies of KTR [12], which is associated with renal interstitial fibrosis and tubular atrophy and graft outcome [13]. In fact, our group demonstrated that macrophage infiltration into renal grafts of deceased donors before transplantation is associated with long-term renal function [14]. Pre-implantation renal biopsies from deceased donors showed greater inflammation than those from living donors and this appeared to be mediated by M1 macrophages, although the presence of M2 macrophages was also observed, suggesting the coexistence of both phenotypes and even intermediate phenotypes [14]. Macrophage phenotype is modulated by adenosine, diminishing M1 proinflammatory macrophage activation and polarizing macrophages to an M2 anti-inflammatory phenotype [15,16]. Extracellular adenosine produced from hydrolysis of ATP (primarily by the ectoenzymes CD39 and CD73) mediates its effects via activation of G-protein-coupled receptors (A1, A2A, A2B, and A3). In the peritransplant period or during ischemia/reperfusion, ATP is released early after cell damage/death, inducing activation of immune cells that migrate to the site of injury [17,18]. Pannexin (Panx)-1 forms transmembrane channels that release ATP into the extracellular space. It is expressed ubiquitously and, in the kidney, Panx-1 is needed for the release of intracellular ATP from renal epithelial cells [19,20]. Subsequently, there is a decrease in the ATP/adenosine ratio to control inflammation and initiation of wound-healing processes that can lead to fibrosis (see [21] for a review). Adenosine is transported through nucleoside transporters (NT), being ENT1 and CNT2 good candidates, since they show high affinity for adenosine (40 μM and 8 μM, respectively) (see [22] for a review). However, CNT2 is a Na+-dependent concentrative transporter, which makes CNT2 an ideal candidate for regulating extracellular adenosine levels. A2A receptors (A2AR) are considered the primary anti-inflammatory effectors of extracellular adenosine due to their high expression on immune cells, such as monocytes/macrophages. A2ARs mainly activate the adenylate cyclase-cAMP-PKA canonical pathway and participate in tissue remodeling and reparation. Activation of A2AR in renal macrophages induces the expression of the anti-inflammatory cytokines and reduces kidney damage in the acute and chronic inflammation phases of glomerulonephritis [23].
This study was undertaken to examine the role of purinergic pathways with respect to pretransplant inflammation of kidneys from deceased donors, and specifically to investigate the role of adenosine A2AR and how it can influence macrophage phenotype.

2. Results

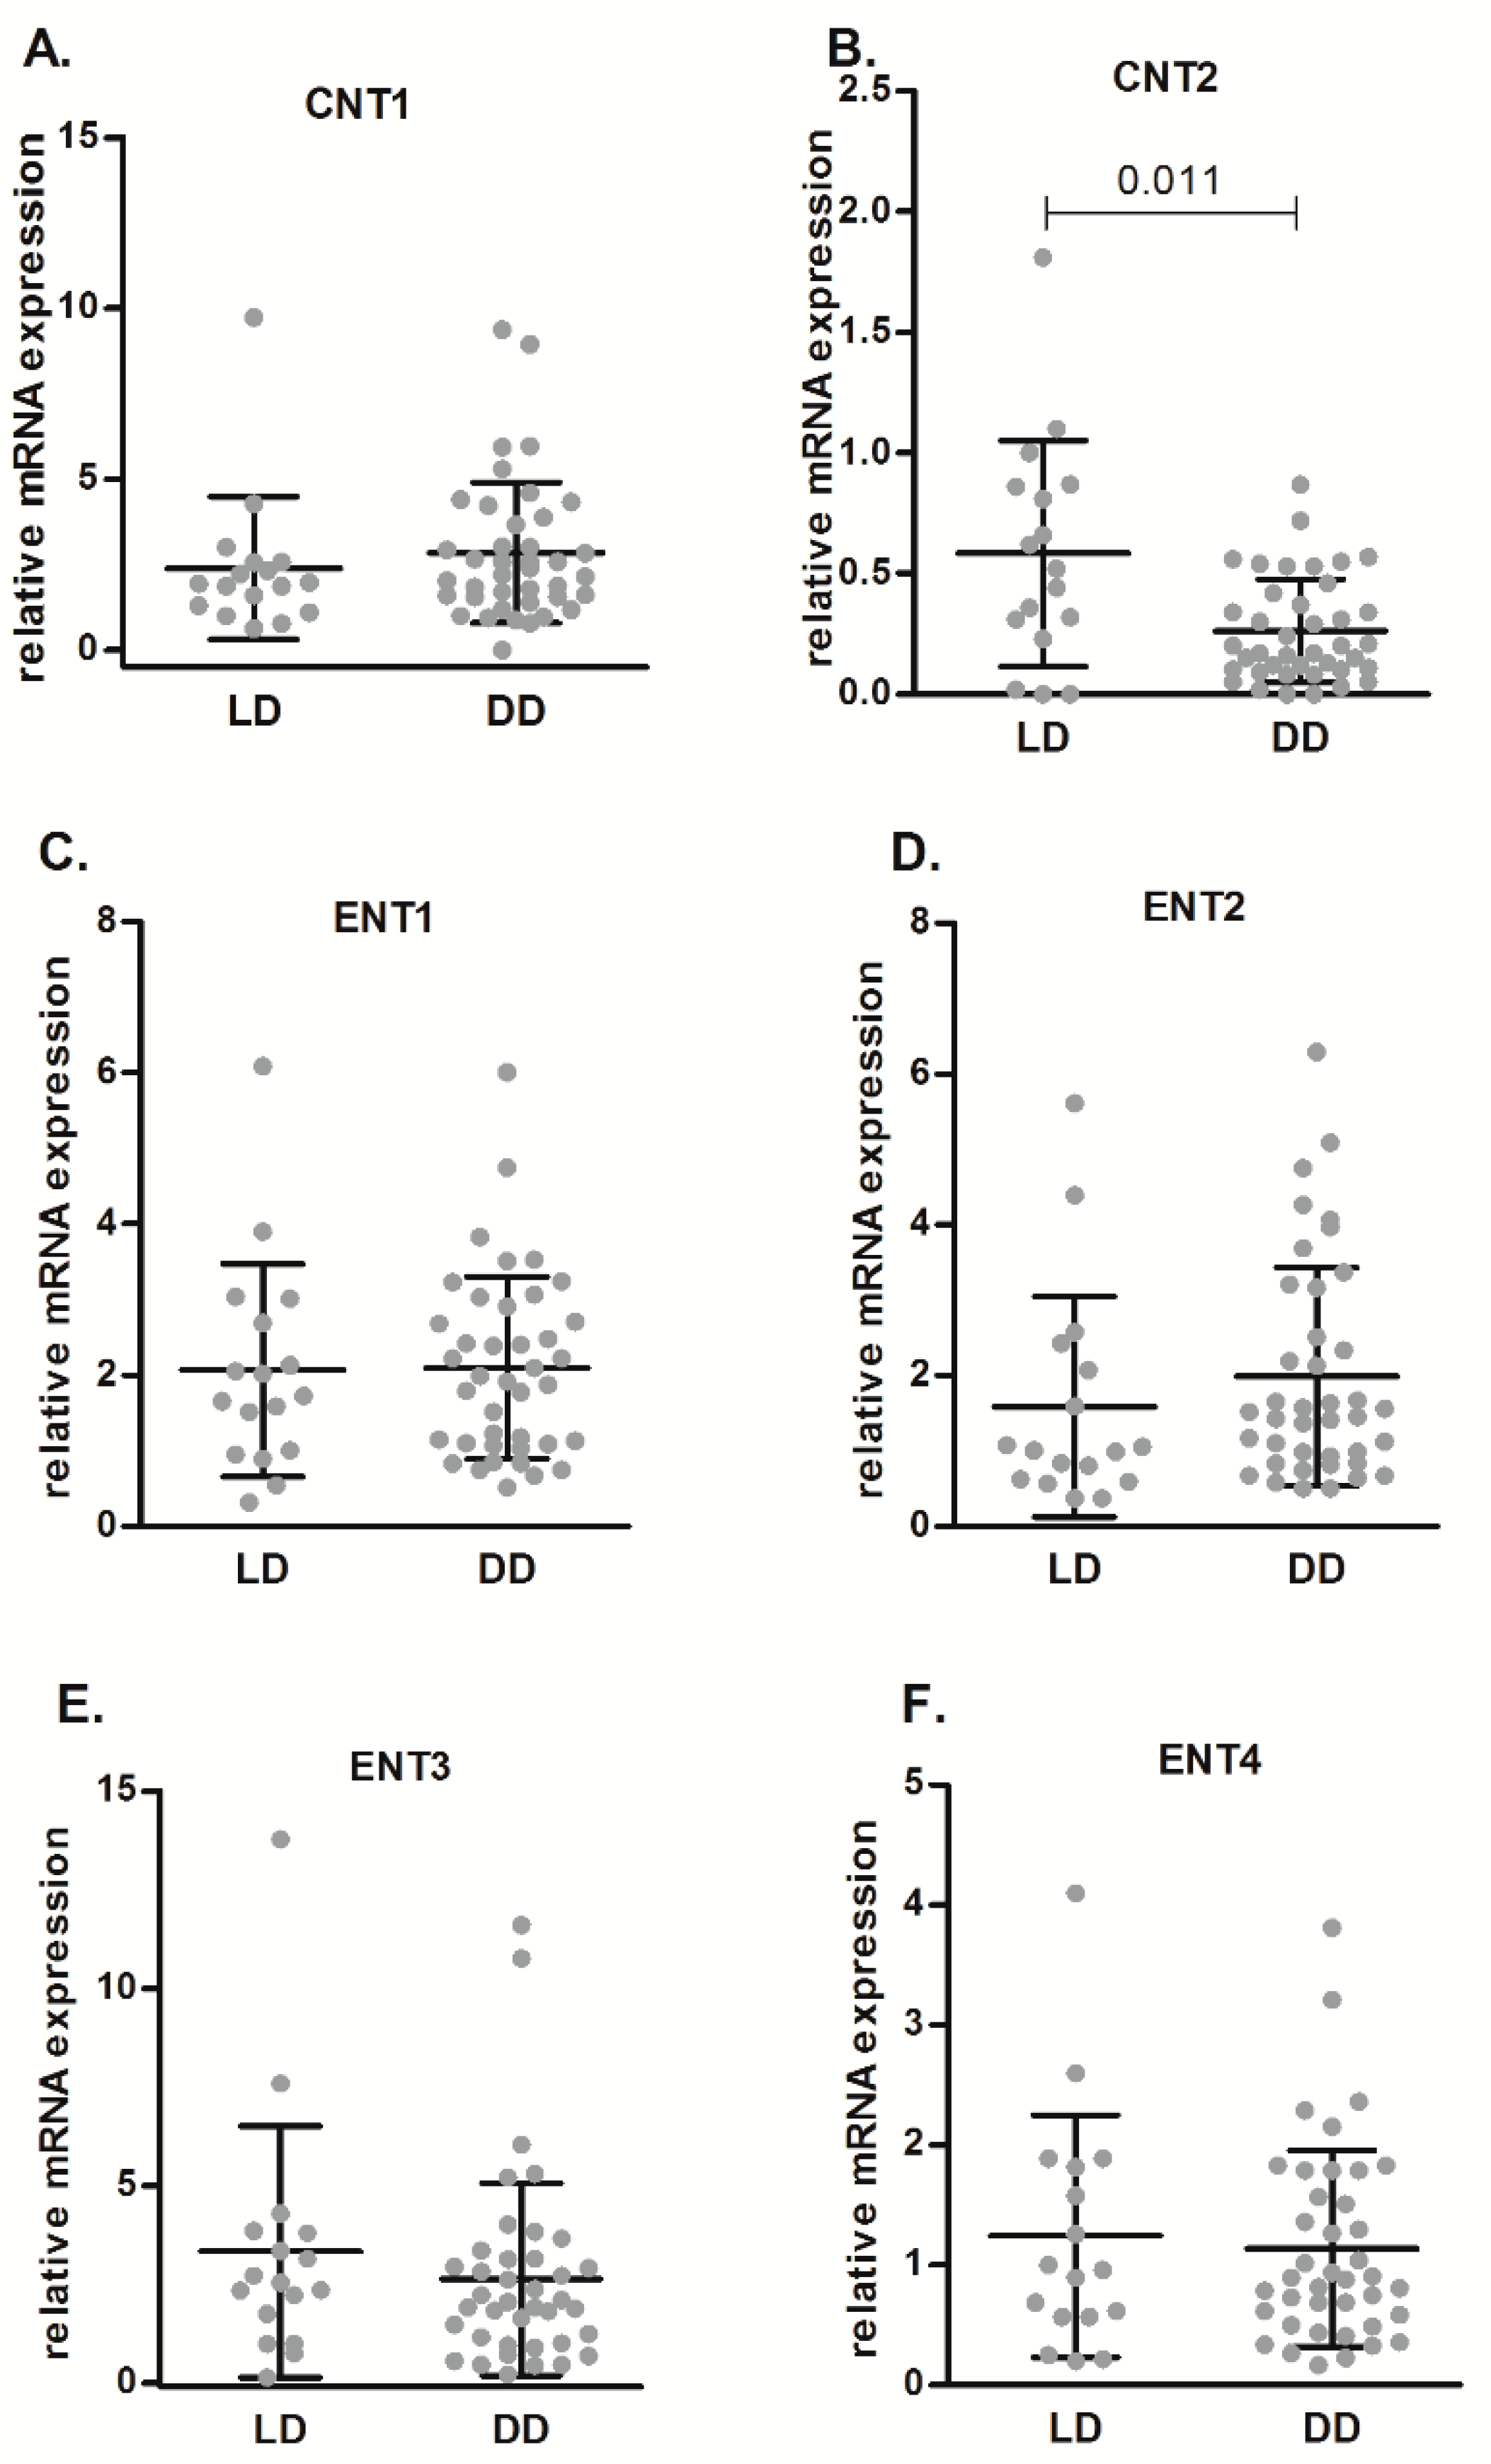
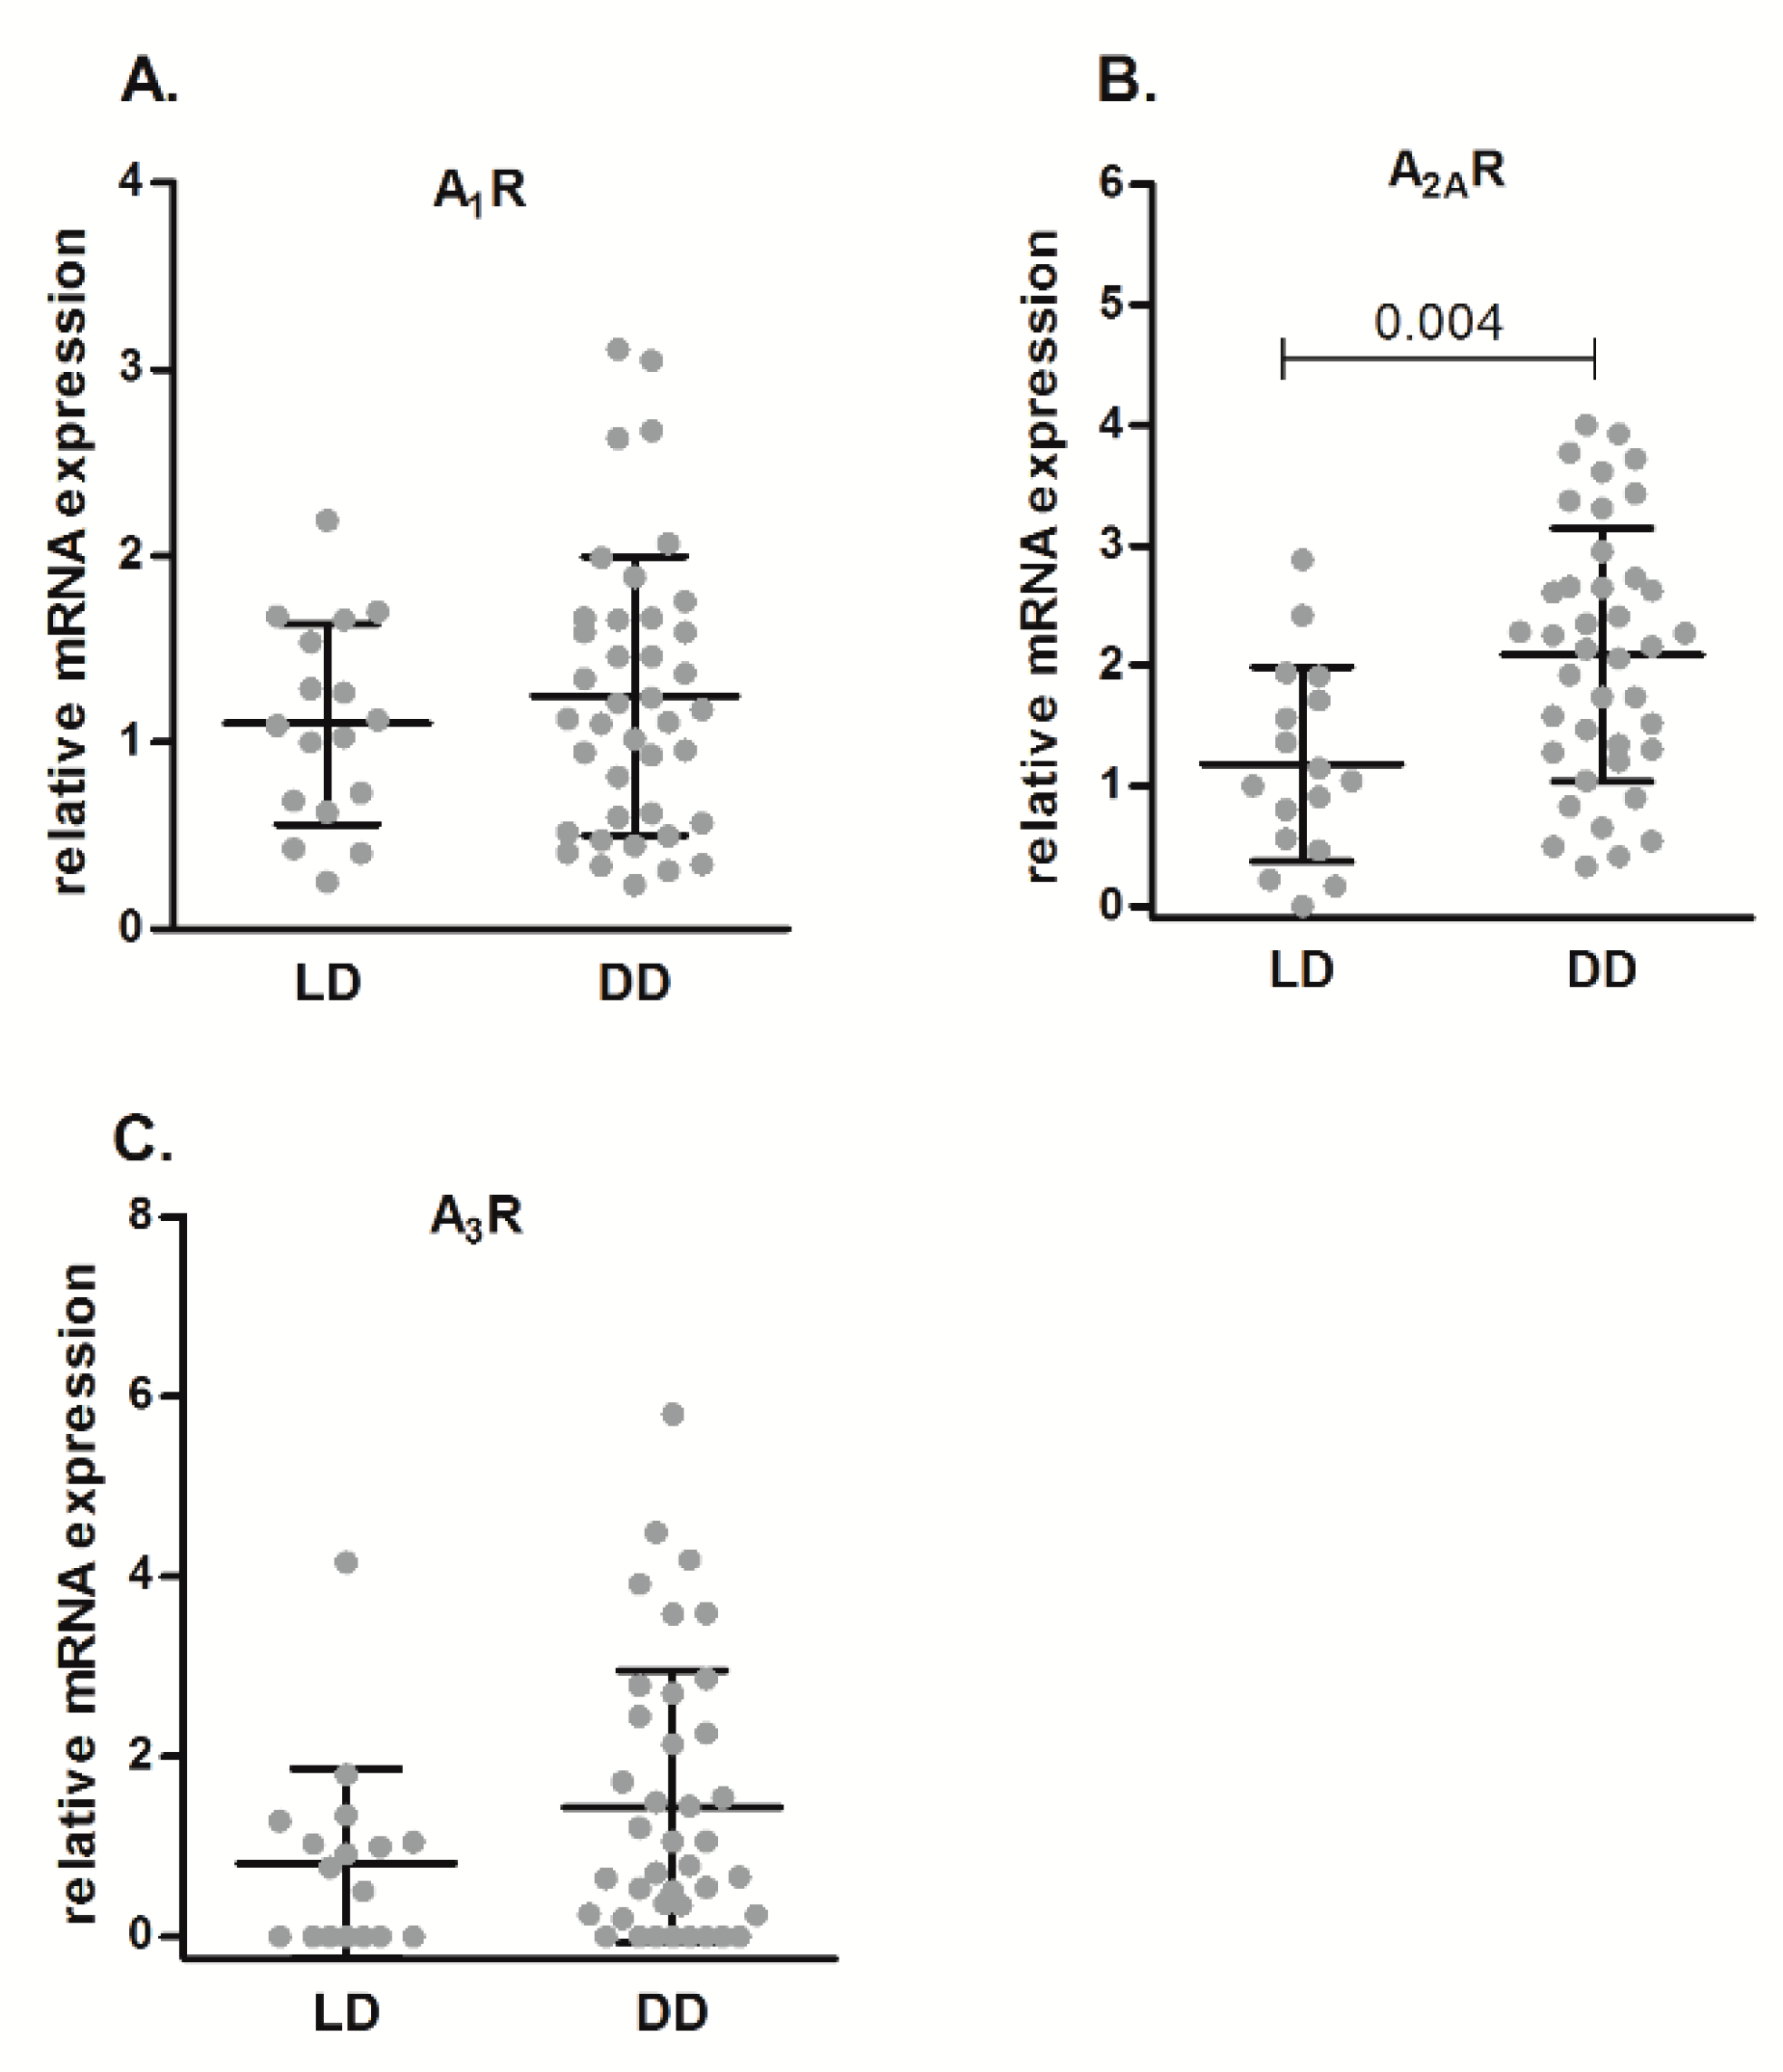
2.1. Differences in Purinome Gene Expression in Renal Biopsies from DD and LD

Gene expression levels related to cell purinome in pre-implantation renal tissue samples were analyzed to investigate expression differences between LD and DD. Figure 1 shows that we did not find statistically significant differences between LD and DD regarding mRNA expression levels of nucleoside transporters (NTs), except for hCNT2, which shows high affinity for adenosine and showed lower basal expression in DD than in LD (p = 0.019). We did not detect mRNA expression of hCNT3 in renal biopsy samples (data not shown).
Regarding the expression of P1 receptors (Figure 2), A1R (Figure 2A), and A3R (Figure 2C) did not show differences in mRNA levels between DD and LD, whereas A2AR (Figure 2B) showed higher expression levels in DD than in LD (p = 0.001). A2BR mRNA was hardly detected in renal biopsies samples (data not shown).
Figure 3 shows gene expression levels of different genes related to purinergic metabolism or ATP release in renal samples from LD and DD. mRNA levels of CD73 (Figure 3A) and S-adenosyl-L-homocysteine hydrolase (SAHH) (Figure 3E) was lower in DD than in LD (p = 0.009 and p < 0.001, respectively), whereas we did not observe any difference in CD39 (Figure 3B), adenylate cyclase (ADCY) (Figure 3C), or adenosine kinase (ADK) (Figure 3D) mRNA expression levels. The hemichannel Panx-1, showed higher mRNA levels in DD samples than in LD samples (p = 0.017) (Figure 3F).

2.2. Correlations of A2AR mRNA Expression Levels

To explore possible associations, correlations of gene expression levels of the different genes studied with A2AR were determined. Table 1 shows correlations (p and Spearman’s rho values) between A2AR and enzymes involved in adenosine metabolism and nucleoside transporters.
In general trends A2AR mRNA levels in DD samples positively correlated with the mRNA amounts of a panel of enzymes (i.e., CD73, ADK) and transporters (i.e., hENT1, hENT2, hCNT2) known to build up the cell purinome, likely to modulate adenosine-related biological events. Table 2 shows gene expression positive correlations detected between M1 macrophage phenotype or inflammatory markers (i.e., TNF-α, CD16, IL-1β), M2 macrophage phenotype or anti-inflammatory markers (i.e., IL-10, CD206, CEBPB) and fibrotic markers (i.e., TGFB1, ACTA2) with A2AR, in renal tissue samples of DD.
Table 2 also shows differences in expression levels of these genes between DD and LD renal samples. Expression levels of several markers related to inflammation or phenotype change of macrophages were up-regulated in DD (i.e., TNF-α, IL-1β, CD163), while of the fibrosis markers, TGF-β1 and col1A1 were the only ones overexpressed in DD. Interestingly, expression levels of A2A and TNF-α are higher in DD than in LD and correlate in both donor groups. Although no association was found between A2AR mRNA levels and factors, such as donor age or cold ischemia time, an inverse correlation was observed between the amount of PANX1 mRNA and cold ischemia time, only in kidneys from DD (p = 0.0023, r = −0.4522). With regard to fibrosis, we showed previously that DDs are significant older than LDs, whereas the analysis of pre-transplant kidney biopsies using the Remuzzi score, only for research purposes and not to determine the suitability of the graft, found that more than 80% of both, DD and LD samples, obtained a total score ≤ 3 [14].

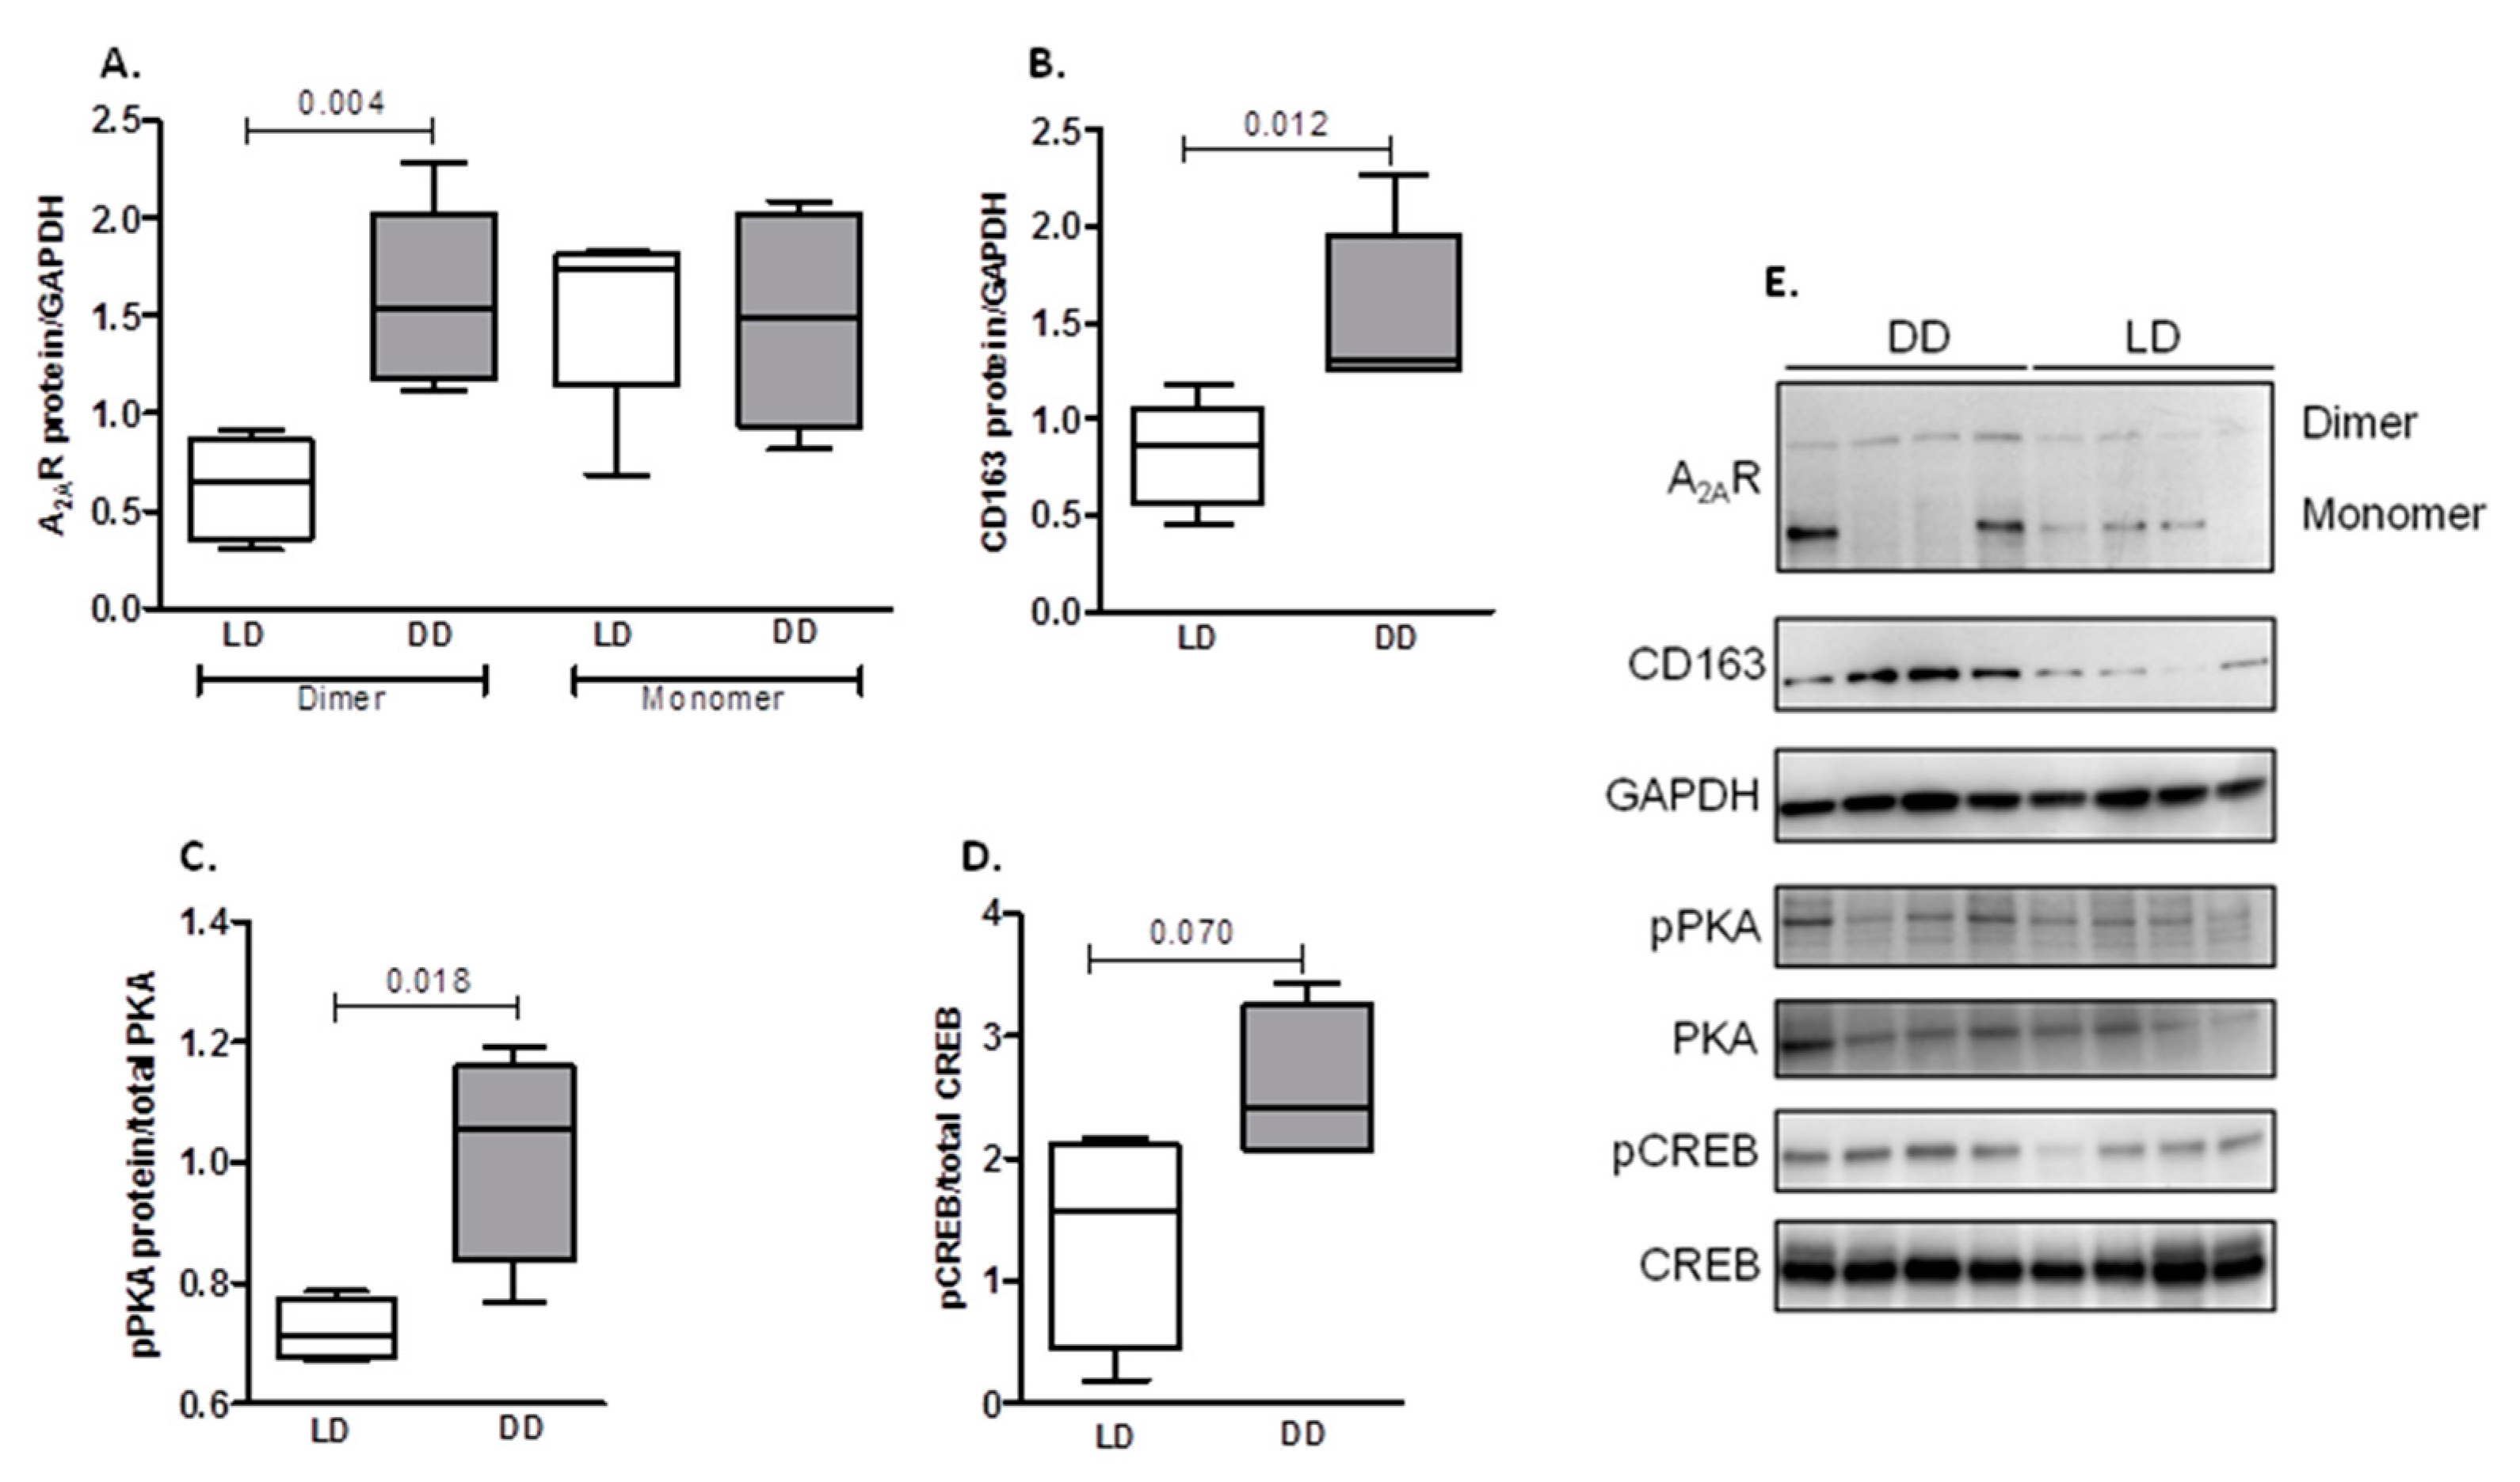
2.3. Protein Expression in Renal Biopsies from DD and LD

Protein levels were measured in pre-implantation renal tissue of both DD and LD, and these data are summarized in Figure 4. It shows that the expression of the active dimer form ofA2AR (p = 0.004) (Figure 4A), CD163 (p = 0.012) (Figure 4B), and pPKA (p = 0.018) (Figure 4C) proteins was significantly higher in kidney extracts from DD compared with LD samples. Levels of pCREB were also marginally higher in DD, although statistical significance was not reached (p = 0.070) (Figure 4D).

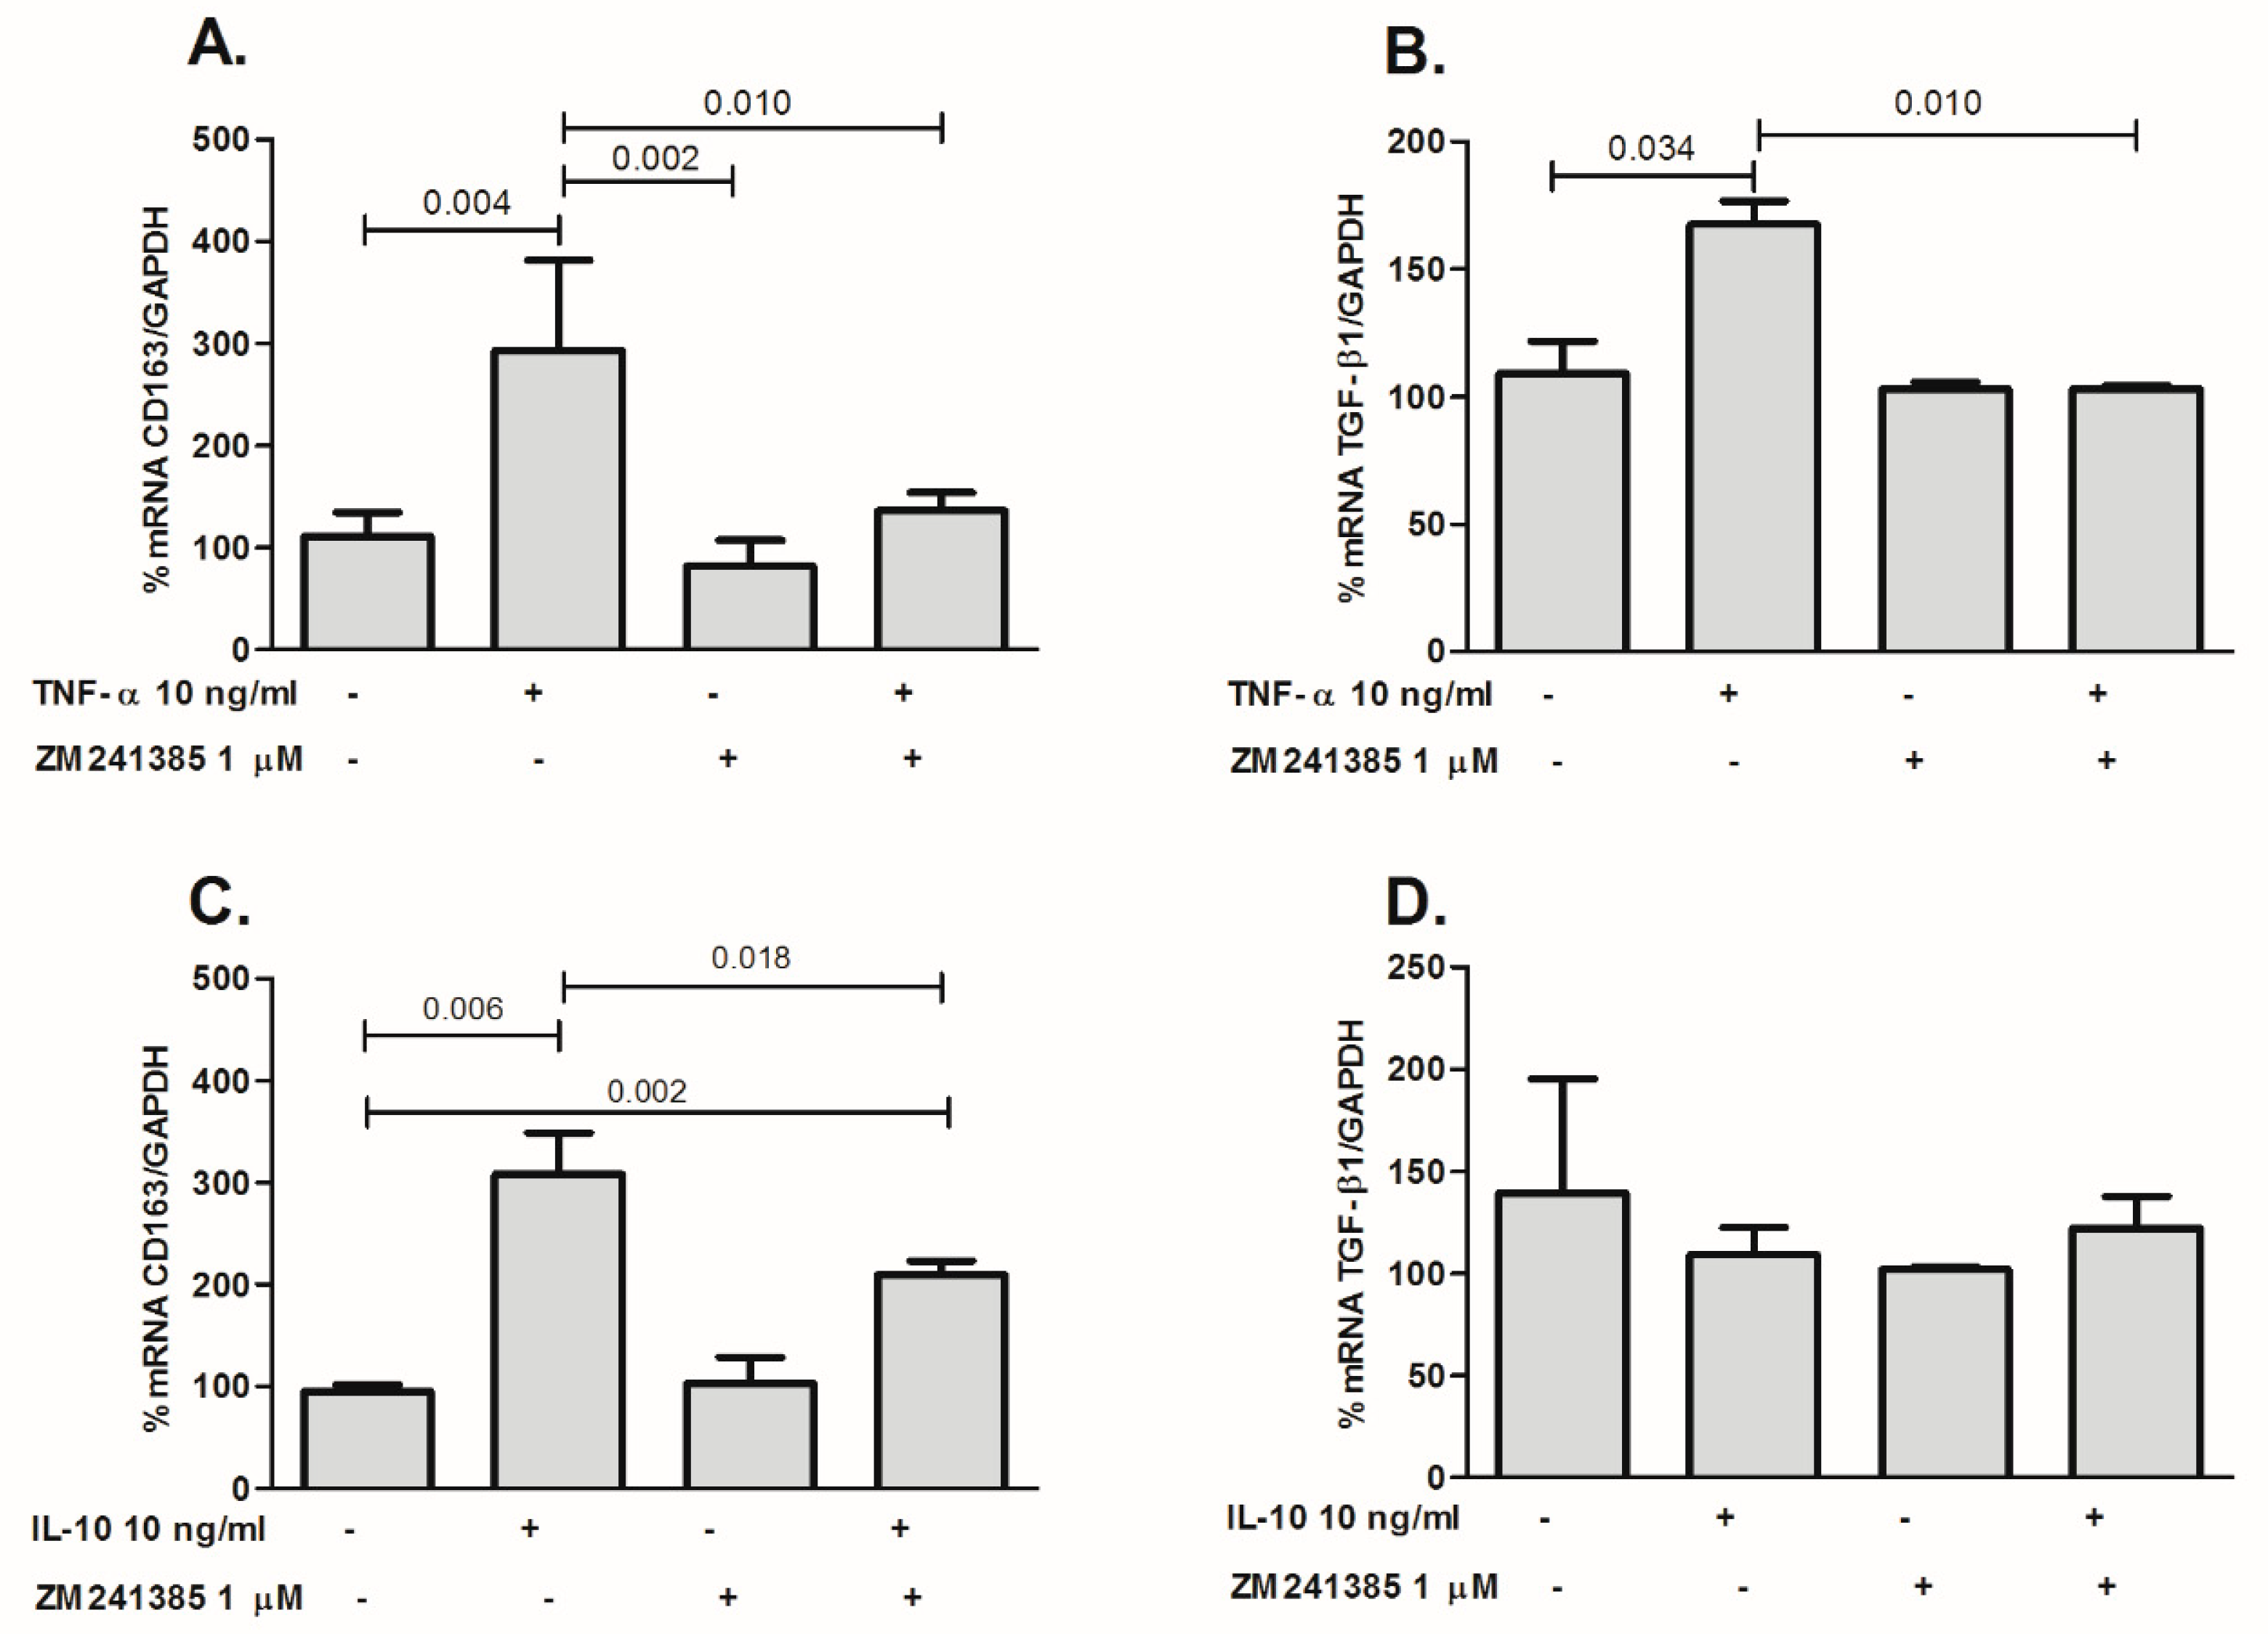
2.4. TNF-α Increases Expression of CD163 and TGF-β1 through A2AR in THP-1 Cells

THP-1 is a human leukemia monocytic cell line, which has been extensively used to study monocyte/macrophage functions. In the present study, regulation of the A2AR pathway and monocyte activation by TNF-α was examined using the in vitro model of undifferentiated THP-1 monocytes. TNF-α addition increased A2AR mRNA expression levels in THP-1 cells (Figure 5A) as previously reported [24]. This increase was significant at all time points analyzed, although the results showed a dependence on TNF-α incubation time and concentration, showing the maximum increase 3 h after 10 ng/mL TNF-α addition. CD163 and TGF-β1 gene mRNA levels were up-regulated at 18 and 24 h of treatment (Figure 5B). Shorter treatments (3 and 6 h) did not result in changes in mRNA levels.
Figure 6 shows that pretreatment with 1 µM ZM241385 (A2AR antagonist) abolished the effect of TNF-α on CD163 (Figure 6A) and TGF-β1 (Figure 6B) mRNA up-regulation, providing evidence that the A2A receptor is involved in M2 macrophage activation by TNF-α. Treatment of THP-1 cells with a known CD163 inducer, IL-10, similarly increased CD163 mRNA expression levels in a manner that was also dependent upon A2AR signaling, as demonstrated by its blockade by ZM241385, showing the role of the A2AR in the shift to M2 phenotype (Figure 6C). There was no observed effect of IL-10 on the expression of TGF-β1 (Figure 6D).
To know the potential involvement of the NF-κB signaling-pathway in these events, cells were pre-treated with BMS345541, a highly selective inhibitor of IκB Kinase. Figure 7 shows this inhibition blocked the up-regulation of gene expression levels of A2AR (Figure 7A), CD163 (Figure 7B) and TGF-β1 (Figure 7C), triggered by TNF-α.

3. Discussion

This study highlights different activated processes in kidney allografts from DD versus LD before transplantation. Renal transplant recipients show higher concentrations of proinflammatory cytokines in grafts from DD than in those from LD [25]. We recently reported that inflammatory and reparative responses coexist in DD kidney grafts, indicating that pre-implantation kidney grafts from DD exhibit more inflammation than those from LD [14]. Inflammation can be modulated by adenosine [26,27], which exerts its anti-inflammatory activity mainly through A2AR [28,29,30]. Our results indicate that A2AR expression is increased in DD kidney grafts, which would induce anti-inflammatory responses that eventually could lead to the onset of renal fibrosis if uncontrolled or persistent inflammation occurs [31]. Monocytes and macrophages synthesize and release TNF-α, a potent mediator of inflammation that induces A2AR activity [24,32]. A2AR expression can be up-regulated directly by TNF-α [33] because of the presence of NF-κB binding sites in the upstream regions of the A2AR gene [24,34], but it has also been suggested that TNF-α may inhibit desensitization of A2AR and enhance the functions of the receptor [35].
Evidence suggests a role of TNF-α in renal interstitial fibrosis and collagen deposition [36], which may be mediated by TGF-β1 increase [37,38]. In our study, renal samples from DD showed higher gene expression of A2AR, TNF-α and TGF-β1 than LD and correlated positively with each other. Neutralization of TNF-α was found to reduce TGF-β1 production, myofibroblast activation, and collagen deposition, and therefore diminished renal interstitial fibrosis [39]. Our results with THP-1 cells confirm that TNF-α increases A2AR gene expression through the NF-κβ pathway, which can induce M2 phenotype and fibrosis.
Up-regulation of A2AR is likely to be the beginning of a reduction in inflammatory response. A2AR downregulates classic macrophage activation, reducing the production of proinflammatory cytokines such as TNF-α and increasing the expression of the anti-inflammatory cytokine IL-10 [40]. In addition, it was reported that A2AR antagonists promote the M1 phenotype of macrophages infiltrating nephritic glomeruli [41]. A2AR signaling through G proteins is based on the stimulation of adenylate cyclase (AC), which induces intracellular cAMP and activates protein kinase A (PKA). Moreover, A2AR and AC mRNA expression showed a positive correlation in DD samples and p-PKA was increased in DD samples compared with LD samples. Chronic inflammatory tissue injury is accompanied by the accumulation of extracellular adenosine released by immune and non-immune cells. Adenosine receptor expression in macrophages appears to change upon inflammatory activation, since A2ARfunction in human THP-1 monocytes has been shown to be up-regulated by IL-1β and TNF-α [24]. Indeed, our results show that A2AR gene expression in THP-1 monocytes is rapidly up-regulated by TNF-α, suggesting that anti-inflammatory A2AR is up-regulated following classic activation of macrophages, possibly to initiate resolution of inflammation [26].
It is worth noting that the induction of A2AR by TNF-α is relatively fast and persistent whereas induction of CD163 and TGF-β1 occurs later and is A2AR-dependent. These results support that fibrotic processes are initiated through A2AR-activation when monocytes/macrophages are exposed to prolonged inflammation. Although CD73 expression is lower in DD than in LD samples, indicating that extracellular synthesis of adenosine might be somehow reduced, hCNT2 expression is downregulated in DD samples, which is consistent with reduced adenosine clearance from the extracellular milieu. Indeed, as recently reviewed [22], hCNT2 may be a major player in regulating extracellular adenosine levels and there is evidence of CNT2 being regulated at the post-translational level [42]. Interestingly, the hCNT2-encoding gene (SLC28A2) is by far the most dramatically down-regulated one among the purinome-related genes in inflamed ileal mucosa samples from Crohn’s disease patients [43]. Furthermore, A2ARs are known to up-regulate CNT2 activity in differentiated PC12 cells [43]. Moreover, it was also observed that hypoxia downregulated CNT2 function without affecting ENT1 activity, which suggests, as mentioned above, an important role of CNT2 in the modulation of extracellular adenosine concentrations [43,44]. In this regard, A2AR signaling again emerges as an important mechanism for limiting inflammatory responses [45,46,47]. Although some authors observed that CD73 expression and function were upregulated by proinflammatory mediators [48,49], Zanin et al. provided evidence that proinflammatory M1 macrophages decrease both the expression and the activity of CD39 and CD73, leading to reduced ATP degradation [50]. Moreover, TNF-α was found to reduce the surface expression and activity of CD73 [51]. By contrast, M2 macrophages showed increased expression and activity of both enzymes, followed quickly by the conversion of ATP into adenosine. Our findings on pre-implant kidney grafts from DD confirmed overexpression of TNF-α and decreased expression of CD73. Chronic lack of CD73 was associated with an autoimmune inflammatory phenotype, which at the renal level affects the glomerular endothelium, leading to glomerular inflammation, injury, and interstitial cellular infiltrate, with consequent proteinuria and decreased kidney function [52]. Our results also show a little—but significantly increased—expression of Panx-1 and an inverse correlation with ischemic time in kidneys from DD. This could be due to a known regulation of the channel by the released ATP itself that can bind to a binding site in aPanx-1 extracellular loop to prevent persistent excitatory signaling of Panx1-mediated ATP release [53]. Moreover, increased extracellular ATP levels can induce the internalization of Panx1, avoiding further release of excitatory ATP [54].
In our study, low intracellular SAHH gene expression in DD grafts may contribute to the accumulation of S-adenosylhomocysteine (SAH) and to a decrease in intracellular adenosine and homocysteine production. Barroso et al. showed that an excess of SAH in response to NF-kB activation leads to the expression of adhesion molecules and cytokines such as IL-1β and TNF-α in endothelial cells, resulting in an inflammatory response [55].
During an inflammatory process, adenosine can activate A2AR to attenuate inflammation and tissue injury. Adenosine reduces the M1 macrophage phenotype and activation of A2AR shifts macrophages towards the M2 phenotype [16,56], and promotes wound healing in mice [57,58]. Thus, extracellular adenosine appears to facilitate a macrophage switch characteristic for an alternatively activated phenotype [59]. We have shown that A2ARmRNA expression correlates with the M2 macrophage marker CD163 and that both proteins are augmented in DD samples compared with LD. Our results are in accordance with the hypothesis that the onset of anti-inflammatory activity induces the M2 phenotype and is driven by A2AR signaling.
Stimulation of IL-10 production in RAW264.7 macrophages by adenosine was regulated by the transcription factor C/EBPβ [60]. In our study, A2AR expression in DD correlated with C/EBPβ and IL-10. During macrophage activation, C/EBPβ is induced by the CREB transcriptional activator, and Ruffell and co-workers found that deletion of CREB-binding sites from Cebpb promoter avoided macrophage activation and blocked specific M2 genes [61]. Our results suggest the activation of CREB, since phospho-CREB is up-regulated in DD renal biopsies, although statistical significance was not reached. Other models support involvement of C/EBPB in M2 macrophage differentiation and fibrosis after damage [62,63,64].
In summary, DD kidney grafts display more inflammation than LD and produce higher levels of TNF-α. Our results suggest that CD163 and TGF-β1 are regulated, at least in part, by TNF-α via A2AR to initiate anti-inflammatory processes and promote M2 macrophage phenotype. Our work also indicates that, in kidney biopsies from DD, the cAMP/PKA/CREB/C/EBPβ pathway could be activated, which would also favor the switch from macrophages M1 to M2. A proposed integrated mechanistic model explaining the dual inflammatory and anti-inflammatory conditions of DD kidneys is shown in Figure 8.
Although further research is needed, our results unequivocally show differences in purinergic signaling in grafts from DD and from LD which highlights the possibility of targeting purinome elements for therapeutic management of early and persistent inflammation associated with renal graft dysfunction. Adenosine signaling is considered protective in ischemic lesions with immunomodulatory properties. Our observations, although focused on kidney transplantation, show crucial changes in the immunomodulation of transplanted organs, highlighting a key role for the purinome in kidney graft inflammation and the onset of fibrosis. Our results confirm the growing evidence that purinergic signaling is involved in the inflammatory response that can be associated with rejection and chronic allograft dysfunction. Our contribution also raises the possibility of purinergic biology playing a more general role in the clinics derived from organ transplantation in humans.

4. Materials and Methods

4.1. Donors, Patients, and Kidney Samples

This study was approved by the ethics committee of Fundació Puigvert. Participants were from the study population for a previous work [14] in which patients characteristics are described [14]. In brief, 94 renal donors (60DD/34LD) were included. We obtained renal biopsies for gene expression analysis from 47 DD and 21 LD. Two living donors’ samples were missing. We collected pre-implantation biopsies from kidney donors and clinical information for donors and KTR who underwent transplantation in our institution between 2008 and 2011. All of them signed an informed consent form. Tissue samples from biopsy cores were processed for mRNA extraction and gene expression analysis by qPCR. Total protein was also obtained for Western blot.

4.2. Cell Culture and Treatments

Human monocytic leukemia THP-1 cells (ATCC) were cultured in RPMI (Lonza, Bassel, Switzerland) supplemented with 10% fetal bovine serum (Life Technologies, Carlsbad, CA, USA), 2 mM glutamine, and antibiotic (Lonza). Cells were grown in complete medium and then growth arrested in serum-free medium for 24 h. All experiments were performed under serum-free conditions. THP-1 cells were seeded at 37 °C in a humidified 5% CO2/95% air atmosphere in the presence of 5, 10, and 20 ng/mL of TNF-α (R&D Systems, Minneapolis, MN, USA) at different time points (3, 6, 18, and 24 h). When needed and at the times selected, cells were pretreated for 30 min with 1µM of the A2AR antagonist ZM241385 (Tocris, Bristol, UK) or for 60 min with the NF-κβ blocker BMS345541 (Sigma, Saint Louis, MO, USA) (1, 2.5, 4, and 5 μM) before the addition of TNF-α. Control samples always contained the same amount of vehicle (DMSO) to exclude any interference in cell responses. After the incubation period, cells were centrifuged and pellets were resuspended in TriReagent (Sigma).

4.3. Real Time PCR

4.3.1. Renal Tissue

Kidney biopsies were processed as described previously [14]. Briefly, samples were homogenized with Tissuelyser LT (Qiagen, Hilden, Germany). Aqueous phase containing RNA was transferred into an RNeasy column (AllPrep DNA/RNA/Protein Mini Kit, Qiagen) and was eluted with RNAse-free water. The integrity of total RNA was assessed on a denaturing agarose gel, allowing visual assessment of the 28S and 18S rRNA bands. Retrotranscription of total RNA to cDNA was done according to the user guide of the Applied Biosystems™ QuantStudio™ 12K Flex Real-Time PCR System, OpenArray® Experiments (Life Technologies, Carlsbad, CA, USA). Briefly, 10 µL of 2X reverse transcription mix of the High Capacity cDNA Reverse Transcription kit (Life Technologies) was mixed with 10 µL of total RNA in a 96-well reaction plate. Plates were incubated at room temperature for 10 min, then incubated at 37 °C for 2 h and placed on ice for 5 min, incubated at 75 °C for 10 min, placed on ice for 5 min, and spun down. Real-time PCR was done in accordance with the TaqMan®gene expression assays protocol (Life Technologies). A mix containing 2X TaqMan OpenArray Real Time PCR Master Mix (Cat No. 4.462.159 Life Technologies) and cDNA was loaded on each OpenArray plate. These plates were run on the computer QuantStudio 12 K Flex Real-Time PCR system. Relative quantification of gene expression was performed using the expression of three internal controls: human GAPDH, β-actin, and β-glucuronidase.

4.3.2. THP-1 Cells

Total RNA was isolated from THP-1 cells with TriReagent (Sigma, St. Louis, MO, USA) and 1 µg RNA was retrotranscribed to cDNA with the MultiScribe Reverse Transcriptase kit (Applied Biosystems, Carlsbad, CA, USA) according to the manufacturer’s instructions. Real-time amplification of cDNAs was carried out with the TaqMan Universal Master Mix (Applied Biosystems) in the StepOne Sequence Detection System (Applied Biosystems). Assays used for amplification of human CD163, A2AR, and TGF-β1 were predesigned inventoried TaqMan Gene Expression Assays (Applied Biosystems, Foster City, CA, USA). Relative quantification of gene expression was performed as described in the TaqMan instruction manual using human GAPDH as an internal control. The PCR arbitrary units of the genes analyzed were defined as the mRNA levels of these genes normalized to the GAPDH expression level in order to quantify these transcripts in relative terms.

4.4. Western Blot

Protein samples were obtained from kidney biopsies with AllPrep DNA/RNA/Protein Mini Kit (Qiagen, Venlo, The Netherlands). Total protein pellets were dissolved in 8M urea lysis buffer, centrifuged to eliminate cell debris, and supernatant was stored to −80 °C.
Thirty micrograms of total proteins were fractionated by SDS-PAGE and transferred to a polyvinylidene difluoride membrane using a Trans-blot turbo (Bio-Rad, Hercules, CA, USA). After incubation with 5% BSA in TBST (10 mM Tris, pH 8.0, 150 mM NaCl, 0.5% Tween 20), the membrane was washed with TBST and incubated with antibodies against phospho (p)-CREB (Cell Signaling, Danvers, MA, USA; dilution 1/1000), CREB (Cell Signaling; 1/500), phospho (p)-PKA (Cell Signaling; 1/1000), PKA (Cell Signaling; 1/500), A2AR(St John’s Laboratory, London, UK; 1/500), CD163 (Pierce, Waltham, MA, USA; 1/1000), and GAPDH (Sta. Cruz Biotechnology, Santa Cruz, CA, USA; 1/2000), the last as loading control, at 4 °C O/N under agitation. Membranes were washed with TBST and incubated with a 1:20,000 dilution of horseradish peroxidase-conjugated anti-mouse or anti-rabbit antibody (Bio-Rad, Hercules, CA, USA) for 1 h. Membranes were washed again and blots were exposed to highly sensitive films and developed using an ECL® technique (Pierce).

4.5. Statistics

GraphPad Prism software (GraphPad Software, San Diego, CA, USA)was used to perform statistical analysis. Results are expressed as the mean ± standard deviation (lower and upper extremities) and percentages, as appropriate. Student’s t-test was applied to compare means. When our data did not follow a Gaussian distribution, nonparametric tests such as the Mann–Whitney U test and Spearman correlation were used for data analysis. All p values were two-sided, and p < 0.05 was considered significant. Spearman test significance was confirmed by p-value analysis using the Benjamini–Hochberg procedure with a criterion of <5% False Discovery Rate [65].

Author Contributions

M.M.D.-E. conceived and designed the study, supervised experiments, interpreted results and edited the paper, L.G. and N.S. performed the patient selection and participated in results interpretation; F.C. and J.L. participated in patient selection and acquisition of data. I.S. managed the sample database, collected the data, and performed some experiments; A.B., R.S.M. and M.P.-A. provided manuscript writing support and conceptual advice; J.A.B. revised and edited the paper; E.G.-G. participated in the study design, carried out experiments, analyzed the data, interpreted results and wrote the manuscript. All authors have read and agreed to the published version of the manuscript.

Funding

This study was funded by a grant (PI17/01566, Plan Estatal 2017–2020) from Instituto de Salud Carlos III (ISCIII) and FEDER.

Acknowledgments

We thank all the patients who agreed to participate in this study. We would like to thank Jordi Bover for his expert advice and assistance in manuscript review. Many thanks also to Beatriz Bardají-de-Quixano for her valuable advice and recommendations and to Rick Mills for his help in manuscript proofreading. Our nephrology research group belongs to a Consolidated Research Catalan Group (AGAUR 2009/SGR-1116) and to REDinREN (RD12/0021/0033). We are also grateful to Sandoz Farmaceutica S.A. for its support.

Conflicts of Interest

The authors declare no conflict of interest.

Abbreviations

DDDeceased donor
LDLiving donor
A2ARA2A adenosine receptor
KTRKidney transplant recipient
NTNucleoside transporter
SAHHS-adenosyl-L-homocysteine hydrolase
ACAdenylate cyclase
ADKAdenosine kinase
PKAProtein kinase A
SAHS-adenosylhomocysteine
ENTEquilibrative nucleoside transporter
CNTConcentrative nucleoside transporter
hENTHuman ENT
hCNTHuman CNT

References

  1. Opelz, G. Impact of HLA compatibility on survival of kidney transplants from unrelated live donors. Transplantation 1997, 64, 1473–1475. [Google Scholar] [CrossRef] [PubMed]
  2. Moreso, F.; Serón, D.; Gil-Vernet, S.; Riera, L.; Fulladosa, X.; Ramos, R.; Alsina, J.; Grinyó, J.M. Donor age and delayed graft function as predictors of renal allograft survival in rejection-free patients. Nephrol. Dial. Transpl. 1999, 14, 930–935. [Google Scholar] [CrossRef] [PubMed] [Green Version]
  3. Snoeijs, M.G.J.; van Bijnen, A.; Swennen, E.; Haenen, G.R.M.M.; Roberts, L.J.; Christiaans, M.H.L.; Peppelenbosch, A.G.; Buurman, W.A.; Ernest van Heurn, L.W. Tubular epithelial injury and inflammation after ischemia and reperfusion in human kidney transplantation. Ann. Surg. 2011, 253, 598–604. [Google Scholar] [CrossRef] [PubMed]
  4. Pessione, F.; Cohen, S.; Durand, D.; Hourmant, M.; Kessler, M.; Legendre, C.; Mourad, G.; Noël, C.; Peraldi, M.-N.; Pouteil-Noble, C.; et al. Multivariate analysis of donor risk factors for graft survival in kidney transplantation. Transplantation 2003, 75, 361–367. [Google Scholar] [CrossRef]
  5. van der Hoeven, J.A.; Ploeg, R.J.; Postema, F.; Molema, I.; de Vos, P.; Girbes, A.R.; van Suylichem, P.T.; van Schilfgaarde, R.; Ter Horst, G.J. Induction of organ dysfunction and up-regulation of inflammatory markers in the liver and kidneys of hypotensive brain dead rats: A model to study marginal organ donors. Transplantation 1999, 68, 1884–1890. [Google Scholar] [CrossRef]
  6. van der Hoeven, J.A.B.; Molema, G.; Ter Horst, G.J.; Freund, R.L.; Wiersema, J.; van Schilfgaarde, R.; Leuvenink, H.G.D.; Ploeg, R.J. Relationship between duration of brain death and hemodynamic (in)stability on progressive dysfunction and increased immunologic activation of donor kidneys. Kidney Int. 2003, 64, 1874–1882. [Google Scholar] [CrossRef] [Green Version]
  7. Nijboer, W.N.; Schuurs, T.A.; van der Hoeven, J.A.B.; Fekken, S.; Wiersema-Buist, J.; Leuvenink, H.G.D.; Hofker, S.; Homan van der Heide, J.J.; van Son, W.J.; Ploeg, R.J. Effect of brain death on gene expression and tissue activation in human donor kidneys. Transplantation 2004, 78, 978–986. [Google Scholar] [CrossRef] [Green Version]
  8. Nagareda, T.; Kinoshita, Y.; Tanaka, A.; Takeda, M.; Sakano, T.; Yawata, K.; Sugimoto, T.; Nishizawa, Y.; Terada, N. Clinicopathology of kidneys from brain-dead patients treated with vasopressin and epinephrine. Kidney Int. 1993, 43, 1363–1370. [Google Scholar] [CrossRef] [Green Version]
  9. Kreisel, D.; Krupnick, A.S.; Gelman, A.E.; Engels, F.H.; Popma, S.H.; Krasinskas, A.M.; Balsara, K.R.; Szeto, W.Y.; Turka, L.A.; Rosengard, B.R. Non-hematopoietic allograft cells directly activate CD8+ T cells and trigger acute rejection: An alternative mechanism of allorecognition. Nat. Med. 2002, 8, 233–239. [Google Scholar] [CrossRef]
  10. Pratschke, J.; Wilhelm, M.J.; Laskowski, I.; Kusaka, M.; Beato, F.; Tullius, S.G.; Neuhaus, P.; Hancock, W.W.; Tilney, N.L. Influence of donor brain death on chronic rejection of renal transplants in rats. J. Am. Soc. Nephrol. 2001, 12, 2474–2481. [Google Scholar]
  11. Guillén-Gómez, E.; Guirado, L.; Belmonte, X.; Maderuelo, A.; Santín, S.; Juarez, C.; Ars, E.; Facundo, C.; Ballarín, J.A.; Vidal, S.; et al. Monocyte implication in renal allograft dysfunction. Clin. Exp. Immunol. 2014, 175, 323–331. [Google Scholar] [CrossRef] [PubMed]
  12. Magil, A.B. Monocytes/macrophages in renal allograft rejection. Transpl. Rev. (Orlando) 2009, 23, 199–208. [Google Scholar] [CrossRef] [PubMed]
  13. Serón, D.; O’Valle, F.; Moreso, F.; Gomà, M.; Hueso, M.; Grinyó, J.M.; Garcia del Moral, R. Immunophenotype of infiltrating cells in protocol renal allograft biopsies from tacrolimus-versus cyclosporine-treated patients. Transplantation 2007, 83, 649–652. [Google Scholar] [CrossRef] [PubMed]
  14. Guillén-Gómez, E.; Dasilva, I.; Silva, I.; Arce, Y.; Facundo, C.; Ars, E.; Breda, A.; Ortiz, A.; Guirado, L.; Ballarín, J.A.; et al. Early Macrophage Infiltration and Sustained Inflammation in Kidneys From Deceased Donors Are Associated With Long-Term Renal Function. Am. J. Transpl. 2017, 17, 733–743. [Google Scholar] [CrossRef]
  15. Csoka, B.; Selmeczy, Z.; Koscso, B.; Nemeth, Z.H.; Pacher, P.; Murray, P.J.; Kepka-Lenhart, D.; Morris, S.M.; Gause, W.C.; Leibovich, S.J.; et al. Adenosine promotes alternative macrophage activation via A2A and A2B receptors. FASEB J. 2012, 26, 376–386. [Google Scholar] [CrossRef] [Green Version]
  16. Pinhal-Enfield, G.; Ramanathan, M.; Hasko, G.; Vogel, S.N.; Salzman, A.L.; Boons, G.-J.; Leibovich, S.J. An Angiogenic Switch in Macrophages Involving Synergy between Toll-Like Receptors 2, 4, 7, and 9 and Adenosine A2A Receptors. Am. J. Pathol. 2003, 163, 711–721. [Google Scholar] [CrossRef] [Green Version]
  17. Kurashima, Y.; Amiya, T.; Nochi, T.; Fujisawa, K.; Haraguchi, T.; Iba, H.; Tsutsui, H.; Sato, S.; Nakajima, S.; Iijima, H.; et al. Extracellular ATP mediates mast cell-dependent intestinal inflammation through P2 × 7 purinoceptors. Nat. Commun. 2012, 3, 1034. [Google Scholar] [CrossRef]
  18. Crespo Yanguas, S.; Willebrords, J.; Johnstone, S.R.; Maes, M.; Decrock, E.; De Bock, M.; Leybaert, L.; Cogliati, B.; Vinken, M. Pannexin1 as mediator of inflammation and cell death. Biochim. Biophys. Acta Mol. Cell Res. 2017, 1864, 51–61. [Google Scholar] [CrossRef]
  19. Hanner, F.; Lam, L.; Nguyen, M.T.X.; Yu, A.; Peti-Peterdi, J. Intrarenal localization of the plasma membrane ATP channel pannexin1. Am. J. Physiol. Ren. Physiol. 2012, 303. [Google Scholar] [CrossRef] [Green Version]
  20. Jankowski, J.; Perry, H.M.; Medina, C.B.; Huang, L.; Yao, J.; Bajwa, A.; Lorenz, U.M.; Rosin, D.L.; Ravichandran, K.S.; Isakson, B.E.; et al. Epithelial and Endothelial Pannexin1 Channels Mediate AKI. J. Am. Soc. Nephrol. 2018, 29, 1887–1899. [Google Scholar] [CrossRef] [Green Version]
  21. Cekic, C.; Linden, J. Purinergic regulation of the immune system. Nat. Rev. Immunol. 2016, 16, 177–192. [Google Scholar] [CrossRef] [PubMed]
  22. Pastor-Anglada, M.; Pérez-Torras, S. Who is who in Adenosine transport. Front. Pharmacol. 2018, 9, 627. [Google Scholar] [CrossRef] [PubMed] [Green Version]
  23. Garcia, G.E.; Truong, L.D.; Li, P.; Zhang, P.; Du, J.; Chen, J.-F.; Feng, L. Adenosine A2A receptor activation and macrophage-mediated experimental glomerulonephritis. FASEB J. 2008, 22, 445–454. [Google Scholar] [CrossRef] [PubMed] [Green Version]
  24. Khoa, N.D.; Montesinos, M.C.; Reiss, A.B.; Delano, D.; Awadallah, N.; Cronstein, B.N. Inflammatory cytokines regulate function and expression of adenosine A(2A) receptors in human monocytic THP-1 cells. J. Immunol. 2001, 167, 4026–4032. [Google Scholar] [CrossRef] [Green Version]
  25. Koo, D.D.H.; Welsh, K.I.; McLaren, A.J.; Roake, J.A.; Morris, P.J.; Fuggle, S.V. Cadaver versus living donor kidneys: Impact of donor factors on antigen induction before transplantation. Kidney Int. 1999, 56, 1551–1559. [Google Scholar] [CrossRef] [Green Version]
  26. Bours, M.J.L.; Swennen, E.L.R.; Di Virgilio, F.; Cronstein, B.N.; Dagnelie, P.C. Adenosine 5???-triphosphate and adenosine as endogenous signaling molecules in immunity and inflammation. Pharm. Ther. 2006, 112, 358–404. [Google Scholar] [CrossRef]
  27. Lawrence, T.; Willoughby, D.A.; Gilroy, D.W. Anti-inflammatory lipid mediators and insights into the resolution of inflammation. Nat. Rev. Immunol. 2002, 2, 787–795. [Google Scholar] [CrossRef]
  28. Haskó, G.; Pacher, P.; Deitch, E.A.; Vizi, E.S. Shaping of monocyte and macrophage function by adenosine receptors. Pharm. Ther. 2007, 113, 264–275. [Google Scholar] [CrossRef] [Green Version]
  29. Haskó, G.; Kuhel, D.G.; Chen, J.F.; Schwarzschild, M.A.; Deitch, E.A.; Mabley, J.G.; Marton, A.; Szabó, C. Adenosine inhibits IL-12 and TNF-[alpha] production via adenosine A2a receptor-dependent and independent mechanisms. FASEB J. 2000, 14, 2065–2074. [Google Scholar] [CrossRef] [Green Version]
  30. Buenestado, A.; Grassin Delyle, S.; Arnould, I.; Besnard, F.; Naline, E.; Blouquit-Laye, S.; Chapelier, A.; Bellamy, J.F.; Devillier, P. The role of adenosine receptors in regulating production of tumour necrosis factor-alpha and chemokines by human lung macrophages. Br. J. Pharm. 2010, 159, 1304–1311. [Google Scholar] [CrossRef] [Green Version]
  31. Lee, S.B.; Kalluri, R. Mechanistic connection between inflammation and fibrosis. Kidney Int. Suppl. 2010, 78, S22–S26. [Google Scholar] [CrossRef] [PubMed] [Green Version]
  32. Morello, S.; Ito, K.; Yamamura, S.; Lee, K.-Y.; Jazrawi, E.; DeSouza, P.; Barnes, P.; Cicala, C.; Adcock, I.M. IL-1 and TNF- Regulation of the Adenosine Receptor (A2A) Expression: Differential Requirement for NF- B Binding to the Proximal Promoter. J. Immunol. 2006, 177, 7173–7183. [Google Scholar] [CrossRef] [PubMed] [Green Version]
  33. Capecchi, P.L.; Camurri, A.; Pompella, G.; Mazzola, A.; Maccherini, M.; Diciolla, F.; Lazzerini, P.E.; Abbracchio, M.P.; Laghi-Pasini, F. Upregulation of A2A adenosine receptor expression by TNF-alpha in PBMC of patients with CHF: A regulatory mechanism of inflammation. J. Card. Fail. 2005, 11, 67–73. [Google Scholar] [CrossRef] [PubMed]
  34. St Hilaire, C.; Carroll, S.H.; Chen, H.; Ravid, K. Mechanisms of induction of adenosine receptor genes and its functional significance. J. Cell. Physiol. 2009, 218, 35–44. [Google Scholar] [CrossRef] [Green Version]
  35. Khoa, N.D.; Postow, M.; Danielsson, J.; Cronstein, B.N. Tumor necrosis factor-alpha prevents desensitization of Galphas-coupled receptors by regulating GRK2 association with the plasma membrane. Mol. Pharm. 2006, 69, 1311–1319. [Google Scholar] [CrossRef] [PubMed]
  36. Bani-Hani, A.H.; Campbell, M.T.; Meldrum, D.R.; Meldrum, K.K. Cytokines in epithelial-mesenchymal transition: A new insight into obstructive nephropathy. J. Urol. 2008, 180, 461–468. [Google Scholar] [CrossRef]
  37. Bates, R.C.; Mercurio, A.M. Tumor necrosis factor-alpha stimulates the epithelial-to-mesenchymal transition of human colonic organoids. Mol. Biol. Cell 2003, 14, 1790–1800. [Google Scholar] [CrossRef] [Green Version]
  38. Meldrum, K.K.; Misseri, R.; Metcalfe, P.; Dinarello, C.A.; Hile, K.L.; Meldrum, D.R. TNF-alpha neutralization ameliorates obstruction-induced renal fibrosis and dysfunction. Am. J. Physiol. Regul. Integr. Comp. Physiol. 2007, 292, R1456–R1464. [Google Scholar] [CrossRef]
  39. Therrien, F.J.F.J.; Agharazii, M.; Lebel, M.; Larivière, R.; Larivire, R. Neutralization of tumor necrosis factor-alpha reduces renal fibrosis and hypertension in rats with renal failure. Am. J. Nephrol. 2012, 36, 151–161. [Google Scholar] [CrossRef]
  40. Haskó, G.; Pacher, P. Regulation of macrophage function by adenosine. Arter. Thromb. Vasc. Biol. 2012, 32, 865–869. [Google Scholar] [CrossRef] [Green Version]
  41. Garcia, G.E.; Truong, L.D.; Chen, J.-F.; Johnson, R.J.; Feng, L. Adenosine A(2A) receptor activation prevents progressive kidney fibrosis in a model of immune-associated chronic inflammation. Kidney Int. 2011, 80, 378–388. [Google Scholar] [CrossRef] [PubMed] [Green Version]
  42. Fernández-Veledo, S.; Huber-Ruano, I.; Aymerich, I.; Duflot, S.; Casado, F.J.; Pastor-Anglada, M. Bile acids alter the subcellular localization of CNT2 (concentrative nucleoside cotransporter) and increase CNT2-related transport activity in liver parenchymal cells. Biochem. J. 2006, 395, 337–344. [Google Scholar] [CrossRef] [PubMed]
  43. Pérez-Torras, S.; Iglesias, I.; Llopis, M.; Lozano, J.J.; Antolín, M.; Guarner, F.; Pastor-Anglada, M. Transportome Profiling Identifies Profound Alterations in Crohn’s Disease Partially Restored by Commensal Bacteria. J. Crohn’s Colitis 2016, 10, 850–859. [Google Scholar] [CrossRef] [PubMed] [Green Version]
  44. Medina-Pulido, L.; Molina-Arcas, M.; Justicia, C.; Soriano, E.; Burgaya, F.; Planas, A.M.; Pastor-Anglada, M. Hypoxia and P1 receptor activation regulate the high-affinity concentrative adenosine transporter CNT2 in differentiated neuronal PC12 cells. Biochem. J. 2013, 454, 437–445. [Google Scholar] [CrossRef]
  45. Ohta, A.; Sitkovsky, M. Role of G-protein-coupled adenosine receptors in downregulation of inflammation and protection from tissue damage. Nature 2001, 414, 916–920. [Google Scholar] [CrossRef] [PubMed] [Green Version]
  46. Sitkovsky, M.V.; Lukashev, D.; Apasov, S.; Kojima, H.; Koshiba, M.; Caldwell, C.; Ohta, A.; Thiel, M. Physiological control of immune response and inflammatory tissue damage by hypoxia-inducible factors and adenosine A2A receptors. Annu. Rev. Immunol. 2004, 22, 657–682. [Google Scholar] [CrossRef]
  47. Thiel, M.; Chouker, A.; Ohta, A.; Jackson, E.; Caldwell, C.; Smith, P.; Lukashev, D.; Bittmann, I.; Sitkovsky, M. V Oxygenation inhibits the physiological tissue-protecting mechanism and thereby exacerbates acute inflammatory lung injury. PLoS Biol. 2005, 3, e174. [Google Scholar] [CrossRef] [Green Version]
  48. Beavis, P.A.; Stagg, J.; Darcy, P.K.; Smyth, M.J. CD73: A potent suppressor of antitumor immune responses. Trends Immunol. 2012, 33, 231–237. [Google Scholar] [CrossRef]
  49. Regateiro, F.S.; Howie, D.; Nolan, K.F.; Agorogiannis, E.I.; Greaves, D.R.; Cobbold, S.P.; Waldmann, H. Generation of anti-inflammatory adenosine by leukocytes is regulated by TGF-β. Eur. J. Immunol. 2011, 41, 2955–2965. [Google Scholar] [CrossRef]
  50. Zanin, R.F.; Braganhol, E.; Bergamin, L.S.L.S.; Campesato, L.F.I.L.F.I.; Filho, A.Z.; Moreira, J.C.F.J.C.F.; Morrone, F.B.; Sévigny, J.; Schetinger, M.R.C.; de Souza Wyse, A.T.; et al. Differential macrophage activation alters the expression profile of NTPDase and Ecto-5’-nucleotidase. PLoS ONE 2012, 7, e31205. [Google Scholar] [CrossRef] [Green Version]
  51. Kalsi, K.; Lawson, C.; Dominguez, M.; Taylor, P.; Yacoub, M.H.; Smolenski, R.T. Regulation of ecto-5′-nucleotidase by TNF-alpha in human endothelial cells. Mol. Cell. Biochem. 2002, 232, 113–119. [Google Scholar] [CrossRef] [PubMed]
  52. Blume, C.; Felix, A.; Shushakova, N.; Gueler, F.; Falk, C.S.; Haller, H.; Schrader, J. Autoimmunity in CD73/Ecto-5′-nucleotidase deficient mice induces renal injury. PLoS ONE 2012, 7, e37100. [Google Scholar] [CrossRef] [PubMed] [Green Version]
  53. Qiu, F.; Dahl, G. A permeant regulating its permeation pore: Inhibition of pannexin 1 channels by ATP. Am. J. Physiol. Cell Physiol. 2009, 296, C250. [Google Scholar] [CrossRef] [PubMed]
  54. Whyte-Fagundes, P.; Zoidl, G. Mechanisms of pannexin1 channel gating and regulation. Biochim. Biophys. Acta Biomembr. 2018, 1860, 65–71. [Google Scholar] [CrossRef]
  55. Barroso, M.; Kao, D.; Blom, H.J.; Tavares de Almeida, I.; Castro, R.; Loscalzo, J.; Handy, D.E. S-adenosylhomocysteine induces inflammation through NFkB: A possible role for EZH2 in endothelial cell activation. Biochim. Biophys. Acta Mol. Basis Dis. 2016, 1862, 82–92. [Google Scholar] [CrossRef] [Green Version]
  56. Ferrante, C.J.; Pinhal-Enfield, G.; Elson, G.; Cronstein, B.N.; Hasko, G.; Outram, S.; Leibovich, S.J. The Adenosine-Dependent Angiogenic Switch of Macrophages to an M2-Like Phenotype is Independent of Interleukin-4 Receptor Alpha (IL-4Rα) Signaling. Inflammation 2013, 36, 921–931. [Google Scholar] [CrossRef]
  57. Montesinos, M.C.; Gadangi, P.; Longaker, M.; Sung, J.; Levine, J.; Nilsen, D.; Reibman, J.; Li, M.; Jiang, C.K.; Hirschhorn, R.; et al. Wound healing is accelerated by agonists of adenosine A2 (G alpha s-linked) receptors. J. Exp. Med. 1997, 186, 1615–1620. [Google Scholar] [CrossRef]
  58. Leibovich, S.J.; Chen, J.-F.; Pinhal-Enfield, G.; Belem, P.C.; Elson, G.; Rosania, A.; Ramanathan, M.; Montesinos, C.; Jacobson, M.; Schwarzschild, M.A.; et al. Synergistic up-regulation of vascular endothelial growth factor expression in murine macrophages by adenosine A(2A) receptor agonists and endotoxin. Am. J. Pathol. 2002, 160, 2231–2244. [Google Scholar] [CrossRef] [Green Version]
  59. Olah, M.E.; Caldwell, C.C. Adenosine receptors and mammalian toll-like receptors: Synergism in macrophages. Mol. Interv. 2003, 3, 370–374. [Google Scholar] [CrossRef]
  60. Csóka, B.; Németh, Z.H.; Virág, L.; Gergely, P.; Leibovich, S.J.; Pacher, P.; Sun, C.-X.X.; Blackburn, M.R.; Vizi, E.S.; Deitch, E.A.; et al. A2A adenosine receptors and C/EBP?? are crucially required for IL-10 production by macrophages exposed to Escherichia coli. Blood 2007, 110, 2685–2695. [Google Scholar] [CrossRef] [Green Version]
  61. Ruffell, D.; Mourkioti, F.; Gambardella, A.; Kirstetter, P.; Lopez, R.G.; Rosenthal, N.; Nerlov, C. A CREB-C/EBPbeta cascade induces M2 macrophage-specific gene expression and promotes muscle injury repair. Proc. Natl. Acad. Sci. USA 2009, 106, 17475–17480. [Google Scholar] [CrossRef] [PubMed] [Green Version]
  62. Natsuka, S.; Akira, S.; Nishio, Y.; Hashimoto, S.; Sugita, T.; Isshiki, H.; Kishimoto, T. Macrophage differentiation-specific expression of NF-IL6, a transcription factor for interleukin-6. Blood 1992, 79, 460–466. [Google Scholar] [CrossRef] [PubMed] [Green Version]
  63. Hu, B.; Ullenbruch, M.R.; Jin, H.; Gharaee-Kermani, M.; Phan, S.H. An essential role for CCAAT/enhancer binding protein beta in bleomycin-induced pulmonary fibrosis. J. Pathol. 2007, 211, 455–462. [Google Scholar] [CrossRef] [PubMed]
  64. Hu, B.; Wu, Z.; Jin, H.; Hashimoto, N.; Liu, T.; Phan, S.H. CCAAT/enhancer-binding protein beta isoforms and the regulation of alpha-smooth muscle actin gene expression by IL-1 beta. J. Immunol. 2004, 173, 4661–4668. [Google Scholar] [CrossRef] [PubMed] [Green Version]
  65. Benjamini, Y.; Hochberg, Y. Controlling the False Discovery Rate: A Practical and Powerful Approach to Multiple Testing. J. R. Stat. Soc. Ser. B 1995, 57, 289–300. [Google Scholar] [CrossRef]
Figure 1. Relative mRNA expression of nucleoside transporters (CNT1 (A), CNT2 (B), ENT1 (C), ENT2 (D), ENT3 (E), and ENT4 (F)), as determined by qPCR analysis, in renal samples from LD and DD. Data are expressed as box-and-whisker plots. p value is shown when comparisons are statistically significant (Mann–Whitney U-test, p < 0.05) between groups. LD, living donors; DD, deceased donors.
Ijms 21 08826 g001
Figure 2. Relative mRNA expression of adenosine receptors (A1R (A), A2AR (B), and A3R (C)), as determined by qPCR analysis, in renal samples from LD and DD. Data are expressed as box-and-whisker plots. p value is shown when comparisons are statistically significant (Mann–Whitney U-test, p < 0.05) between groups. LD, living donors; DD, deceased donors.
Ijms 21 08826 g002
Figure 3. Relative mRNA expression of purinergic enzymes (CD73 (A), CD39 (B), ADCY (C), ADK (D), SAHH (E), PANX1 (F)), as determined by qPCR analysis, in renal samples from LD and DD. Data are expressed as box-and-whisker plots. p value is shown when comparisons are statistically significant (Mann–Whitney U-test, p < 0.05) between groups. LD, living donors; DD, deceased donors.
Ijms 21 08826 g003
Figure 4. Western blot analysis of protein expression of A2AR (A), CD163 (B), phospho PKA (pPKA) (C) and phospho CREB (pCREB) (D) in renal samples from DD and LD. Total protein was isolated from kidney tissues, as described in Materials and Methods, and separated by SDS-PAGE. Protein expression semiquantitation performed by densitometric analysis of Western blots. (E) Representative Western blots for A2AR, CD163, pPKA and pCREB. Data are expressed as box-and-whisker plots. p value is shown when comparisons are statistically significant (unpaired Student’s t-test, p < 0.05) between groups. LD, living donors; DD, deceased donors.
Ijms 21 08826 g004
Figure 5. TNF-α enhances A2AR, CD163, and TGF-β1 levels in THP-1 cells. The time course of TNF-α induced A2AR (A), CD163 (B), and TGF-β1 (C) expression in THP-1 cells as quantitated by qPCR. *, ** and *** denote significant differences (p < 0.05, p < 0.01 and p < 0.001, respectively) as compared with the DMSO group using unpaired Student’s t-test. All values are expressed as means ± SD (n = 3).
Ijms 21 08826 g005
Figure 6. Effect of the A2AR receptor antagonist ZM241385 on CD163 (A) and TGF-β1 (B) gene expression induced by TNF-α in THP-1 cells. Cells were also treated with IL-10 and ZM241385 to evaluate its effect on CD163 (C) and TGF-β1 (D) gene expression. THP-1 cells were treated with ZM241385 (1 µM) 30 min before adding TNF-α (10 ng/mL) or IL-10 (10 ng/mL) for 18 h. Cells were collected, and total RNA was extracted and retrotranscribed to cDNA. Results are expressed as mean ± SD; p value is shown when comparisons are statistically significant (unpaired Student’s t-test, p < 0.05), n = 3 for each point.
Ijms 21 08826 g006
Figure 7. Effect of the NF-κB inhibitor BMS354451 on the A2AR (A), CD163 (B) and TGF-β1 (C) mRNA levels in THP-1 cells stimulated with TNF-α (10 ng/mL). BMS354451 (1, 2.5, 4 and 5 μM) was added to the cells 1 h before cytokine treatment and cultured for 20 h. Results are expressed as mean ± SD; p value is shown when comparisons are statistically significant (unpaired Student’s t-test, p < 0.05), n = 4–8 for each point.
Ijms 21 08826 g007
Figure 8. Schematic representation of the proposed mechanism of inflammation/anti-inflammation in DD kidneys. After an injury, such as hypoxia or ischemia, ATP is released and the production of the inflammatory cytokine TNF-α is induced. Via the NF-κB pathway, TNF-α stimulates A2AR expression although the formation and uptake of extracellular adenosine are restricted. Thus, the cAMP-PKA-CREB signaling pathway could be initiated and promote anti-inflammatory immune responses, e.g., through the induction of IL-10 and the switch to the M2 macrophage phenotype (CD163). If injury or inflammation persists, this can lead to the generation of TGF-β1, which may mediate the onset of fibrosis.
Ijms 21 08826 g008
Table 1. Gene expression correlations between A2AR and enzymes involved in adenosine metabolism and nucleoside transporters.
A2AR Correlations
DDLD
pRho
Spearman
pRho
Spearman
EnzymesCD390.0650.2720.3110.246
CD73<0.0010.6350.705−0.093
ADK<0.0010.6090.4330.191
SAHH<0.0010.5010.6970.096
ADCY<0.0010.5210.2710.266
Nucleoside
transporters
ENT1<0.0010.6030.1700.328
ENT20.0030.4260.5070.162
ENT3<0.0010.5630.6730.104
ENT40.0020.4410.4590.181
CNT10.0490.2880.7920.065
CNT20.0170.3470.665−0.106
LD, living donors; DD, deceased donors.
Table 2. RNA expression levels of different genes in DD vs. LD and gene expression Spearman rank correlations coefficients between A2AR and inflammatory, anti-inflammatory and fibrosis genes.
A2AR Correlations
RNA ExpressionDDLD
DD vs. LDSignificancepRho
Spearman
pRho
Spearman
Inflammatory &
M1 markers
TNF[14] *<0.0010.5040.0220.520
NFKBp = 0.033<0.0010.6260.9970.001
CD16[14] *<0.0010.5070.1310.359
CD86=[14] *<0.0010.4780.3030.250
IL-1β[14] *0.0030.4320.9830.005
Anti-inflammatory
& M2 markers
IL10=n.s.<0.0010.4920.2650.269
CD206=[14] *<0.0010.5770.1320.358
CD163[14] *<0.0010.5020.2090.302
IL13RA2=n.s.0.0020.4370.2040.305
CD209[14] *0.0560.2810.5570.144
CEBPBp < 0.001<0.0010.4820.4460.186
EMT &
Fibrosis markers
TGFB1[14] *<0.0010.7120.0610.437
FIBRONECTIN=[14] *<0.0010.6520.5450.148
ACTA2=[14] *<0.0010.5720.1230.366
VIMENTIN=[14] *0.0020.4470.7180.089
COL1A1p = 0.0060.0050.4070.1020.386
COL1A2=n.s.<0.0010.5110.1580.337
COL3A1=n.s.0.0150.3540.0510.454
Significance is shown as the value of “p” when lower than 0.05 or as n.s. (not significant) when higher according to the Mann–Whitney U test. [14] * corresponds to the reference of the previous study in which the gene was included and analyzed. LD, living donors; DD, deceased donors.
Publisher’s Note: MDPI stays neutral with regard to jurisdictional claims in published maps and institutional affiliations.

