Leucine-Rich Repeat Kinase 2 Controls Inflammatory Cytokines Production through NF-κB Phosphorylation and Antigen Presentation in Bone Marrow-Derived Dendritic Cells

 and
and 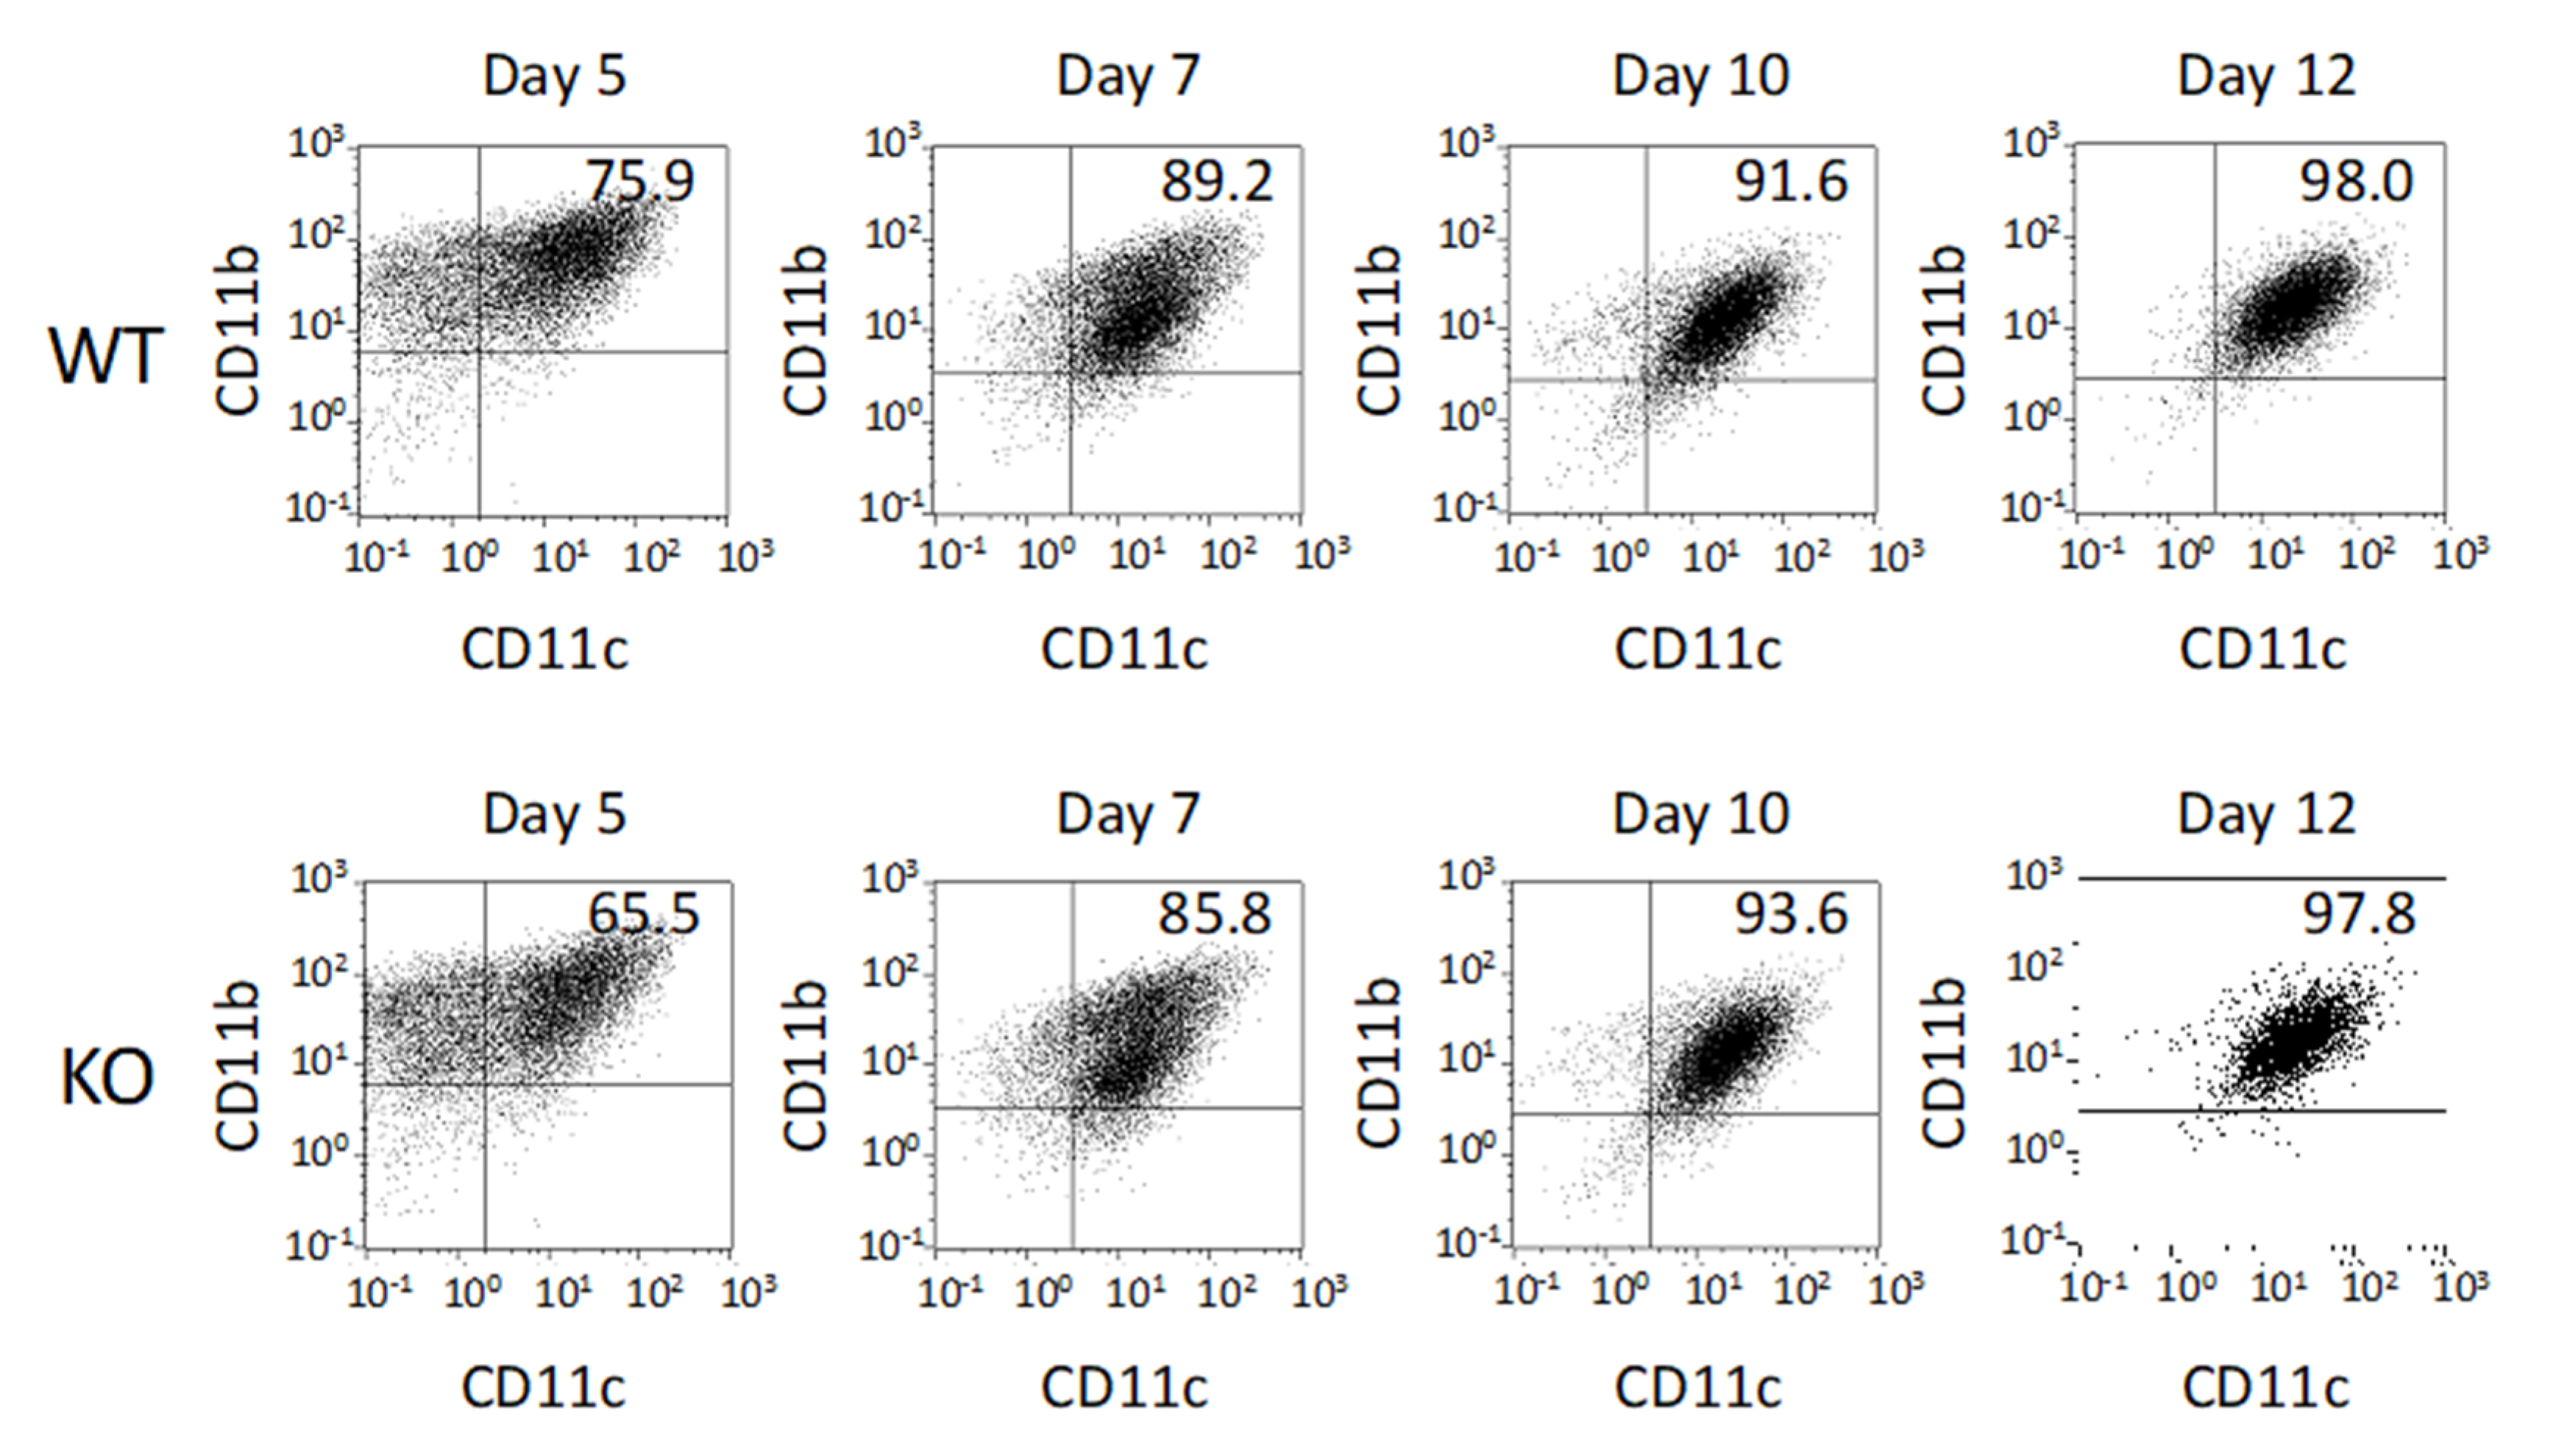
Abstract
:1. Introduction
2. Results
2.1. Differentiation of BMDCs
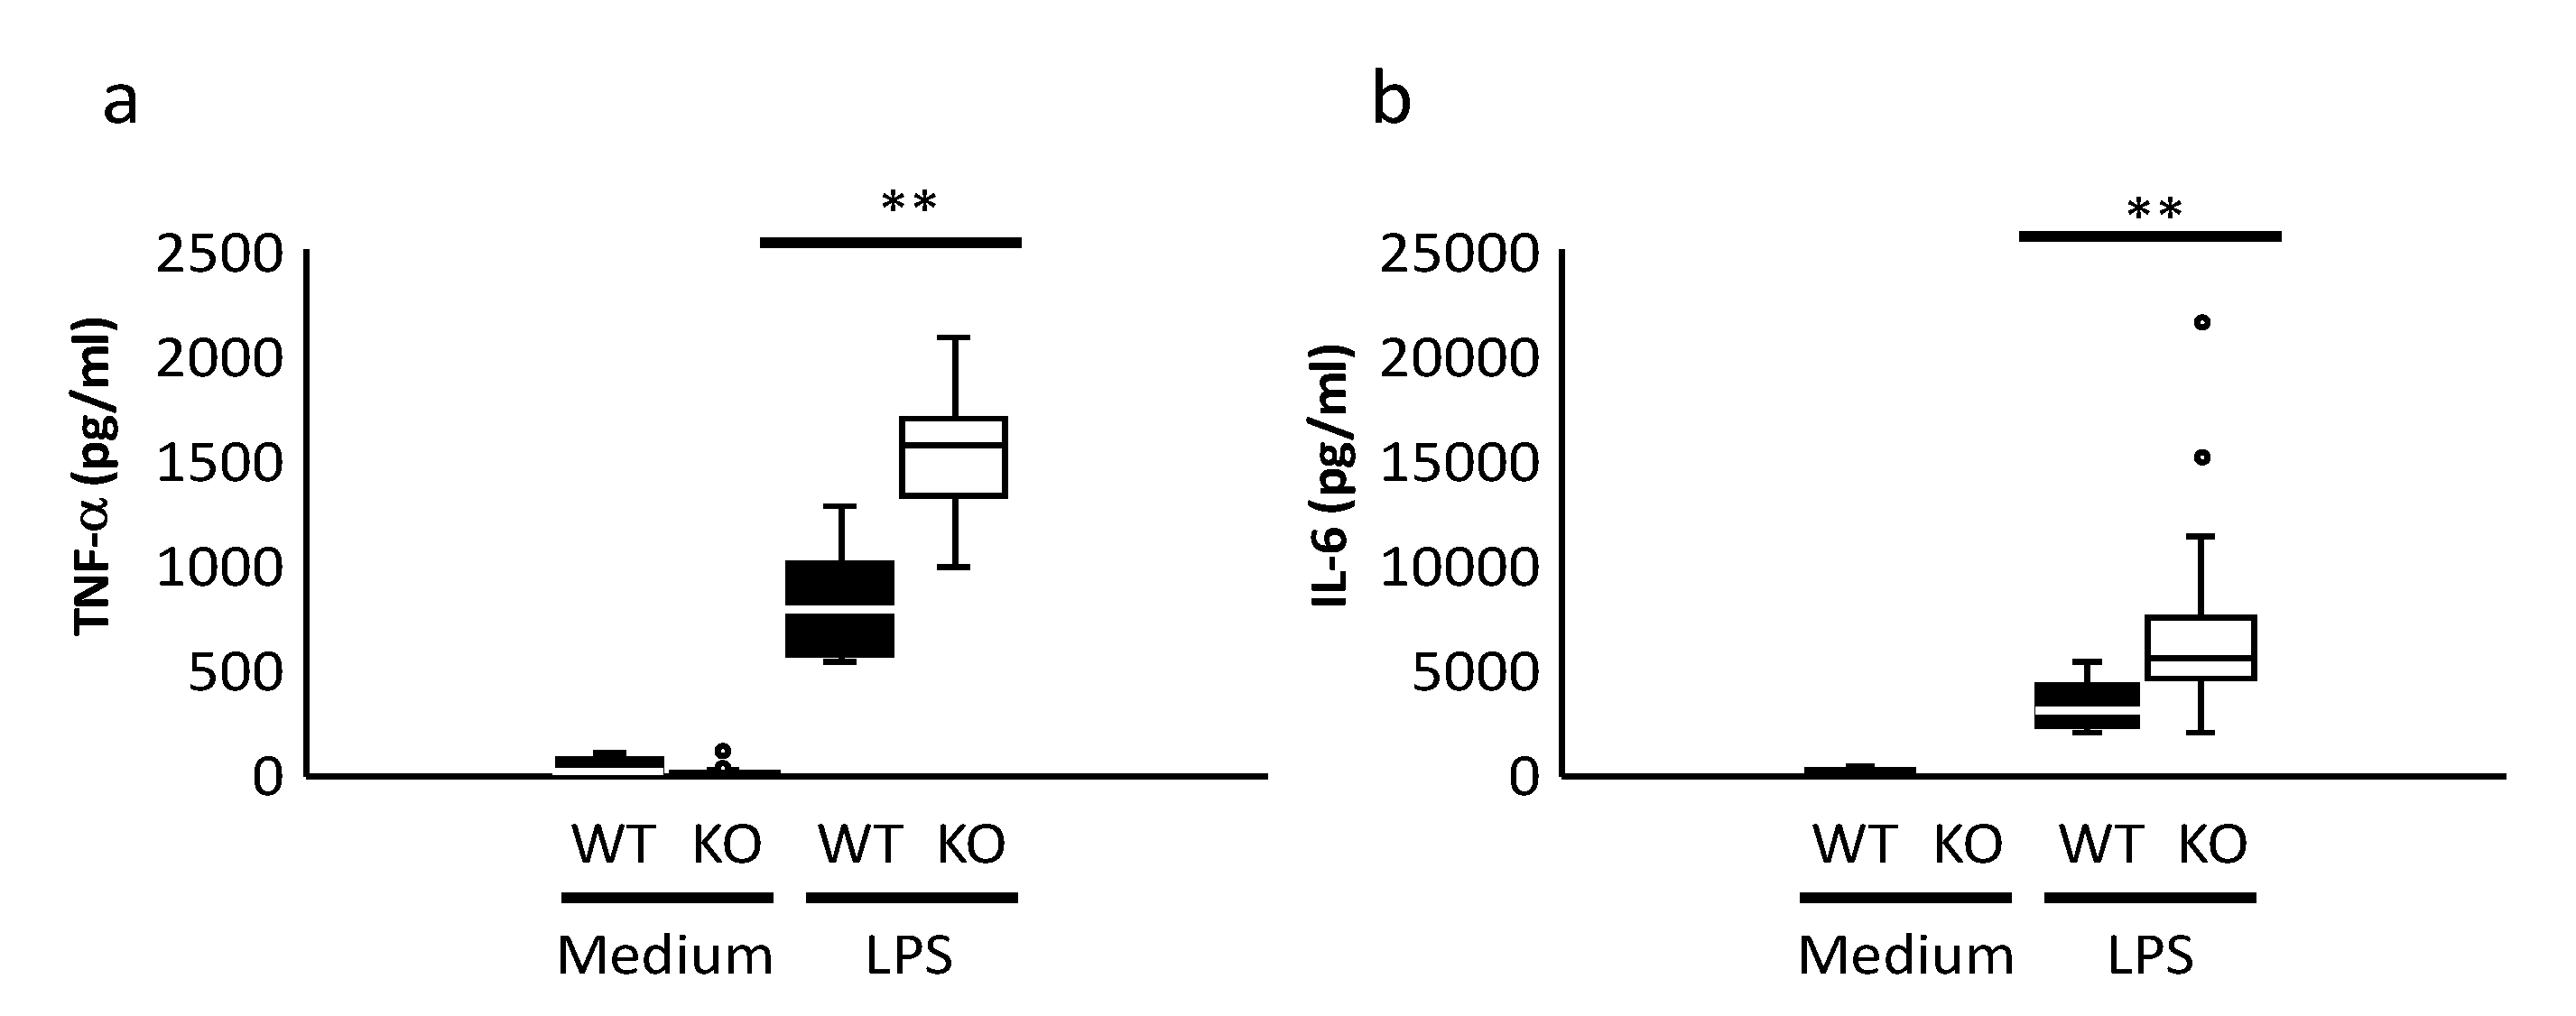
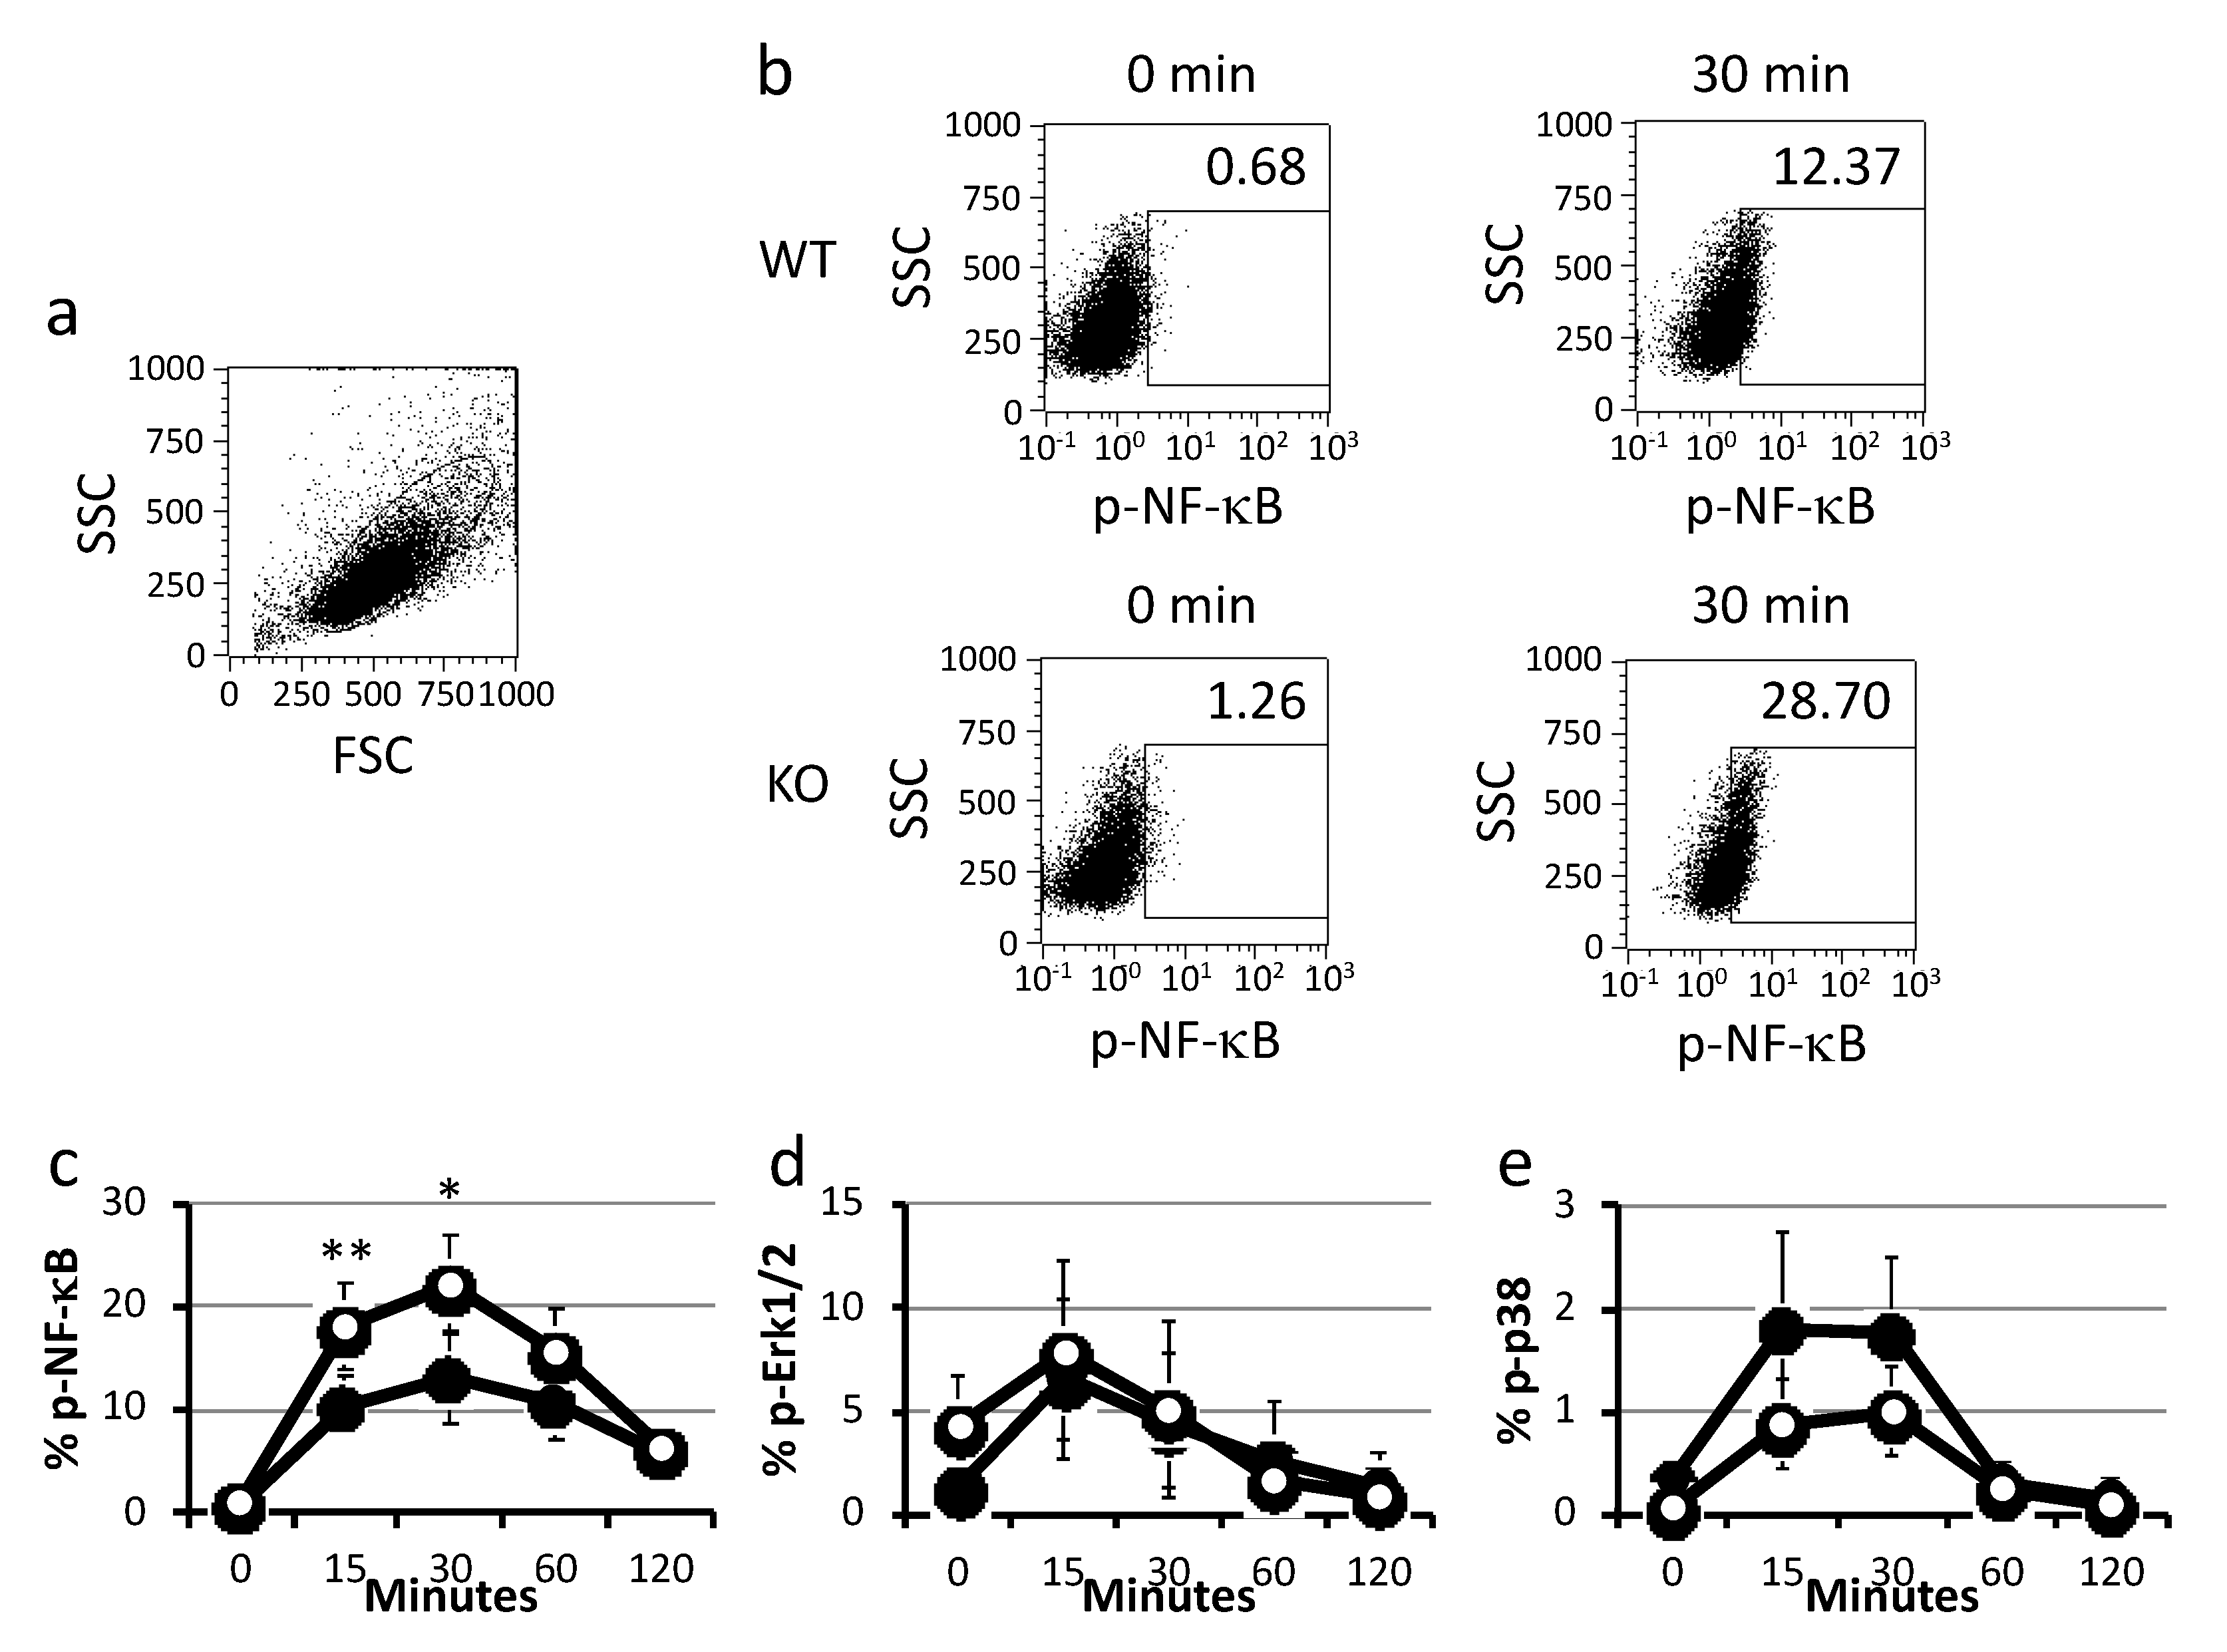
2.2. Cytokine Production and Signal Analysis of BMDCs
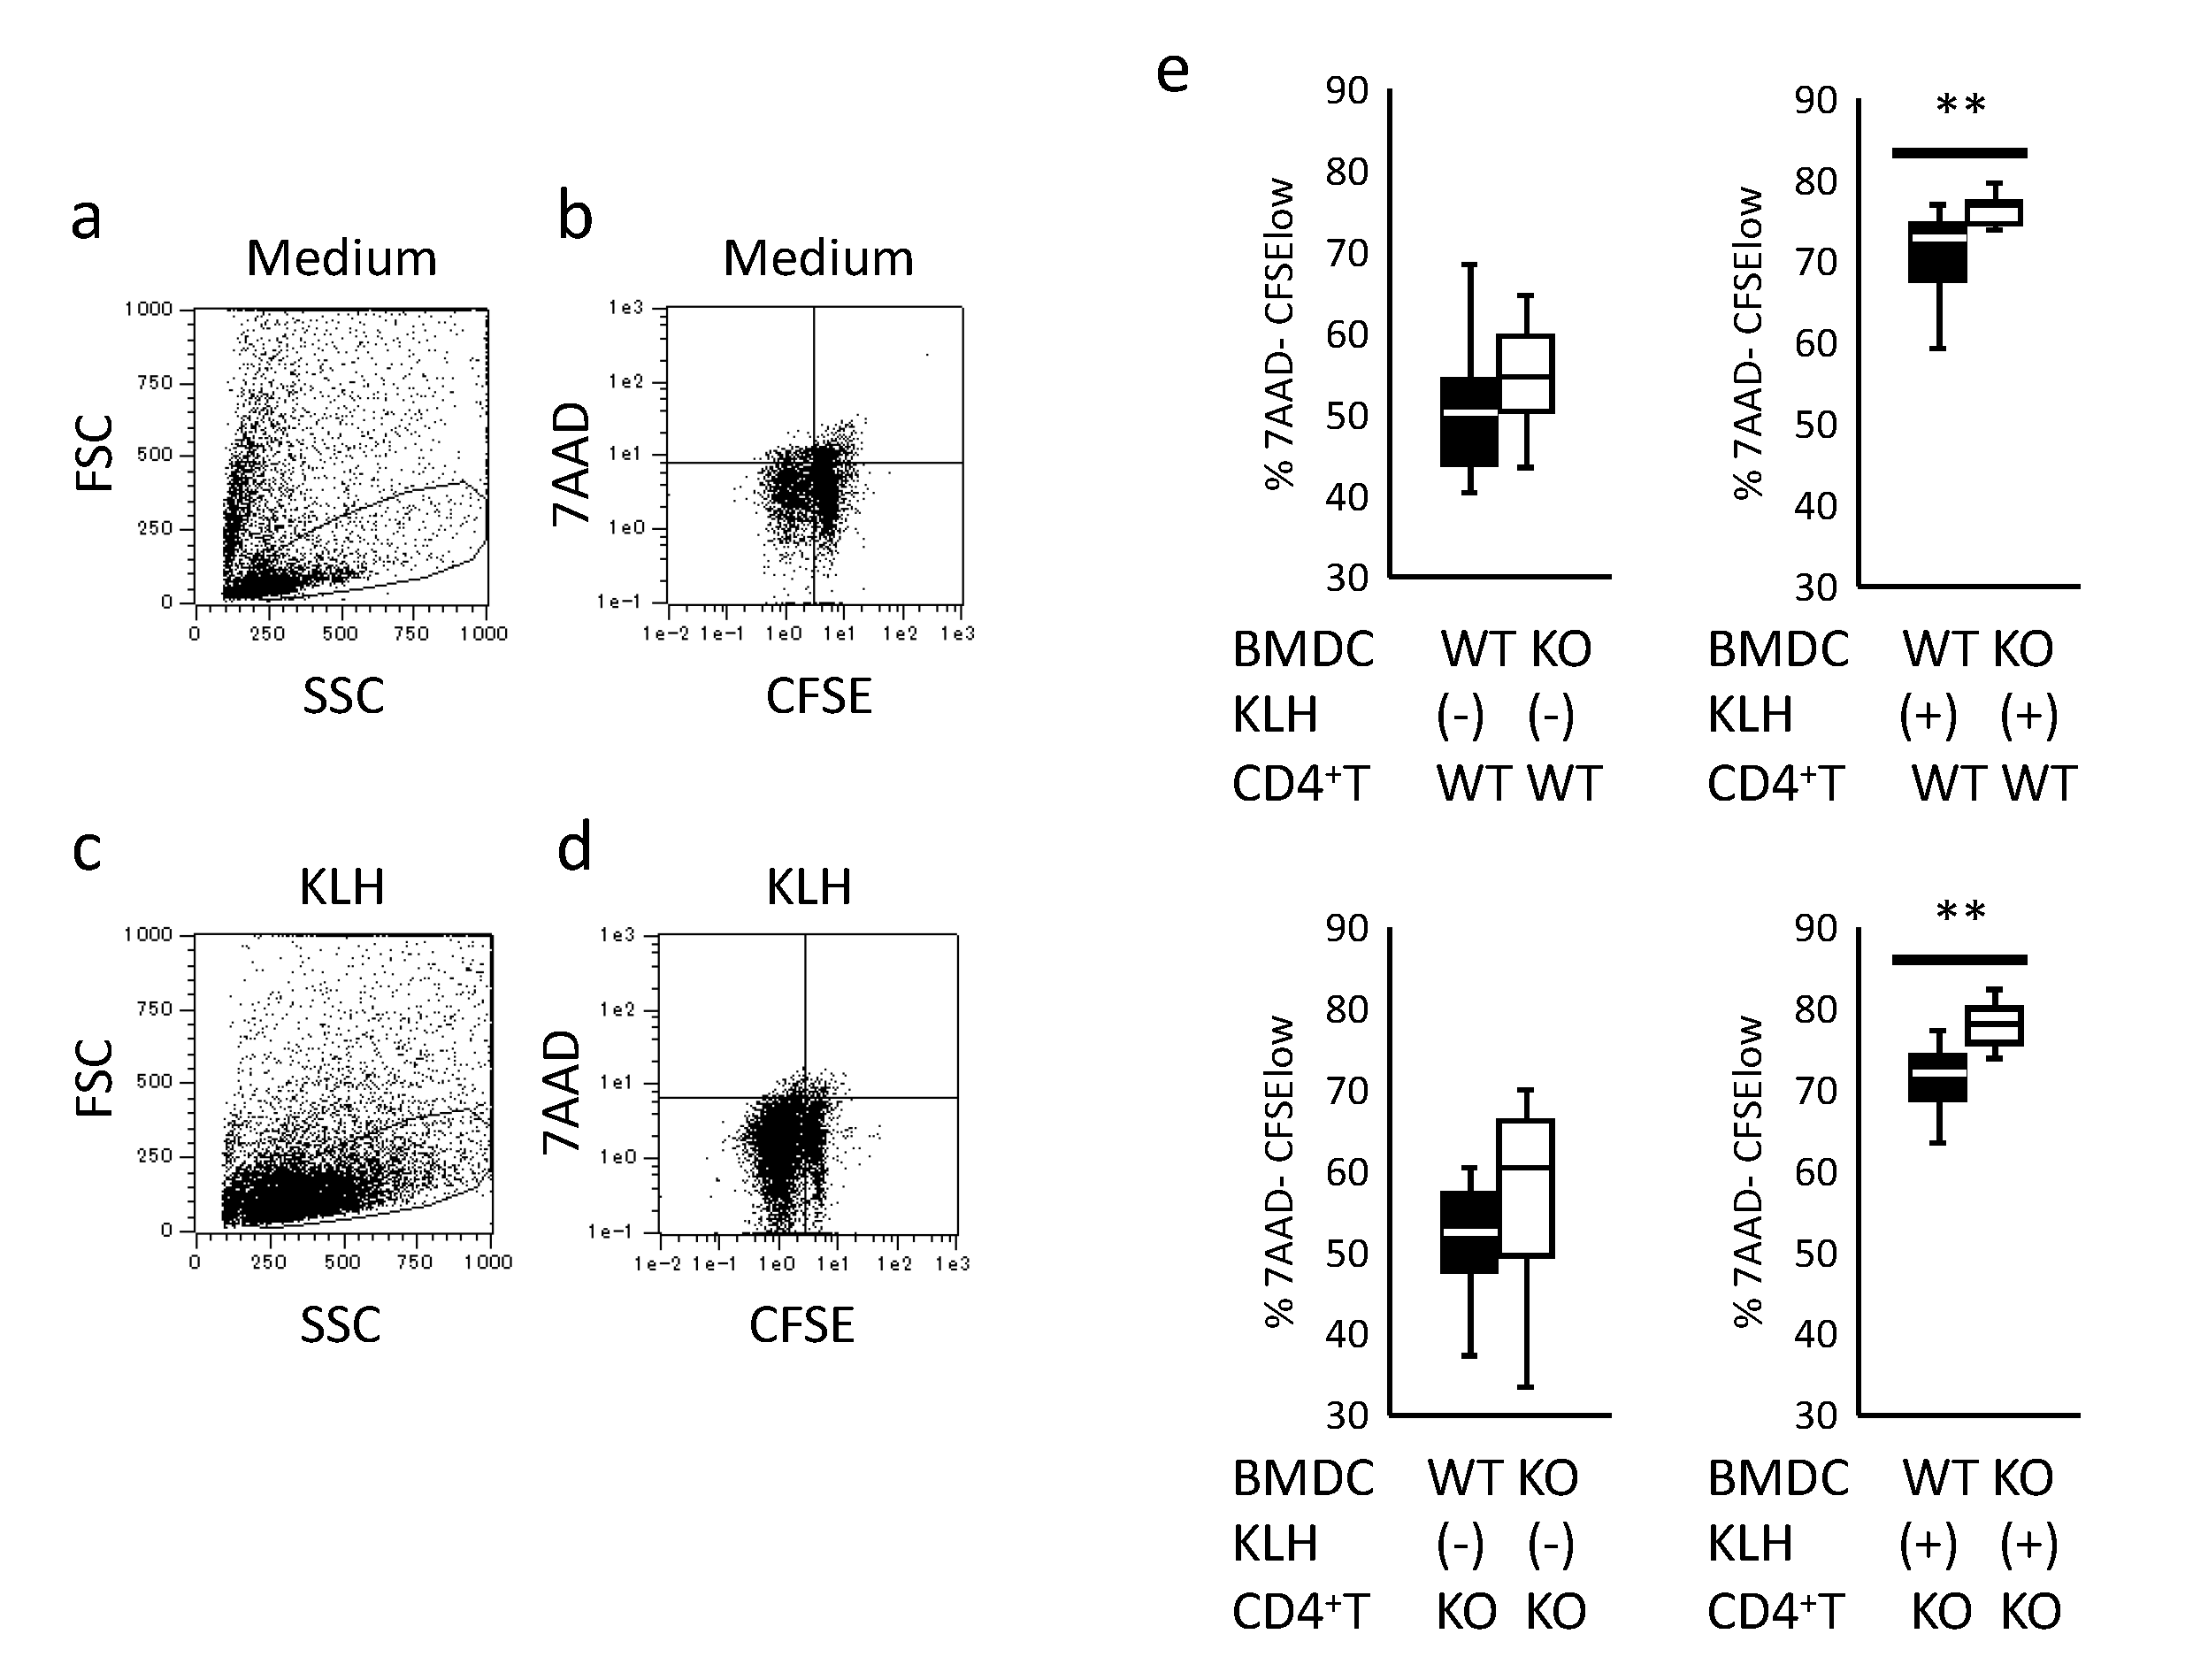
2.3. Assessment of BMDC Antigen-Presenting Ability
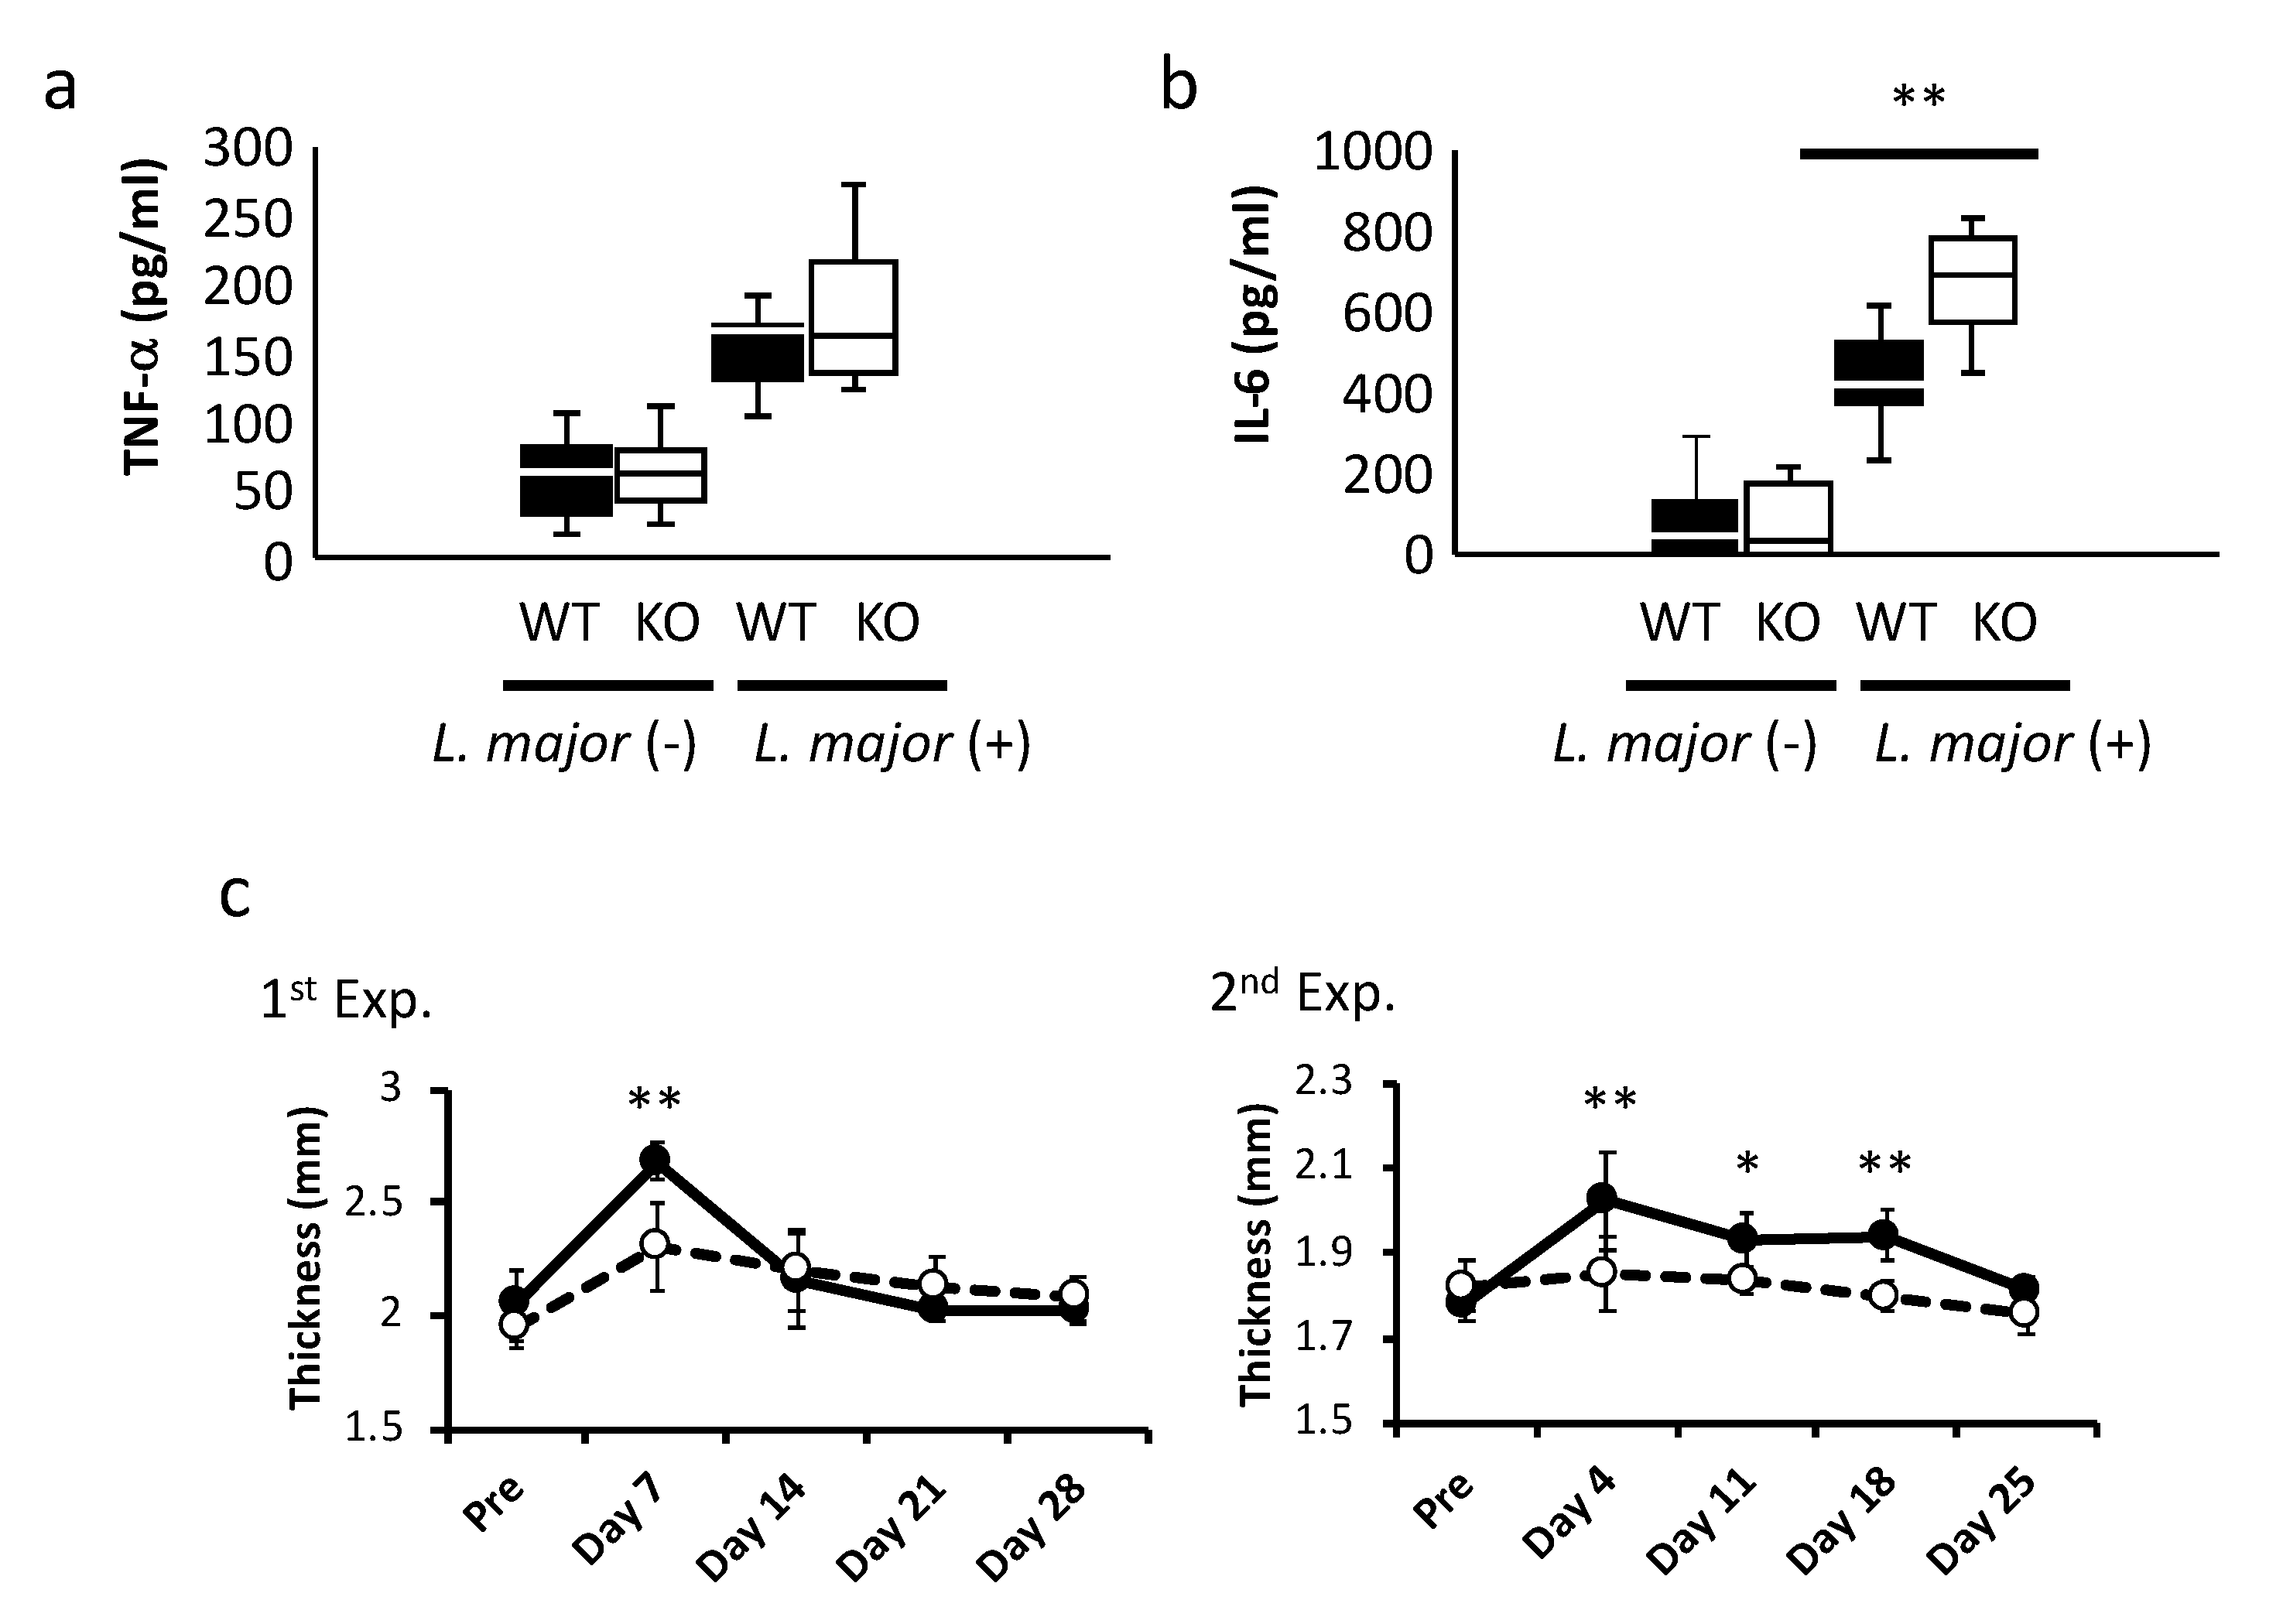
2.4. Influence of Infection on LRRK2–KO Mice
3. Discussion
4. Materials and Methods
4.1. Animals
4.2. Granulocyte/Macrophage-Colony Stimulating Factor (GM–CSF)
4.3. Differentiation of Bone Marrow Derived Dendritic Cells (BMDCs)
4.4. Immunofluorescence Staining of BMDCs
4.5. ELISA Assay
4.6. Detection of Intracellular Phosphorylated Transcription Factors
4.7. Analysis of Antigen Presentation Ability
4.8. Leishmania Infection In Vitro and In Vivo
4.9. Statistics
Supplementary Materials
Author Contributions
Funding
Acknowledgments
Conflicts of Interest
References
- Funayama, M.; Hasegawa, K.; Kowa, H.; Saito, M.; Tsuji, S.; Obata, F. A new locus for Parkinson’s disease (PARK8) maps to chromosome 12p11.2-q13.1. Ann. Neurol. 2002, 51, 296–301. [Google Scholar] [CrossRef] [PubMed]
- Funayama, M.; Hasegawa, K.; Ohta, E.; Kawashima, N.; Komiyama, M.; Kowa, H.; Tsuji, S.; Obata, F. An LRRK2 mutation as a cause for the parkinsonism in the original PARK8 family. Ann. Neurol. 2005, 57, 918–921. [Google Scholar] [CrossRef] [PubMed]
- Paisan-Ruiz, C.; Jain, S.; Evans, E.W.; Gilks, W.P.; Simon, J.; van der Brug, M.; Lopez de Munain, A.; Aparicio, S.; Gil, A.M.; Khan, N.; et al. Cloning of the gene containing mutations that cause PARK8-linked Parkinson’s disease. Neuron 2004, 44, 595–600. [Google Scholar] [CrossRef] [PubMed] [Green Version]
- Zimprich, A.; Biskup, S.; Leitner, P.; Lichtner, P.; Farrer, M.; Lincoln, S.; Kachergus, J.; Hulihan, M.; Uitti, R.J.; Calne, D.B.; et al. Mutations in LRRK2 cause autosomal-dominant parkinsonism with pleomorphic pathology. Neuron 2004, 44, 601–607. [Google Scholar] [CrossRef] [PubMed] [Green Version]
- Meylan, E.; Tschopp, J. The RIP kinases: Crucial integrators of cellular stress. Trends Biochem. Sci. 2005, 30, 151–159. [Google Scholar] [CrossRef] [PubMed]
- Franke, A.; McGovern, D.P.; Barrett, J.C.; Wang, K.; Radford-Smith, G.L.; Ahmad, T.; Lees, C.W.; Balschun, T.; Lee, J.; Roberts, R.; et al. Genome-wide meta-analysis increases to 71 the number of confirmed Crohn’s disease susceptibility loci. Nat. Genet. 2010, 42, 1118–1125. [Google Scholar] [CrossRef] [Green Version]
- Zhang, F.R.; Huang, W.; Chen, S.M.; Sun, L.D.; Liu, H.; Li, Y.; Cui, Y.; Yan, X.X.; Yang, H.T.; Yang, R.D.; et al. Genomewide association study of leprosy. N. Engl. J. Med. 2009, 361, 2609–2618. [Google Scholar] [CrossRef] [Green Version]
- Higashi, S.; Biskup, S.; West, A.B.; Trinkaus, D.; Dawson, V.L.; Faull, R.L.; Waldvogel, H.J.; Arai, H.; Dawson, T.M.; Moore, D.J.; et al. Localization of Parkinson’s disease-associated LRRK2 in normal and pathological human brain. Brain Res. 2007, 1155, 208–219. [Google Scholar] [CrossRef]
- Higashi, S.; Moore, D.J.; Colebrooke, R.E.; Biskup, S.; Dawson, V.L.; Arai, H.; Dawson, T.M.; Emson, P.C. Expression and localization of Parkinson’s disease-associated leucine-rich repeat kinase 2 in the mouse brain. J. Neurochem. 2007, 100, 368–381. [Google Scholar] [CrossRef]
- Melrose, H.; Lincoln, S.; Tyndall, G.; Dickson, D.; Farrer, M. Anatomical localization of leucine-rich repeat kinase 2 in mouse brain. Neuroscience 2006, 139, 791–794. [Google Scholar] [CrossRef]
- Simon-Sanchez, J.; Herranz-Perez, V.; Olucha-Bordonau, F.; Perez-Tur, J. LRRK2 is expressed in areas affected by Parkinson’s disease in the adult mouse brain. Eur J. Neurosci. 2006, 23, 659–666. [Google Scholar] [CrossRef] [PubMed] [Green Version]
- Westerlund, M.; Belin, A.C.; Anvret, A.; Bickford, P.; Olson, L.; Galter, D. Developmental regulation of leucine-rich repeat kinase 1 and 2 expression in the brain and other rodent and human organs: Implications for Parkinson’s disease. Neuroscience 2008, 152, 429–436. [Google Scholar] [CrossRef] [PubMed]
- Miklossy, J.; Arai, T.; Guo, J.P.; Klegeris, A.; Yu, S.; McGeer, E.G.; McGeer, P.L. LRRK2 expression in normal and pathologic human brain and in human cell lines. J. Neuropathol. Exp. Neurol. 2006, 65, 953–963. [Google Scholar] [CrossRef] [PubMed]
- Biskup, S.; Moore, D.J.; Rea, A.; Lorenz-Deperieux, B.; Coombes, C.E.; Dawson, V.L.; Dawson, T.M.; West, A.B. Dynamic and redundant regulation of LRRK2 and LRRK1 expression. BMC Neurosci. 2007, 8, 102. [Google Scholar] [CrossRef] [Green Version]
- Larsen, K.; Madsen, L.B. Sequence conservation between porcine and human LRRK2. Mol. Biol. Rep. 2009, 36, 237–243. [Google Scholar] [CrossRef]
- Maekawa, T.; Kubo, M.; Yokoyama, I.; Ohta, E.; Obata, F. Age-dependent and cell-population-restricted LRRK2 expression in normal mouse spleen. Biochem. Biophys. Res. Commun. 2010, 392, 431–435. [Google Scholar] [CrossRef]
- Hakimi, M.; Selvanantham, T.; Swinton, E.; Padmore, R.F.; Tong, Y.; Kabbach, G.; Venderova, K.; Girardin, S.E.; Bulman, D.E.; Scherzer, C.R.; et al. Parkinson’s disease-linked LRRK2 is expressed in circulating and tissue immune cells and upregulated following recognition of microbial structures. J. Neural. Transm. 2011, 118, 795–808. [Google Scholar] [CrossRef] [Green Version]
- Thevenet, J.; Pescini Gobert, R.; Hooft van Huijsduijnen, R.; Wiessner, C.; Sagot, Y.J. Regulation of LRRK2 expression points to a functional role in human monocyte maturation. PLoS ONE 2011, 6, e21519. [Google Scholar] [CrossRef]
- Bliederhaeuser, C.; Zondler, L.; Grozdanov, V.; Ruf, W.P.; Brenner, D.; Melrose, H.L.; Bauer, P.; Ludolph, A.C.; Gillardon, F.; Kassubek, J.; et al. LRRK2 contributes to monocyte dysregulation in Parkinson’s disease. Acta Neuropathol. Commun. 2016, 4, 123. [Google Scholar] [CrossRef] [Green Version]
- Kubo, M.; Kamiya, Y.; Nagashima, R.; Maekawa, T.; Eshima, K.; Azuma, S.; Ohta, E.; Obata, F. LRRK2 is expressed in B-2 but not in B-1 B cells, and downregulated by cellular activation. J. Neuroimmunol. 2010, 229, 123–128. [Google Scholar] [CrossRef]
- Kubo, M.; Nagashima, R.; Ohta, E.; Maekawa, T.; Isobe, Y.; Kurihara, M.; Eshima, K.; Iwabuchi, K.; Sasaoka, T.; Azuma, S.; et al. Leucine-rich repeat kinase 2 is a regulator of B cell function, affecting homeostasis, BCR signaling, IgA production, and TI antigen responses. J. Neuroimmunol. 2016, 292, 1–8. [Google Scholar] [CrossRef] [PubMed]
- Gardet, A.; Benita, Y.; Li, C.; Sands, B.E.; Ballester, I.; Stevens, C.; Korzenik, J.R.; Rioux, J.D.; Daly, M.J.; Xavier, R.J.; et al. LRRK2 is involved in the IFN-gamma response and host response to pathogens. J. Immunol. 2010, 185, 5577–5585. [Google Scholar] [CrossRef] [PubMed] [Green Version]
- Takagawa, T.; Kitani, A.; Fuss, I.; Levine, B.; Brant, S.R.; Peter, I.; Tajima, M.; Nakamura, S.; Strober, W. An increase in LRRK2 suppresses autophagy and enhances Dectin-1-induced immunity in a mouse model of colitis. Sci. Transl. Med. 2018, 10, eaan8162. [Google Scholar] [CrossRef] [Green Version]
- Alegre-Abarrategui, J.; Christian, H.; Lufino, M.M.; Mutihac, R.; Venda, L.L.; Ansorge, O.; Wade-Martins, R. LRRK2 regulates autophagic activity and localizes to specific membrane microdomains in a novel human genomic reporter cellular model. Hum. Mol. Genet. 2009, 18, 4022–4034. [Google Scholar] [CrossRef] [Green Version]
- Plowey, E.D.; Cherra, S.J., 3rd; Liu, Y.J.; Chu, C.T. Role of autophagy in G2019S-LRRK2-associated neurite shortening in differentiated SH-SY5Y cells. J. Neurochem. 2008, 105, 1048–1056. [Google Scholar] [CrossRef] [PubMed] [Green Version]
- Schapansky, J.; Nardozzi, J.D.; Felizia, F.; LaVoie, M.J. Membrane recruitment of endogenous LRRK2 precedes its potent regulation of autophagy. Hum. Mol. Genet. 2014, 23, 4201–4214. [Google Scholar] [CrossRef] [Green Version]
- Eguchi, T.; Kuwahara, T.; Sakurai, M.; Komori, T.; Fujimoto, T.; Ito, G.; Yoshimura, S.I.; Harada, A.; Fukuda, M.; Koike, M.; et al. LRRK2 and its substrate Rab GTPases are sequentially targeted onto stressed lysosomes and maintain their homeostasis. Proc. Natl. Acad. Sci. USA 2018, 115, E9115–E9124. [Google Scholar] [CrossRef] [Green Version]
- Liu, Z.; Lee, J.; Krummey, S.; Lu, W.; Cai, H.; Lenardo, M.J. The kinase LRRK2 is a regulator of the transcription factor NFAT that modulates the severity of inflammatory bowel disease. Nat. Immunol. 2011, 12, 1063–1070. [Google Scholar] [CrossRef] [Green Version]
- Kurosaki, T.; Shinohara, H.; Baba, Y. B cell signaling and fate decision. Annu. Rev. Immunol. 2010, 28, 21–55. [Google Scholar] [CrossRef]
- Plociennikowska, A.; Hromada-Judycka, A.; Borzecka, K.; Kwiatkowska, K. Co-operation of TLR4 and raft proteins in LPS-induced pro-inflammatory signaling. Cell Mol. Life Sci. 2015, 72, 557–581. [Google Scholar] [CrossRef] [Green Version]
- Ohta, E.; Kawakami, F.; Kubo, M.; Obata, F. LRRK2 directly phosphorylates Akt1 as a possible physiological substrate: Impairment of the kinase activity by Parkinson’s disease-associated mutations. FEBS Lett. 2011, 585, 2165–2170. [Google Scholar] [CrossRef] [PubMed] [Green Version]
- Reynolds, A.D.; Stone, D.K.; Mosley, R.L.; Gendelman, H.E. Nitrated {alpha}-synuclein-induced alterations in microglial immunity are regulated by CD4+ T cell subsets. J. Immunol. 2009, 182, 4137–4149. [Google Scholar] [CrossRef] [PubMed] [Green Version]
- Mosley, R.L.; Hutter-Saunders, J.A.; Stone, D.K.; Gendelman, H.E. Inflammation and adaptive immunity in Parkinson’s disease. Cold. Spring. Harb. Perspect. Med. 2012, 2, a009381. [Google Scholar] [CrossRef] [PubMed] [Green Version]
- Fava, V.M.; Manry, J.; Cobat, A.; Orlova, M.; Van Thuc, N.; Ba, N.N.; Thai, V.H.; Abel, L.; Alcais, A.; Schurr, E. A Missense LRRK2 Variant Is a Risk Factor for Excessive Inflammatory Responses in Leprosy. PLoS Negl. Trop. Dis. 2016, 10, e0004412. [Google Scholar] [CrossRef]
- Tulisiak, C.T.; Mercado, G.; Peelaerts, W.; Brundin, L.; Brundin, P. Can infections trigger alpha-synucleinopathies? Prog. Mol. Biol. Transl. Sci. 2019, 168, 299–322. [Google Scholar]
- Beatman, E.L.; Massey, A.; Shives, K.D.; Burrack, K.S.; Chamanian, M.; Morrison, T.E.; Beckham, J.D. Alpha-Synuclein Expression Restricts RNA Viral Infections in the Brain. J. Virol. 2015, 90, 2767–2782. [Google Scholar] [CrossRef] [Green Version]
- Tsai, H.H.; Liou, H.H.; Muo, C.H.; Lee, C.Z.; Yen, R.F.; Kao, C.H. Hepatitis C virus infection as a risk factor for Parkinson disease: A nationwide cohort study. Neurology 2016, 86, 840–846. [Google Scholar] [CrossRef]
- Miman, O.; Kusbeci, O.Y.; Aktepe, O.C.; Cetinkaya, Z. The probable relation between Toxoplasma gondii and Parkinson’s disease. Neurosci. Lett. 2010, 475, 129–131. [Google Scholar] [CrossRef]
- Li, Y.; Severance, E.G.; Viscidi, R.P.; Yolken, R.H.; Xiao, J. Persistent Toxoplasma Infection of the Brain Induced Neurodegeneration Associated with Activation of Complement and Microglia. Infect. Immun. 2019, 87, e00139-19. [Google Scholar] [CrossRef] [Green Version]
- Chuenkova, M.V.; Pereiraperrin, M. Enhancement of tyrosine hydroxylase expression and activity by Trypanosoma cruzi parasite-derived neurotrophic factor. Brain Res. 2006, 1099, 167–175. [Google Scholar] [CrossRef]
- Hinkle, K.M.; Yue, M.; Behrouz, B.; Dachsel, J.C.; Lincoln, S.J.; Bowles, E.E.; Beevers, J.E.; Dugger, B.; Winner, B.; Prots, I.; et al. LRRK2 knockout mice have an intact dopaminergic system but display alterations in exploratory and motor co-ordination behaviors. Mol. Neurodegener. 2012, 7, 25. [Google Scholar] [CrossRef] [PubMed] [Green Version]


© 2020 by the authors. Licensee MDPI, Basel, Switzerland. This article is an open access article distributed under the terms and conditions of the Creative Commons Attribution (CC BY) license (http://creativecommons.org/licenses/by/4.0/).
Share and Cite
Kubo, M.; Nagashima, R.; Kurihara, M.; Kawakami, F.; Maekawa, T.; Eshima, K.; Ohta, E.; Kato, H.; Obata, F. Leucine-Rich Repeat Kinase 2 Controls Inflammatory Cytokines Production through NF-κB Phosphorylation and Antigen Presentation in Bone Marrow-Derived Dendritic Cells. Int. J. Mol. Sci. 2020, 21, 1890. https://0-doi-org.brum.beds.ac.uk/10.3390/ijms21051890
Kubo M, Nagashima R, Kurihara M, Kawakami F, Maekawa T, Eshima K, Ohta E, Kato H, Obata F. Leucine-Rich Repeat Kinase 2 Controls Inflammatory Cytokines Production through NF-κB Phosphorylation and Antigen Presentation in Bone Marrow-Derived Dendritic Cells. International Journal of Molecular Sciences. 2020; 21(5):1890. https://0-doi-org.brum.beds.ac.uk/10.3390/ijms21051890
Chicago/Turabian StyleKubo, Makoto, Ryuichi Nagashima, Mitsue Kurihara, Fumitaka Kawakami, Tatsunori Maekawa, Koji Eshima, Etsuro Ohta, Hirotomo Kato, and Fumiya Obata. 2020. "Leucine-Rich Repeat Kinase 2 Controls Inflammatory Cytokines Production through NF-κB Phosphorylation and Antigen Presentation in Bone Marrow-Derived Dendritic Cells" International Journal of Molecular Sciences 21, no. 5: 1890. https://0-doi-org.brum.beds.ac.uk/10.3390/ijms21051890