
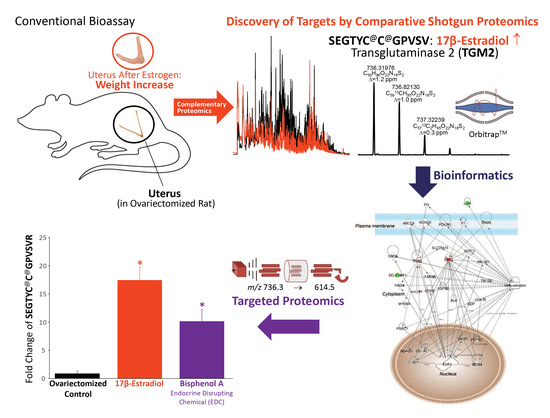
Proteomics Complementation of the Rat Uterotrophic Assay for Estrogenic Endocrine Disruptors: A Roadmap of Advancing High Resolution Mass Spectrometry-Based Shotgun Survey to Targeted Biomarker Quantifications


Abstract
:
1. Introduction
2. Results and Discussion
3. Materials and Methods
3.1. Chemicals
3.2. Animals
3.3. Sample Preparation
3.4. Data-Dependent LC-MS/MS Data Acquisition for Discovery-Driven Shotgun Proteomics
3.5. Database Search, Label-Free Relative Quantification, and Pathway Analysis
3.6. Target Panel and Internal Standards
3.7. MRM-Based LC–MS/MS Data Acquisition for Targeted Proteomics
3.8. Data Processing for Targeted Proteomics and Statistical Analysis of the Results
Supplementary Materials
Author Contributions
Funding
Institutional Review Board Statement
Informed Consent Statement
Data Availability Statement
Acknowledgments
Conflicts of Interest
References
- Colborn, T.; vom Saal, F.S.; Soto, A.M. Developmental effects of endocrine-disrupting chemicals in wildlife and humans. Environ. Health Perspect. 1993, 101, 378–384. [Google Scholar] [CrossRef]
- Ankley, G.; Francis, E.; Gray, E.; Kavlock, R.; McMaster, S.; Reese, D.; Sayles, G.; Sergeant, A.; Vallero, D. Research Plan for Endocrine Disruptors; Office of Research and Development, United States Environmental Protection Agency: Washington, DC, USA, 1998; pp. 1–47.
- United States Environmental Protection Agency. Endocrine Disruptor Screening Program (EDSP). Available online: http://www.epa.gov/endo/ (accessed on 27 October 2018).
- United States Environmental Protection Agency. Next Generation Risk Assessment: Incorporation of Recent Advances in Molecular, Computational, and Systems Biology; National Center for Environmental Assessment Office of Research and Development, United States Environmental Protection Agency: Washington, DC, USA, 2014; pp. 1–12.
- Baker, V.A. Endocrine disrupters—Testing strategies to assess human hazard. Toxicol. Vitr. 2001, 15, 413–419. [Google Scholar] [CrossRef]
- Clode, S.A. Assessment of in vivo assays for endocrine disruption. Best Pract. Res. Clin. Endocrinol. Metab. 2006, 20, 35–43. [Google Scholar] [CrossRef]
- Gelbke, H.P.; Kayser, M.; Poole, A. OECD test strategies and methods for endocrine disruptors. Toxicology 2004, 205, 17–25. [Google Scholar] [CrossRef] [PubMed]
- Marty, M.S.; O’Connor, J.C. Key learnings from the Endocrine Disruptor Screening Program (EDSP) Tier 1 rodent uterotrophic and Hershberger assays. Birth Defects Res. Dev. Reprod. Toxicol. 2014, 101, 63–79. [Google Scholar] [CrossRef] [Green Version]
- Owens, J.W.; Ashby, J. Critical review and evaluation of the uterotrophic bioassay for the identification of possible estrogen agonists and antagonists: In support of the validation of the OECD uterotrophic protocols for the laboratory rodent. Crit. Rev. Toxicol. 2002, 32, 445–520. [Google Scholar] [CrossRef] [PubMed]
- O’Connor, J.C.; Cook, J.C.; Marty, M.S.; Davis, L.G.; Kaplan, A.M.; Carney, E.W. Evaluation of Tier I screening approaches for detecting endocrine-active compounds (EACs). Crit. Rev. Toxicol. 2002, 32, 521–549. [Google Scholar] [CrossRef]
- Yoon, K.; Kwack, S.J.; Kim, H.S.; Lee, B.M. Estrogenic endocrine-disrupting chemicals: Molecular mechanisms of actions on putative human diseases. J. Toxicol. Environ. Health Crit. Rev. 2014, 17, 127–174. [Google Scholar] [CrossRef]
- Kiyama, R.; Wada-Kiyama, Y. Estrogenic endocrine disruptors: Molecular mechanisms of action. Environ. Int. 2015, 83, 11–40. [Google Scholar] [CrossRef] [PubMed]
- Tyler, C.R.; Jobling, S.; Sumpter, J.P. Endocrine disruption in wildlife: A critical review of the evidence. Crit. Rev. Toxicol. 1998, 28, 319–361. [Google Scholar] [CrossRef] [PubMed]
- United States Environmental Protection Agency. Endocrine Disruptor Screening Program Test Guidelines OPPTS 890.1600: Uterotrophic Assay; Office of Prevention, Pesticides and Toxic Substances (OPPTS), United States Environmental Protection Agency: Washington, DC, USA, 2009; pp. 1–21.
- United States Environmental Protection Agency. Uterotrophic Assay OCSPP Guideline 890.1600: Standard Evaluation Procedure (SEP); Endocrine Disruptor Screening Program, United States Environmental Protection Agency: Washington, DC, USA, 2011; pp. 1–19.
- Watanabe, H.; Suzuki, A.; Kobayashi, M.; Takahashi, E.; Itamoto, M.; Lubahn, D.B.; Handa, H.; Iguchi, T. Analysis of temporal changes in the expression of estrogen-regulated genes in the uterus. J. Mol. Endocrinol. 2003, 30, 347–358. [Google Scholar] [CrossRef] [Green Version]
- Watanabe, H.; Suzuki, A.; Mizutani, T.; Khono, S.; Lubahn, D.B.; Handa, H.; Iguchi, T. Genome-wide analysis of changes in early gene expression induced by oestrogen. Genes Cells 2002, 7, 497–507. [Google Scholar] [CrossRef]
- Bauersachs, S.; Mitko, K.; Ulbrich, S.E.; Blum, H.; Wolf, E. Transcriptome studies of bovine endometrium reveal molecular profiles characteristic for specific stages of estrous cycle and early pregnancy. Exp. Clin. Endocrinol. Diabetes 2008, 116, 371–384. [Google Scholar] [CrossRef] [PubMed]
- Zama, A.M.; Uzumcu, M. Epigenetic effects of endocrine-disrupting chemicals on female reproduction: An ovarian perspective. Front. Neuroendocrinol. 2010, 31, 420–439. [Google Scholar] [CrossRef] [PubMed] [Green Version]
- Spencer, T.E.; Dunlap, K.A.; Filant, J. Comparative developmental biology of the uterus: Insights into mechanisms and developmental disruption. Mol. Cell. Endocrinol. 2012, 354, 34–53. [Google Scholar] [CrossRef]
- La Rocca, J.; Boyajian, A.; Brown, C.; Smith, S.D.; Hixon, M. Effects of in utero exposure to Bisphenol A or diethylstilbestrol on the adult male reproductive system. Birth Defects Res. Dev. Reprod. Toxicol. 2011, 92, 526–533. [Google Scholar] [CrossRef] [Green Version]
- Sahambi, S.K.; Pelland, A.; Cooke, G.M.; Schrader, T.; Tardif, R.; Charbonneau, M.; Krishnan, K.; Haddad, S.; Cyr, D.G.; Devine, P.J. Oral p-tertoctylphenol exposures induce minimal toxic or estrogenic effects in adult female Sprague-Dawley rats. J. Toxicol. Environ. Health 2010, 73, 607–622. [Google Scholar] [CrossRef] [PubMed]
- Seidlova-Wuttke, D.; Christoffel, J.; Rimoldi, G.; Jarry, H.; Wuttke, W. Comparison of effects of estradiol with those of octylmethoxycinnamate and 4-methylbenzylidene camphor on fat tissue, lipids and pituitary hormones. Toxicol. Appl. Pharmacol. 2006, 214, 1–7. [Google Scholar] [CrossRef] [PubMed]
- Prokai, L.; Stevens, S.M., Jr.; Rauniyar, N.; Nguyen, V. Rapid label-free identification of estrogen-induced differential protein expression in vivo from mouse brain and uterine tissue. J. Proteome Res. 2009, 8, 3862–3871. [Google Scholar] [CrossRef] [PubMed] [Green Version]
- Callegari, E.A. Shotgun proteomics analysis of estrogen effects in the uterus using two-dimensional liquid chromatography and tandem mass spectrometry. Methods Mol. Biol. 2016, 1366, 131–148. [Google Scholar]
- Aebersold, R.; Goodlett, D.R. Mass spectrometry in proteomics. Chem. Rev. 2001, 101, 269–295. [Google Scholar] [CrossRef] [PubMed]
- Aebersold, R.; Mann, M. Mass spectrometry-based proteomics. Nature 2003, 422, 198–207. [Google Scholar] [CrossRef]
- Bantscheff, M.; Schirle, M.; Sweetman, G.; Rick, J.; Kuster, B. Quantitative mass spectrometry in proteomics: A critical review. Anal. Bioanal. Chem. 2007, 389, 1017–1031. [Google Scholar] [CrossRef] [Green Version]
- Bantscheff, M.; Lemeer, S.; Savitski, M.M.; Kuster, B. Quantitative mass spectrometry in proteomics: Critical review update from 2007 to the present. Anal. Bioanal. Chem. 2012, 404, 939–965. [Google Scholar] [CrossRef]
- Bensimon, A.; Heck, A.J.R.; Aebersold, R. Mass Spectrometry-Based Proteomics and Network Biology. In Annual Review of Biochemistry; Kornberg, R.D., Ed.; Annual Reviews: Palo Alto, CA, USA, 2012; Volume 81, pp. 379–405. [Google Scholar]
- Ebhardt, H.A.; Root, A.; Sander, C.; Aebersold, R. Applications of targeted proteomics in systems biology and translational medicine. Proteomics 2015, 15, 3193–3208. [Google Scholar] [CrossRef]
- Shi, T.J.; Song, E.W.; Nie, S.; Rodland, K.D.; Liu, T.; Qian, W.J.; Smith, R.D. Advances in targeted proteomics and applications to biomedical research. Proteomics 2016, 16, 2160–2182. [Google Scholar] [CrossRef] [Green Version]
- Doerr, A. Mass spectrometry–based targeted proteomics. Nat. Methods 2013, 10, 23. [Google Scholar] [CrossRef]
- Abraham, A.; Chakraborty, P. A review on sources and health impacts of bisphenol A. Rev. Environ. Health 2020, 35, 201–210. [Google Scholar] [CrossRef]
- Prokai, L.; Zaman, K.; Nguyen, V.; Prokai-Tatrai, K. 17β-Estradiol delivered in eye drops: Evidence of impact on protein networks and associated biological processes in the rat retina through quantitative proteomics. Pharmaceutics 2020, 12, 101. [Google Scholar] [CrossRef] [PubMed] [Green Version]
- Keller, A.; Nesvizhskii, A.I.; Kolker, E.; Aebersold, R. Empirical statistical model to estimate the accuracy of peptide identifications made by MS/MS and database search. Anal. Chem. 2002, 74, 5383–5392. [Google Scholar] [CrossRef] [PubMed]
- Nesvizhskii, A.I.; Keller, A.; Kolker, E.; Aebersold, R. A statistical model for identifying proteins by tandem mass spectrometry. Anal. Chem. 2003, 75, 4646–4658. [Google Scholar] [CrossRef]
- Liu, H.; Sadygov, R.G.; Yates, J.R., III. A model for random sampling and estimation of relative protein abundance in shotgun proteomics. Anal. Chem. 2004, 76, 4193–4201. [Google Scholar] [CrossRef]
- Kerdivel, G.; Habauzit, D.; Pakdel, F. Assessment and molecular actions of endocrine-disrupting chemicals that interfere with estrogen receptor pathways. Int. J. Endocrinol. 2013, 2013, 501851. [Google Scholar] [CrossRef] [Green Version]
- Jaffe, J.D.; Keshishian, H.; Chang, B.; Addona, T.A.; Gillette, M.A.; Carr, S.A. Accurate inclusion mass screening. Mol. Cell. Proteom. 2008, 7, 1952–1962. [Google Scholar] [CrossRef] [PubMed] [Green Version]
- Roepstorff, P.; Fohlman, J. Proposal for a common nomenclature for sequence ions in mass spectra of peptides. Biomed. Mass Spectrom. 1984, 11, 601. [Google Scholar] [CrossRef] [PubMed]
- Boverhof, D.R.; Fertuck, K.C.; Burgoon, L.D.; Eckel, J.E.; Gennings, C.; Zacharewski, T.R. Temporal- and dose-dependent hepatic gene expression changes in immature ovariectomized mice following exposure to ethynyl estradiol. Carcinogenesis 2004, 25, 1277–1291. [Google Scholar] [CrossRef]
- Kiraly, R.; Demeny, M.; Fesus, L. Protein transamidation by transglutaminase 2 in cells: A disputed Ca2+-dependent action of a multifunctional protein. FEBS J. 2011, 278, 4717–4739. [Google Scholar] [CrossRef]
- Zhu, Z.; Boobis, A.R.; Edwards, R.J. Identification of estrogen-responsive proteins in MCF-7 human breast cancer cells using label-free quantitative proteomics. Proteomics 2008, 8, 1987–2005. [Google Scholar] [CrossRef]
- Collodoro, M.; Lemaire, P.; Eppe, G.; Bertrand, V.; Dobson, R.; Mazzucchelli, G.; Widart, J.; De Pauw, E.; De Pauw-Gillet, M.C. Identification and quantification of concentration-dependent biomarkers in MCF-7/BOS cells exposed to 17beta-estradiol by 2-D DIGE and label-free proteomics. J. Proteom. 2012, 75, 4555–4569. [Google Scholar] [CrossRef]
- Øverbye, A.; Brinchmann, M.F.; Seglen, P.O. Proteomic analysis of membrane-associated proteins from rat liver autophagosomes. Autophagy 2014, 3, 300–322. [Google Scholar] [CrossRef] [Green Version]
- Zhang, Z.; Zhang, J.; Xiao, J. Selenoproteins and selenium status in bone physiology and pathology. Biochim. Biophys. Acta 2014, 1840, 3246–3256. [Google Scholar] [CrossRef]
- Porat, A.; Sagiv, Y.; Elazar, Z. A 56-kDa Selenium-binding protein participates in intra-Golgi protein transport. J. Biol. Chem. 2000, 275, 14457–14465. [Google Scholar] [CrossRef] [PubMed] [Green Version]
- Zhang, S.; Li, F.; Younes, M.; Liu, H.; Chen, C.; Yao, Q. Reduced selenium-binding protein 1 in breast cancer correlates with poor survival and resistance to the anti-proliferative effects of selenium. PLoS ONE 2013, 8, e63702. [Google Scholar] [CrossRef] [PubMed] [Green Version]
- Salgado, R.M.; Favaro, R.R.; Zorn, T.M.T. Modulation of small leucine-rich proteoglycans (SLRPs) expression in the mouse uterus by estradiol and progesterone. Reprod. Biol. Endocrinol. 2011, 9, 22. [Google Scholar] [CrossRef] [PubMed] [Green Version]
- Anonymous. Method of the Year 2012. Nat. Methods 2013, 10, 1. [Google Scholar] [CrossRef]
- Marx, V. Targeted proteomics. Nat. Methods 2012, 10, 19–22. [Google Scholar] [CrossRef]
- Kim, H.S.; Han, S.Y.; Yoo, S.D.; Lee, B.M.; Park, K.L. Potential estrogenic effects of bisphenol-A estimated by in vitro and in vivo combination assays. J. Toxicol. Sci. 2001, 26, 111–118. [Google Scholar] [CrossRef] [Green Version]
- Kitamura, S.; Suzuki, T.; Sanoh, S.; Kohta, R.; Jinno, N.; Sugihara, K.; Yoshihara, S.; Fujimoto, N.; Watanabe, H.; Ohta, S. Comparative study of the endocrine-disrupting activity of bisphenol A and 19 related compounds. Toxicol. Sci. 2005, 84, 249–259. [Google Scholar] [CrossRef]
- Rochester, J.R. Bisphenol A and human health: A review of the literature. Reprod. Toxicol. 2013, 42, 132–155. [Google Scholar] [CrossRef]
- Liao, C.; Kannan, K. Concentrations and profiles of bisphenol A and other bisphenol analogues in foodstuffs from the United States and their implications for human exposure. J. Agric. Food Chem. 2013, 61, 4655–4662. [Google Scholar] [CrossRef] [PubMed]
- Bhandari, R.K.; Deem, S.L.; Holliday, D.K.; Jandegian, C.M.; Kassotis, C.D.; Nagel, S.C.; Tillitt, D.E.; Vom Saal, F.S.; Rosenfeld, C.S. Effects of the environmental estrogenic contaminants bisphenol A and 17α-ethinyl estradiol on sexual development and adult behaviors in aquatic wildlife species. Gen. Comp. Endocrinol. 2015, 214, 195–219. [Google Scholar] [CrossRef]
- Bisphenol A (BPA). Available online: https://www.niehs.nih.gov/health/topics/agents/sya-bpa/ (accessed on 21 January 2021).
- Vizcaino, J.A.; Deutsch, E.W.; Wang, R.; Csordas, A.; Reisinger, F.; Rios, D.; Dianes, J.A.; Sun, Z.; Farrah, T.; Bandeira, N.; et al. Proteome Xchange provides globally coordinated proteomics data submission and dissemination. Nat. Biotechnol. 2014, 32, 223–226. [Google Scholar] [CrossRef]


| Rat Uterus Protein | Proteotypic Tryptic Peptide | Fold Change after E2 Treatment 1 | Fold Change after BPA Treatment 1 |
|---|---|---|---|
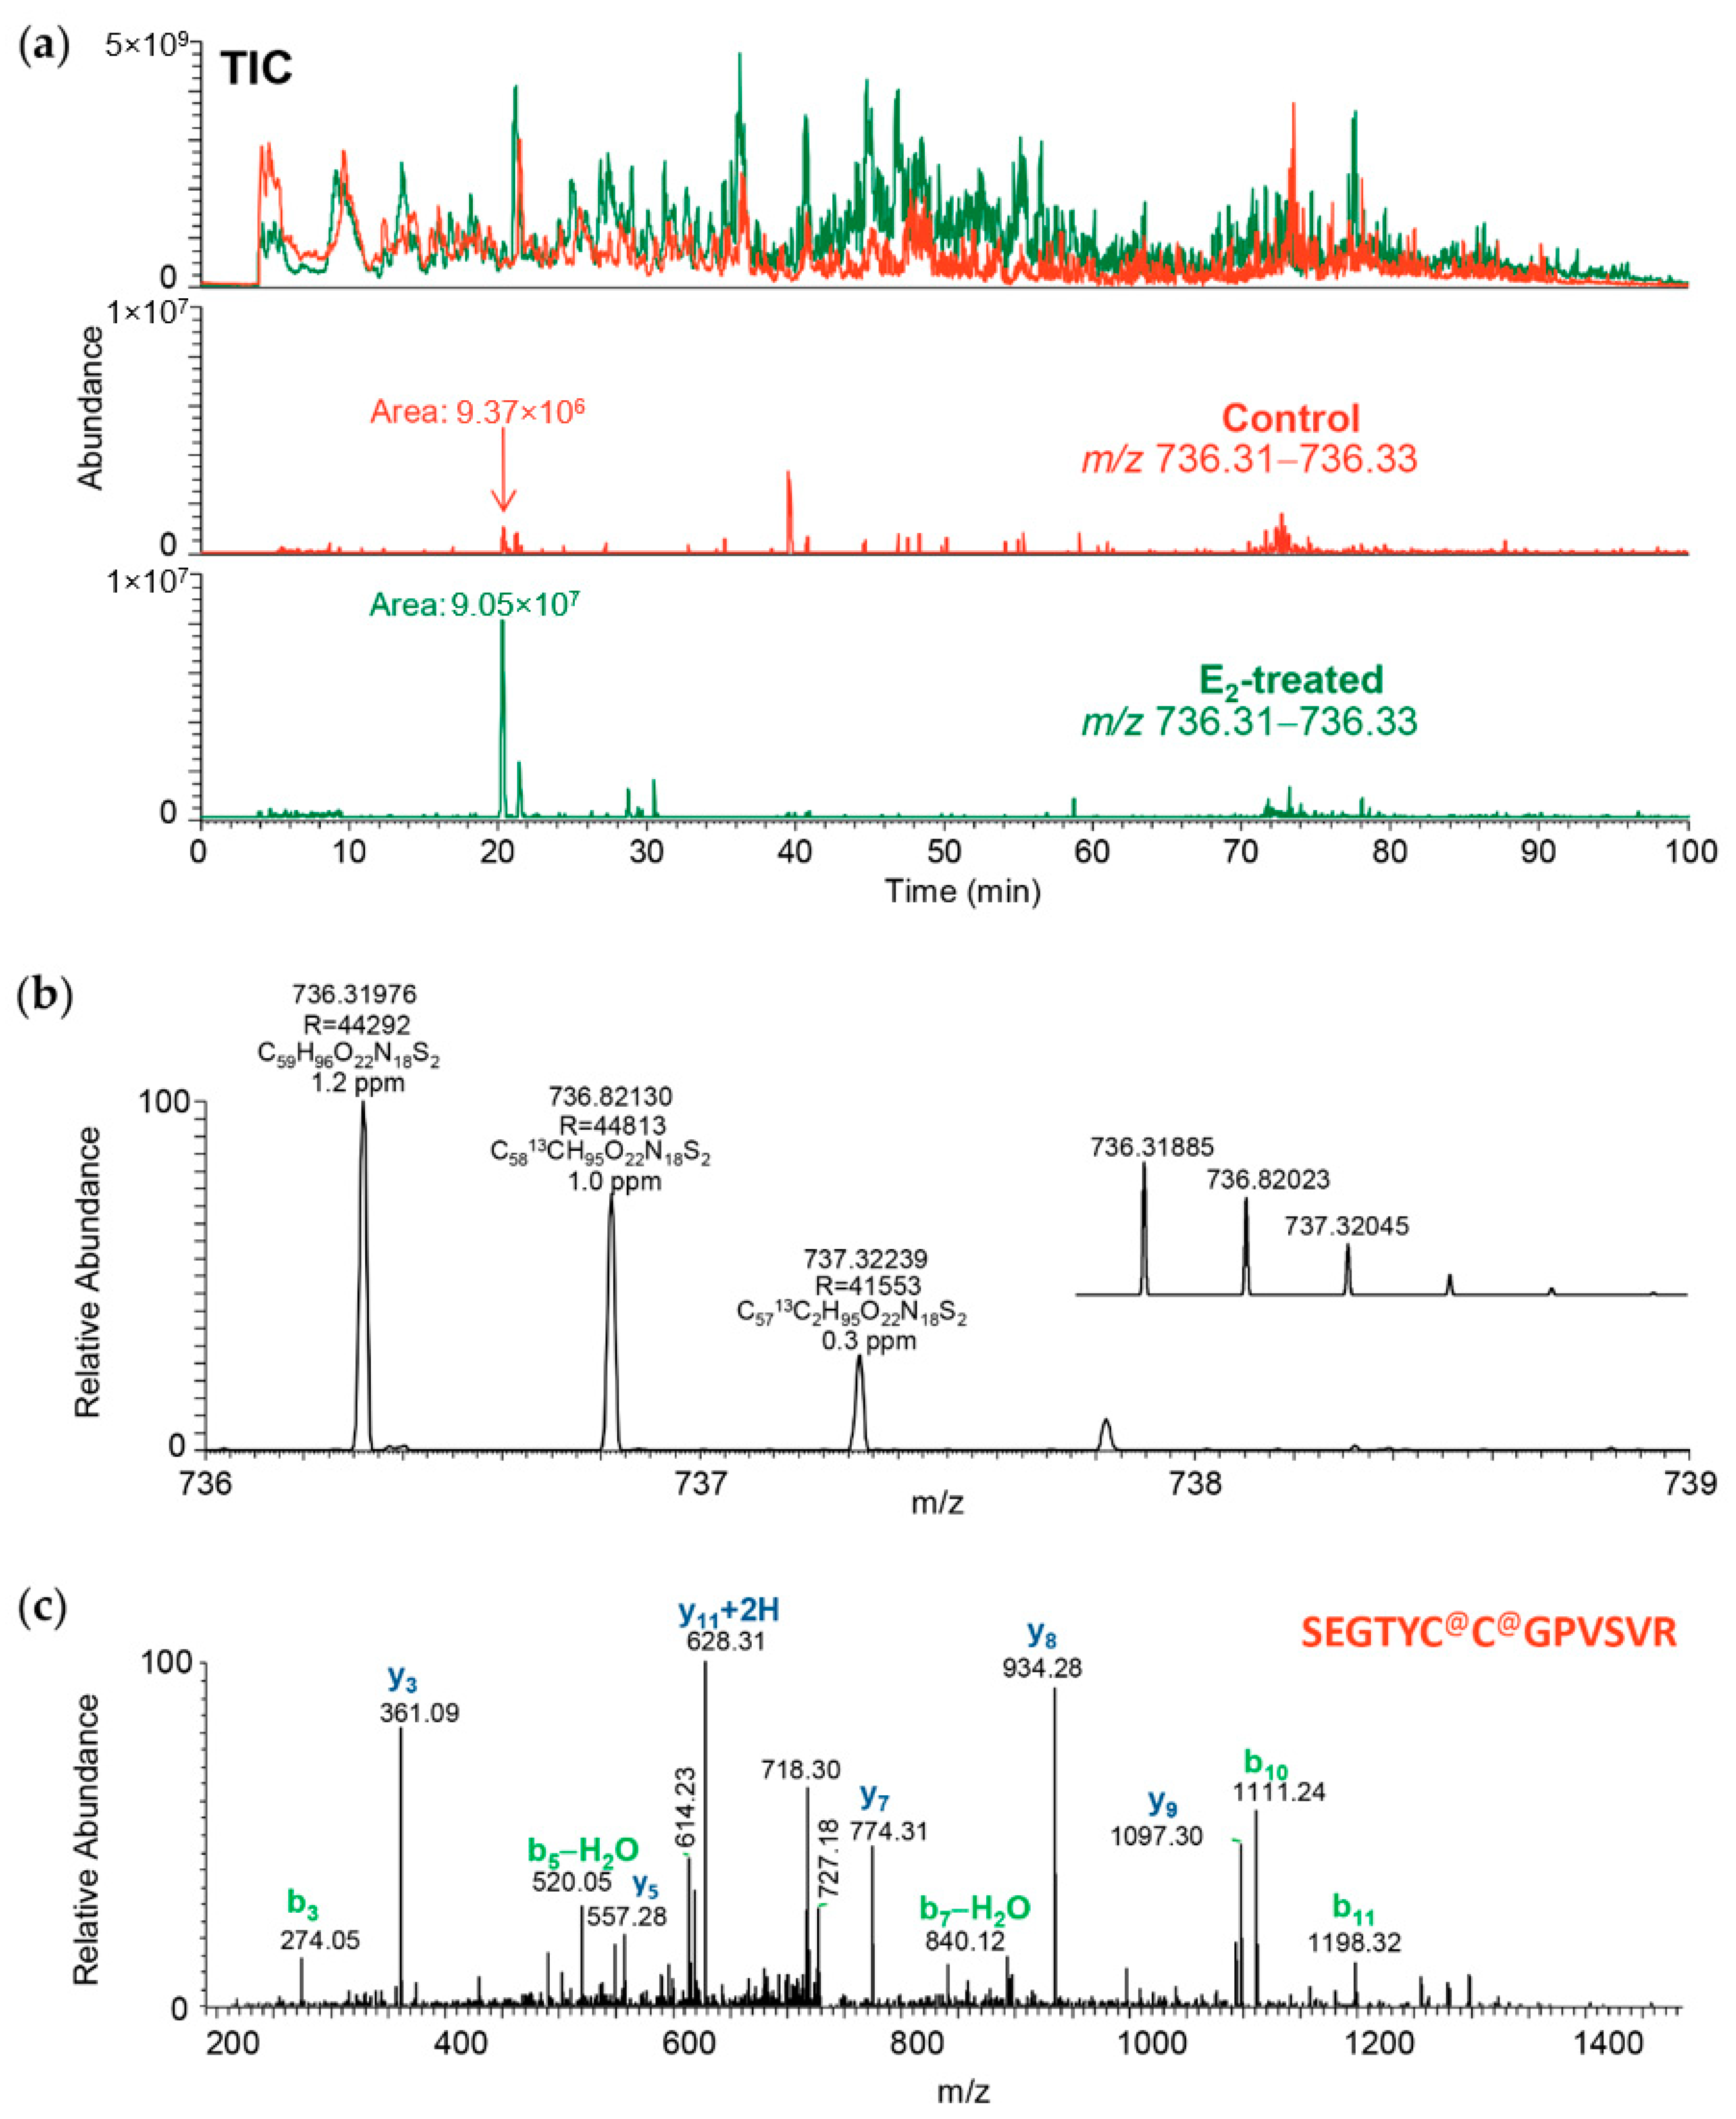
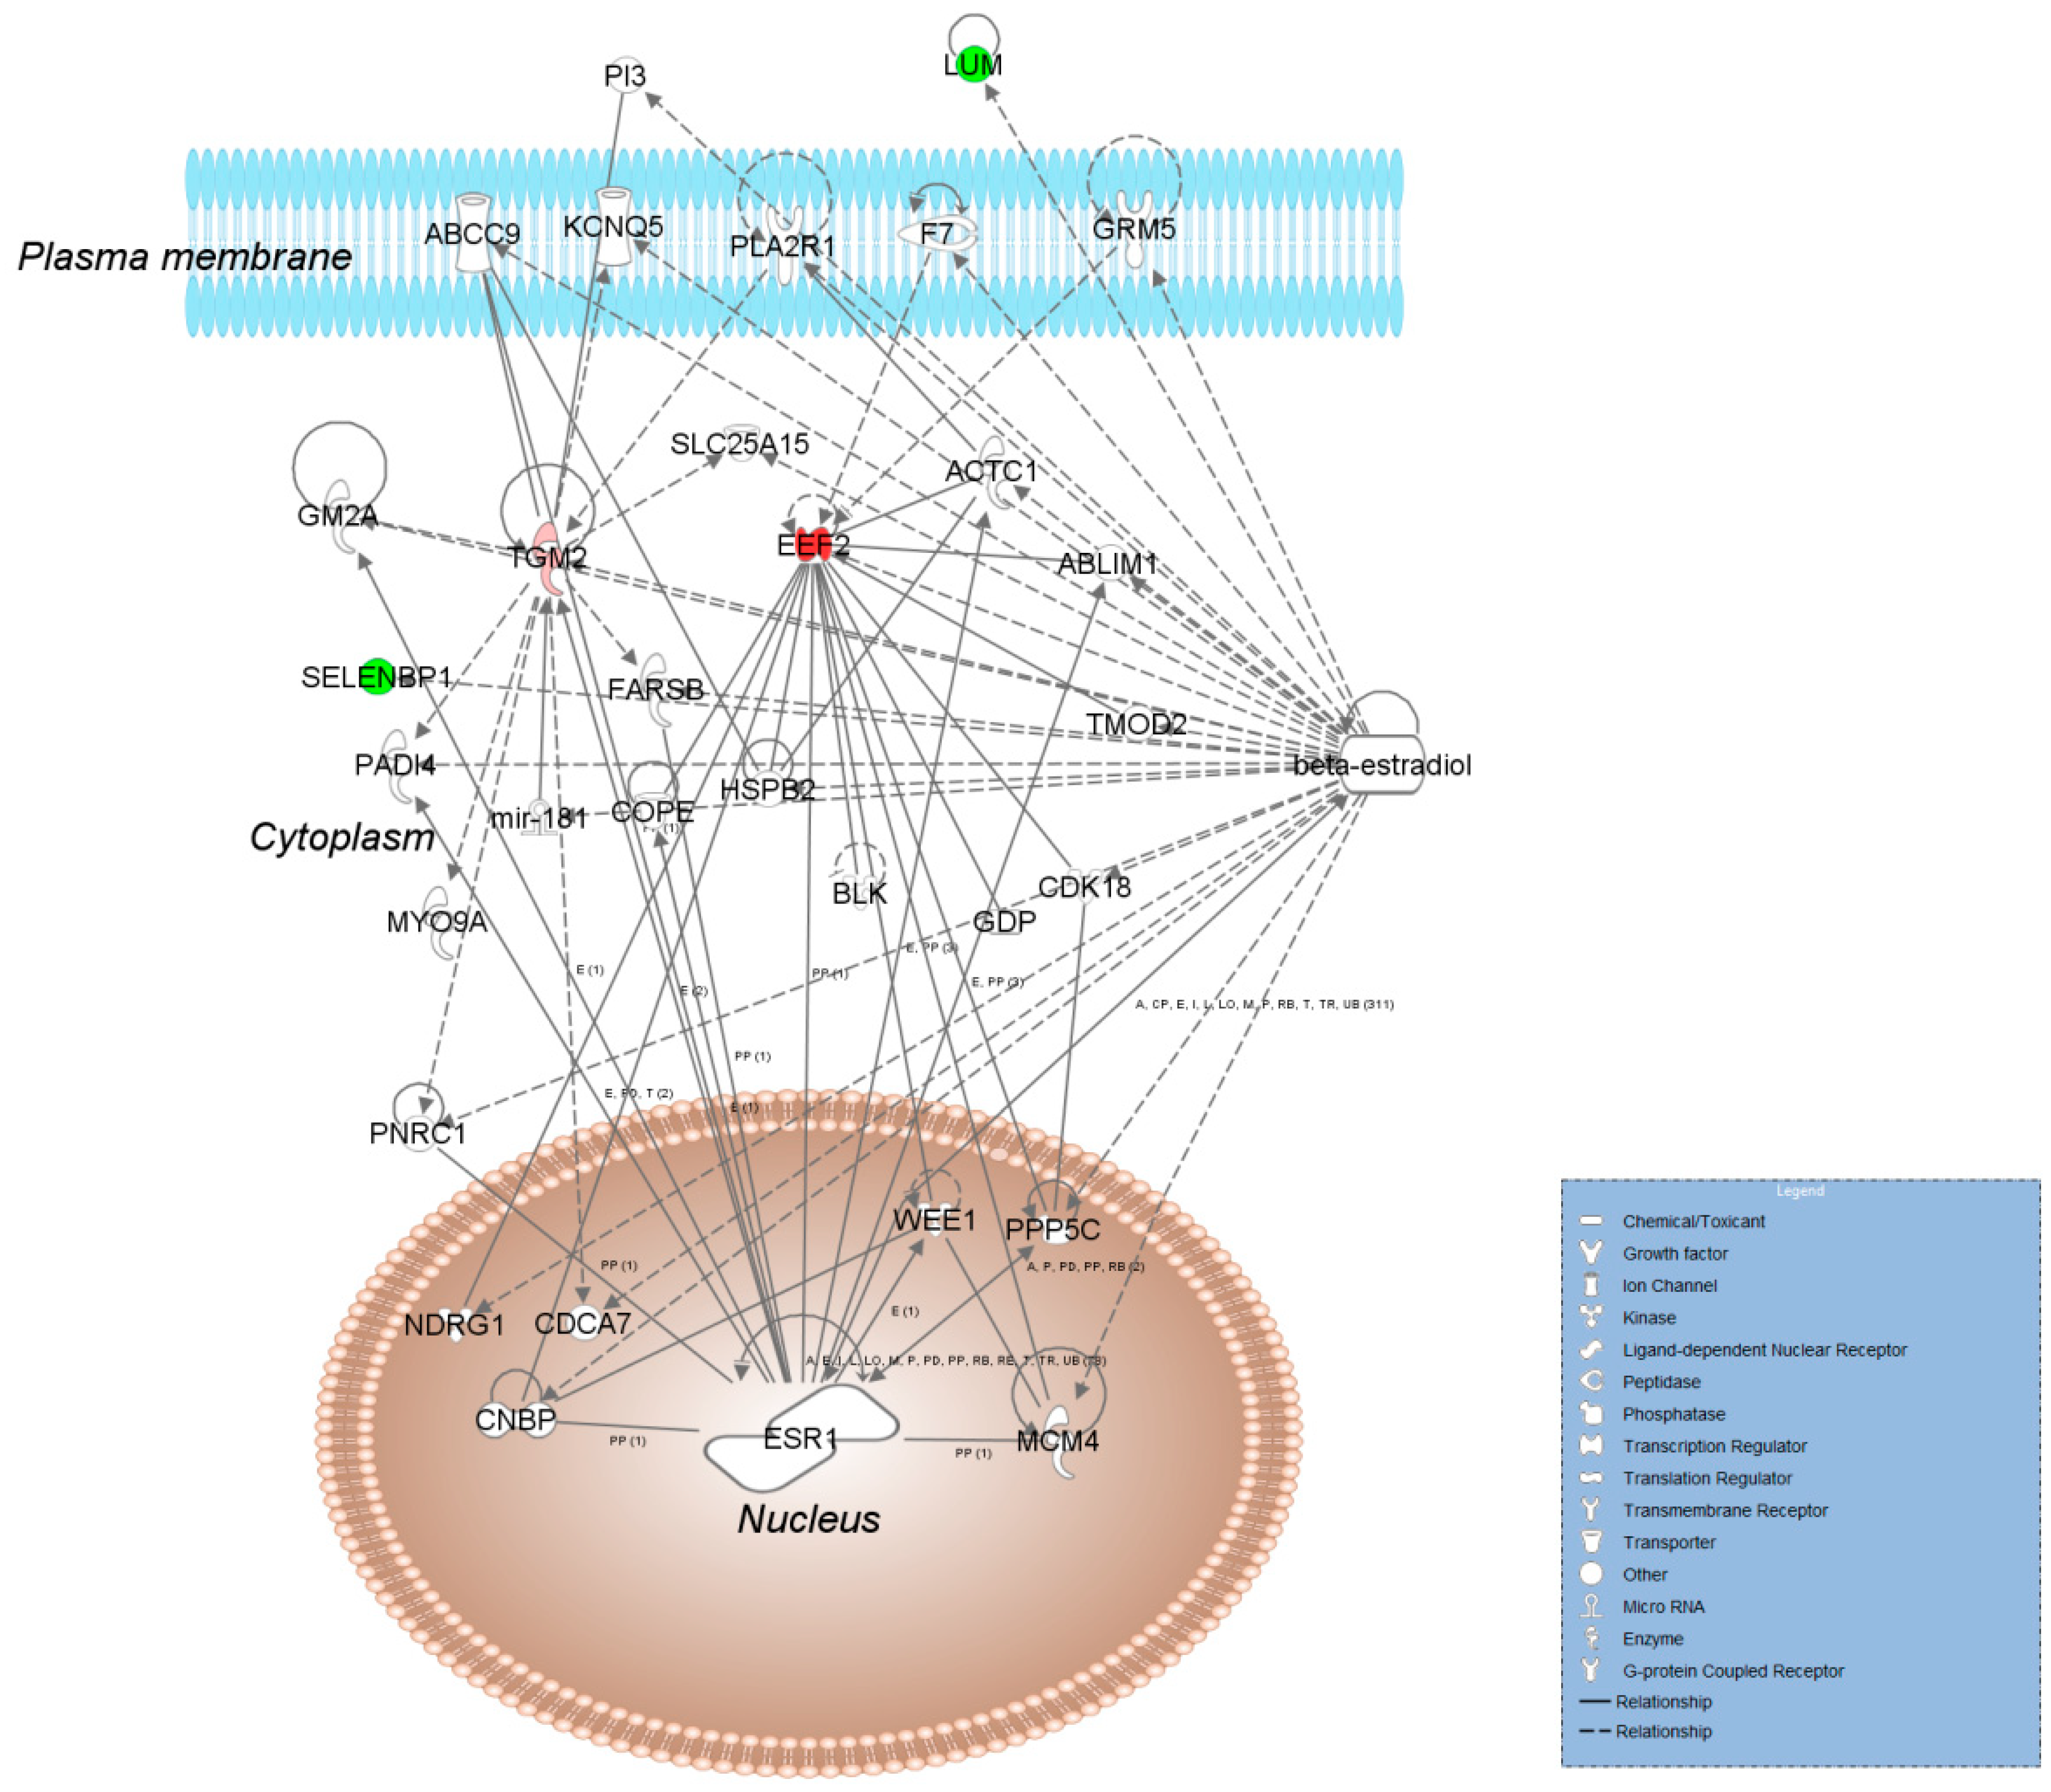
| Transglutaminase 2, C polypeptide (TGM2) | YSGCLTESNLIK | 24.7 ± 4.6 | 14.3 ± 4.4 |
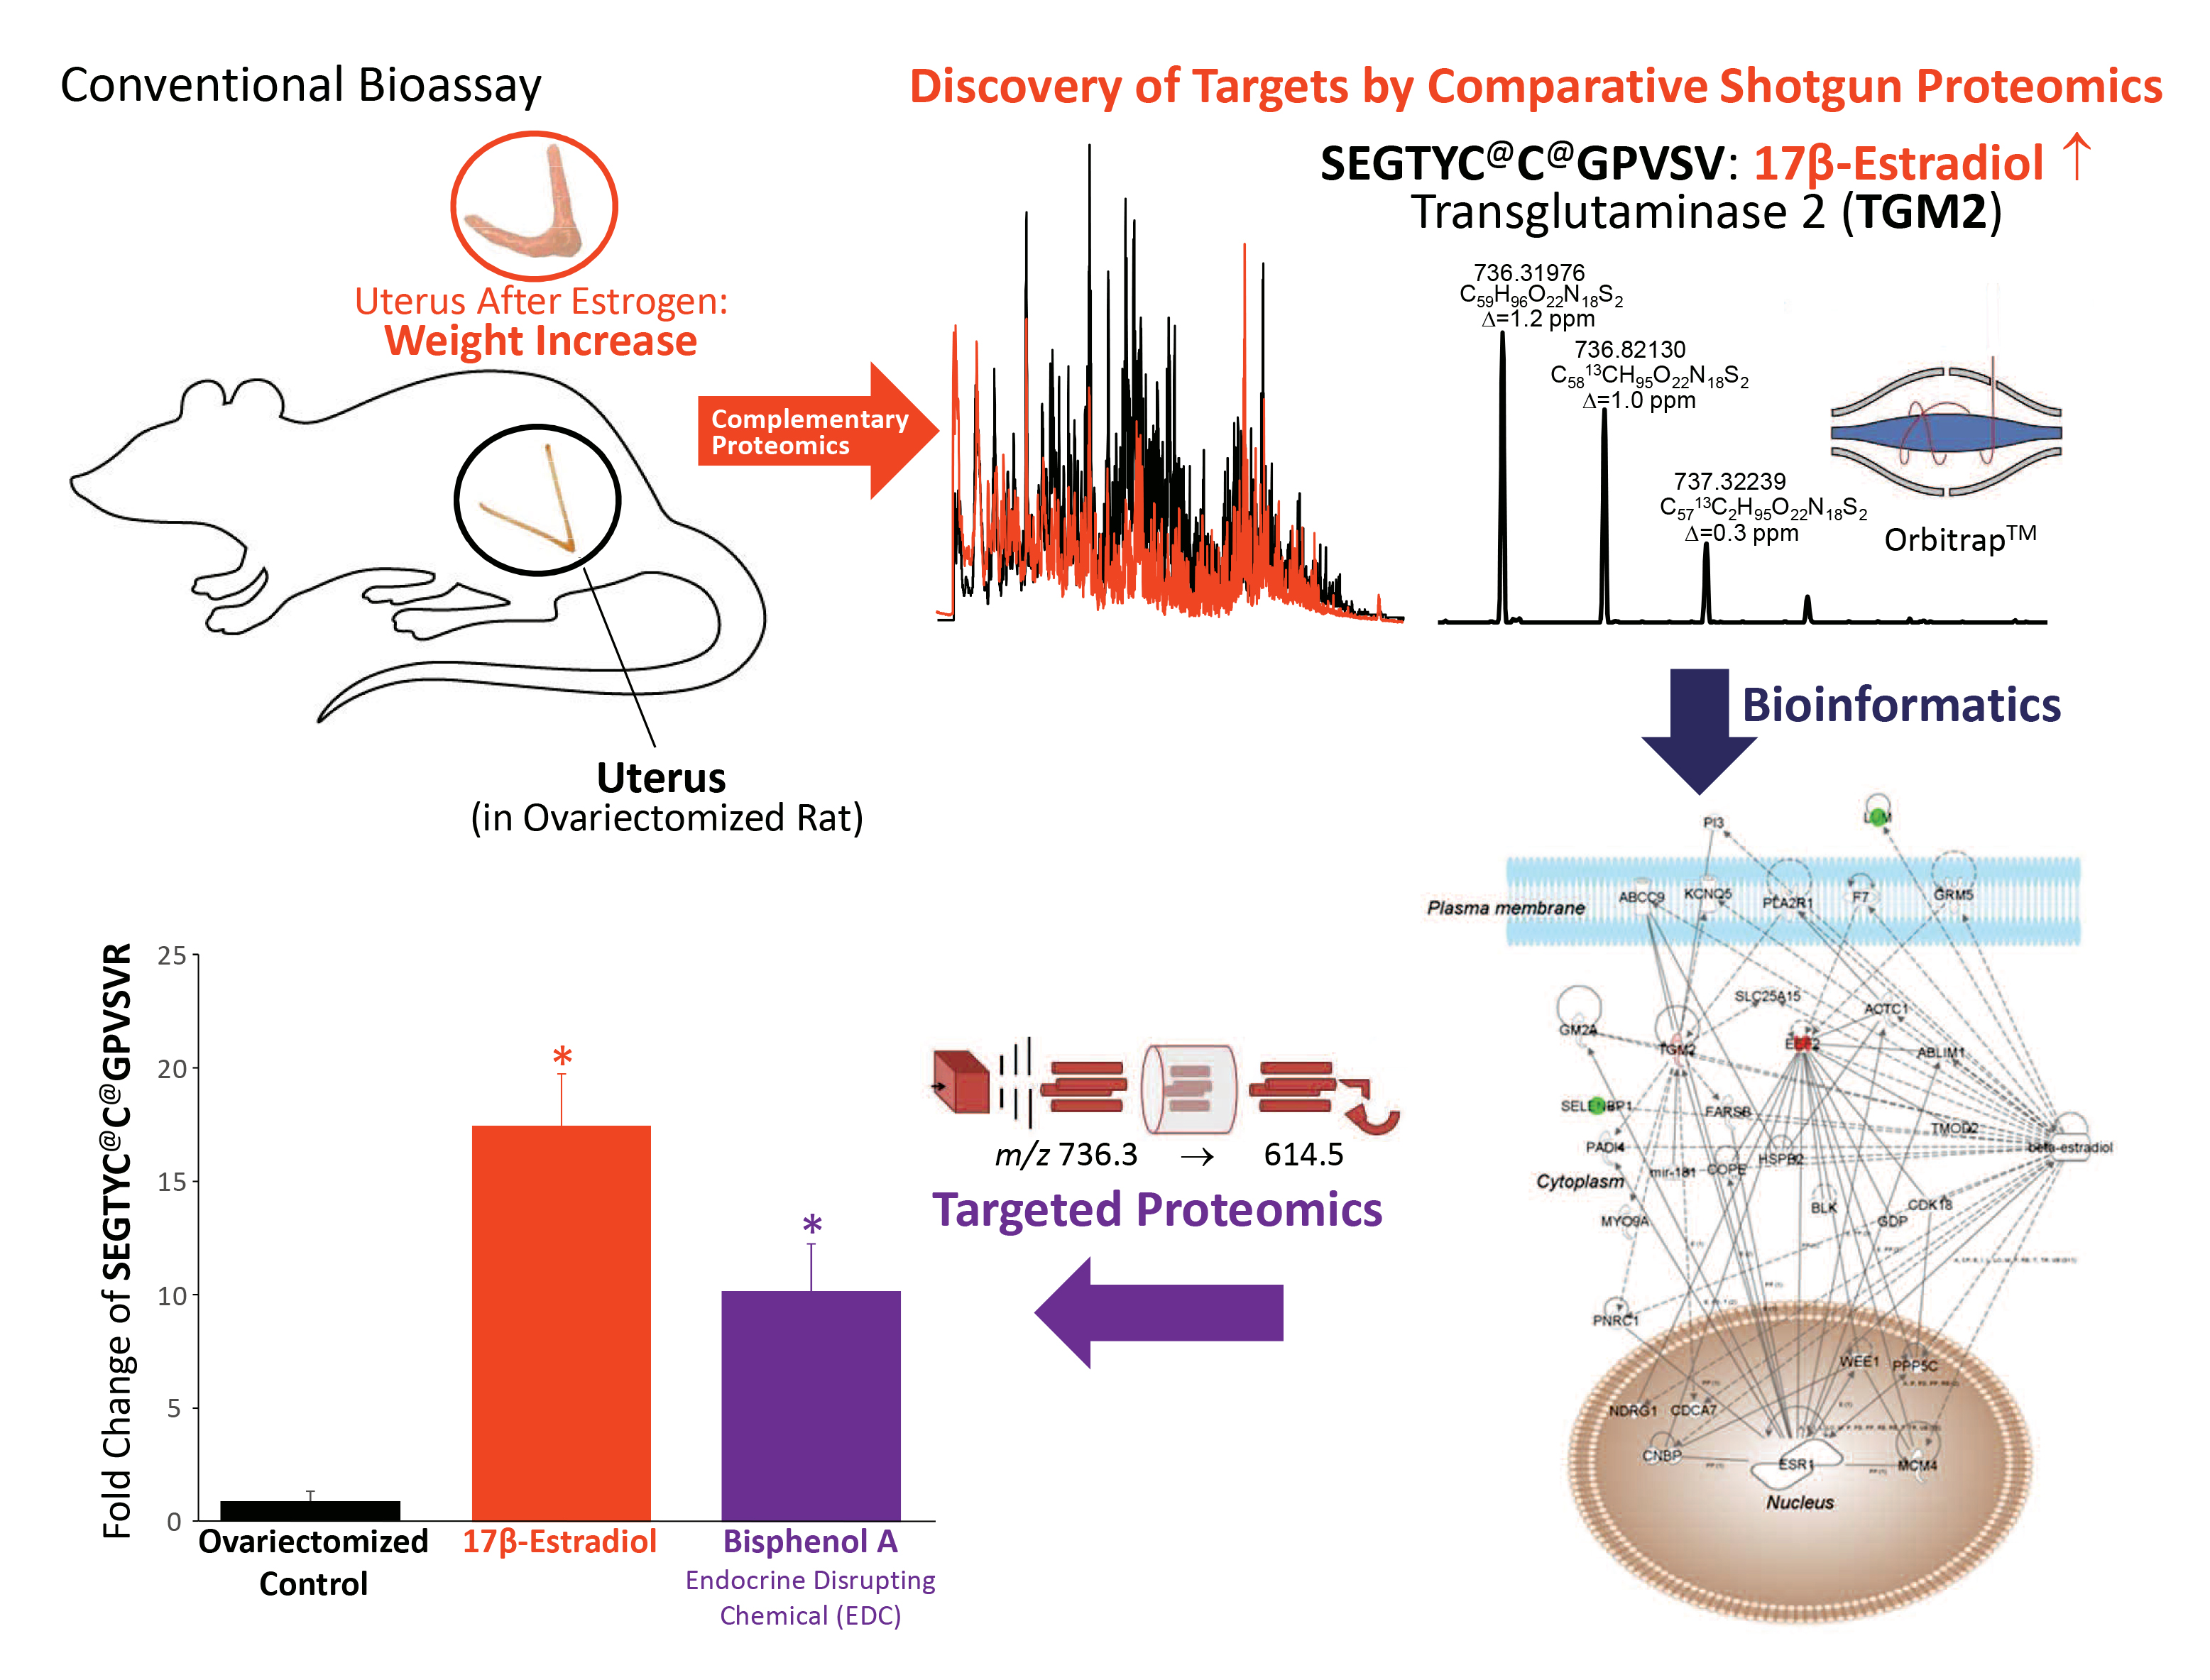
| SEGTYCCGPVSVR | 17.5 ± 2.3 | 10.2 ± 2.1 | |
| Elongation factor 2 (EEF2) | EGIPALDNFLDKL | 3.9 ± 0.3 | 3.2 ± 0.3 |
| TFCQLILDPIFK | 8.4 ± 1.1 | 6.5 ± 1.1 | |
| Selenium-binding protein 1 (SELENBP1) | HEIIQTLQMK | –2.2 ± 0.5 | –2.0 ± 0.2 |
| LILPSIISSR | –2.9 ± 0.1 | –2.3 ± 0.2 | |
| Lumican (LUM) | NNQIDHIDEK | –3.8 ± 0.8 | –6.3 ± 0.8 |
| SLEYLDLSFNQMSK | –2.0 ± 0.4 | –2.5 ± 0.1 |
Publisher’s Note: MDPI stays neutral with regard to jurisdictional claims in published maps and institutional affiliations. |
© 2021 by the authors. Licensee MDPI, Basel, Switzerland. This article is an open access article distributed under the terms and conditions of the Creative Commons Attribution (CC BY) license (http://creativecommons.org/licenses/by/4.0/).
Share and Cite
Prokai, L.; Rahlouni, F.; Zaman, K.; Nguyen, V.; Prokai-Tatrai, K. Proteomics Complementation of the Rat Uterotrophic Assay for Estrogenic Endocrine Disruptors: A Roadmap of Advancing High Resolution Mass Spectrometry-Based Shotgun Survey to Targeted Biomarker Quantifications. Int. J. Mol. Sci. 2021, 22, 1686. https://0-doi-org.brum.beds.ac.uk/10.3390/ijms22041686
Prokai L, Rahlouni F, Zaman K, Nguyen V, Prokai-Tatrai K. Proteomics Complementation of the Rat Uterotrophic Assay for Estrogenic Endocrine Disruptors: A Roadmap of Advancing High Resolution Mass Spectrometry-Based Shotgun Survey to Targeted Biomarker Quantifications. International Journal of Molecular Sciences. 2021; 22(4):1686. https://0-doi-org.brum.beds.ac.uk/10.3390/ijms22041686
Chicago/Turabian StyleProkai, Laszlo, Fatima Rahlouni, Khadiza Zaman, Vien Nguyen, and Katalin Prokai-Tatrai. 2021. "Proteomics Complementation of the Rat Uterotrophic Assay for Estrogenic Endocrine Disruptors: A Roadmap of Advancing High Resolution Mass Spectrometry-Based Shotgun Survey to Targeted Biomarker Quantifications" International Journal of Molecular Sciences 22, no. 4: 1686. https://0-doi-org.brum.beds.ac.uk/10.3390/ijms22041686