
Current and Prospective Methods for Assessing Anti-Tumor Immunity in Colorectal Cancer

 ,
,  , ,
, ,  , and
, and 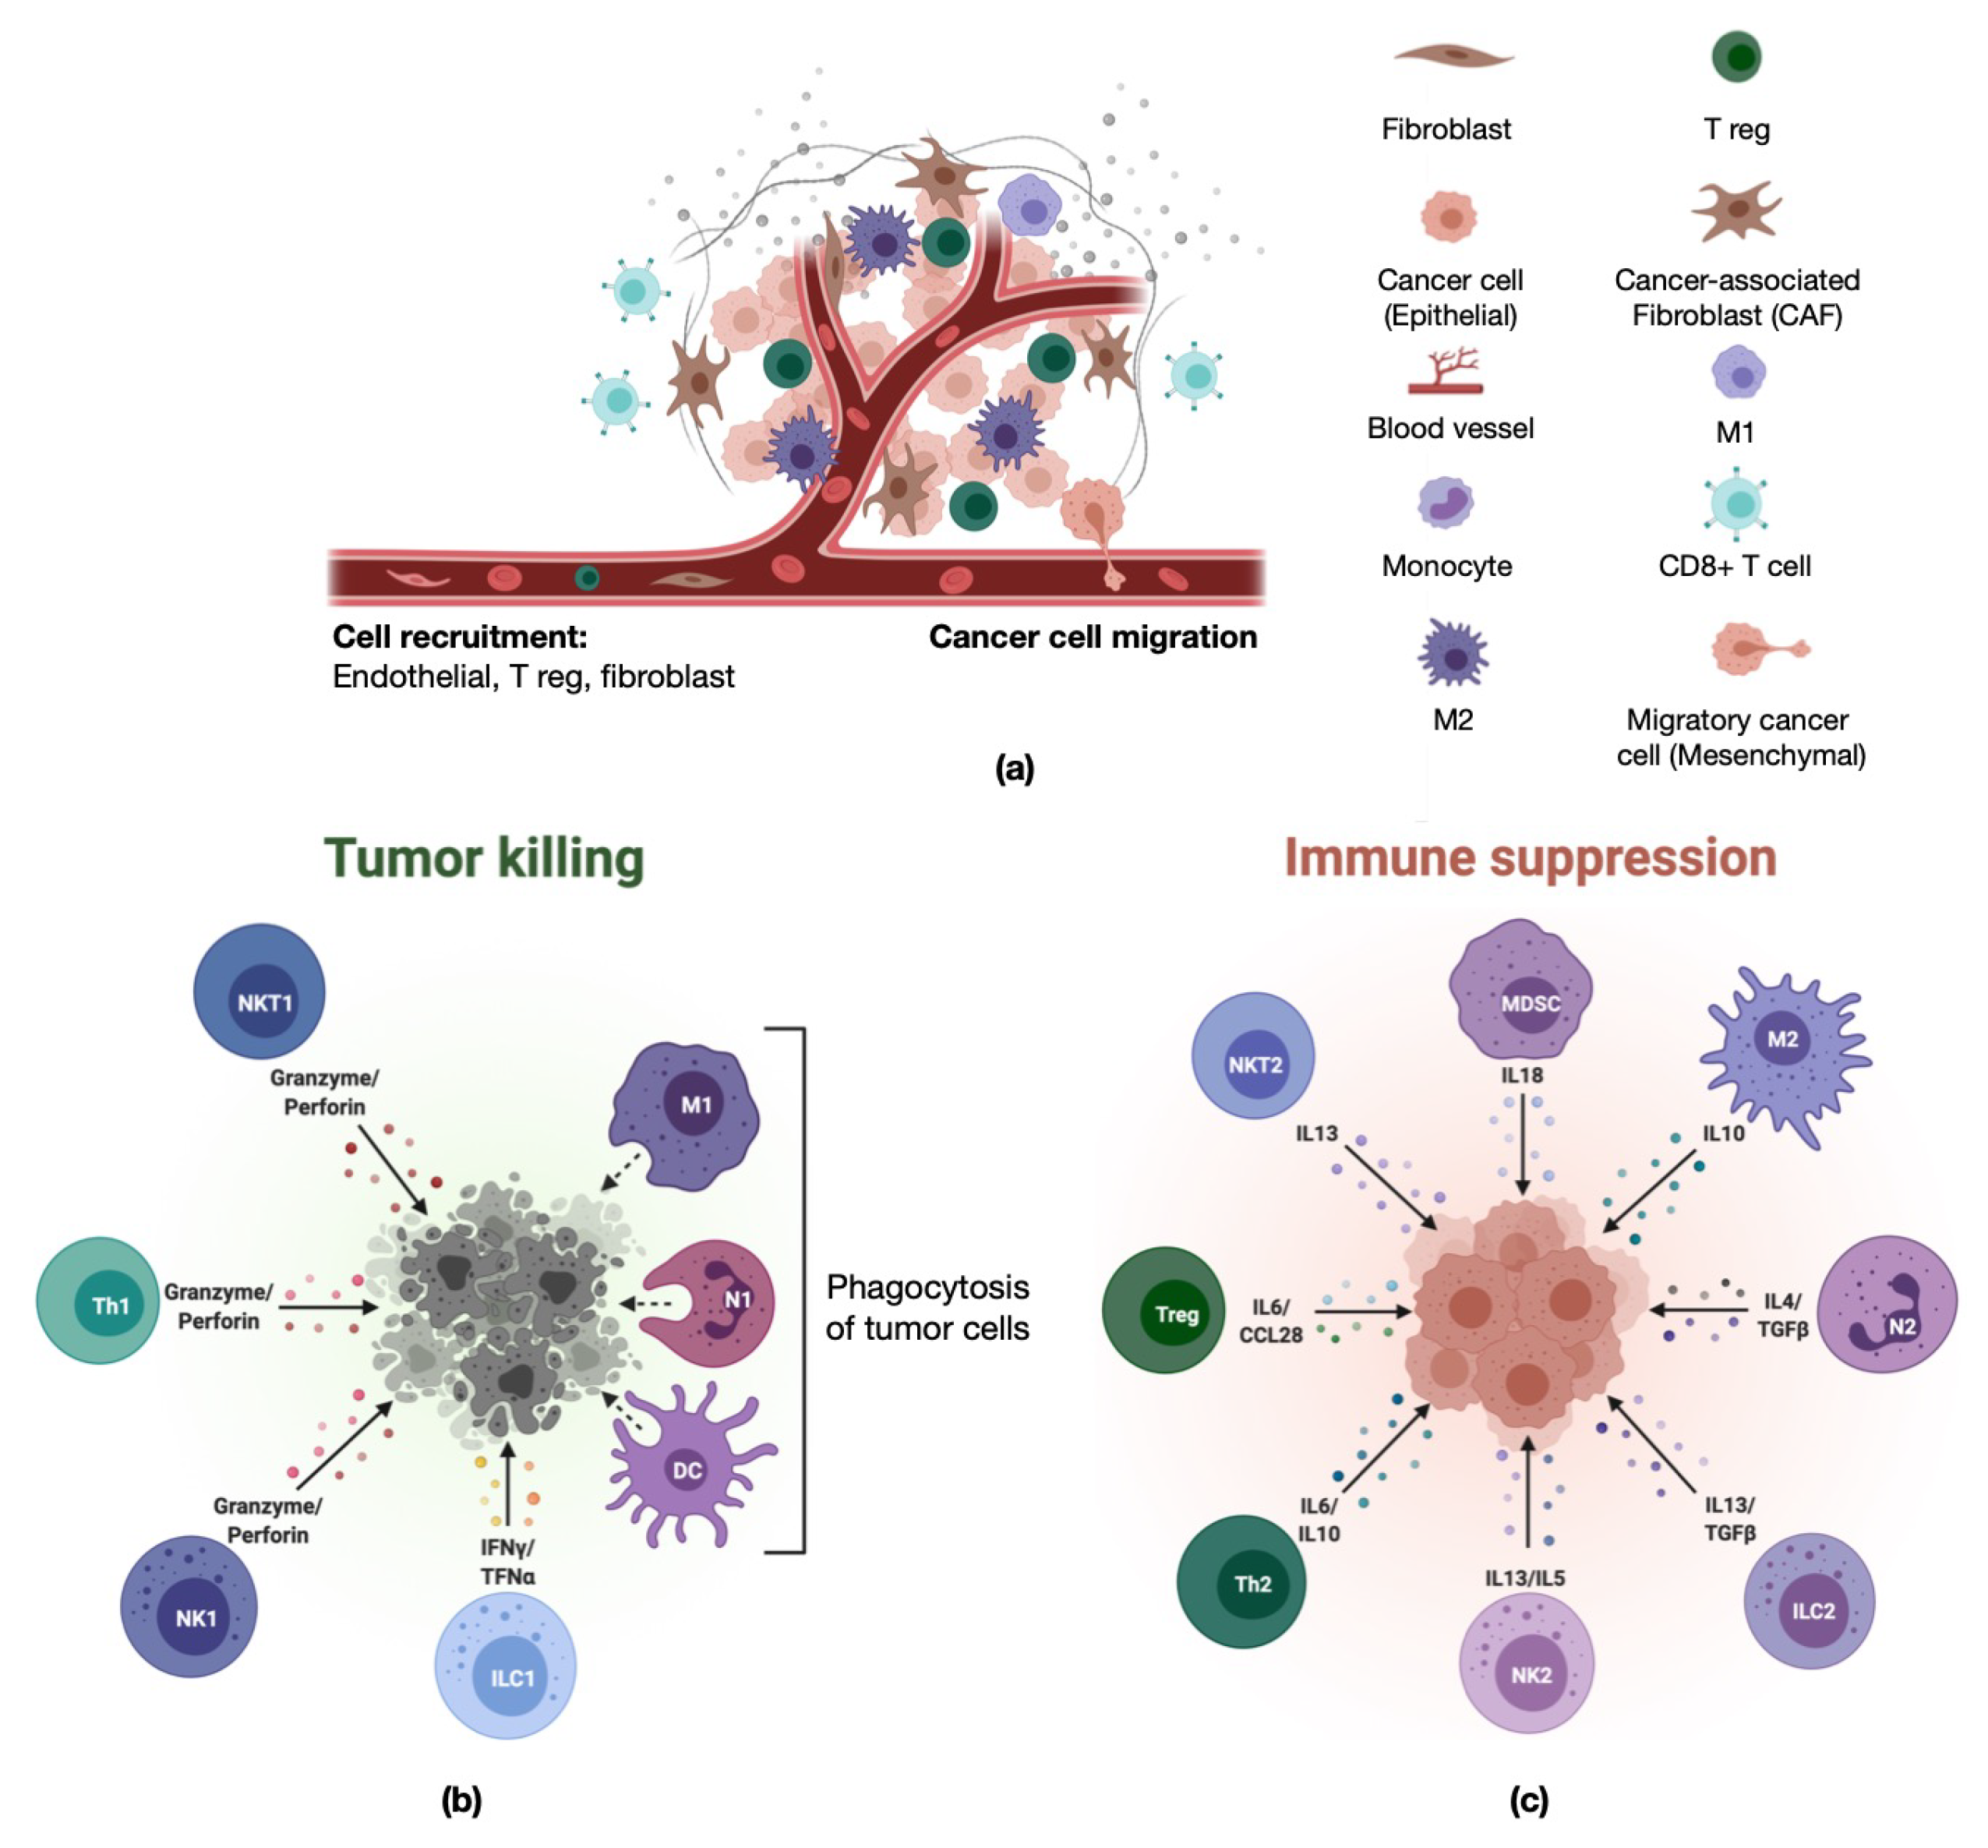
Abstract
:1. Introduction
2. Conventional Methods of Immune Contexture Estimation in CRC
2.1. Histology-Based Methods
2.2. Cytometry-Based Methods
3. Transcriptome Analysis Using Next-Generation Sequencing
4. Analysis of TME on Single-Cell Level
4.1. Single-Cell Transcriptomic, Genomic, and Proteomic Analysis
4.2. Single-Cell ATAC-seq
4.3. Spatial Transcriptomics
5. Conclusions
Author Contributions
Funding
Informed Consent Statement
Conflicts of Interest
References
- Siegel, R.L.; Miller, K.D.; Sauer, A.G.; Fedewa, S.A.; Butterly, L.F.; Anderson, J.C.; Cercek, A.; Smith, R.A.; Jemal, A. Colorectal cancer statistics, 2020. CA Cancer J. Clin. 2020, 70, 145–164. [Google Scholar] [CrossRef] [Green Version]
- Bray, F.; Ferlay, J.; Soerjomataram, I.; Siegel, R.L.; Torre, L.A.; Jemal, A. Global cancer statistics 2018: GLOBOCAN estimates of incidence and mortality worldwide for 36 cancers in 185 countries. CA Cancer J. Clin. 2018, 68, 394–424. [Google Scholar] [CrossRef] [Green Version]
- Gong, J.; Chehrazi-Raffle, A.; Reddi, S.; Salgia, R. Development of PD-1 and PD-L1 inhibitors as a form of cancer immunotherapy: A comprehensive review of registration trials and future considerations. J. Immunother. Cancer 2018, 6, 8. [Google Scholar] [CrossRef] [PubMed]
- Le, D.T.; Durham, J.N.; Smith, K.N.; Wang, H.; Bartlett, B.R.; Aulakh, L.K.; Lu, S.; Kemberling, H.; Wilt, C.; Luber, B.S.; et al. Mismatch repair deficiency predicts response of solid tumors to PD-1 blockade. Science 2017, 357, 409–413. [Google Scholar] [CrossRef] [Green Version]
- Overman, M.J.; Lonardi, S.; Wong, K.Y.M.; Lenz, H.J.; Gelsomino, F.; Aglietta, M.; Morse, M.A.; Van Cutsem, E.; McDermott, R.; Hill, A.; et al. Durable Clinical Benefit with Nivolumab Plus Ipilimumab in DNA Mismatch Repair—Deficient/Microsatellite Instability–High Metastatic Colorectal Cancer. J. Clin. Oncol. 2018, 36, 773–779. [Google Scholar] [CrossRef]
- Shen, Y.; Guan, Y.; Hummel, J.J.; Shyu, C.R.; Mitchem, J.B. Immunogenomic pathways associated with cytotoxic lymphocyte infiltration and survival in colorectal cancer. BMC Cancer 2020, 20, 124. [Google Scholar] [CrossRef] [PubMed]
- Galon, J.; Angell, H.K.; Bedognetti, D.; Marincola, F.M. The Continuum of Cancer Immunosurveillance: Prognostic, Predictive, and Mechanistic Signatures. Immunity 2013, 39, 11–26. [Google Scholar] [CrossRef] [PubMed] [Green Version]
- Grivennikov, S.I.; Greten, F.R.; Karin, M. Immunity, Inflammation, and Cancer. Cell 2010, 140, 883–899. [Google Scholar] [CrossRef] [PubMed] [Green Version]
- Palucka, A.K.; Coussens, L.M. The Basis of Oncoimmunology. Cell 2016, 164, 1233–1247. [Google Scholar] [CrossRef] [Green Version]
- Schreiber, R.D.; Old, L.J.; Smyth, M.J. Cancer immunoediting: Integrating immunity’s roles in cancer suppression and promotion. Science 2011, 331, 1565–1570. [Google Scholar] [CrossRef] [Green Version]
- Chevrier, S.; Levine, J.H.; Zanotelli, V.R.T.; Silina, K.; Schulz, D.; Bacac, M.; Ries, C.H.; Ailles, L.; Jewett, M.A.S.; Moch, H.; et al. An Immune Atlas of Clear Cell Renal Cell Carcinoma. Cell 2017, 169, 736–749.e18. [Google Scholar] [CrossRef] [PubMed] [Green Version]
- Lavin, Y.; Kobayashi, S.; Leader, A.; David Amir, E.A.; Elefant, N.; Bigenwald, C.; Remark, R.; Sweeney, R.; Becker, C.D.; Levine, J.H.; et al. Innate Immune Landscape in Early Lung Adenocarcinoma by Paired Single-Cell Analyses. Cell 2017, 169, 750–765.e17. [Google Scholar] [CrossRef] [PubMed] [Green Version]
- Losic, B.; Craig, A.J.; Villacorta-Martin, C.; Martins-Filho, S.N.; Akers, N.; Chen, X.; Ahsen, M.E.; von Felden, J.; Labgaa, I.; D’Avola, D.; et al. Intratumoral heterogeneity and clonal evolution in liver cancer. Nat. Commun. 2020, 11, 1–5. [Google Scholar] [CrossRef] [PubMed]
- Zhang, L.; Yu, X.; Zheng, L.; Zhang, Y.; Li, Y.; Fang, Q.; Gao, R.; Kang, B.; Zhang, Q.; Huang, J.Y.; et al. Lineage tracking reveals dynamic relationships of T cells in colorectal cancer. Nature 2018, 564, 268–272. [Google Scholar] [CrossRef] [PubMed]
- Zhang, Y.; Zhang, Z. The history and advances in cancer immunotherapy: Understanding the characteristics of tumor-infiltrating immune cells and their therapeutic implications. Cell. Mol. Immunol. 2020, 17, 807–821. [Google Scholar] [CrossRef]
- Otegbeye, E.E.; Mitchem, J.B.; Park, H.; Chaudhuri, A.A.; Kim, H.; Mutch, M.G.; Ciorba, M.A. Immunity, Immunotherapy, and Rectal Cancer: A Clinical and Translational Science Review; Elsevier: Amsterdam, The Netherlands, 2020. [Google Scholar] [CrossRef]
- Dai, W.; Zhou, F.; Tang, D.; Lin, L.; Zou, C.; Tan, W.; Dai, Y. Single-cell transcriptional profiling reveals the heterogenicity in colorectal cancer. Medicine 2019, 98, e16916. [Google Scholar] [CrossRef]
- Li, H.; Courtois, E.T.; Sengupta, D.; Tan, Y.; Chen, K.H.; Goh, J.J.L.; Kong, S.L.; Chua, C.; Hon, L.K.; Tan, W.S.; et al. Reference component analysis of single-cell transcriptomes elucidates cellular heterogeneity in human colorectal tumors. Nat. Genet. 2017, 49, 708–718. [Google Scholar] [CrossRef] [PubMed]
- Tieng, F.Y.F.; Baharudin, R.; Abu, N.; Mohd Yunos, R.I.; Lee, L.H.; Ab Mutalib, N.S. Single Cell Transcriptome in Colorectal Cancer—Current Updates on Its Application in Metastasis, Chemoresistance and the Roles of Circulating Tumor Cells. Front. Pharmacol. 2020, 11, 135. [Google Scholar] [CrossRef] [Green Version]
- Adapted from “The Tumor Microenvironment: Overview of Cancer-Associated Changes”, by BioRender.com. 2021. Available online: https://app.biorender.com/biorender-templates (accessed on 27 April 2021).
- Adapted from “Pro- and Anti-Tumor Immune Cells in the Tumor Microenvironment”, by BioRender.com. 2021. Available online: https://app.biorender.com/biorender-templates (accessed on 27 April 2021).
- Jass, J.R. Lymphocytic infiltration and survival in rectal cancer. J. Clin. Pathol. 1986, 39, 585. [Google Scholar] [CrossRef] [PubMed]
- Klintrup, K.; Mäkinen, J.M.; Kauppila, S.; Väre, P.O.; Melkko, J.; Tuominen, H.; Tuppurainen, K.; Mäkelä, J.; Karttunen, T.J.; Mäkinen, M.J. Inflammation and prognosis in colorectal cancer. Eur. J. Cancer 2005, 41, 2645–2654. [Google Scholar] [CrossRef]
- Roxburgh, C.S.D.; Salmond, J.M.; Horgan, P.G.; Oien, K.A.; McMillan, D.C. Tumour inflammatory infiltrate predicts survival following curative resection for node-negative colorectal cancer. Eur. J. Cancer 2009, 45, 2138–2145. [Google Scholar] [CrossRef] [Green Version]
- Väyrynen, J.P.; Tuomisto, A.; Klintrup, K.; Mäkelä, J.; Karttunen, T.J.; Mäkinen, M.J. Detailed analysis of inflammatory cell infiltration in colorectal cancer. Br. J. Cancer 2013, 109, 1839–1847. [Google Scholar] [CrossRef] [PubMed] [Green Version]
- Galon, J.; Costes, A.; Sanchez-Cabo, F.; Kirilovsky, A.; Mlecnik, B.; Lagorce-Pagès, C.; Tosolini, M.; Camus, M.; Berger, A.; Wind, P.; et al. Type, Density, and Location of Immune Cells Within Human Colorectal Tumors Predict Clinical Outcome. Science 2006, 313, 1960–1964. [Google Scholar] [CrossRef] [Green Version]
- Pagès, F.; Berger, A.; Camus, M.; Sanchez-Cabo, F.; Costes, A.; Molidor, R.; Mlecnik, B.; Kirilovsky, A.; Nilsson, M.; Damotte, D.; et al. Effector Memory T Cells, Early Metastasis, and Survival in Colorectal Cancer. N. Engl. J. Med. 2005, 353, 2654–2666. [Google Scholar] [CrossRef] [PubMed]
- Angell, H.K.; Bruni, D.; Barrett, J.C.; Herbst, R.; Galon, J. The Immunoscore: Colon Cancer and Beyond. Clin. Cancer Res. 2020, 26, 332–339. [Google Scholar] [CrossRef] [PubMed] [Green Version]
- Im, K.; Mareninov, S.; Diaz, M.F.P.; Yong, W.H. An Introduction to Performing Immunofluorescence Staining. In Biobanking: Methods and Protocols; Methods in Molecular Biology; Yong, W.H., Ed.; Springer: Berlin, Germany, 2019; pp. 299–311. [Google Scholar] [CrossRef]
- Cui, G.; Yuan, A.; Sun, Z.; Zheng, W.; Pang, Z. IL-1β/IL-6 network in the tumor microenvironment of human colorectal cancer. Pathol. Res. Pr. 2018, 214, 986–992. [Google Scholar] [CrossRef]
- Tan, M.C.B.; Goedegebuure, P.S.; Belt, B.A.; Flaherty, B.; Sankpal, N.; Gillanders, W.E.; Eberlein, T.J.; Hsieh, C.S.; Linehan, D.C. Disruption of CCR5-Dependent Homing of Regulatory T Cells Inhibits Tumor Growth in a Murine Model of Pancreatic Cancer. J. Immunol. 2009, 182, 1746–1755. [Google Scholar] [CrossRef]
- DeNardo, D.G.; Brennan, D.J.; Rexhepaj, E.; Ruffell, B.; Shiao, S.L.; Madden, S.F.; Gallagher, W.M.; Wadhwani, N.; Keil, S.D.; Junaid, S.A.; et al. Leukocyte Complexity Predicts Breast Cancer Survival and Functionally Regulates Response to Chemotherapy. Cancer Discov. 2011, 1, 54–67. [Google Scholar] [CrossRef] [Green Version]
- Jenkins, R.W.; Aref, A.R.; Lizotte, P.H.; Ivanova, E.; Stinson, S.; Zhou, C.W.; Bowden, M.; Deng, J.; Liu, H.; Miao, D.; et al. Ex Vivo Profiling of PD-1 Blockade Using Organotypic Tumor Spheroids. Cancer Discov. 2018, 8, 196–215. [Google Scholar] [CrossRef] [Green Version]
- Aref, A.R.; Campisi, M.; Ivanova, E.; Portell, A.; Larios, D.; Piel, B.P.; Mathur, N.; Zhou, C.; Coakley, R.V.; Bartels, A.; et al. 3D microfluidic ex vivo culture of organotypic tumor spheroids to model immune checkpoint blockade. Lab Chip 2018, 18, 3129–3143. [Google Scholar] [CrossRef] [Green Version]
- Stack, E.C.; Wang, C.; Roman, K.A.; Hoyt, C.C. Multiplexed immunohistochemistry, imaging, and quantitation: A review, with an assessment of Tyramide signal amplification, multispectral imaging and multiplex analysis. Methods 2014, 70, 46–58. [Google Scholar] [CrossRef] [PubMed]
- Ilié, M.; Beaulande, M.; Ben Hadj, S.; Chamorey, E.; Schiappa, R.; Long-Mira, E.; Lassalle, S.; Butori, C.; Cohen, C.; Leroy, S.; et al. Chromogenic Multiplex Immunohistochemistry Reveals Modulation of the Immune Microenvironment Associated with Survival in Elderly Patients with Lung Adenocarcinoma. Cancers 2018, 10, 326. [Google Scholar] [CrossRef] [PubMed] [Green Version]
- Remark, R.; Merghoub, T.; Grabe, N.; Litjens, G.; Damotte, D.; Wolchok, J.D.; Merad, M.; Gnjatic, S. In-depth tissue profiling using multiplexed immunohistochemical consecutive staining on single slide. Sci. Immunol. 2016, 1, aaf6925. [Google Scholar] [CrossRef] [PubMed]
- Tan, W.C.C.; Nerurkar, S.N.; Cai, H.Y.; Ng, H.H.M.; Wu, D.; Wee, Y.T.F.; Lim, J.C.T.; Yeong, J.; Lim, T.K.H. Overview of multiplex immunohistochemistry/immunofluorescence techniques in the era of cancer immunotherapy. Cancer Commun. 2020, 40, 135–153. [Google Scholar] [CrossRef] [PubMed] [Green Version]
- Lu, S.; Stein, J.E.; Rimm, D.L.; Wang, D.W.; Bell, J.M.; Johnson, D.B.; Sosman, J.A.; Schalper, K.A.; Anders, R.A.; Wang, H.; et al. Comparison of Biomarker Modalities for Predicting Response to PD-1/PD-L1 Checkpoint Blockade: A Systematic Review and Meta-analysis. JAMA Oncol. 2019, 5, 1195–1204. [Google Scholar] [CrossRef]
- Gunnarsson, U.; Strigård, K.; Edin, S.; Gkekas, I.; Mustonen, H.; Kaprio, T.; Böckelman, C.; Hagström, J.; Palmqvist, R.; Haglund, C. Association between local immune cell infiltration, mismatch repair status and systemic inflammatory response in colorectal cancer. J. Transl. Med. 2020, 18, 178. [Google Scholar] [CrossRef] [Green Version]
- Lazarus, J.; Oneka, M.D.; Barua, S.; Maj, T.; Lanfranca, M.P.; Delrosario, L.; Sun, L.; Smith, J.J.; D’Angelica, M.I.; Shia, J.; et al. Mathematical Modeling of the Metastatic Colorectal Cancer Microenvironment Defines the Importance of Cytotoxic Lymphocyte Infiltration and Presence of PD-L1 on Antigen Presenting Cells. Ann. Surg. Oncol. 2019, 26, 2821–2830. [Google Scholar] [CrossRef]
- Lopes, N.; Bergsland, C.H.; Bjørnslett, M.; Pellinen, T.; Svindland, A.; Nesbakken, A.; Almeida, R.; Lothe, R.A.; David, L.; Bruun, J. Digital image analysis of multiplex fluorescence IHC in colorectal cancer recognizes the prognostic value of CDX2 and its negative correlation with SOX2. Lab. Investig. 2020, 100, 120–134. [Google Scholar] [CrossRef] [Green Version]
- Pivetta, E.; Capuano, A.; Scanziani, E.; Minoli, L.; Andreuzzi, E.; Mongiat, M.; Baldassarre, G.; Doliana, R.; Spessotto, P. Multiplex staining depicts the immune infiltrate in colitis-induced colon cancer model. Sci. Rep. 2019, 9, 12645. [Google Scholar] [CrossRef]
- Yang, L.; Liu, Z.; Tan, J.; Dong, H.; Zhang, X. Multispectral imaging reveals hyper active TGF-β signaling in colorectal cancer. Cancer Biol. Ther. 2018, 19, 105–112. [Google Scholar] [CrossRef] [Green Version]
- Picot, J.; Guerin, C.L.; Le Van Kim, C.; Boulanger, C.M. Flow cytometry: Retrospective, fundamentals and recent instrumentation. Cytotechnology 2012, 64, 109–130. [Google Scholar] [CrossRef] [Green Version]
- Shapiro, H.M. Practical Flow Cytometry; Google-Books-ID: JhSyimPKuJwC; John Wiley & Sons: Hoboken, NJ, USA, 2005. [Google Scholar]
- Chen, B.; Alvarado, D.M.; Iticovici, M.; Kau, N.S.; Park, H.; Parikh, P.J.; Thotala, D.; Ciorba, M.A. Interferon-Induced IDO1 Mediates Radiation Resistance and Is a Therapeutic Target in Colorectal Cancer. Cancer Immunol. Res. 2020, 8, 451–464. [Google Scholar] [CrossRef] [PubMed] [Green Version]
- Sanford, D.E.; Belt, B.A.; Panni, R.Z.; Mayer, A.; Deshpande, A.D.; Carpenter, D.; Mitchem, J.B.; Plambeck-Suess, S.M.; Worley, L.A.; Goetz, B.D.; et al. Inflammatory Monocyte Mobilization Decreases Patient Survival in Pancreatic Cancer: A Role for Targeting the CCL2/CCR2 Axis. Clin. Cancer Res. 2013, 19, 3404–3415. [Google Scholar] [CrossRef] [PubMed] [Green Version]
- Scurr, M.; Ladell, K.; Besneux, M.; Christian, A.; Hockey, T.; Smart, K.; Bridgeman, H.; Hargest, R.; Phillips, S.; Davies, M.; et al. Highly prevalent colorectal cancer-infiltrating LAP+ Foxp3-T cells exhibit more potent immunosuppressive activity than Foxp3+ regulatory T cells. Mucosal Immunol. 2014, 7, 428–439. [Google Scholar] [CrossRef] [PubMed]
- Girardin, A.; McCall, J.; Black, M.A.; Edwards, F.; Phillips, V.; Taylor, E.S.; Reeve, A.E.; Kemp, R.A. Inflammatory and regulatory T cells contribute to a unique immune microenvironment in tumor tissue of colorectal cancer patients. Int. J. Cancer 2012, 132, 1842–1850. [Google Scholar] [CrossRef] [PubMed]
- Taylor, E.S.; McCall, J.L.; Girardin, A.; Munro, F.M.; Black, M.A.; Kemp, R.A. Functional impairment of infiltrating T cells in human colorectal cancer. OncoImmunology 2016, 5, e1234573. [Google Scholar] [CrossRef] [Green Version]
- Saleh, R.; Sasidharan Nair, V.; Al-Dhaheri, M.; Khawar, M.; Abu Nada, M.; Alajez, N.M.; Elkord, E. RNA-Seq Analysis of Colorectal Tumor-Infiltrating Myeloid-Derived Suppressor Cell Subsets Revealed Gene Signatures of Poor Prognosis. Front. Oncol. 2020, 10, 2463. [Google Scholar] [CrossRef] [PubMed]
- Bjornson, Z.B.; Nolan, G.P.; Fantl, W.J. Single Cell Mass Cytometry for Analysis of Immune System Functional States. Curr. Opin. Immunol. 2013, 25, 484–494. [Google Scholar] [CrossRef] [Green Version]
- Zhang, T.; Lv, J.; Tan, Z.; Wang, B.; Warden, A.R.; Li, Y.; Jiang, H.; Li, H.; Ding, X. Immunocyte Profiling Using Single-Cell Mass Cytometry Reveals EpCAM+ CD4+ T Cells Abnormal in Colon Cancer. Front. Immunol. 2019, 10, 1571. [Google Scholar] [CrossRef]
- Beyrend, G.; Gracht, E.v.d.; Yilmaz, A.; Duikeren, S.v.; Camps, M.; Höllt, T.; Vilanova, A.; Unen, V.v.; Koning, F.; Miranda, N.F.C.C.d.; et al. PD-L1 blockade engages tumor-infiltrating lymphocytes to co-express targetable activating and inhibitory receptors. J. Immunother. Cancer 2019, 7, 217. [Google Scholar] [CrossRef]
- Mitsialis, V.; Wall, S.; Liu, P.; Ordovas-Montanes, J.; Parmet, T.; Vukovic, M.; Spencer, D.; Field, M.; McCourt, C.; Toothaker, J.; et al. Single-Cell Analyses of Colon and Blood Reveal Distinct Immune Cell Signatures of Ulcerative Colitis and Crohn’s Disease. Gastroenterology 2020, 159, 591–608.e10. [Google Scholar] [CrossRef]
- Weinstein, J.N.; Collisson, E.A.; Mills, G.B.; Shaw, K.R.M.; Ozenberger, B.A.; Ellrott, K.; Shmulevich, I.; Sander, C.; Stuart, J.M. The Cancer Genome Atlas Pan-Cancer analysis project. Nat. Genet. 2013, 45, 1113–1120. [Google Scholar] [CrossRef] [PubMed]
- Muzny, D.M.; Bainbridge, M.N.; Chang, K.; Dinh, H.H.; Drummond, J.A.; Fowler, G.; Kovar, C.L.; Lewis, L.R.; Morgan, M.B.; Newsham, I.F.; et al. Comprehensive molecular characterization of human colon and rectal cancer. Nature 2012, 487, 330–337. [Google Scholar] [CrossRef] [Green Version]
- Fakih, M.; Ouyang, C.; Wang, C.; Tu, T.Y.; Gozo, M.C.; Cho, M.; Sy, M.; Longmate, J.A.; Lee, P.P. Immune overdrive signature in colorectal tumor subset predicts poor clinical outcome. J. Clin. Investig. 2019, 129, 4464–4476. [Google Scholar] [CrossRef] [PubMed]
- Liu, J.; Lichtenberg, T.; Hoadley, K.A.; Poisson, L.M.; Lazar, A.J.; Cherniack, A.D.; Kovatich, A.J.; Benz, C.C.; Levine, D.A.; Lee, A.V.; et al. An Integrated TCGA Pan-Cancer Clinical Data Resource to Drive High-Quality Survival Outcome Analytics. Cell 2018, 173, 400–416.e11. [Google Scholar] [CrossRef] [PubMed] [Green Version]
- Venet, D.; Pecasse, F.; Maenhaut, C.; Bersini, H. Separation of samples into their constituents using gene expression data. Bioinformatics 2001, 17, S279–S287. [Google Scholar] [CrossRef] [PubMed]
- Bindea, G.; Mlecnik, B.; Tosolini, M.; Kirilovsky, A.; Waldner, M.; Obenauf, A.; Angell, H.; Fredriksen, T.; Lafontaine, L.; Berger, A.; et al. Spatiotemporal Dynamics of Intratumoral Immune Cells Reveal the Immune Landscape in Human Cancer. Immunity 2013, 39, 782–795. [Google Scholar] [CrossRef] [PubMed] [Green Version]
- Şenbabaoğlu, Y.; Gejman, R.S.; Winer, A.G.; Liu, M.; Van Allen, E.M.; de Velasco, G.; Miao, D.; Ostrovnaya, I.; Drill, E.; Luna, A.; et al. Tumor immune microenvironment characterization in clear cell renal cell carcinoma identifies prognostic and immunotherapeutically relevant messenger RNA signatures. Genome Biol. 2016, 17, 231. [Google Scholar] [CrossRef] [Green Version]
- Angelova, M.; Charoentong, P.; Hackl, H.; Fischer, M.L.; Snajder, R.; Krogsdam, A.M.; Waldner, M.J.; Bindea, G.; Mlecnik, B.; Galon, J.; et al. Characterization of the immunophenotypes and antigenomes of colorectal cancers reveals distinct tumor escape mechanisms and novel targets for immunotherapy. Genome Biol. Genome Biol. 2015, 16, 1–7. [Google Scholar] [CrossRef] [PubMed]
- Charoentong, P.; Finotello, F.; Angelova, M.; Mayer, C.; Efremova, M.; Rieder, D.; Hackl, H.; Trajanoski, Z. Pan-cancer Immunogenomic Analyses Reveal Genotype-Immunophenotype Relationships and Predictors of Response to Checkpoint Blockade. Cell Rep. 2017, 18, 248–262. [Google Scholar] [CrossRef] [Green Version]
- Yoshihara, K.; Shahmoradgoli, M.; Martínez, E.; Vegesna, R.; Kim, H.; Torres-Garcia, W.; Treviño, V.; Shen, H.; Laird, P.W.; Levine, D.A.; et al. Inferring tumour purity and stromal and immune cell admixture from expression data. Nat. Commun. 2013, 4, 2612. [Google Scholar] [CrossRef]
- Liu, W.; Ye, H.; Liu, Y.F.; Xu, C.Q.; Zhong, Y.X.; Tian, T.; Ma, S.W.; Tao, H.; Li, L.; Xue, L.C.; et al. Transcriptome-derived stromal and immune scores infer clinical outcomes of patients with cancer. Oncol. Lett. 2018, 15, 4351–4357. [Google Scholar] [CrossRef] [PubMed] [Green Version]
- Aran, D.; Hu, Z.; Butte, A.J. xCell: Digitally portraying the tissue cellular heterogeneity landscape. Genome Biol. 2017, 18, 220. [Google Scholar] [CrossRef] [PubMed] [Green Version]
- Li, B.; Severson, E.; Pignon, J.C.; Zhao, H.; Li, T.; Novak, J.; Jiang, P.; Shen, H.; Aster, J.C.; Rodig, S.; et al. Comprehensive analyses of tumor immunity: Implications for cancer immunotherapy. Genome Biol. 2016, 17, 1–16. [Google Scholar] [CrossRef] [PubMed] [Green Version]
- Racle, J.; de Jonge, K.; Baumgaertner, P.; Speiser, D.E.; Gfeller, D. Simultaneous enumeration of cancer and immune cell types from bulk tumor gene expression data. eLife 2017, 6, e26476. [Google Scholar] [CrossRef] [PubMed]
- Tappeiner, E.; Finotello, F.; Charoentong, P.; Mayer, C.; Rieder, D.; Trajanoski, Z. TIminer: NGS data mining pipeline for cancer immunology and immunotherapy. Bioinformatics 2017, 33, 3140–3141. [Google Scholar] [CrossRef] [PubMed]
- Li, T.; Fan, J.; Wang, B.; Traugh, N.; Chen, Q.; Liu, J.S.; Li, B.; Liu, X.S. TIMER: A Web Server for Comprehensive Analysis of Tumor-Infiltrating Immune Cells. Cancer Res. 2017, 77, e108–e110. [Google Scholar] [CrossRef] [Green Version]
- Li, T.; Fu, J.; Zeng, Z.; Cohen, D.; Li, J.; Chen, Q.; Li, B.; Liu, X.S. TIMER2.0 for analysis of tumor-infiltrating immune cells. Nucleic Acids Res. 2020, 48, W509–W514. [Google Scholar] [CrossRef]
- Newman, A.M.; Liu, C.L.; Green, M.R.; Gentles, A.J.; Feng, W.; Xu, Y.; Hoang, C.D.; Diehn, M.; Alizadeh, A.A. Robust enumeration of cell subsets from tissue expression profiles. Nat. Methods 2015, 12, 453–457. [Google Scholar] [CrossRef] [Green Version]
- Zhao, X.; Liu, J.; Liu, S.; Yang, F.; Chen, E. Construction and Validation of an Immune-Related Prognostic Model Based on TP53 Status in Colorectal Cancer. Cancers 2019, 11, 1722. [Google Scholar] [CrossRef] [Green Version]
- Ye, L.; Zhang, T.; Kang, Z.; Guo, G.; Sun, Y.; Lin, K.; Huang, Q.; Shi, X.; Ni, Z.; Ding, N.; et al. Tumor-Infiltrating Immune Cells Act as a Marker for Prognosis in Colorectal Cancer. Front. Immunol. 2019, 10, 2368. [Google Scholar] [CrossRef] [Green Version]
- Petitprez, F.; Vano, Y.A.; Becht, E.; Giraldo, N.A.; de Reyniès, A.; Sautès-Fridman, C.; Fridman, W.H. Transcriptomic analysis of the tumor microenvironment to guide prognosis and immunotherapies. Cancer Immunol. Immunother. 2017, 67, 981–988. [Google Scholar] [CrossRef]
- Becht, E.; Giraldo, N.A.; Lacroix, L.; Buttard, B.; Elarouci, N.; Petitprez, F.; Selves, J.; Laurent-Puig, P.; Sautès-Fridman, C.; Fridman, W.H.; et al. Estimating the population abundance of tissue-infiltrating immune and stromal cell populations using gene expression. Genome Biol. 2016, 17, 218. [Google Scholar] [CrossRef] [PubMed]
- Becht, E.; Reyniès, A.d.; Giraldo, N.A.; Pilati, C.; Buttard, B.; Lacroix, L.; Selves, J.; Sautès-Fridman, C.; Laurent-Puig, P.; Fridman, W.H. Immune and Stromal Classification of Colorectal Cancer Is Associated with Molecular Subtypes and Relevant for Precision Immunotherapy. Clin. Cancer Res. 2016, 22, 4057–4066. [Google Scholar] [CrossRef] [Green Version]
- Sandberg, T.P.; Oosting, J.; van Pelt, G.W.; Mesker, W.E.; Tollenaar, R.A.E.M.; Morreau, H. Molecular profiling of colorectal tumors stratified by the histological tumor-stroma ratio—Increased expression of galectin-1 in tumors with high stromal content. Oncotarget 2018, 9, 31502–31515. [Google Scholar] [CrossRef]
- Soldevilla, B.; Carretero-Puche, C.; Gomez-Lopez, G.; Al-Shahrour, F.; Riesco, M.C.; Gil-Calderon, B.; Alvarez-Vallina, L.; Espinosa-Olarte, P.; Gomez-Esteves, G.; Rubio-Cuesta, B.; et al. The correlation between immune subtypes and consensus molecular subtypes in colorectal cancer identifies novel tumour microenvironment profiles, with prognostic and therapeutic implications. Eur. J. Cancer 2019, 123, 118–129. [Google Scholar] [CrossRef] [PubMed] [Green Version]
- Guinney, J.; Dienstmann, R.; Wang, X.; de Reyniès, A.; Schlicker, A.; Soneson, C.; Marisa, L.; Roepman, P.; Nyamundanda, G.; Angelino, P.; et al. The consensus molecular subtypes of colorectal cancer. Nat. Med. 2015, 21, 1350–1356. [Google Scholar] [CrossRef] [PubMed]
- Smeby, J.; Sveen, A.; Bergsland, C.H.; Eilertsen, I.A.; Danielsen, S.A.; Eide, P.W.; Hektoen, M.; Guren, M.G.; Nesbakken, A.; Bruun, J.; et al. Exploratory analyses of consensus molecular subtype-dependent associations of TP53 mutations with immunomodulation and prognosis in colorectal cancer. ESMO Open 2019, 4, e000523. [Google Scholar] [CrossRef] [PubMed] [Green Version]
- Greenbaum, D.; Colangelo, C.; Williams, K.; Gerstein, M. Comparing protein abundance and mRNA expression levels on a genomic scale. Genome Biol. 2003, 4, 117. [Google Scholar] [CrossRef] [Green Version]
- Buccitelli, C.; Selbach, M. mRNAs, proteins and the emerging principles of gene expression control. Nat. Rev. Genet. 2020, 21, 630–644. [Google Scholar] [CrossRef]
- Liu, Y.; Beyer, A.; Aebersold, R. On the Dependency of Cellular Protein Levels on mRNA Abundance. Cell 2016, 165, 535–550. [Google Scholar] [CrossRef] [Green Version]
- Yu, C.; Yu, J.; Yao, X.; Wu, W.K.; Lu, Y.; Tang, S.; Li, X.; Bao, L.; Li, X.; Hou, Y.; et al. Discovery of biclonal origin and a novel oncogene SLC12A5 in colon cancer by single-cell sequencing. Cell Res. 2014, 24, 701–712. [Google Scholar] [CrossRef] [Green Version]
- Dalerba, P.; Kalisky, T.; Sahoo, D.; Rajendran, P.S.; Rothenberg, M.E.; Leyrat, A.A.; Sim, S.; Okamoto, J.; Johnston, D.M.; Qian, D.; et al. Single-cell dissection of transcriptional heterogeneity in human colon tumors. Nat. Biotechnol. 2011, 29, 1120–1127. [Google Scholar] [CrossRef] [PubMed]
- Luecken, M.D.; Theis, F.J. Current best practices in single-cell RNA-seq analysis: A tutorial. Mol. Syst. Biol. 2019, 15, e8746. [Google Scholar] [CrossRef] [PubMed]
- Feng, C.; Liu, S.; Zhang, H.; Guan, R.; Li, D.; Zhou, F.; Liang, Y.; Feng, X. Dimension Reduction and Clustering Models for Single-Cell RNA Sequencing Data: A Comparative Study. Int. J. Mol. Sci. 2020, 21, 2181. [Google Scholar] [CrossRef] [PubMed] [Green Version]
- Abdelaal, T.; Michielsen, L.; Cats, D.; Hoogduin, D.; Mei, H.; Reinders, M.J.T.; Mahfouz, A. A comparison of automatic cell identification methods for single-cell RNA sequencing data. Genome Biol. 2019, 20, 194. [Google Scholar] [CrossRef] [Green Version]
- Emerson, R.O.; Sherwood, A.M.; Rieder, M.J.; Guenthoer, J.; Williamson, D.W.; Carlson, C.S.; Drescher, C.W.; Tewari, M.; Bielas, J.H.; Robins, H.S. High-throughput sequencing of T-cell receptors reveals a homogeneous repertoire of tumour-infiltrating lymphocytes in ovarian cancer. J. Pathol. 2013, 231, 433–440. [Google Scholar] [CrossRef] [Green Version]
- Davis, M.M.; Bjorkman, P.J. T-cell antigen receptor genes and T-cell recognition. Nat. Cell Biol. 1988, 334, 395–402. [Google Scholar] [CrossRef]
- Robins, H.S.; Campregher, P.V.; Srivastava, S.K.; Wacher, A.; Turtle, C.J.; Kahsai, O.; Riddell, S.R.; Warren, E.H.; Carlson, C.S. Comprehensive assessment of T-cell receptor β-chain diversity in αβ T cells. Blood 2009, 114, 4099–4107. [Google Scholar] [CrossRef]
- Ruggiero, E.; Nicolay, J.P.; Fronza, R.; Arens, A.; Paruzynski, A.; Nowrouzi, A.; Ürenden, G.; Lulay, C.; Schneider, S.; Goerdt, S.; et al. High-resolution analysis of the human T-cell receptor repertoire. Nat. Commun. 2015, 6, 8081. [Google Scholar] [CrossRef] [Green Version]
- Sherwood, A.M.; Emerson, R.O.; Scherer, D.; Habermann, N.; Buck, K.; Staffa, J.; Desmarais, C.; Halama, N.; Jaeger, D.; Schirmacher, P.; et al. Tumor-infiltrating lymphocytes in colorectal tumors display a diversity of T cell receptor sequences that differ from the T cells in adjacent mucosal tissue. Cancer Immunol. Immunother. 2013, 62, 1453–1461. [Google Scholar] [CrossRef] [Green Version]
- Redmond, D.; Poran, A.; Elemento, O. Single-cell TCRseq: Paired recovery of entire T-cell alpha and beta chain transcripts in T-cell receptors from single-cell RNAseq. Genome Med. 2016, 8, 80. [Google Scholar] [CrossRef] [PubMed] [Green Version]
- Stubbington, M.J.T.; Lönnberg, T.; Proserpio, V.; Clare, S.; Speak, A.O.; Dougan, G.; Teichmann, S.A. T cell fate and clonality inference from single-cell transcriptomes. Nat. Methods 2016, 13, 329–332. [Google Scholar] [CrossRef] [PubMed] [Green Version]
- Zhang, Y.; Zheng, L.; Zhang, L.; Hu, X.; Ren, X.; Zhang, Z. Deep single-cell RNA sequencing data of individual T cells from treatment-naïve colorectal cancer patients. Sci. Data 2019, 6, 1–15. [Google Scholar] [CrossRef] [PubMed] [Green Version]
- Zhang, Y.; Song, J.; Zhao, Z.; Yang, M.; Chen, M.; Liu, C.; Ji, J.; Zhu, D. Single-cell transcriptome analysis reveals tumor immune microenvironment heterogenicity and granulocytes enrichment in colorectal cancer liver metastases. Cancer Lett. 2020, 470, 84–94. [Google Scholar] [CrossRef] [PubMed]
- Trapnell, C.; Cacchiarelli, D.; Grimsby, J.; Pokharel, P.; Li, S.; Morse, M.; Lennon, N.J.; Livak, K.J.; Mikkelsen, T.S.; Rinn, J.L. The dynamics and regulators of cell fate decisions are revealed by pseudotemporal ordering of single cells. Nat. Biotechnol. 2014, 32, 381–386. [Google Scholar] [CrossRef] [Green Version]
- Wolf, F.A.; Hamey, F.K.; Plass, M.; Solana, J.; Dahlin, J.S.; Göttgens, B.; Rajewsky, N.; Simon, L.; Theis, F.J. PAGA: Graph abstraction reconciles clustering with trajectory inference through a topology preserving map of single cells. Genome Biol. 2019, 20, 59. [Google Scholar] [CrossRef] [PubMed] [Green Version]
- Masuda, K.; Kornberg, A.; Lin, S.; Ho, P.; Secener, K.; Suek, N.; Bacarella, A.M.; Ingham, M.; Rosario, V.; Al-Masrou, A.M.; et al. The functional and phenotypic diversity of single T-cell infiltrates in human colorectal cancer as correlated with clinical outcome. bioRxiv 2020. [Google Scholar] [CrossRef]
- Lee, H.O.; Hong, Y.; Etlioglu, H.E.; Cho, Y.B.; Pomella, V.; Van den Bosch, B.; Vanhecke, J.; Verbandt, S.; Hong, H.; Min, J.W.; et al. Lineage-dependent gene expression programs influence the immune landscape of colorectal cancer. Nat. Genet. 2020, 52, 594–603. [Google Scholar] [CrossRef]
- Stoeckius, M.; Hafemeister, C.; Stephenson, W.; Houck-Loomis, B.; Chattopadhyay, P.K.; Swerdlow, H.; Satija, R.; Smibert, P. Simultaneous epitope and transcriptome measurement in single cells. Nat. Methods 2017, 14, 865–868. [Google Scholar] [CrossRef] [Green Version]
- Peterson, V.M.; Zhang, K.X.; Kumar, N.; Wong, J.; Li, L.; Wilson, D.C.; Moore, R.; McClanahan, T.K.; Sadekova, S.; Klappenbach, J.A. Multiplexed quantification of proteins and transcripts in single cells. Nat. Biotechnol. 2017, 35, 936–939. [Google Scholar] [CrossRef]
- Shahi, P.; Kim, S.C.; Haliburton, J.R.; Gartner, Z.J.; Abate, A.R. Abseq: Ultrahigh-throughput single cell protein profiling with droplet microfluidic barcoding. Sci. Rep. 2017, 7, 44447. [Google Scholar] [CrossRef]
- Pombo Antunes, A.R.; Scheyltjens, I.; Lodi, F.; Messiaen, J.; Antoranz, A.; Duerinck, J.; Kancheva, D.; Martens, L.; De Vlaminck, K.; Van Hove, H.; et al. Single-cell profiling of myeloid cells in glioblastoma across species and disease stage reveals macrophage competition and specialization. Nat. Neurosci. 2021, 24, 595–610. [Google Scholar] [CrossRef]
- Mimitou, E.P.; Cheng, A.; Montalbano, A.; Hao, S.; Stoeckius, M.; Legut, M.; Roush, T.; Herrera, A.; Papalexi, E.; Ouyang, Z.; et al. Multiplexed detection of proteins, transcriptomes, clonotypes and CRISPR perturbations in single cells. Nat. Methods 2019, 16, 409–412. [Google Scholar] [CrossRef] [PubMed]
- Papalexi, E.; Mimitou, E.P.; Butler, A.W.; Foster, S.; Bracken, B.; Mauck, W.M.; Wessels, H.H.; Hao, Y.; Yeung, B.Z.; Smibert, P.; et al. Characterizing the molecular regulation of inhibitory immune checkpoints with multimodal single-cell screens. Nat. Genet. 2021, 53, 322–331. [Google Scholar] [CrossRef] [PubMed]
- Frangieh, C.J.; Melms, J.C.; Thakore, P.I.; Geiger-Schuller, K.R.; Ho, P.; Luoma, A.M.; Cleary, B.; Jerby-Arnon, L.; Malu, S.; Cuoco, M.S.; et al. Multimodal pooled Perturb-CITE-seq screens in patient models define mechanisms of cancer immune evasion. Nat. Genet. 2021, 53, 332–341. [Google Scholar] [CrossRef] [PubMed]
- Buenrostro, J.D.; Wu, B.; Litzenburger, U.M.; Ruff, D.; Gonzales, M.L.; Snyder, M.P.; Chang, H.Y.; Greenleaf, W.J. Single-cell chromatin accessibility reveals principles of regulatory variation. Nat. Cell Biol. 2015, 523, 486–490. [Google Scholar] [CrossRef]
- Stuart, T.; Srivastava, A.; Lareau, C.; Satija, R. Multimodal single-cell chromatin analysis with Signac. bioRxiv 2020. [Google Scholar] [CrossRef]
- Schep, A.N.; Wu, B.; Buenrostro, J.D.; Greenleaf, W.J. chromVAR: Inferring transcription-factor-associated accessibility from single-cell epigenomic data. Nat. Methods 2017, 14, 975–978. [Google Scholar] [CrossRef] [Green Version]
- Zheng, R.; Wan, C.; Mei, S.; Qin, Q.; Wu, Q.; Sun, H.; Chen, C.H.; Brown, M.; Zhang, X.; Meyer, C.A.; et al. Cistrome Data Browser: Expanded datasets and new tools for gene regulatory analysis. Nucleic Acids Res. 2019, 47, D729–D735. [Google Scholar] [CrossRef]
- Satpathy, A.T.; Granja, J.M.; Yost, K.E.; Qi, Y.; Meschi, F.; McDermott, G.P.; Olsen, B.N.; Mumbach, M.R.; Pierce, S.E.; Corces, M.R.; et al. Massively parallel single-cell chromatin landscapes of human immune cell development and intratumoral T cell exhaustion. Nat. Biotechnol. 2019, 37, 925–936. [Google Scholar] [CrossRef] [PubMed]
- Rendeiro, A.F.; Krausgruber, T.; Fortelny, N.; Zhao, F.; Penz, T.; Farlik, M.; Schuster, L.C.; Nemc, A.; Tasnády, S.; Réti, M.; et al. Chromatin mapping and single-cell immune profiling define the temporal dynamics of ibrutinib response in CLL. Nat. Commun. 2020, 11, 577. [Google Scholar] [CrossRef] [Green Version]
- Ståhl, P.L.; Salmén, F.; Vickovic, S.; Lundmark, A.; Navarro, J.F.; Magnusson, J.; Giacomello, S.; Asp, M.; Westholm, J.O.; Huss, M.; et al. Visualization and analysis of gene expression in tissue sections by spatial transcriptomics. Science 2016, 353, 78–82. [Google Scholar] [CrossRef] [Green Version]
- Rodriques, S.G.; Stickels, R.R.; Goeva, A.; Martin, C.A.; Murray, E.; Vanderburg, C.R.; Welch, J.; Chen, L.M.; Chen, F.; Macosko, E.Z. Slide-seq: A scalable technology for measuring genome-wide expression at high spatial resolution. Science 2019, 363, 1463–1467. [Google Scholar] [CrossRef] [PubMed]
- Vickovic, S.; Eraslan, G.; Salmén, F.; Klughammer, J.; Stenbeck, L.; Schapiro, D.; Äijö, T.; Bonneau, R.; Bergenstråhle, L.; Navarro, J.F.; et al. High-definition spatial transcriptomics for in situ tissue profiling. Nat. Methods 2019, 16, 987–990. [Google Scholar] [CrossRef] [PubMed]
- Ji, A.L.; Rubin, A.J.; Thrane, K.; Jiang, S.; Reynolds, D.L.; Meyers, R.M.; Guo, M.G.; George, B.M.; Mollbrink, A.; Bergenstråhle, J.; et al. Multimodal Analysis of Composition and Spatial Architecture in Human Squamous Cell Carcinoma. Cell 2020, 182, 497–514.e22. [Google Scholar] [CrossRef] [PubMed]


Publisher’s Note: MDPI stays neutral with regard to jurisdictional claims in published maps and institutional affiliations. |
© 2021 by the authors. Licensee MDPI, Basel, Switzerland. This article is an open access article distributed under the terms and conditions of the Creative Commons Attribution (CC BY) license (https://creativecommons.org/licenses/by/4.0/).
Share and Cite
Nussbaum, Y.I.; Manjunath, Y.; Suvilesh, K.N.; Warren, W.C.; Shyu, C.-R.; Kaifi, J.T.; Ciorba, M.A.; Mitchem, J.B. Current and Prospective Methods for Assessing Anti-Tumor Immunity in Colorectal Cancer. Int. J. Mol. Sci. 2021, 22, 4802. https://0-doi-org.brum.beds.ac.uk/10.3390/ijms22094802
Nussbaum YI, Manjunath Y, Suvilesh KN, Warren WC, Shyu C-R, Kaifi JT, Ciorba MA, Mitchem JB. Current and Prospective Methods for Assessing Anti-Tumor Immunity in Colorectal Cancer. International Journal of Molecular Sciences. 2021; 22(9):4802. https://0-doi-org.brum.beds.ac.uk/10.3390/ijms22094802
Chicago/Turabian StyleNussbaum, Yulia I., Yariswamy Manjunath, Kanve N. Suvilesh, Wesley C. Warren, Chi-Ren Shyu, Jussuf T. Kaifi, Matthew A. Ciorba, and Jonathan B. Mitchem. 2021. "Current and Prospective Methods for Assessing Anti-Tumor Immunity in Colorectal Cancer" International Journal of Molecular Sciences 22, no. 9: 4802. https://0-doi-org.brum.beds.ac.uk/10.3390/ijms22094802