
Calcite as a Precursor of Hydroxyapatite in the Early Biomineralization of Differentiating Human Bone-Marrow Mesenchymal Stem Cells

 , , , , , , and
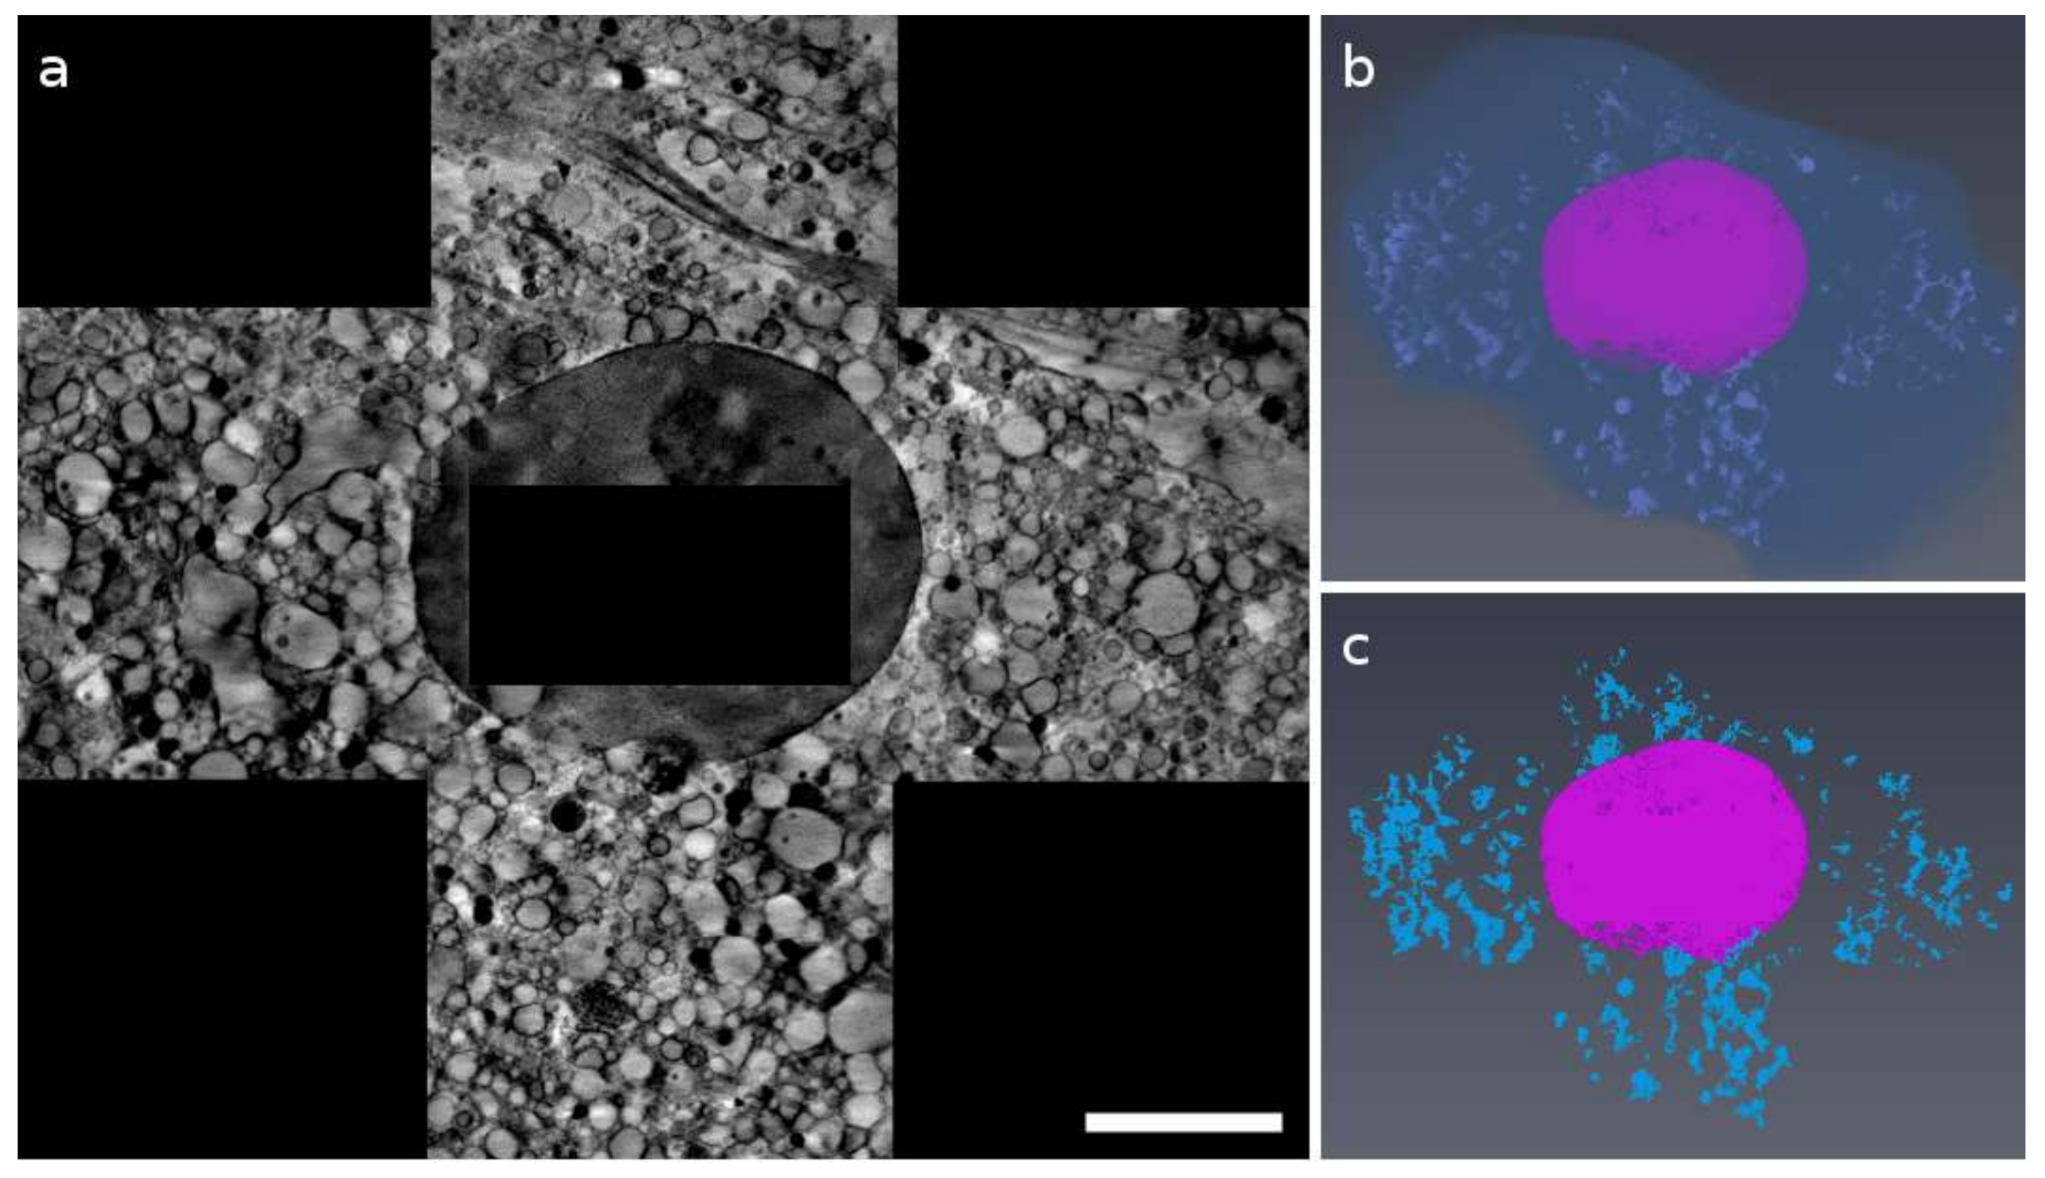
Abstract
:1. Introduction
2. Results
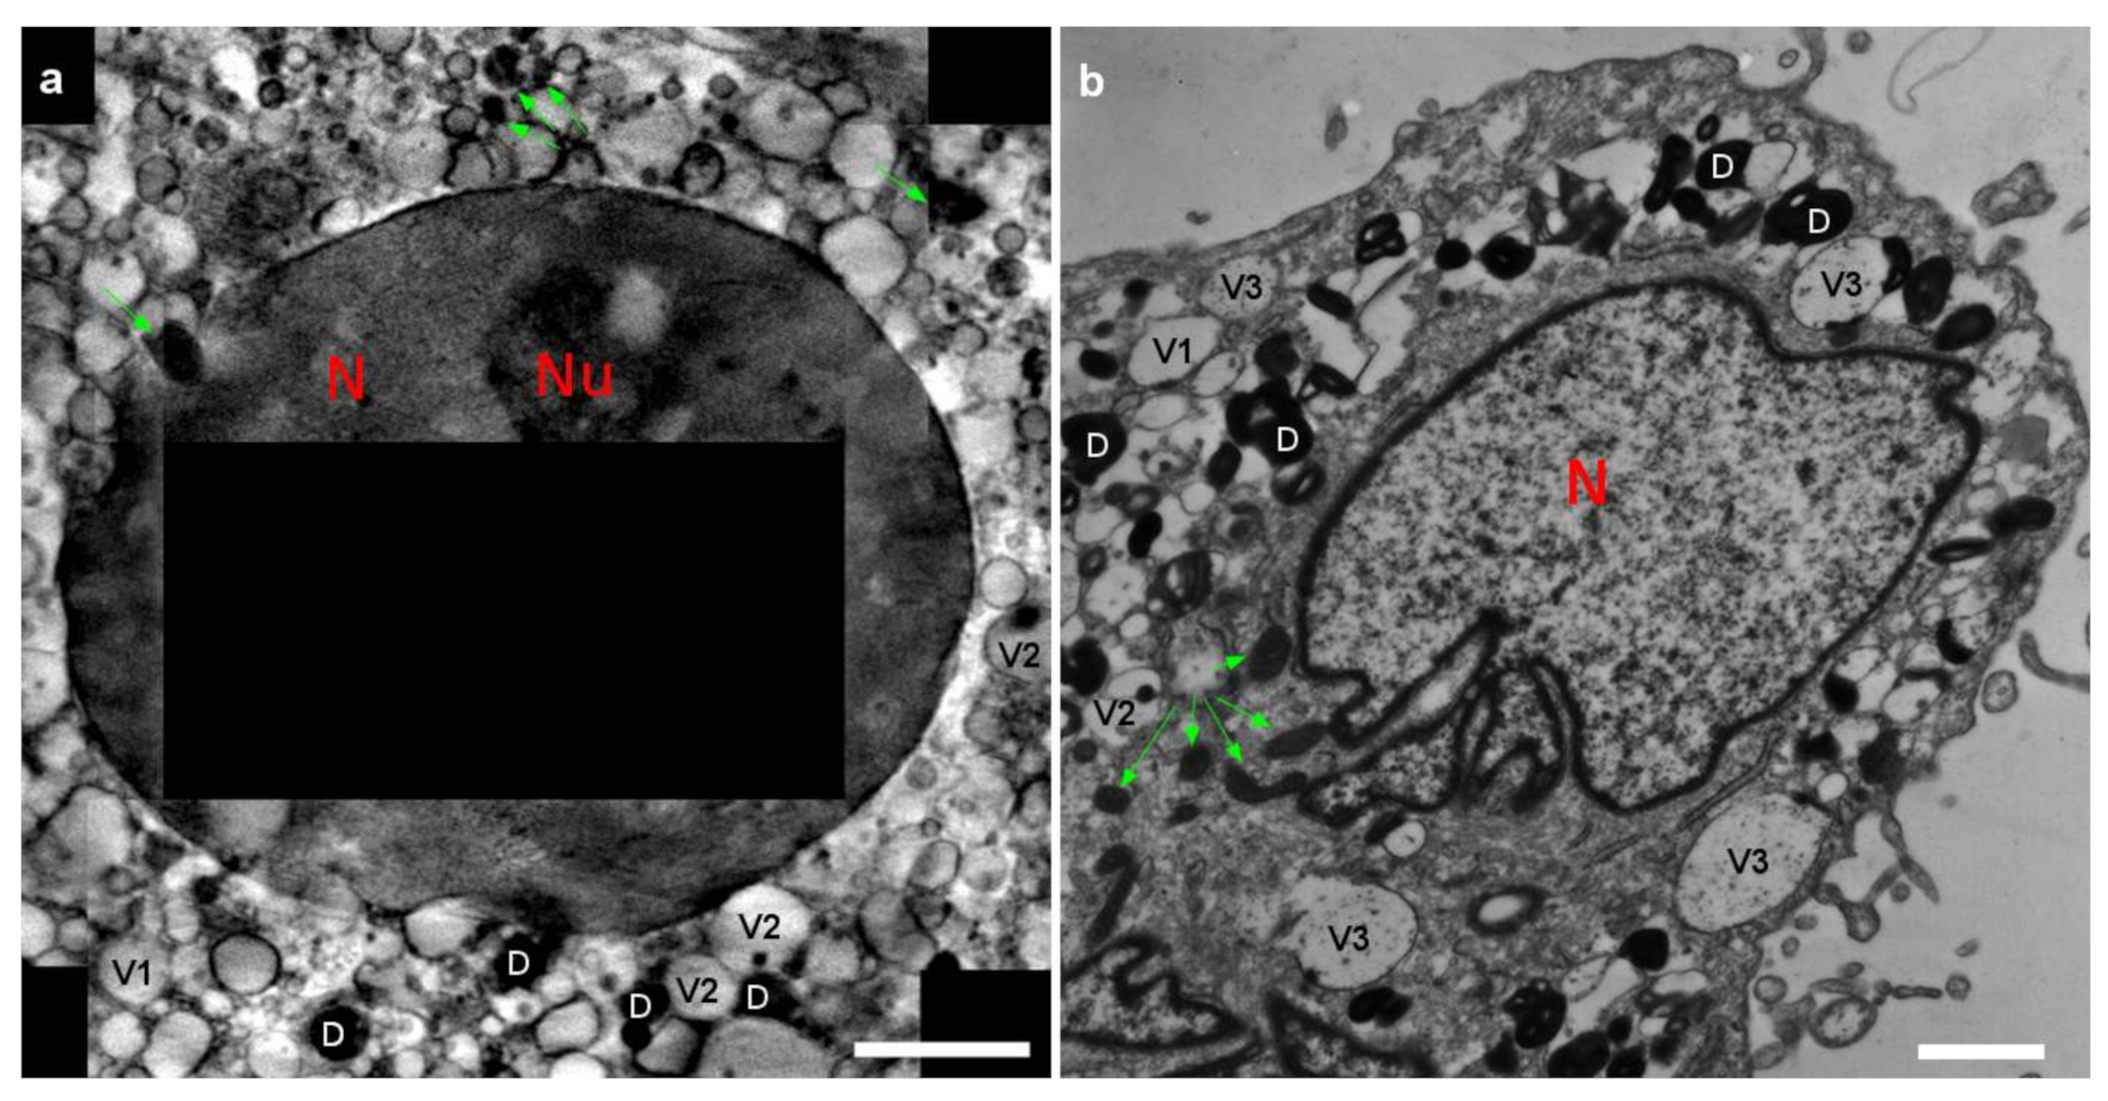
2.1. 3D Cell Ultrastructure and 2D Ca Intracellular Distribution
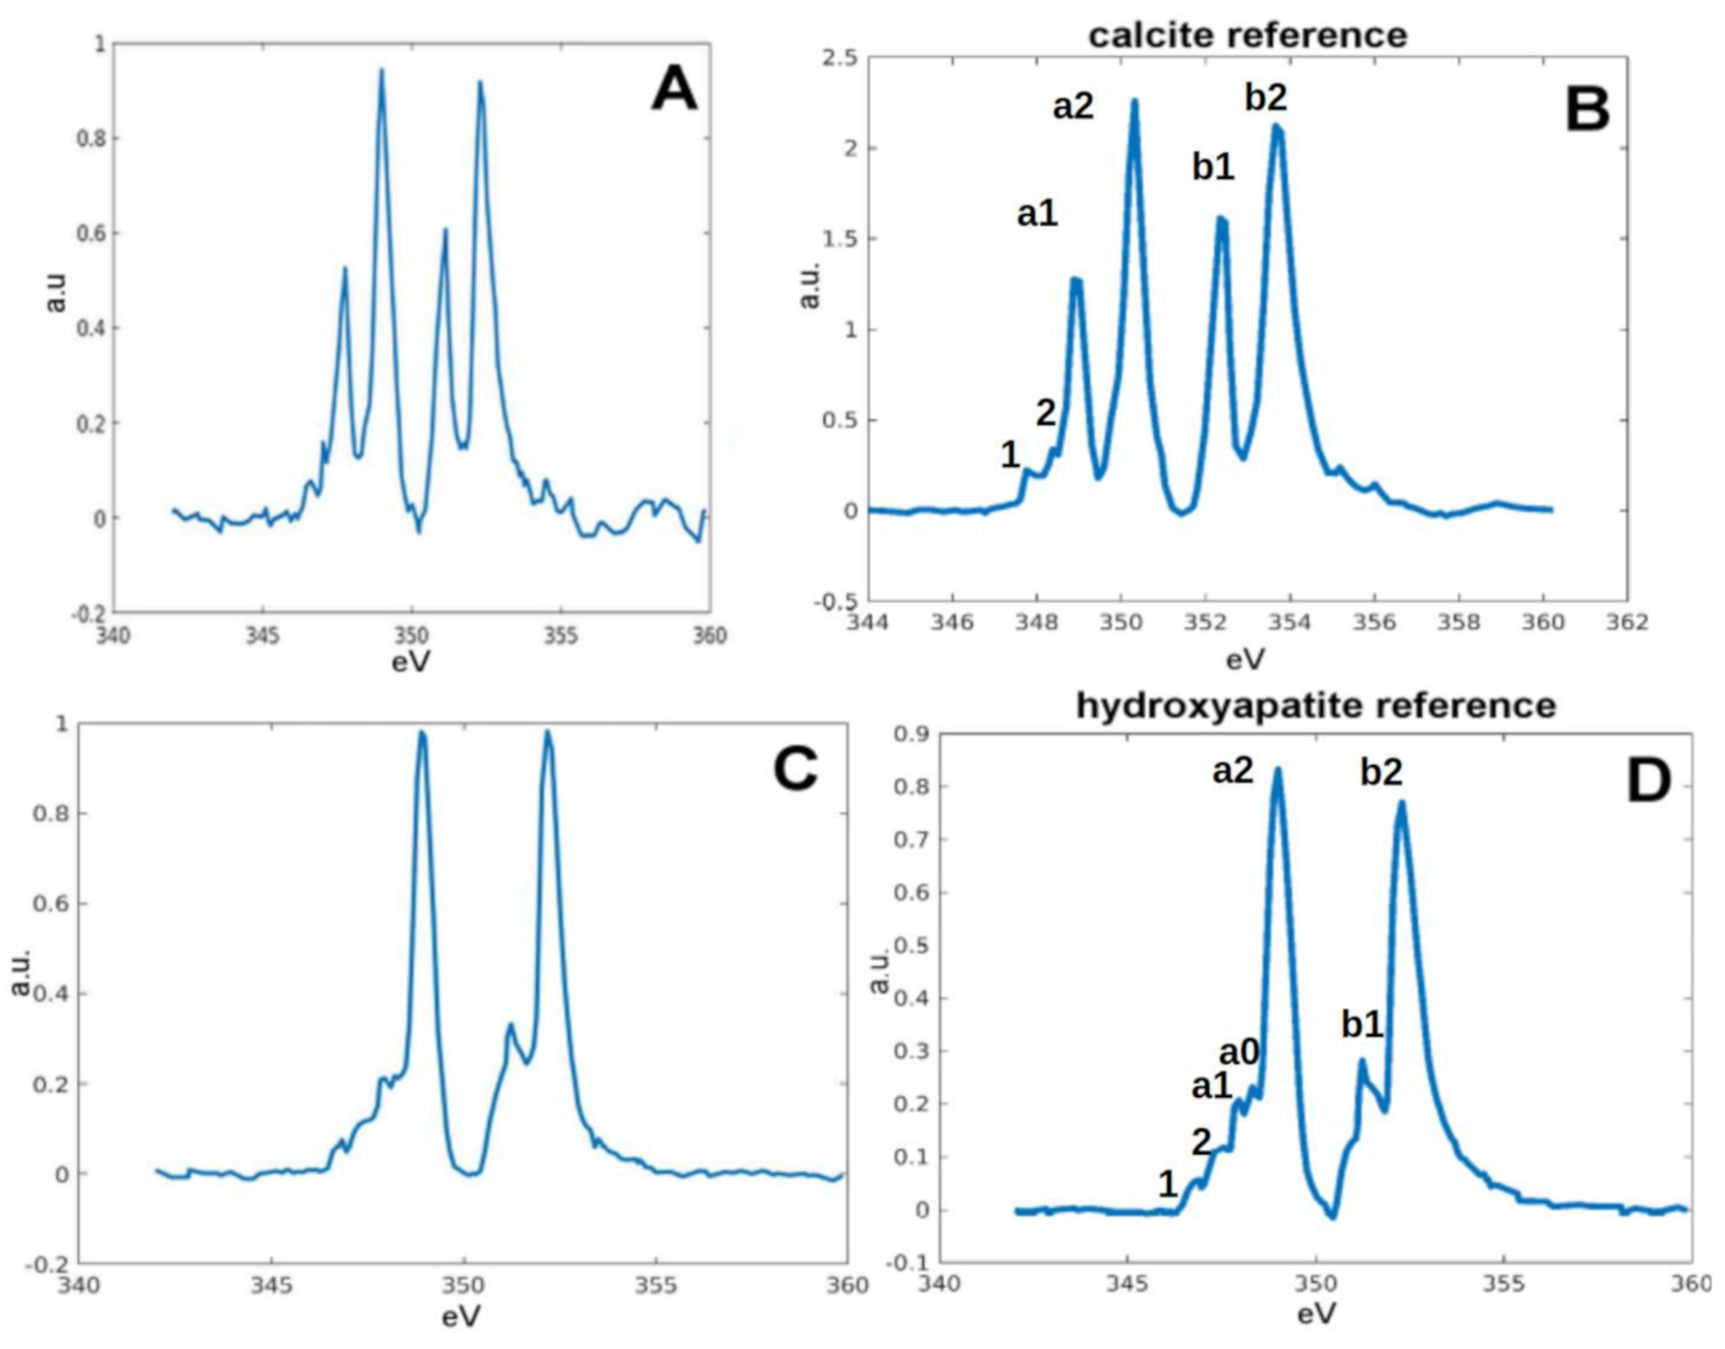
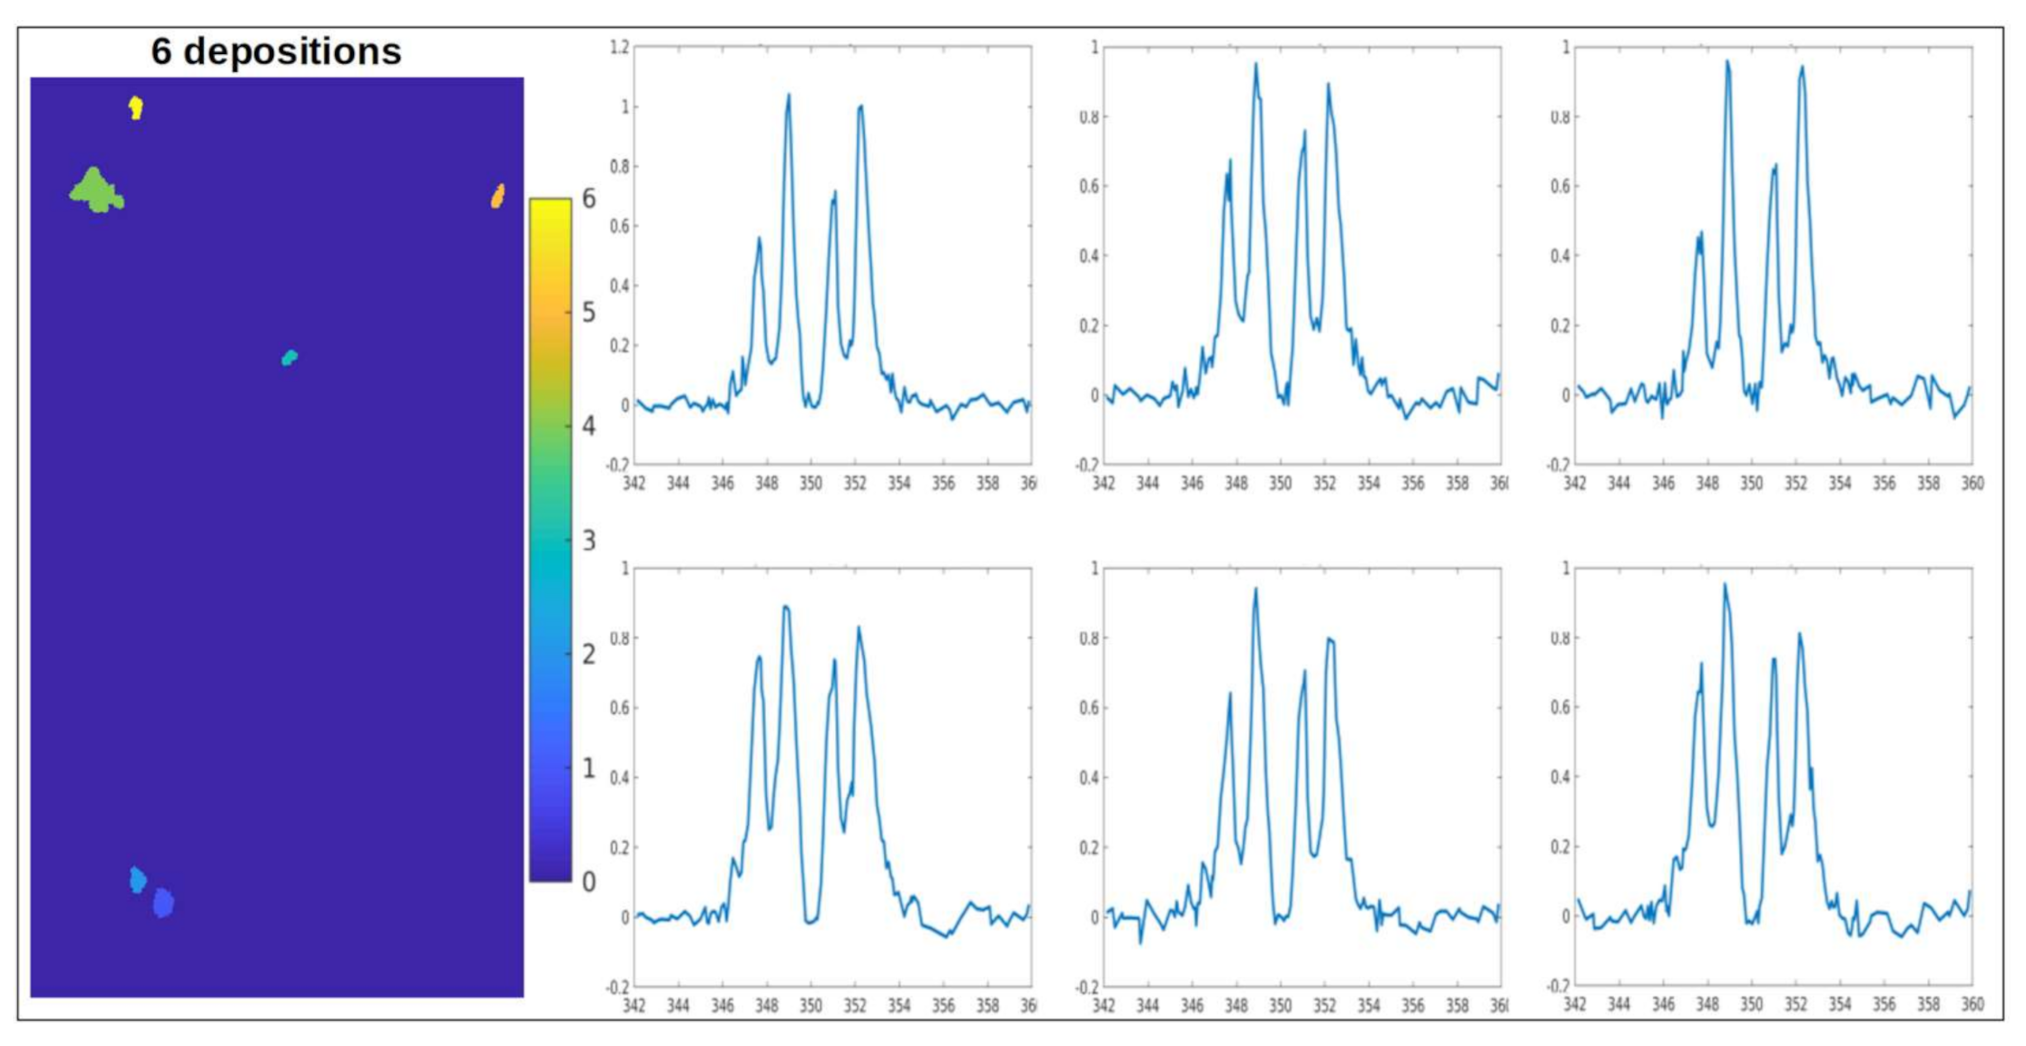
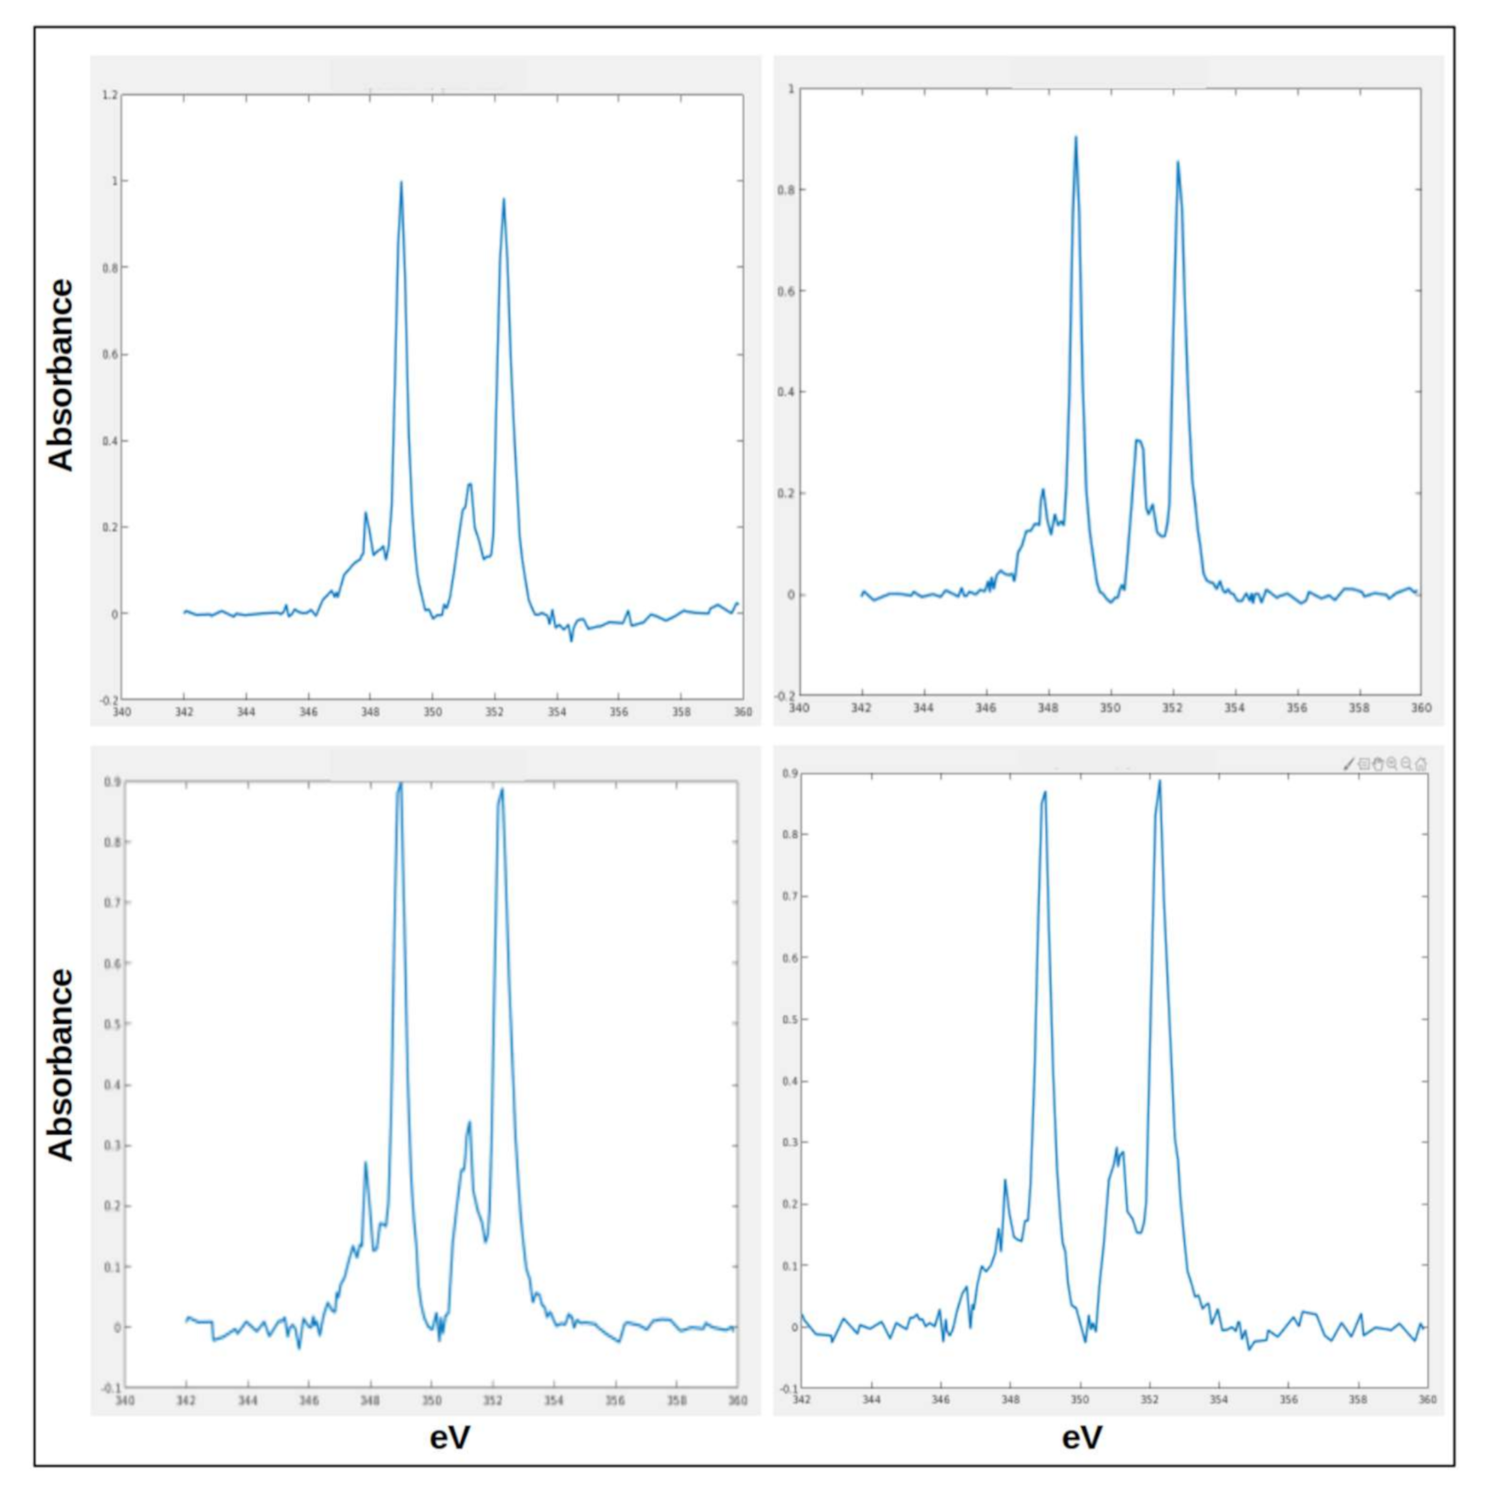
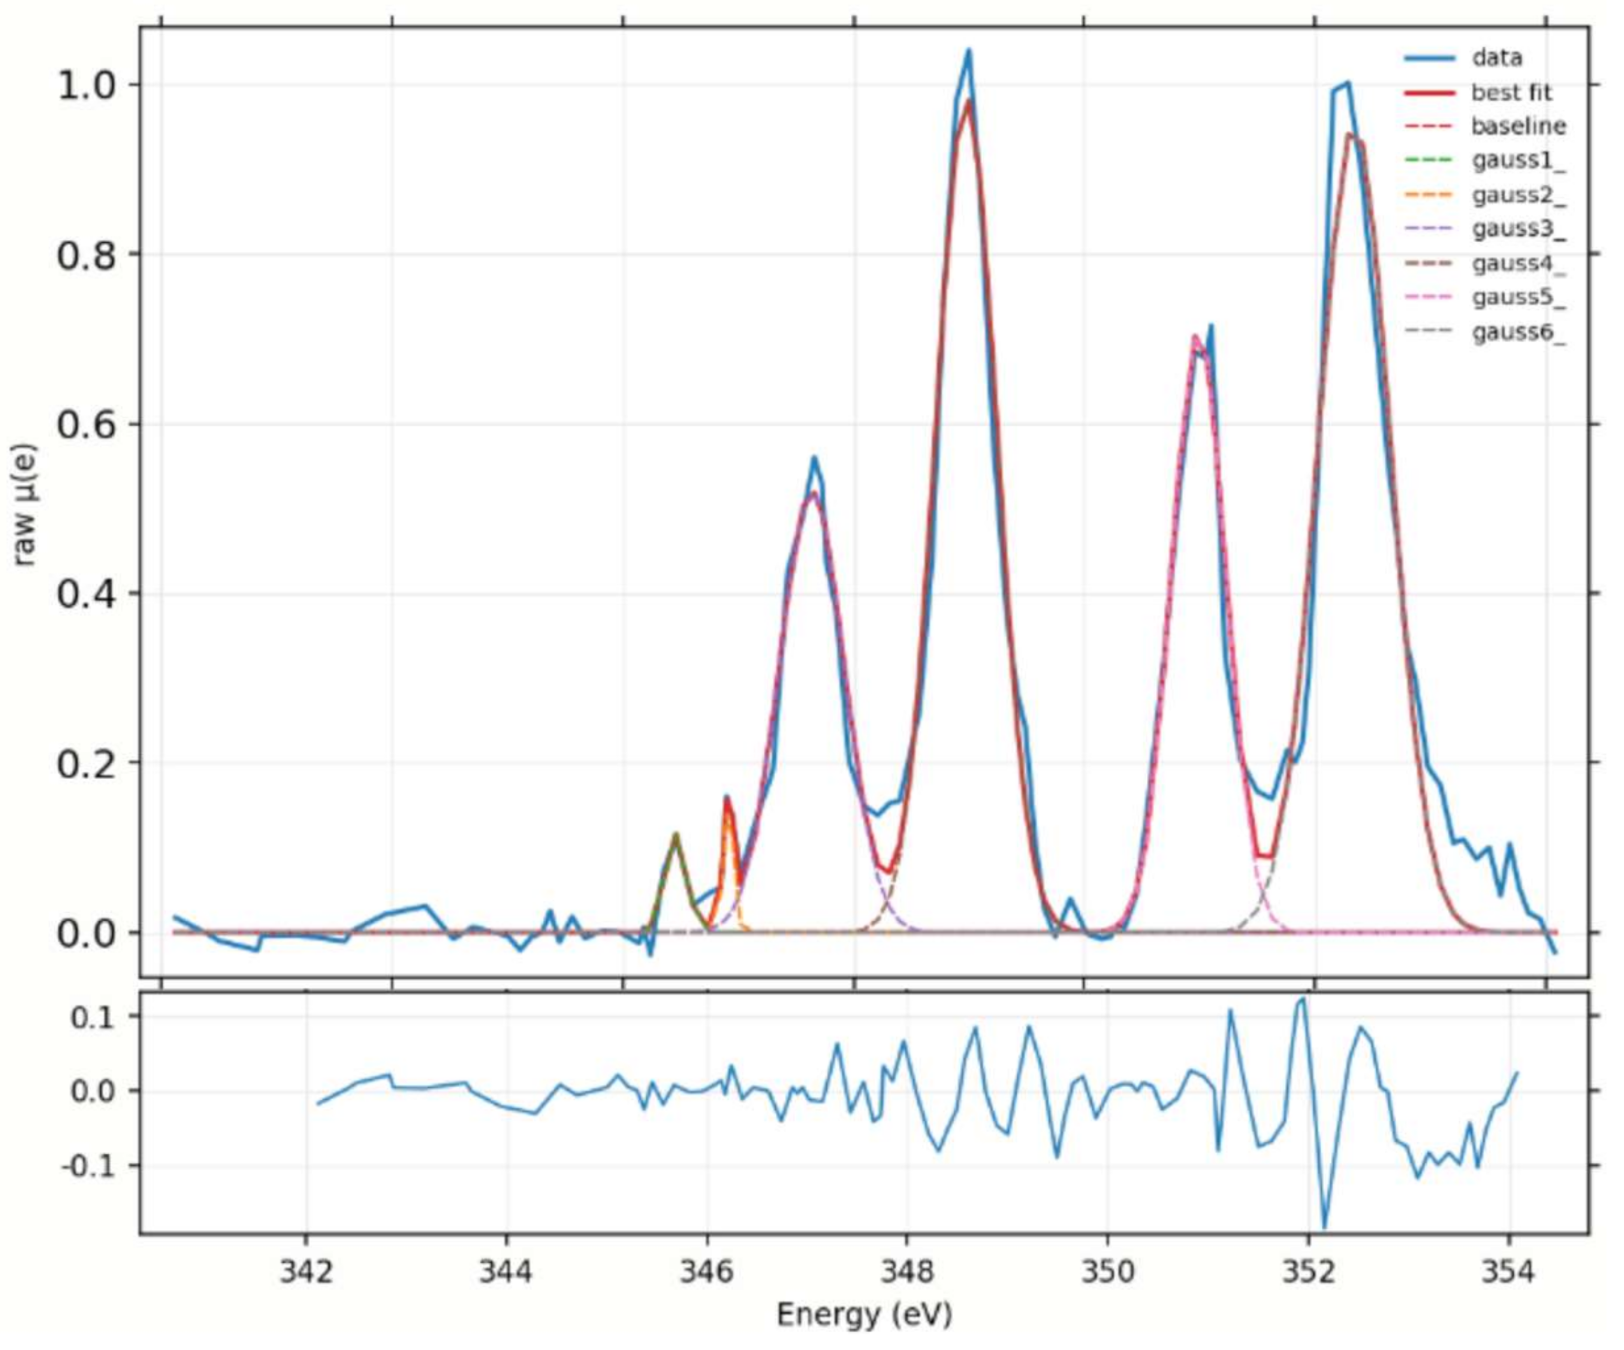
2.2. Chemical Fingerprint of Ca Depositions
2.3. Ca Carbonate Phase
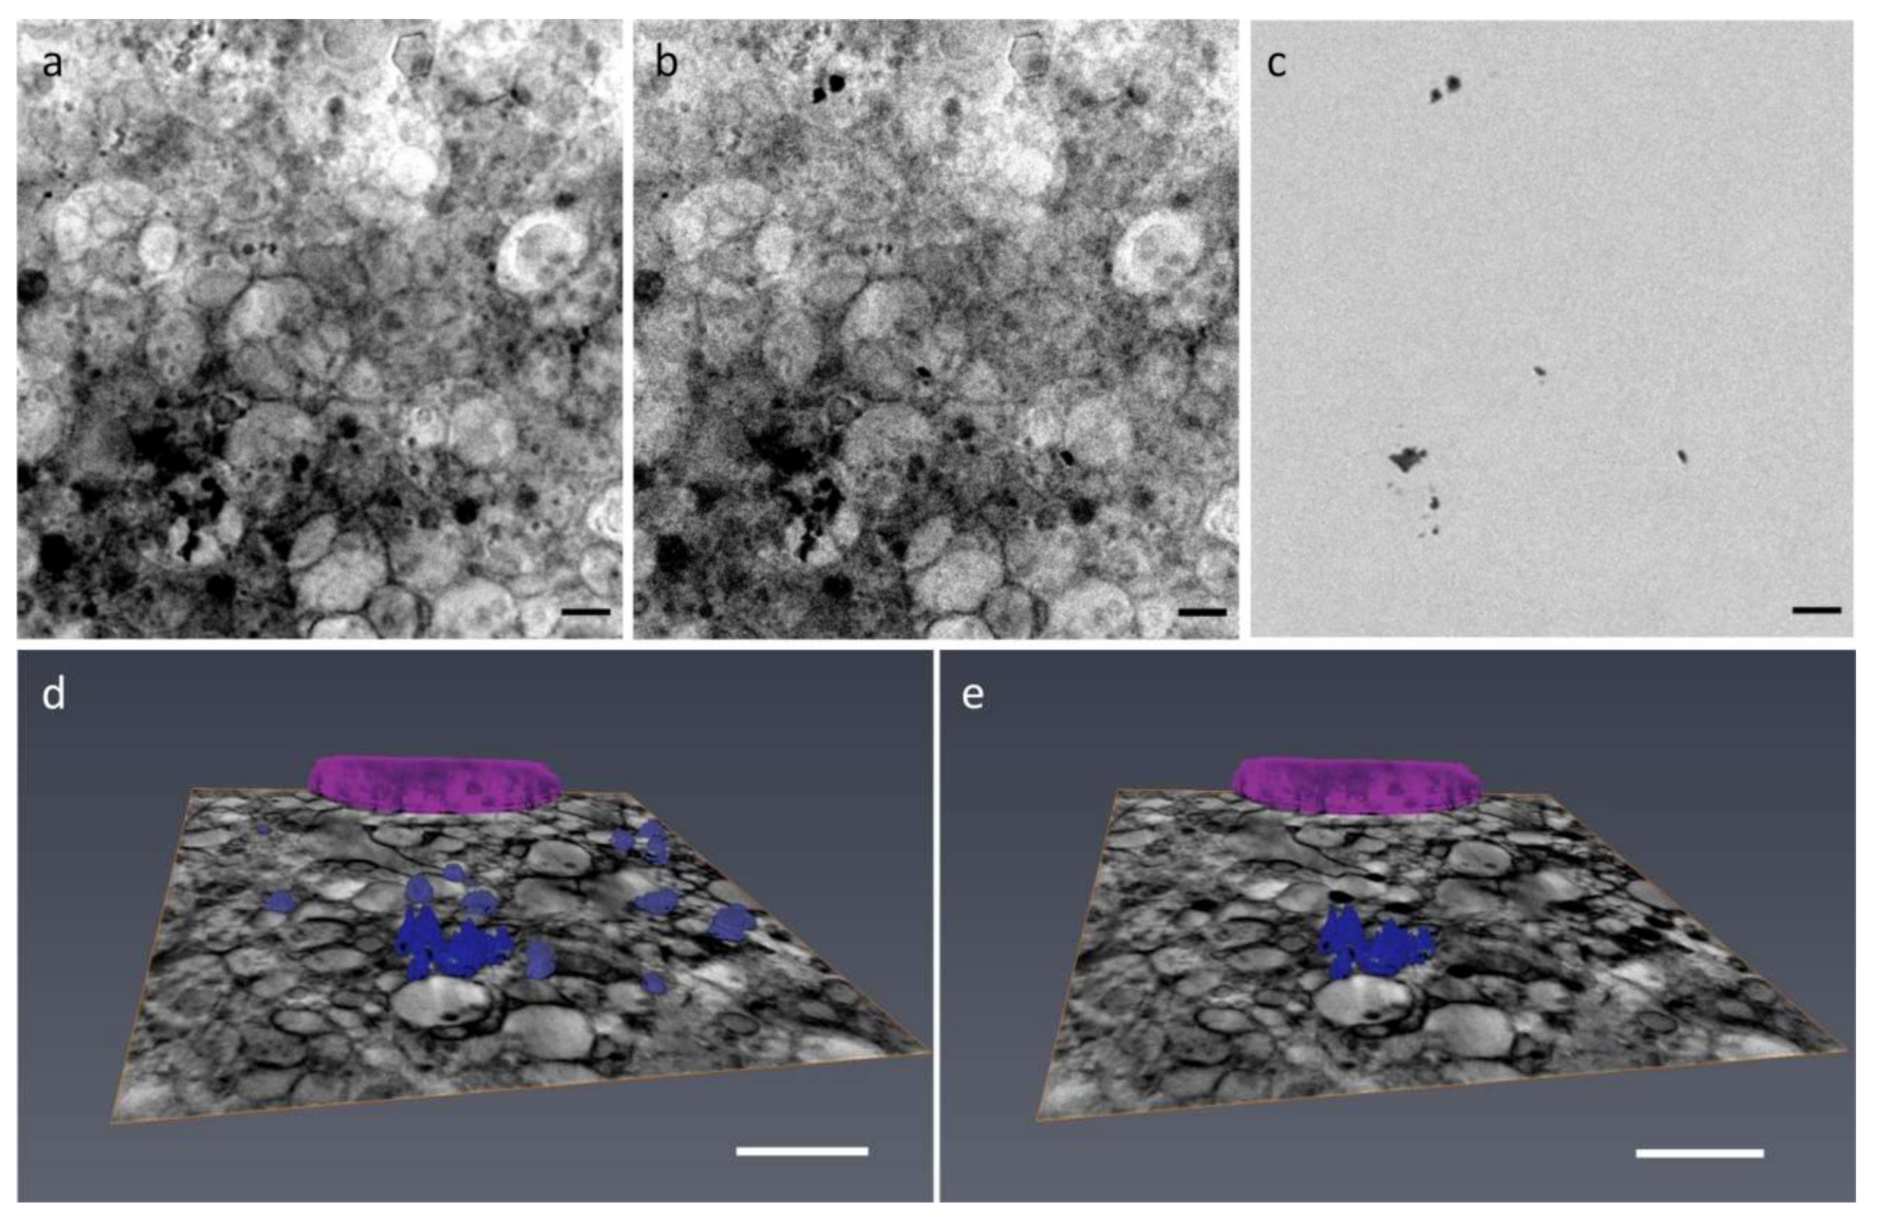
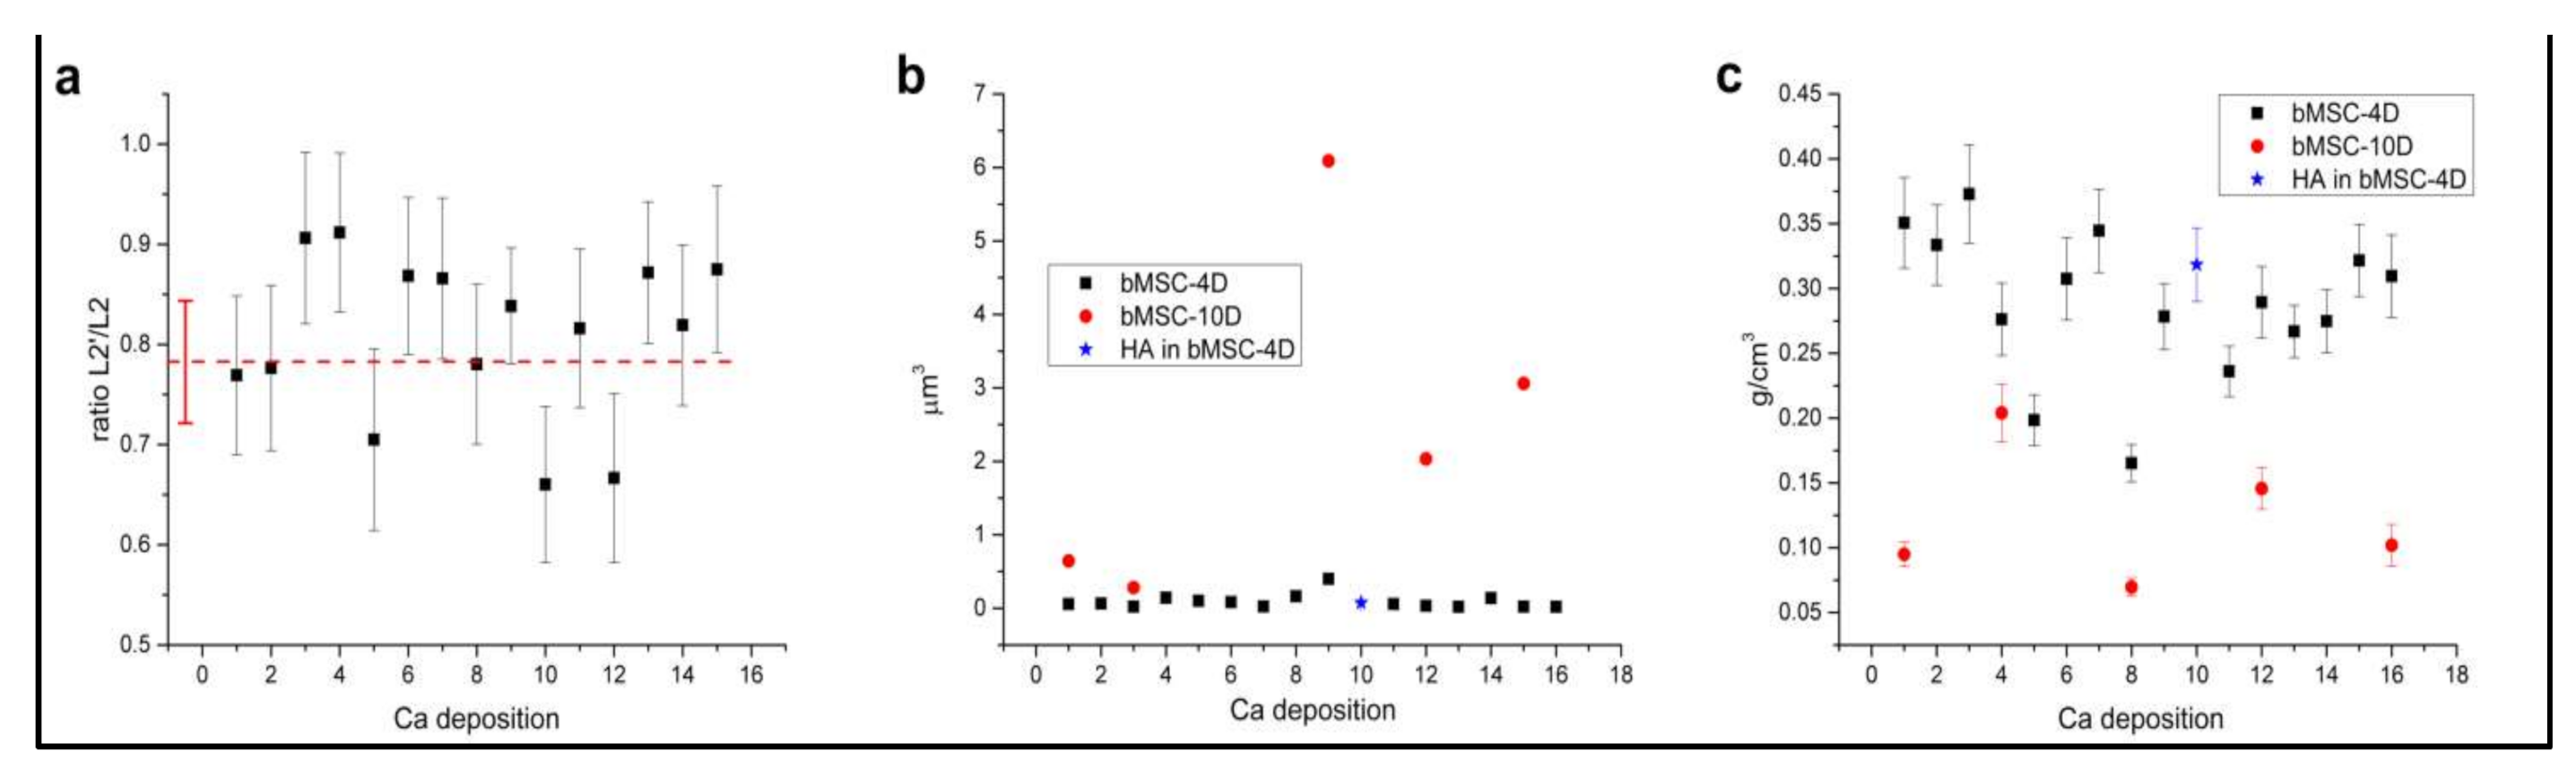
2.4. Depositions Volume
2.5. Ca Concentration in the Depositions
3. Discussion
4. Materials and Methods
4.1. Isolation and Culture of Human Mesenchymal Stem Cells
4.2. Osteogenic Differentiation of bMSCs
4.3. Sample Preparation for Synchrotron-Based Techniques
4.4. Cryo-Soft-X-ray Tomography
4.5. Spectromicroscopy
4.6. Ca Concentration Estimation
4.7. Transmission Electron Microscopy (TEM)
5. Conclusions
Author Contributions
Funding
Institutional Review Board Statement
Informed Consent Statement
Data Availability Statement
Acknowledgments
Conflicts of Interest
References
- Addadi, L.; Weiner, S. Control and Design Principles in Biological Mineralization. Angew. Chem. Int. Ed. Engl. 1992, 31, 153–169. [Google Scholar] [CrossRef]
- Tan, J.; Saltzman, W.M. Biomaterials with Hierarchically Defined Micro- and Nanoscale Structure. Biomaterials 2004, 25, 3593–3601. [Google Scholar] [CrossRef]
- Cedola, A.; Mastrogiacomo, M.; Burghammer, M.; Komlev, V.; Giannoni, P.; Favia, A.; Cancedda, R.; Rustichelli, F.; Lagomarsino, S. Engineered Bone from Bone Marrow Stromal Cells: A Structural Study by an Advanced x-Ray Microdiffraction Technique. Phys. Med. Biol. 2006, 51, N109–N116. [Google Scholar] [CrossRef] [PubMed]
- Nudelman, F.; Pieterse, K.; George, A.; Bomans, P.H.H.; Friedrich, H.; Brylka, L.J.; Hilbers, P.A.J.; de With, G.; Sommerdijk, N.A.J.M. The Role of Collagen in Bone Apatite Formation in the Presence of Hydroxyapatite Nucleation Inhibitors. Nat. Mater. 2010, 9, 1004–1009. [Google Scholar] [CrossRef] [PubMed] [Green Version]
- Scaglione, S.; Giannoni, P.; Bianchini, P.; Sandri, M.; Marotta, R.; Firpo, G.; Valbusa, U.; Tampieri, A.; Diaspro, A.; Bianco, P.; et al. Order versus Disorder: In Vivo Bone Formation within Osteoconductive Scaffolds. Sci. Rep. 2012, 2, 274. [Google Scholar] [CrossRef] [Green Version]
- Linde, A.; Robins, S.P. Quantitative Assessment of Collagen Crosslinks in Dissected Predentin and Dentin. Collagen Relat. Res. 1988, 8, 443–450. [Google Scholar] [CrossRef]
- Kular, J.; Tickner, J.; Chim, S.M.; Xu, J. An Overview of the Regulation of Bone Remodelling at the Cellular Level. Clin. Biochem. 2012, 45, 863–873. [Google Scholar] [CrossRef]
- Abdallah, B.M.; Kassem, M. Human Mesenchymal Stem Cells: From Basic Biology to Clinical Applications. Gene Ther. 2008, 15, 109–116. [Google Scholar] [CrossRef] [Green Version]
- Dvorak, M.M.; Riccardi, D. Ca2+ as an Extracellular Signal in Bone. Cell Calcium 2004, 35, 249–255. [Google Scholar] [CrossRef]
- Chen, Y.; Feng, Y.; Gregory-Deveaux, J.; Ahmed Masoud, M.; Sunata Chandra, F.; Chen, H.; Zhang, D.; Feng, L. Biomineralization Forming Process and Bio-inspired Nanomaterials for Biomedical Application: A Review. Minerals 2019, 9, 68. [Google Scholar] [CrossRef] [Green Version]
- Kahil, K.; Varsano, N.; Sorrentino, A.; Pereiro, E.; Rez, P.; Weiner, S.; Addadi, L. Cellular Pathways of Calcium Transport and Concentration toward Mineral Formation in Sea Urchin Larvae. Proc. Natl. Acad. Sci. USA 2020, 117, 30957–30965. [Google Scholar] [CrossRef]
- Gal, A.; Sorrentino, A.; Kahil, K.; Pereiro, E.; Faivre, D.; Scheffel, A. Native-State Imaging of Calcifying and Noncalcifying Microalgae Reveals Similarities in Their Calcium Storage Organelles. Proc. Natl. Acad. Sci. USA 2018, 115, 11000–11005. [Google Scholar] [CrossRef] [PubMed] [Green Version]
- Sviben, S.; Gal, A.; Hood, M.A.; Bertinetti, L.; Politi, Y.; Bennet, M.; Krishnamoorthy, P.; Schertel, A.; Wirth, R.; Sorrentino, A.; et al. A Vacuole-like Compartment Concentrates a Disordered Calcium Phase in a Key Coccolithophorid Alga. Nat. Commun. 2016, 7. [Google Scholar] [CrossRef]
- Otón, J.; Pereiro, E.; Pérez-Berná, A.J.; Millach, L.; Sorzano, C.O.S.; Marabini, R.; Carazo, J.M. Characterization of Transfer Function, Resolution and Depth of Field of a Soft X-Ray Microscope Applied to Tomography Enhancement by Wiener Deconvolution. Biomed. Opt. Express BOE 2016, 7, 5092–5103. [Google Scholar] [CrossRef] [PubMed] [Green Version]
- Moscheni, C.; Malucelli, E.; Castiglioni, S.; Procopio, A.; De Palma, C.; Sorrentino, A.; Sartori, P.; Locatelli, L.; Pereiro, E.; Maier, J.A.; et al. 3D Quantitative and Ultrastructural Analysis of Mitochondria in a Model of Doxorubicin Sensitive and Resistant Human Colon Carcinoma Cells. Cancers 2019, 11, 1254. [Google Scholar] [CrossRef] [Green Version]
- De Groot, F.M.F.; Fuggle, J.C.; Thole, B.T.; Sawatzky, G.A. L2,3 x-ray-absorption edges of d0 compounds: K+, Ca2+, Sc3+, and Ti4+ in Oh (octahedral) symmetry. Phys. Rev. B 1990, 41, 928–937. [Google Scholar] [CrossRef]
- Fleet, M.E.; Liu, X. Calcium L2,3-Edge XANES of Carbonates, Carbonate Apatite, and Oldhamite (CaS). Am. Mineral. 2015, 94, 1235–1241. [Google Scholar] [CrossRef]
- Naftel, S.J.; Sham, T.K.; Yiu, Y.M.; Yates, B.W. Calcium L-Edge XANES Study of Some Calcium Compounds. J. Synchrotron Radiat. 2001, 8, 255–257. [Google Scholar] [CrossRef] [Green Version]
- Cosmidis, J.; Benzerara, K.; Nassif, N.; Tyliszczak, T.; Bourdelle, F. Characterization of Ca-Phosphate Biological Materials by Scanning Transmission X-Ray Microscopy (STXM) at the Ca L2,3-, P L2,3- and C K-Edges. Acta Biomater. 2015, 12, 260–269. [Google Scholar] [CrossRef] [Green Version]
- Procopio, A.; Malucelli, E.; Pacureanu, A.; Cappadone, C.; Farruggia, G.; Sargenti, A.; Castiglioni, S.; Altamura, D.; Sorrentino, A.; Giannini, C.; et al. Chemical Fingerprint of Zn–Hydroxyapatite in the Early Stages of Osteogenic Differentiation. ACS Cent. Sci. 2019, 5, 1449–1460. [Google Scholar] [CrossRef] [Green Version]
- Gong, Y.U.T.; Killian, C.E.; Olson, I.C.; Appathurai, N.P.; Amasino, A.L.; Martin, M.C.; Holt, L.J.; Wilt, F.H.; Gilbert, P.U.P.A. Phase Transitions in Biogenic Amorphous Calcium Carbonate. Proc. Natl. Acad. Sci. USA 2012, 109, 6088–6093. [Google Scholar] [CrossRef] [PubMed] [Green Version]
- Rez, P.; Blackwell, A. Ca L23 Spectrum in Amorphous and Crystalline Phases of Calcium Carbonate. J. Phys. Chem. B 2011, 115, 11193–11198. [Google Scholar] [CrossRef] [PubMed]
- Politi, Y.; Levi-Kalisman, Y.; Raz, S.; Wilt, F.; Addadi, L.; Weiner, S.; Sagi, I. Structural Characterization of the Transient Amorphous Calcium Carbonate Precursor Phase in Sea Urchin Embryos. Adv. Funct. Mater. 2006, 16, 1289–1298. [Google Scholar] [CrossRef]
- Van Heel, M.; Schatz, M. Fourier Shell Correlation Threshold Criteria. J. Struct. Biol. 2005, 151, 250–262. [Google Scholar] [CrossRef]
- Mayerhöfer, T.G.; Pipa, A.V.; Popp, J. Beer’s Law-Why Integrated Absorbance Depends Linearly on Concentration. ChemPhysChem 2019, 20, 2748–2753. [Google Scholar] [CrossRef]
- Roy, D.M.; Linnehan, S.K. Hydroxyapatite Formed from Coral Skeletal Carbonate by Hydrothermal Exchange. Nature 1974, 247, 220–222. [Google Scholar] [CrossRef]
- Ohira, T.; Ishikawa, K. Hydroxyapatite Deposition in Articular Cartilage by Intra-Articular Injections of Methylprednisolone. A Histological, Ultrastructural, and x-Ray-Microprobe Analysis in Rabbits. J. Bone Jt. Surg. 1986, 68, 509–520. [Google Scholar] [CrossRef]
- Boonrungsiman, S.; Gentleman, E.; Carzaniga, R.; Evans, N.D.; McComb, D.W.; Porter, A.E.; Stevens, M.M. The Role of Intracellular Calcium Phosphate in Osteoblast-Mediated Bone Apatite Formation. Proc. Natl. Acad. Sci. USA 2012, 109, 14170–14175. [Google Scholar] [CrossRef] [Green Version]
- Tang, C.; Wei, Y.; Gu, L.; Zhang, O.; Li, M.; Yuan, G.; He, Y.; Huang, L.; Liu, Y.; Zhang, Y. Biomineral Precursor Formation Is Initiated by Transporting Calcium and Phosphorus Clusters from the Endoplasmic Reticulum to Mitochondria. Adv. Sci. 2020, 7, 1902536. [Google Scholar] [CrossRef]
- Benayahu, D.; Wiesenfeld, Y.; Sapir-Koren, R. How is mechanobiology involved in mesenchymal stem cell differentiation toward the osteoblastic or adipogenic fate? J. Cell. Physiol. 2019, 234, 12133–12141. [Google Scholar] [CrossRef]
- Marchegiani, F.; Cibej, E.; Vergni, P.; Tosi, G.; Fermani, S.; Falini, G. Hydroxyapatite Synthesis from Biogenic Calcite Single Crystals into Phosphate Solutions at Ambient Conditions. J. Cryst. Growth 2009, 311, 4219–4225. [Google Scholar] [CrossRef]
- Bischoff, W.D.; Mackenzie, F.T.; Bishop, F.C. Stabilities of Synthetic Magnesian Calcites in Aqueous Solution: Comparison with Biogenic Materials. Geochim. Cosmochim. Acta 1987, 51, 1413–1423. [Google Scholar] [CrossRef]
- Kralj, D.; Kontrec, J.; Brečević, L.; Falini, G.; Nöthig-Laslo, V. Effect of Inorganic Anions on the Morphology and Structure of Magnesium Calcite. Chem. A Eur. J. 2004, 10, 1647–1656. [Google Scholar] [CrossRef] [PubMed]
- Sargenti, A.; Castiglioni, S.; Olivi, E.; Bianchi, F.; Cazzaniga, A.; Farruggia, G.; Cappadone, C.; Merolle, L.; Malucelli, E.; Ventura, C.; et al. Magnesium Deprivation Potentiates Human Mesenchymal Stem Cell Transcriptional Remodeling. Int. J. Mol. Sci. 2018, 19. [Google Scholar] [CrossRef] [Green Version]
- Cazzaniga, A.; Maier, J.A.M.; Castiglioni, S. Impact of Simulated Microgravity on Human Bone Stem Cells: New Hints for Space Medicine. Biochem. Biophys. Res. Commun. 2016, 473, 181–186. [Google Scholar] [CrossRef] [PubMed]
- Sorrentino, A.; Nicolás, J.; Valcárcel, R.; Chichón, F.J.; Rosanes, M.; Avila, J.; Tkachuk, A.; Irwin, J.; Ferrer, S.; Pereiro, E. MISTRAL: A Transmission Soft X-Ray Microscopy Beamline for Cryo Nano-Tomography of Biological Samples and Magnetic Domains Imaging. J. Synchrotron Rad. 2015, 22, 1112–1117. [Google Scholar] [CrossRef]
- Pereiro, E.; Nicolás, J.; Ferrer, S.; Howells, M.R. A Soft X-Ray Beamline for Transmission X-Ray Microscopy at ALBA. J. Synchrotron Radiat. 2009, 16, 505–512. [Google Scholar] [CrossRef]
- Kremer, J.R.; Mastronarde, D.N.; McIntosh, J.R. Computer Visualization of Three-Dimensional Image Data Using IMOD. J. Struct. Biol. 1996, 116, 71–76. [Google Scholar] [CrossRef] [Green Version]
- MessaoudiI, C.; Boudier, T.; Sorzano, C.O.S.; Marco, S. TomoJ: Tomography Software for Three-Dimensional Reconstruction in Transmission Electron Microscopy. BMC Bioinform. 2007, 8, 288. [Google Scholar] [CrossRef] [Green Version]
- Sorrentino, A.; Simonelli, L.; Kazzazi, A.; Laszczynski, N.; Birrozzi, A.; Mullaliu, A.; Pereiro, E.; Passerini, S.; Giorgetti, M.; Tonti, D. Soft X-ray Transmission Microscopy on Lithium-Rich Layered-Oxide Cathode Materials. Appl. Sci. 2021, 11, 2791. [Google Scholar] [CrossRef]
- Bourdelle, F.; Benzerara, K.; Beyssac, O.; Cosmidis, J.; Neuville, D.R.; Brown, G.E.; Paineau, E. Quantification of the Ferric/Ferrous Iron Ratio in Silicates by Scanning Transmission X-Ray Microscopy at the Fe L2,3 Edges. Contrib. Miner. Petrol. 2013, 166, 423–434. [Google Scholar] [CrossRef]
- Newville, M. Larch: An Analysis Package for XAFS and Related Spectroscopies. J. Phys. Conf. Ser. 2013, 430, 012007. [Google Scholar] [CrossRef]
- Rueden, C.T.; Schindelin, J.; Hiner, M.C.; DeZonia, B.E.; Walter, A.E.; Arena, E.T.; Eliceiri, K.W. ImageJ2: ImageJ for the next Generation of Scientific Image Data. BMC Bioinform. 2017, 18, 529. [Google Scholar] [CrossRef] [PubMed]


Publisher’s Note: MDPI stays neutral with regard to jurisdictional claims in published maps and institutional affiliations. |
© 2021 by the authors. Licensee MDPI, Basel, Switzerland. This article is an open access article distributed under the terms and conditions of the Creative Commons Attribution (CC BY) license (https://creativecommons.org/licenses/by/4.0/).
Share and Cite
Sorrentino, A.; Malucelli, E.; Rossi, F.; Cappadone, C.; Farruggia, G.; Moscheni, C.; Perez-Berna, A.J.; Conesa, J.J.; Colletti, C.; Roveri, N.; et al. Calcite as a Precursor of Hydroxyapatite in the Early Biomineralization of Differentiating Human Bone-Marrow Mesenchymal Stem Cells. Int. J. Mol. Sci. 2021, 22, 4939. https://0-doi-org.brum.beds.ac.uk/10.3390/ijms22094939
Sorrentino A, Malucelli E, Rossi F, Cappadone C, Farruggia G, Moscheni C, Perez-Berna AJ, Conesa JJ, Colletti C, Roveri N, et al. Calcite as a Precursor of Hydroxyapatite in the Early Biomineralization of Differentiating Human Bone-Marrow Mesenchymal Stem Cells. International Journal of Molecular Sciences. 2021; 22(9):4939. https://0-doi-org.brum.beds.ac.uk/10.3390/ijms22094939
Chicago/Turabian StyleSorrentino, Andrea, Emil Malucelli, Francesca Rossi, Concettina Cappadone, Giovanna Farruggia, Claudia Moscheni, Ana J. Perez-Berna, Jose Javier Conesa, Chiara Colletti, Norberto Roveri, and et al. 2021. "Calcite as a Precursor of Hydroxyapatite in the Early Biomineralization of Differentiating Human Bone-Marrow Mesenchymal Stem Cells" International Journal of Molecular Sciences 22, no. 9: 4939. https://0-doi-org.brum.beds.ac.uk/10.3390/ijms22094939