Article

PsnWRKY70 Negatively Regulates NaHCO3 Tolerance in Populus

State Key Laboratory of Tree Genetics and Breeding, Northeast Forestry University, 26 Hexing Road, Harbin 150040, China
*
Authors to whom correspondence should be addressed.
Int. J. Mol. Sci. 2022, 23(21), 13086; https://0-doi-org.brum.beds.ac.uk/10.3390/ijms232113086
Submission received: 30 September 2022 / Revised: 13 October 2022 / Accepted: 26 October 2022 / Published: 28 October 2022
(This article belongs to the Special Issue Molecular Mechanisms of Abiotic Stress Responses in Trees)

Abstract

:
Poplar is an important afforestation and ornamental tree species in Northeast China. The distribution area of saline-alkali land is approximately 765 hm2 in Northeast China. The breeding of saline-alkali-resistant transgenic trees could be an effective method of afforestation in saline-alkali land. WRKY transcription factors play a crucial role in abiotic stress. In this study, we analyzed the genetic stability of the two-year-old PsnWRKY70 transgenic poplars. The results showed that PsnWRKY70 of transgenic poplars had been expressed stably and normally at the mRNA level. The gene interference expression (RE) lines had no significant effect on the growth of PsnWRKY70 under NaHCO3 stress, and the alkali damage index of RE lines was significantly lower than that of WT and overexpression (OE) lines at day 15 under NaHCO3 stress. POD activity was significantly higher in RE lines than in WT. The MDA content of the RE line was lower than that of the WT line. Transcriptome analysis showed that RE lines up-regulated genes enriched in cell wall organization or biogenesis pathway-related genes such as EXPA8, EXPA4, EXPA3, EXPA1, EXPB3, EXP10, PME53, PME34, PME36, XTH9, XTH6, XTH23, CESA1, CESA3, CES9; FLA11, FLA16 and FLA7 genes. These genes play an important role in NaHCO3 stress. Our study showed that the interference expression of the PsnWRKY70 gene can enhance the tolerance of NaHCO3 in poplar.

1. Introduction

Plant growth and yield can be severely affected by various biotic and abiotic stresses such as high salinity, drought and extreme temperatures [1,2]. Plants have evolved complex regulatory networks in response to abiotic stress [3]. Transcription factor TFs often act as molecular switches in signaling networks [4]. The WRKY family is one of the largest transcription factor families (TFs) in plants and plays an important role in biotic and abiotic stress by regulating the expression of stress-responsive genes to increase plant adaptation and tolerance of environmental stress [2,5,6,7,8].
The roles of WRKYs in regulating abiotic stresses such as drought and salt stress have been reported [2,5,6,7,8]. GmWRKY54 positively regulates soybean drought tolerance by activating genes in abscisic acid and Ca2+ signaling pathways in soybean (Glycine max, Wm82) [9]. In Arabidopsis, WRKY46, WRKY54 and WRKY70 are involved in BR-regulated plant growth and drought response, as wrky46 wrky54 wrky70 triple mutants are defective in BR-regulated growth and are more tolerant to drought stress [10]. Overexpression of the transcription factor SlWRKY28 enhances the tolerance of poplar (Populus davidiana × P. bolleana) to alkaline stress [11]. In Arabidopsis, GhWRKY1-like acts as a positive regulator of drought tolerance and promotes ABA biosynthesis by directly interacting with the promoters of AtNCED2, AtNCED5, AtNCED6 and AtNCED9 [12]. WRKY70 protein belongs to the class III subfamily of the WRKY transcription factor superfamily and plays a key role in both biotic and abiotic stress regulatory networks in plants [13,14]. MfWRKY70 of Myrothamnus flabellifolia as a positive regulator of the abiotic stress response is a potential gene for improving plant drought and salt tolerance [15]. WRKY70 and WRKY54 regulate osmotic stress tolerance by regulating stomatal pore size in Arabidopsis [14]. A previous study identified 104 PtWRKY genes in poplar [16]. Overexpression of PtrWRKY19 in transgenic poplars resulted in a significant increase in pith diameter and a decrease in the expression level of lignin biosynthesis genes [17]. Overexpression of PtRWRKY40 in transgenic poplar can reduce the expression of SA related genes (PR1.1, PR2.1, PR5.9, CPR5 and SID2) and jasmonic acid (JA) related gene JAZ8, making it more sensitive to D. gregaria infection [18]. A salicylic acid induced PtrWRKY73 was found in (Populus trichocarpa). Overexpression of PtrWRKY73 in Arabidopsis improved resistance to biotrophic pathogens but decreased resistance to necrotrophic pathogens [19]. In poplar Populus trichocarpa, PtrWRKY75 promotes salicylic acid biosynthesis by activating the expression of the downstream PAL gene, reducing stomatal pore size and resisting drought stress with increasing plant water use efficiency [3]. PagWRKY75 can reduce the scavenging ability of reactive oxygen species and the accumulation of proline under stress and increase the water loss rate of leaves, thereby increasing the tolerance of plants to salt and osmosis [20]. PyWRKY75 significantly enhanced the uptake and accumulation of CD and the protective effects of antioxidant enzymes (POD, SOD, CAT and APX), non-enzymatic antioxidants (ASA and GSH) and osmotic adjustment substances (soluble sugar), thereby enhancing the high tolerance of poplar to CD stress [21]. The overexpression of C2H2 type II WRKY transcription factor PeWRKY31 from Populus tomentosa enhanced the salt tolerance of transgenic tobacco [22]. However, research on PsnWRKY70 regulating biotic stress and abiotic stress response is scant.
Poplar is an important afforestation and ornamental tree species in Northeast China which has an area of 765 hm2 saline-alkali land. The breeding of saline-alkali-resistant transgenic trees with genetic engineering could be an effective way to utilize saline-alkali land for afforestation. Our previous study showed that the obtained RE lines of PsnWRKY70 transgenic poplar have significantly improved salt tolerance [23]. The objective of this study is to further investigate the possibility of these transgenic lines growing in saline-alkali land. We tested the transgenic PsnWRKY70 poplar lines under treatment NaHCO3. The gene expressions of related genes were identified by transcriptome. Alkali damage index, growth and physiological parameters were recorded to evaluate the alkali tolerance of transgenic lines. Our results showed that the interference expression of the PsnWRKY70 gene could significantly improve the tolerance of NaHCO3 in poplar. Some saline-alkali resistant genes regulated by PsnWRKY70 were discovered by transcriptome. This study provides a reference for the molecular design and breeding of saline-alkali resistance in saline-alkali resistant poplar and other trees.

2. Results

2.1. PCR Validation of PsnWRKY70 Transgenic Poplar

PCR validation was performed on two-year-old transgenic overexpression OE1-OE3 lines. All three overexpression lines of OE1-OE3 amplified clear specific bands (Figure 1A). Similarly, all RE1-RE3 lines amplified clear specific bands (Figure 1B). Specific primers of kanamycin resistance gene nptII were used for the validation. Figure 1C showed that clear specific bands were amplified in OE and RE lines. This indicates that the genes of two-year-old transgenic lines propagated from cutting were stable.
The PsnWRKY70 expression levels of OE1, OE2, and OE3 were significantly up regulated compared with the WT lines. On the contrary, the PsnWRKY70 gene was significantly down-regulated in the interference expression lines RE1, RE2 and RE3. Among them, the expression level of OE1 line was the highest, which was 2.85 times that of WT; while the expression level of RE1 line was the lowest, which was 0.10 of that of WT (Figure 2).

2.2. Growth Performance of Transgenic Lines under NaHCO3 Stress

Under NaHCO3 stress, the tested lines showed different degrees of damage (Figure 3). On day 15, the leaves of the WT line and the PsnWRKY70 OE lines had more chlorosis and yellowing, and some leaves had fallen off; the alkali damage was serious. However, the PsnWRKY70 RE lines only saw a few leaves fall off, and alkali damage was slight.
The plant height at day 15 under NaHCO3 stress was investigated, and the net growth and relative height growth indexes were calculated. The results showed that there was no significant difference in plant height among the tested lines before NaHCO3 stress treatment. After NaHCO3 stress treatment, the net growth and relative growth of RE lines were not significantly different from those of WT; however, the net growth and relative growth of OE lines were significantly lower than those of WT (p < 0.05). The average net growth of OE lines was 0.64 times that of WT. The relative high growth of the OE3 line was only 0.48 (Table 1). Under NaHCO3 stress, the salt damage of RE lines had less of an effect on plant growth, while there was a more severe degree of salt damage for OE lines. The net growth rate was the slowest.

2.3. Alkali Damage Index

The alkali damage index of the tested lines was investigated at day 15 under NaHCO3 stress. The results showed that the alkali damage index of the RE line was lower than that of the WT and OE lines. The average alkali damage index of the RE lines was 11.77%, while the alkali damage indices of the WT and OE lines were as high as 23.90% and 33.78%. Among them, the alkali damage index of the RE1 lines was the lowest, which was only 11.37%, while the alkali damage index of OE2 was as high as 38.36% (Figure 4).

2.4. Net Photosynthetic Rate under NaHCO3 Stress

The net photosynthetic rate (Pn) of leaves at day 15 under NaHCO3 stress was determined. The Pn of the RE lines was significantly higher than that of the WT and OE lines under NaHCO3 stress at day 15. The mean was 3.74 and 5.01 times higher than that of the WT and OE lines, respectively. The Pn of RE3 lines can reach 10.23 µmol m−2s−1. However, the Pn of the OE lines was lower than that of the WT. OE2 had significantly lower than WT. This indicated that the net photosynthetic rate of WT and OE lines (especially OE2) was seriously affected by alkali stress, while the net photosynthetic rate of the RE line was less affected by alkali stress (Figure 5).

2.5. Physiological Parameters

SOD and POD activities were measured in each transgenic line of poplar. After NaHCO3 stress at day 15, POD activity was significantly higher in the RE line than in WT, while there was no significant difference in OE lines (Figure 6A). The SOD activity of the OE lines was significantly lower than WT, while there was no significant difference between RE lines and WT (Figure 6B). These results suggest that PsnWRKY70 negatively regulates the activities of SOD and POD under NaHCO3 stress and ultimately cause the accumulation of ROS in plants. Figure 6C shows the MDA content of the transgenic lines at day 15 under NaHCO3 stress. The MDA content of the OE lines was significantly higher than that of WT. The MDA content of the RE lines was lower than that of WT. The MDA content of RE3 was significantly lower than that of WT (p < 0.05). The results showed that the low expression of the PsnWRKY70 gene could reduce the accumulation of MDA and stabilize the cell membrane structure.

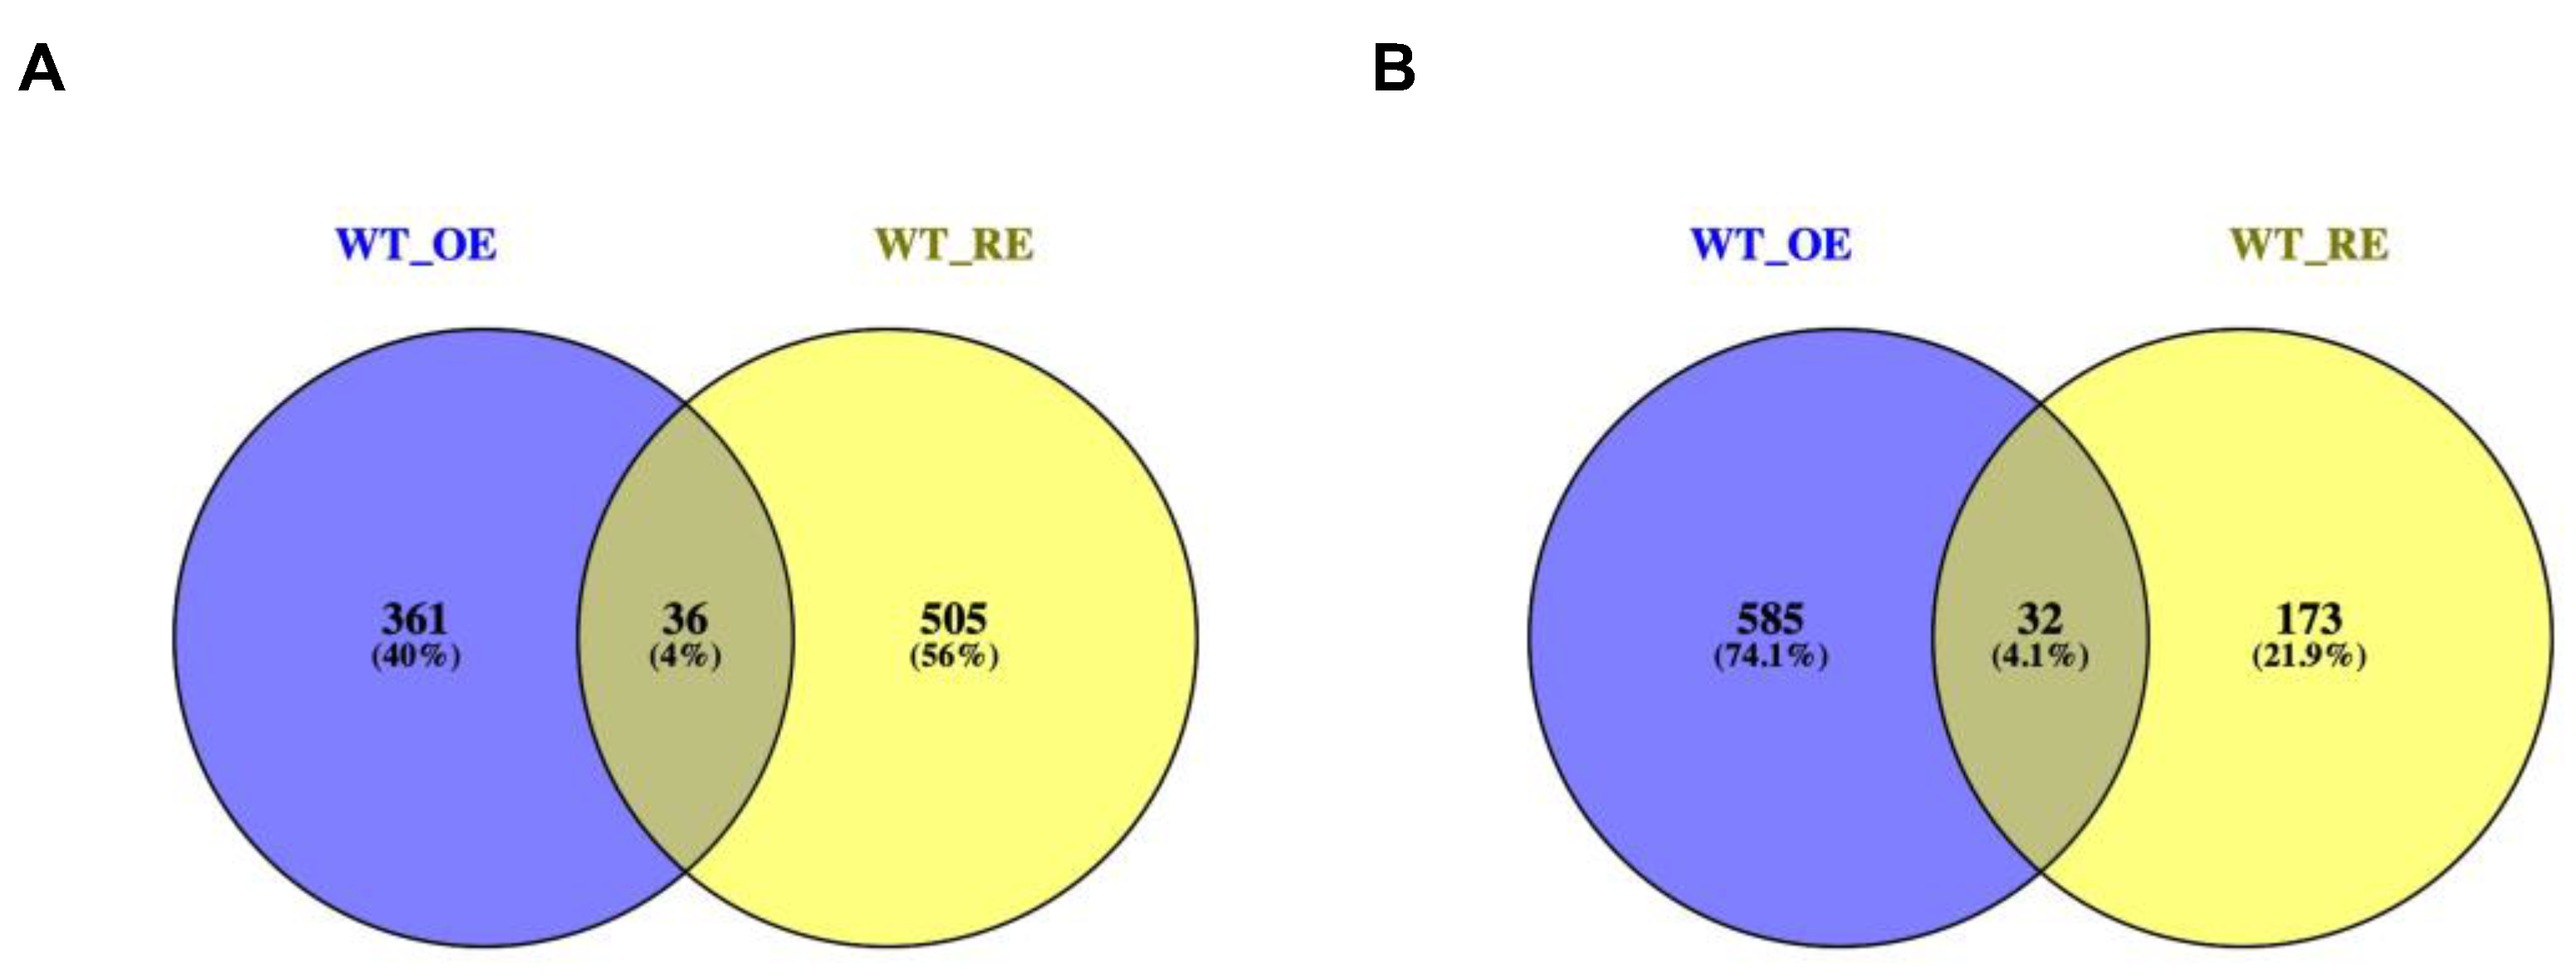
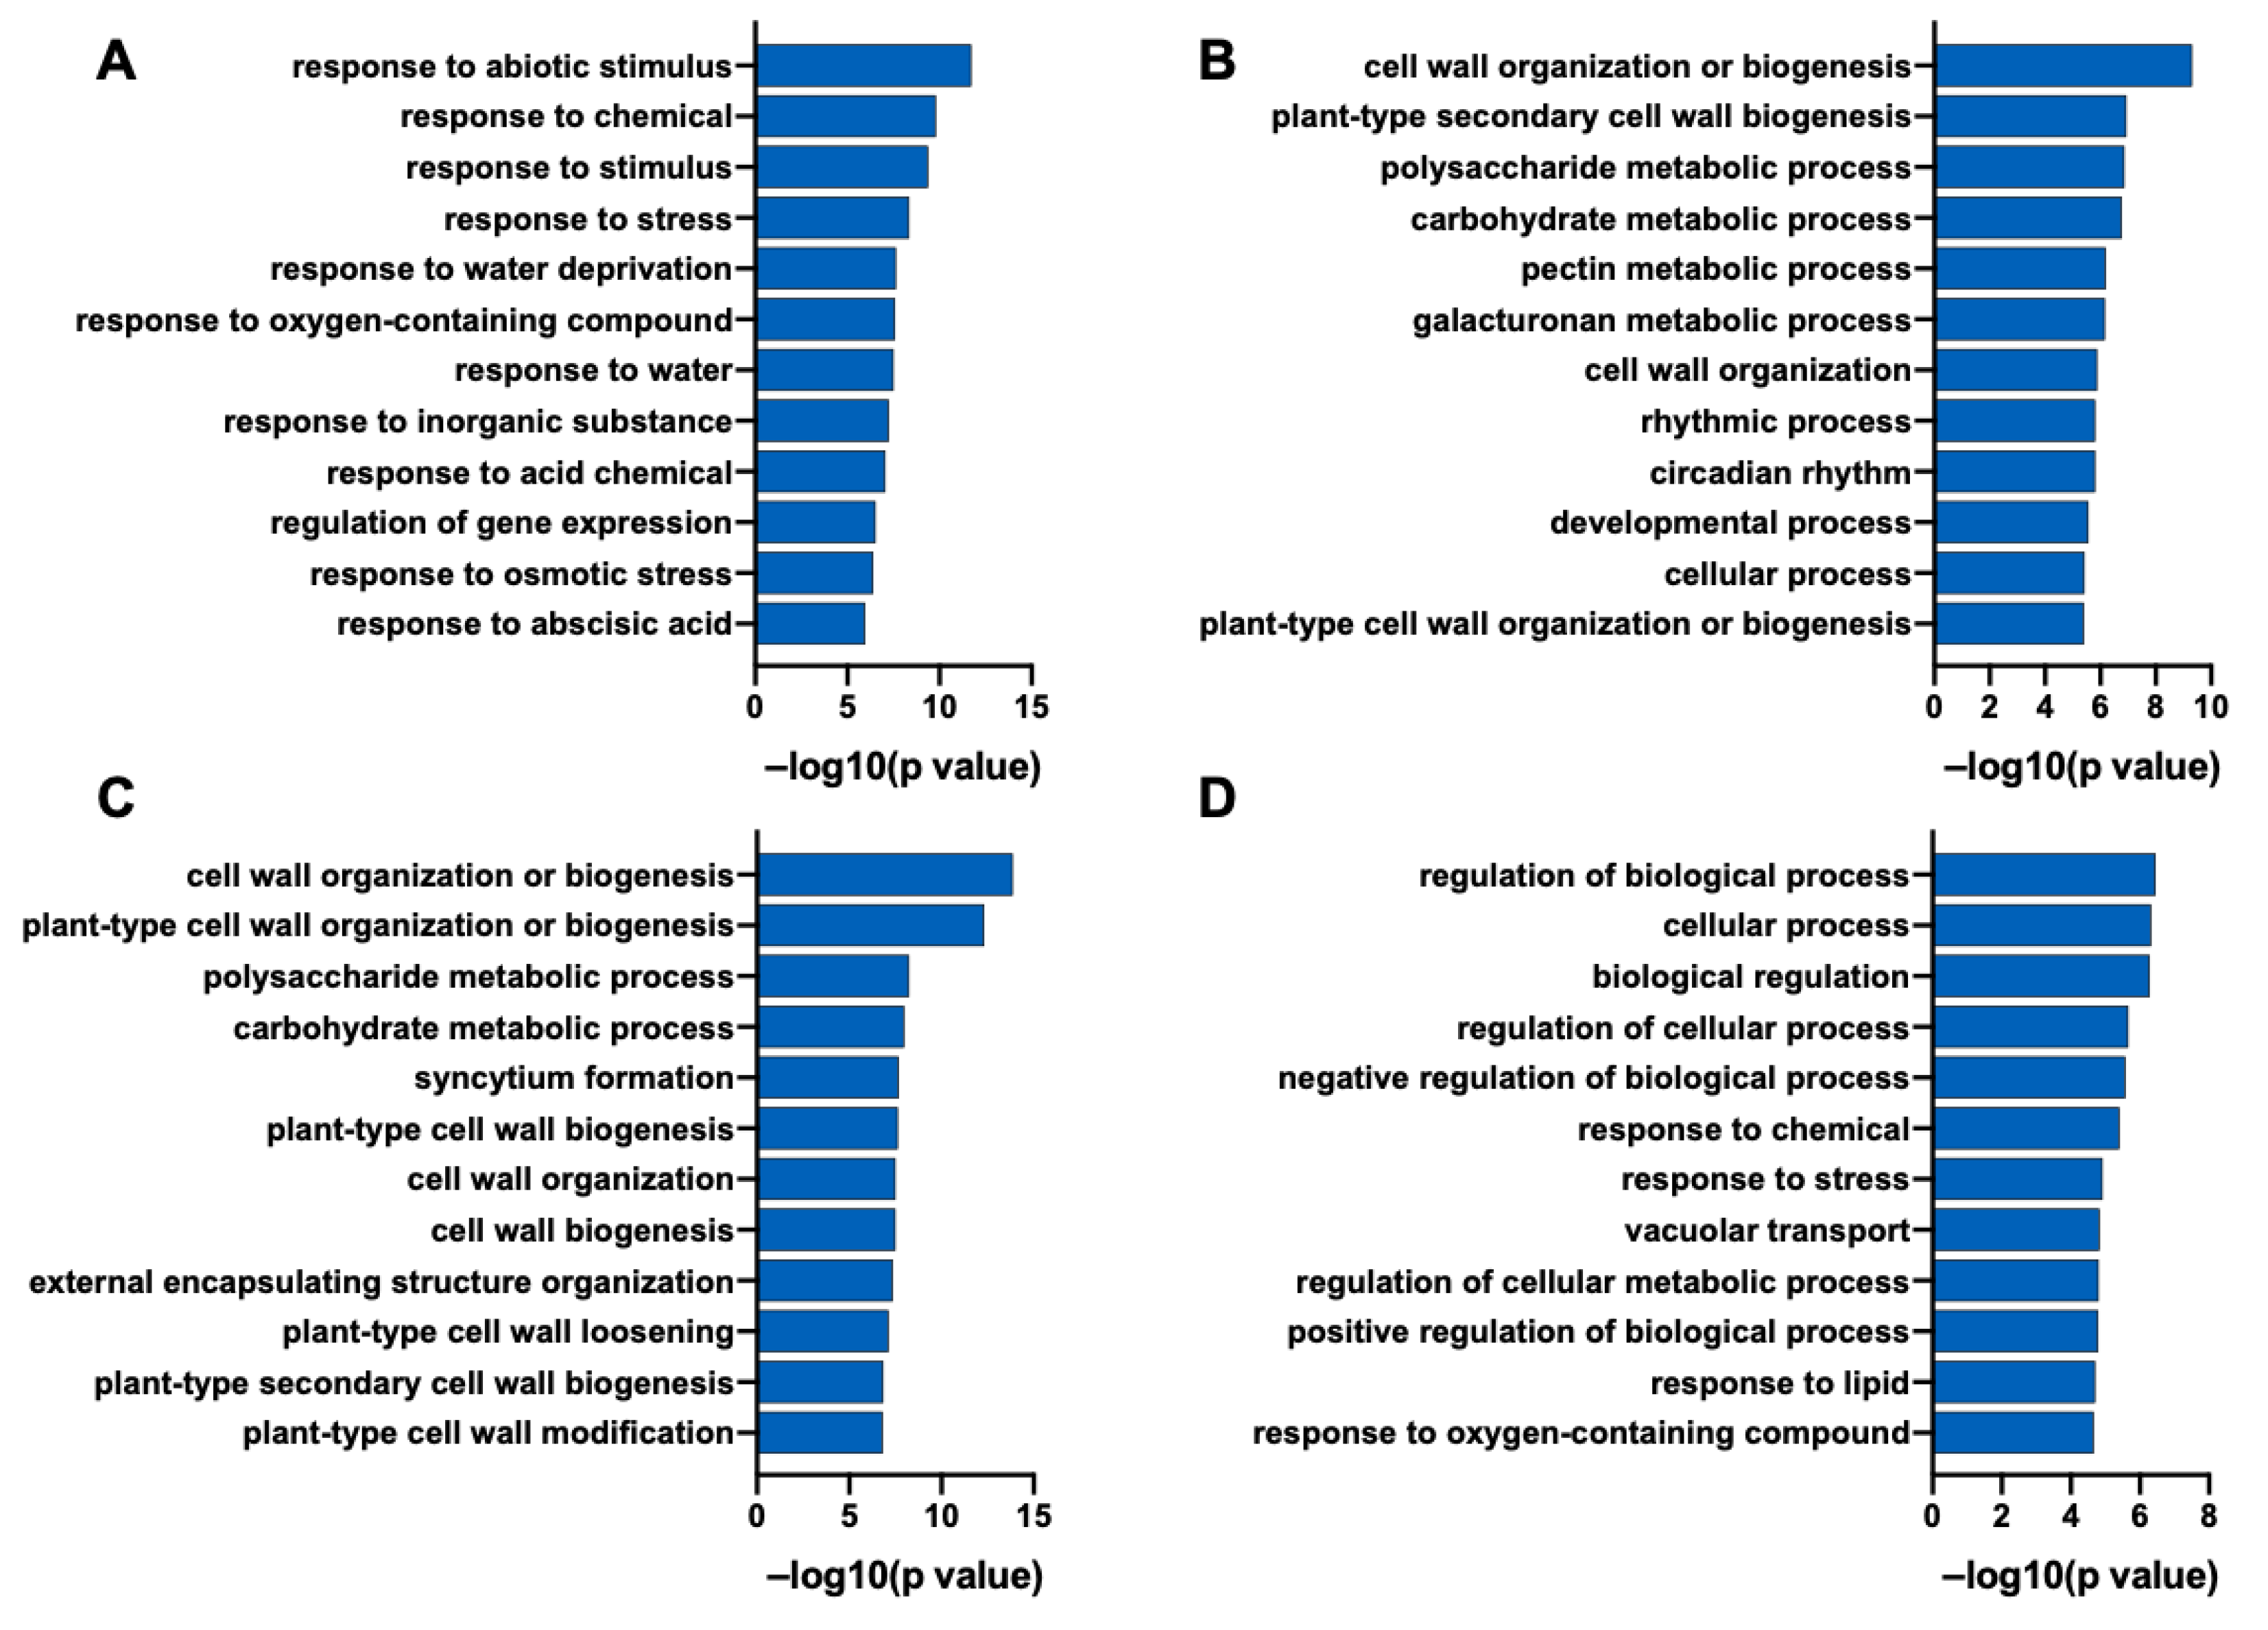
2.6. Transcriptome Analysis

To analyze changes in gene expression patterns, RNA-seq was performed using the fifth leaf of WT, OE1, and RE1 at day 15 under NaHCO3 stress. The thresholds of DEGs between OE vs. WT and RE vs. WT were used with a fold change ≥2 and a p-value < 0.05. The results showed that there were 361 and 505 exclusively upregulated DEGs in the OE and RE lines. There were 36 overlap DEGs between OE and RE (Figure 7A). There were 585 and 173 exclusively downregulated DEGs in the OE and RE lines. There were 32 overlap DEGs between OE and RE (Figure 7B).
To further analyze the molecular function of the PsnWRKY70 gene, GO enrichment analysis was performed based on identified DEGs (Figure 8). GO analysis showed that the 361 upregulated DEGs in OE lines were enriched in response to abiotic stimulus, in response to chemical, and in response to stimulus (Figure 8A). The 505 upregulated DEGs in RE lines were enriched in cell wall organization or biogenesis, the polysaccharide metabolic process, and the carbohydrate metabolic process (Figure 8C); GO analysis showed that the 585 downregulated DEGs in OE were enriched in cell wall organization or biogenesis, the polysaccharide metabolic process, and the carbohydrate metabolic process (Figure 8B). The 173 downregulated DEGs in RE were enriched in the regulation of the biological process and cellular process (Figure 8D). This suggests that the PsnWRKY70 regulation of biological processes plays an important role in response to NaHCO3 stress in poplar.

2.7. Expression of Genes Related to Cell Wall Tissue Biogenesis and Polysaccharide Metabolism

PsnWRKY70 transgenic RE lines showed their tolerance to NaHCO3 stress. Up-regulated genes of RE lines were enriched in the cell wall organization and biogenesis pathway (Figure 9). The cell wall organization includes expansions (expansion proteins are cell wall relaxing proteins with non-hydrolytic activity) EXPA8, EXPA4, EXPA3, EXPA1, EXPB3, EXP10; At the same time, pectin methylesterase PME53, PME34, ME36; XTH9, XTH6, XTH23; CESA1, CESA3, CES9; FLA11, FLA16, FLA7 and other genes were significantly up-regulated in RE lines. These results suggest that the changes in cell wall organization or biogenesis-related gene expression in RE lines play a crucial role in NaHCO3 tolerance.

3. Discussion

The WRKY family is one of the largest families of transcription factors and plays a crucial role in abiotic stress. Previous studies showed that different members of the WRKY family play different roles in response to abiotic stresses [24,25,26,27]. In Eriobotrya japonica, EjWRKY17 enhances drought resistance by reducing reactive oxygen species levels, closing stomata, and increasing the expression of drought resistance-related genes [24]. Overexpression of TaWRKY46 enhances osmotic tolerance by inducing the expression of some stress-related genes (P5CS1, RD29B, DREB2A, ABRE, CBF2, CBF3) in transgenic Arabidopsis [28]. Overexpression of GhWRKY1-like increases the drought tolerance of cotton by promoting ABA synthesis in Gossypium hirsutum [12]. However, some WRKY genes play a negative role in the plant response to abiotic stress. For example, overexpression of CaWRKY27 leads to decreased expression of most reactive oxygen species scavenging genes and ABA synthesis genes, which can make plants more sensitive to salinity and osmotic stress [29]. The down-regulated expression of GhWRKY6 and GhWRKY27a genes in cotton can increase the salinity and drought tolerance of plants [30]. The PalWRKY77 transcription factor negatively regulates salt tolerance in poplar. PalWRKY77 binds to the promoters of ABA and salt-induced genes PalNAC002 and PalRD26 to negatively regulate poplar abscisic acid signaling [31]. In this study, we showed that RE lines could enhance the antioxidant capacity of plants. RE lines suffered less membrane damage and less stress damage. Our results indicated that PsnWRKY70 plays a negative regulatory role in response to NaHCO3 stress. PsnWRKY70 gene interference expression RE lines enhanced the tolerance of plants to NaHCO3.
Expansin is a cell-wall-loosening protein known to disrupt hydrogen bonds between xyloglucan and cellulose microfibrils. The expression of expansin is increased in plants under various abiotic stresses and plays an important role in adaptation to these stresses [32]. Ectopic expression of wheat expansin gene TaEXPA2 improves the salt tolerance of transgenic tobacco (Nicotiana tabacum) by regulating Na+/K+ and antioxidant capacity [33]. Rice OsEXPA7 plays an important role in enhancing salt stress tolerance by coordinating sodium transport, ROS scavenging and cell wall loosening [34]. Our research shows that PsnWRKY70 negatively regulates the activities of SOD and POD under NaHCO3 stress, ultimately causing the accumulation of ROS in plants. This may be related to the significant upregulation of our cell expansion proteins EXPA8, EXPA4, EXPA3, EXPA1, EXPB3 and EXP10 in the RE lines. XTH Xyloglucan endotransglucosylase/hydrolase (XTH) family enzymes play an important role in the restructuring of cellulose microfibril load-bearing cross-links [35]. XTH can be involved in plant responses to abiotic stress by remodeling the cell wall. In pepper (Capsicum annuum), CaXTH1, CaXTH2 and CaXTH3 genes were up-regulated under drought, high salt and low temperature conditions and overexpression of CaXTH3 enhanced the tolerance of Arabidopsis and tomato to salt and drought stress [36,37]. XTH gene palisade tissue cells are highly dense and the intercellular space between mesophyll cells is reduced. In addition to the NaCl dilution effect, these anatomical changes increased the water-holding capacity of leaves, thereby reducing the salt concentration of fleshy tissues and mesophyll cells. PeXTHK gene in Populus euphratica can increase tolerance to salt stress in Arabidopsis [38]. In general, the XTH gene can improve the water holding capacity of the plant, thereby enhancing the salt tolerance of the plant. This is consistent with our experimental results that the upregulation of XTH9, XTH6 and XTH23 in RE lines may also lead to the water retention ability of plants and enhance the tolerance of poplar to NaHCO3. Transcriptome GO enrichment analysis found that the differential genes up-regulated in RE lines were significantly enriched in the cell wall organization or biogenesis process (Q-value < 0.05). Cell expansion proteins EXPA8, EXPA4, EXPA3, EXPA1, EXPB3, EXP10, PME53, PME34, PME36, XTH9, XTH6, XTH23, CESA1, CESA3, CES9, FLA11, FLA16, FLA7 genes were significantly up-regulated in RE lines. These results indicated that the changes of gene expression levels related to cell wall organization or the biogenesis process in RE lines played a crucial role in NaHCO3 stress tolerance. Therefore, PsnWRKY70 may regulate the expression of cell wall-related genes and enhance the salt-tolerance of plants under NaHCO3 stress. Our study provided novel insights into the molecular mechanisms underlying PsnWRKY70 regulation of the saline-alkali tolerance in poplar.

4. Materials and Methods

4.1. Plant Materials

Six PsnWRKY70 poplar (Populus simonii × Populus nigra) transgenic lines developed from our previous study [23] were used in this study. There were PsnWRKY70 overexpression (OE) lines OE1, OE2, OE3 and gene interference expression (RE) lines RE1, RE2, RE3. Wild type (WT) was used as control. Cuttings were collected from 2-year-old transgenic plants and planted in 30 × 36 cm pots in a greenhouse. The substrate was peat soil: river sand: black soil (v/v) = 2:2:1. Three-month-old seedlings were treated with NaHCO3 solution with a concentration of 200 mmol/L for 15 days, and seven plants of each line were irrigated with water. After 15 days, the NaHCO3 solution treatment was ended, and the follow-up routine management was adopted.

4.2. Molecular Validation of Transgenic Lines

The genomic DNA of poplar leaves was extracted with a DNAquick Plant System (TIANGEN BIOTECH, Beijing, China), and PsnWRKY70-F: 5′CACCATGGATTCTTCTTGGCATGGGAAT3′& PsnWRKY70-R: 5′AAATCCGAAAACACCATCATCATCG3′ were used as upstream and downstream primers for OE detection of overexpressed lines; PCR detection of RE lines was carried out with specific primers pRS300-F: 5′-CTGCAAGGCGATTAAGTTGGGTAAC-3′& pRS300-R: 5′-GCGGATAACAATTTCACACAGGAAACAG-3′ for RNAi expression vector; nptII-F: 5′-GGTGGAGAGGCTATTCGGCTATGA-3′& nptII-R: 5′-TGATATTCGGCAAGCAGGCATCG-3′ was used as a primer to carry out PCR detection on OE, RE and WT lines. Polymerase chain reaction (PCR) was performed in a 20 μL volume consisting of 10 μL 1.1 × T3 Super PCR Mix (Tsingke Biological Technology, China), 2 μL 10 10 μmolL–1 of primer, 7 μL deionized water, and 1 μL DNA template. The PCR program was run at 94 °C for 3 min for pre-denaturation, followed by 30 cycles (1 min at 94 °C, 1 min at 58 °C, and 20 s at 72 °C), and finally extended at 72 °C for 5 min. The amplified DNA fragments were electrophoresed on a 1% agarose gel.

4.3. PsnWRKY70 Gene Expression

Total RNA was extracted from leaves of OE, RE and WT lines using Universal Plant Total RNA Extraction Kit (Spin-column) I (BioTeke Corporation, Beijing, China). Double-stranded cDNA was synthesized separately with Toyobo Reverse Transcription Kit ReverTra Ace® qPCR RT Master Mix with gDNA Remover (Toyobo, Osaka, Japan). With poplar leaf cDNA as the template, PsnWRKY70-F: 5′-GGTAAGGACAGGAGAGGAT-3′, PsnWRKY70-R: 5′-CGTGATATGTTGTGCGGTAT-3′ as primers, we used a Toyobo SYBR® Green Real-time PCR Master Mix Plus in ABI. qRT-PCR was performed on an ABI-7500 quantitative PCR instrument. The relative expression was calculated by 2(−∆∆CT). The internal reference gene is 18S rRNA.

4.4. Plant Height and Leaf Alkali Damage Index

On the 15th day after the NaHCO3 stress treatment, plant heights were measured with a tower ruler, and their relative growth was calculated. During the stress process, the phenotypic changes of the plants were continually observed and photographed. The alkali damage index of the leaves of each line under NaHCO3 stress was counted on the 15th day of stress. Regarding the alkali damage grading standard system: grade 0, leaves were healthy; grade 1—yellowing areas were less than 20% of the total leaf area; grade 2—yellowing occurred in 50% of the total leaf area; grade 3—more than 80% of the total leaf areas appeared to be yellowing; grade 4—leaves died. Calculation of the leaf alkali damage index: LSI = [∑(si × Nsi) ∕(NsT × Gsmax)] × 100%. Si: different alkali damage grades (0~4), Nsi: the number of si grade alkali damage leaves per seedling, NsT: the total number of leaves per seedling, Gsmax: the highest alkali damage grade.

4.5. Physiological and Photosynthetic Parameters

The net photosynthetic rates of WT, OE and RE were measured using a Li-6400 portable photosynthesis instrument at 9:00–11:00 a.m. on the 15th day after stress. Three plants were measured for each line. The light intensity was set to 1000 μmoL·m−2·s−1, and the CO2 concentration was set to 400 μmoL·m−2·s−1. SOD activity, POD activity, and MDA content in leaves were determined using a Malondialdehyde Detection Kit (Nanjing Jiancheng Bioengineering Institute, Nanjing, China).

4.6. RNA-Seq Data Analysis

Total RNA was extracted from the whole leaves of WT, OE and RE transgenic plants using a Universal Plant Total RNA Extraction kit (BioTeke Corporation, Beijing, China) after NaHCO3 stress for 15 days. A NanoDrop 2000 was used to evaluate RNA purity and integrity. RNA samples were submitted to the Illumina X10 platform for high-throughput sequencing. The sequencing read length was 150 bp paired end reads. The original sequence reads were filtered to obtain high-quality clean reads before subsequent analysis. Clean reads were mapped to the Populus trichocarpa genome using hisat2 [39]. Stringtie software was used to count reads mapped to the genome [40]. DEseq2 was used for the significance analysis of differentially expressed genes (DEGs) (p < 0.05, Fold Change ≥2) [41]. DEGs were used for a gene ontology (GO) enrichment analysis using the GO enrichment tool (http://geneontology.org, accessed on 24 February 2021) with a p-value of less than 0.01 as the threshold for significant enrichment [42,43,44].

4.7. Statistical Analysis

All experiments were performed with three biological replicates. The mean was shown as the mean ± standard deviation (SD). The data were analyzed via one-way ANOVA using Duncan’s multiple range test (p < 0.05) in SPSS version 24.0.

Author Contributions

C.-P.Y., J.J., G.-F.L. and W.W. designed the experiment; W.W. and X.-D.B. performed the experiment; C.-R.G., X.-Y.Z. and K.C. performed RNA-seq data analysis; W.W. and J.J. wrote the manuscript; J.J. performed review and editing. All authors have read and agreed to the published version of the manuscript.

Funding

This research was funded by the Heilongjiang Touyan Innovation Team Program (Tree Genetics and Breeding Innovation Team).

Institutional Review Board Statement

Not applicable.

Informed Consent Statement

Not applicable.

Data Availability Statement

All RNA-seq data have been archived in the NCBI Sequence Read Archive (SRA), accession number PRJNA881620.

Acknowledgments

Thanks to Qibin Yu (Citrus Research and Education Center, University of Florida, Lake Alfred, FL, 33850, USA) for editing and revising the manuscript.

Conflicts of Interest

The authors declare no conflict of interest.

References

  1. Hennig, L. Plant gene regulation in response to abiotic stress. Biochim. Biophys. Acta 2012, 1819, 85. [Google Scholar] [CrossRef] [PubMed]
  2. He, L.; Wu, Y.H.; Zhao, Q.; Wang, B.; Liu, Q.L.; Zhang, L. Chrysanthemum DgWRKY2 Gene Enhances Tolerance to Salt Stress in Transgenic Chrysanthemum. Int. J. Mol. Sci. 2018, 19, 2062. [Google Scholar] [CrossRef] [PubMed] [Green Version]
  3. Zhang, Y.; Zhou, Y.; Zhang, D.; Tang, X.; Li, Z.; Shen, C.; Han, X.; Deng, W.; Yin, W.; Xia, X. PtrWRKY75 overexpression reduces stomatal aperture and improves drought tolerance by salicylic acid-induced reactive oxygen species accumulation in poplar. Environ. Exp. Bot. 2020, 176, 104117. [Google Scholar] [CrossRef]
  4. Leng, P.; Zhao, J. Transcription factors as molecular switches to regulate drought adaptation in maize. Theor. Appl. Genet. 2020, 133, 1455–1465. [Google Scholar] [CrossRef]
  5. Wang, X.; Zeng, J.; Li, Y.; Rong, X.; Sun, J.; Sun, T.; Li, M.; Wang, L.; Feng, Y.; Chai, R.; et al. Expression of TaWRKY44, a wheat WRKY gene, in transgenic tobacco confers multiple abiotic stress tolerances. Front. Plant Sci. 2015, 6, 615. [Google Scholar] [CrossRef] [PubMed] [Green Version]
  6. Ma, Q.; Xia, Z.; Cai, Z.; Li, L.; Cheng, Y.; Liu, J.; Nian, H. GmWRKY16 Enhances Drought and Salt Tolerance Through an ABA-Mediated Pathway in Arabidopsis thaliana. Front. Plant Sci. 2018, 9, 1979. [Google Scholar] [CrossRef] [Green Version]
  7. Jia, H.; Wang, C.; Wang, F.; Liu, S.; Li, G.; Guo, X. GhWRKY68 reduces resistance to salt and drought in transgenic Nicotiana benthamiana. PLoS ONE 2015, 10, e0120646. [Google Scholar] [CrossRef] [Green Version]
  8. Song, Y.; Li, J.; Sui, Y.; Han, G.; Zhang, Y.; Guo, S.; Sui, N. The sweet sorghum SbWRKY50 is negatively involved in salt response by regulating ion homeostasis. Plant Mol. Biol. 2020, 102, 603–614. [Google Scholar] [CrossRef]
  9. Wei, W.; Liang, D.W.; Bian, X.H.; Shen, M.; Xiao, J.H.; Zhang, W.K.; Ma, B.; Lin, Q.; Lv, J.; Chen, X.; et al. GmWRKY54 improves drought tolerance through activating genes in abscisic acid and Ca(2+) signaling pathways in transgenic soybean. Plant J. 2019, 100, 384–398. [Google Scholar] [CrossRef]
  10. Chen, J.; Nolan, T.M.; Ye, H.; Zhang, M.; Tong, H.; Xin, P.; Chu, J.; Chu, C.; Li, Z.; Yin, Y. Arabidopsis WRKY46, WRKY54, and WRKY70 Transcription Factors Are Involved in Brassinosteroid-Regulated Plant Growth and Drought Responses. Plant Cell 2017, 29, 1425–1439. [Google Scholar] [CrossRef] [Green Version]
  11. Wang, X.; Ajab, Z.; Liu, C.; Hu, S.; Liu, J.; Guan, Q. Overexpression of transcription factor SlWRKY28 improved the tolerance of Populus davidiana x P. bolleana to alkaline salt stress. BMC Genet. 2020, 21, 103. [Google Scholar] [CrossRef] [PubMed]
  12. Hu, Q.; Ao, C.; Wang, X.; Wu, Y.; Du, X. GhWRKY1-like, a WRKY transcription factor, mediates drought tolerance in Arabidopsis via modulating ABA biosynthesis. BMC Plant Biol. 2021, 21, 458. [Google Scholar] [CrossRef] [PubMed]
  13. Zhou, M.; Lu, Y.; Bethke, G.; Harrison, B.T.; Hatsugai, N.; Katagiri, F.; Glazebrook, J. WRKY70 prevents axenic activation of plant immunity by direct repression of SARD1. New Phytol. 2018, 217, 700–712. [Google Scholar] [CrossRef] [PubMed] [Green Version]
  14. Li, J.; Besseau, S.; Toronen, P.; Sipari, N.; Kollist, H.; Holm, L.; Palva, E.T. Defense-related transcription factors WRKY70 and WRKY54 modulate osmotic stress tolerance by regulating stomatal aperture in Arabidopsis. New Phytol. 2013, 200, 457–472. [Google Scholar] [CrossRef] [PubMed] [Green Version]
  15. Xiang, X.Y.; Chen, J.; Xu, W.X.; Qiu, J.R.; Song, L.; Wang, J.T.; Tang, R.; Chen, D.; Jiang, C.Z.; Huang, Z. Dehydration-Induced WRKY Transcriptional Factor MfWRKY70 of Myrothamnus flabellifolia Enhanced Drought and Salinity Tolerance in Arabidopsis. Biomolecules 2021, 11, 327. [Google Scholar] [CrossRef] [PubMed]
  16. He, H.; Dong, Q.; Shao, Y.; Jiang, H.; Zhu, S.; Cheng, B.; Xiang, Y. Genome-wide survey and characterization of the WRKY gene family in Populus trichocarpa. Plant Cell Rep. 2012, 31, 1199–1217. [Google Scholar] [CrossRef]
  17. Yang, L.; Zhao, X.; Yang, F.; Fan, D.; Jiang, Y.; Luo, K. PtrWRKY19, a novel WRKY transcription factor, contributes to the regulation of pith secondary wall formation in Populus trichocarpa. Sci. Rep. 2016, 6, 18643. [Google Scholar] [CrossRef] [Green Version]
  18. Karim, A.; Jiang, Y.; Guo, L.; Ling, Z.; Ye, S.; Duan, Y.; Li, C.; Luo, K. Isolation and characterization of a subgroup IIa WRKY transcription factor PtrWRKY40 from Populus trichocarpa. Tree Physiol. 2015, 35, 1129–1139. [Google Scholar] [CrossRef] [Green Version]
  19. Duan, Y.; Jiang, Y.; Ye, S.; Karim, A.; Ling, Z.; He, Y.; Yang, S.; Luo, K. PtrWRKY73, a salicylic acid-inducible poplar WRKY transcription factor, is involved in disease resistance in Arabidopsis thaliana. Plant Cell Rep. 2015, 34, 831–841. [Google Scholar] [CrossRef] [Green Version]
  20. Zhao, K.; Zhang, D.; Lv, K.; Zhang, X.; Cheng, Z.; Li, R.; Zhou, B.; Jiang, T. Functional characterization of poplar WRKY75 in salt and osmotic tolerance. Plant Sci. 2019, 289, 110259. [Google Scholar] [CrossRef]
  21. Wu, X.; Chen, Q.; Chen, L.; Tian, F.; Chen, X.; Han, C.; Mi, J.; Lin, X.; Wan, X.; Jiang, B.; et al. A WRKY transcription factor, PyWRKY75, enhanced cadmium accumulation and tolerance in poplar. Ecotoxicol. Environ. Saf. 2022, 239, 113630. [Google Scholar] [CrossRef] [PubMed]
  22. Yu, X.; Pan, Y.; Dong, Y.; Lu, B.; Zhang, C.; Yang, M.; Zuo, L. Cloning and overexpression of PeWRKY31 from Populus x euramericana enhances salt and biological tolerance in transgenic Nicotiana. BMC Plant Biol. 2021, 21, 80. [Google Scholar] [CrossRef] [PubMed]
  23. Zhao, H.; Jiang, J.; Li, K.; Liu, G. Populus simonii x Populus nigra WRKY70 is involved in salt stress and leaf blight disease responses. Tree Physiol. 2017, 37, 827–844. [Google Scholar] [CrossRef] [PubMed] [Green Version]
  24. Wang, D.; Chen, Q.; Chen, W.; Liu, X.; Xia, Y.; Guo, Q.; Jing, D.; Liang, G. A WRKY Transcription Factor, EjWRKY17, from Eriobotrya japonica Enhances Drought Tolerance in Transgenic Arabidopsis. Int. J. Mol. Sci. 2021, 22, 5593. [Google Scholar] [CrossRef]
  25. Wang, C.T.; Ru, J.N.; Liu, Y.W.; Li, M.; Zhao, D.; Yang, J.F.; Fu, J.D.; Xu, Z.S. Maize WRKY Transcription Factor ZmWRKY106 Confers Drought and Heat Tolerance in Transgenic Plants. Int. J. Mol. Sci. 2018, 19, 3046. [Google Scholar] [CrossRef] [Green Version]
  26. Niu, C.F.; Wei, W.; Zhou, Q.Y.; Tian, A.G.; Hao, Y.J.; Zhang, W.K.; Ma, B.; Lin, Q.; Zhang, Z.B.; Zhang, J.S.; et al. Wheat WRKY genes TaWRKY2 and TaWRKY19 regulate abiotic stress tolerance in transgenic Arabidopsis plants. Plant Cell Environ. 2012, 35, 1156–1170. [Google Scholar] [CrossRef]
  27. Zhu, H.; Zhou, Y.; Zhai, H.; He, S.; Zhao, N.; Liu, Q. A Novel Sweetpotato WRKY Transcription Factor, IbWRKY2, Positively Regulates Drought and Salt Tolerance in Transgenic Arabidopsis. Biomolecules 2020, 10, 506. [Google Scholar] [CrossRef] [Green Version]
  28. Li, X.; Tang, Y.; Zhou, C.; Zhang, L.; Lv, J. A Wheat WRKY Transcription Factor TaWRKY46 Enhances Tolerance to Osmotic Stress in transgenic Arabidopsis Plants. Int. J. Mol. Sci. 2020, 21, 1321. [Google Scholar] [CrossRef] [Green Version]
  29. Lin, J.; Dang, F.; Chen, Y.; Guan, D.; He, S. CaWRKY27 negatively regulates salt and osmotic stress responses in pepper. Plant Physiol. Biochem. 2019, 145, 43–51. [Google Scholar] [CrossRef]
  30. Li, Z.; Li, L.; Zhou, K.; Zhang, Y.; Han, X.; Din, Y.; Ge, X.; Qin, W.; Wang, P.; Li, F.; et al. GhWRKY6 Acts as a Negative Regulator in Both Transgenic Arabidopsis and Cotton During Drought and Salt Stress. Front. Genet. 2019, 10, 392. [Google Scholar] [CrossRef]
  31. Jiang, Y.; Tong, S.; Chen, N.; Liu, B.; Bai, Q.; Chen, Y.; Bi, H.; Zhang, Z.; Lou, S.; Tang, H.; et al. The PalWRKY77 transcription factor negatively regulates salt tolerance and abscisic acid signaling in Populus. Plant J. 2021, 105, 1258–1273. [Google Scholar] [CrossRef] [PubMed]
  32. Lu, P.; Kang, M.; Jiang, X.; Dai, F.; Gao, J.; Zhang, C. RhEXPA4, a rose expansin gene, modulates leaf growth and confers drought and salt tolerance to Arabidopsis. Planta 2013, 237, 1547–1559. [Google Scholar] [CrossRef] [PubMed]
  33. Chen, Y.; Han, Y.; Kong, X.; Kang, H.; Ren, Y.; Wang, W. Ectopic expression of wheat expansin gene TaEXPA2 improved the salt tolerance of transgenic tobacco by regulating Na+/K+ and antioxidant competence. Physiol. Plant 2017, 159, 161–177. [Google Scholar] [CrossRef] [PubMed]
  34. Jadamba, C.; Kang, K.; Paek, N.C.; Lee, S.I.; Yoo, S.C. Overexpression of Rice Expansin7 (Osexpa7) Confers Enhanced Tolerance to Salt Stress in Rice. Int. J. Mol. Sci. 2020, 21, 454. [Google Scholar] [CrossRef] [Green Version]
  35. Xu, P.; Fang, S.; Chen, H.; Cai, W. The brassinosteroid-responsive xyloglucan endotransglucosylase/hydrolase 19 (XTH19) and XTH23 genes are involved in lateral root development under salt stress in Arabidopsis. Plant J. 2020, 104, 59–75. [Google Scholar] [CrossRef] [PubMed]
  36. Cho, S.K.; Kim, J.E.; Park, J.A.; Eom, T.J.; Kim, W.T. Constitutive expression of abiotic stress-inducible hot pepper CaXTH3, which encodes a xyloglucan endotransglucosylase/hydrolase homolog, improves drought and salt tolerance in transgenic Arabidopsis plants. FEBS Lett. 2006, 580, 3136–3144. [Google Scholar] [CrossRef] [PubMed] [Green Version]
  37. Choi, J.Y.; Seo, Y.S.; Kim, S.J.; Kim, W.T.; Shin, J.S. Constitutive expression of CaXTH3, a hot pepper xyloglucan endotransglucosylase/hydrolase, enhanced tolerance to salt and drought stresses without phenotypic defects in tomato plants (Solanum lycopersicum cv. Dotaerang). Plant Cell Rep. 2011, 30, 867–877. [Google Scholar] [CrossRef]
  38. Han, Y.; Wang, W.; Sun, J.; Ding, M.; Zhao, R.; Deng, S.; Wang, F.; Hu, Y.; Wang, Y.; Lu, Y.; et al. Populus euphratica XTH overexpression enhances salinity tolerance by the development of leaf succulence in transgenic tobacco plants. J. Exp. Bot. 2013, 64, 4225–4238. [Google Scholar] [CrossRef] [Green Version]
  39. Pertea, M.; Kim, D.; Pertea, G.M.; Leek, J.T.; Salzberg, S.L. Transcript-level expression analysis of RNA-seq experiments with HISAT, StringTie and Ballgown. Nat. Protoc. 2016, 11, 1650–1667. [Google Scholar] [CrossRef]
  40. Pertea, M.; Pertea, G.M.; Antonescu, C.M.; Chang, T.C.; Mendell, J.T.; Salzberg, S.L. StringTie enables improved reconstruction of a transcriptome from RNA-seq reads. Nat. Biotechnol. 2015, 33, 290–295. [Google Scholar] [CrossRef]
  41. Love, M.I.; Huber, W.; Anders, S. Moderated estimation of fold change and dispersion for RNA-seq data with DESeq2. Genome. Biol. 2014, 15, 550. [Google Scholar] [CrossRef] [PubMed] [Green Version]
  42. Ashburner, M.; Ball, C.A.; Blake, J.A.; Botstein, D.; Butler, H.; Cherry, J.M.; Davis, A.P.; Dolinski, K.; Dwight, S.S.; Eppig, J.T.; et al. Gene ontology: Tool for the unification of biology. The Gene Ontology Consortium. Nat. Genet. 2000, 25, 25–29. [Google Scholar] [CrossRef] [PubMed] [Green Version]
  43. Gene Ontology, C. The Gene Ontology resource: Enriching a GOld mine. Nucleic Acids Res. 2021, 49, D325–D334. [Google Scholar] [CrossRef] [PubMed]
  44. Mi, H.; Muruganujan, A.; Ebert, D.; Huang, X.; Thomas, P.D. PANTHER version 14: More genomes, a new PANTHER GO-slim and improvements in enrichment analysis tools. Nucleic Acids Res. 2019, 47, D419–D426. [Google Scholar] [CrossRef] [PubMed]
Figure 1. PCR analysis of the transgenic lines and WT lines. (A) Specific primers PsnWRKY70-F and PsnWRKY70-R for amplifying the full length of PsnWRKY70 ORF, overexpression positive plasmid (lane 1), WT lines DNA (lane 2), water (lane 3), OE1 (lane 4), OE2 (lane 5), OE3 (lane 6). (B) PsnWRKY70 interference specific primers pRS300-F/pRS300-R, lPsnWRKY70 interference expression positive plasmid (lane 1), WT lines DNA (lane 2), water (lane 3), RE1 (lane 4), RE2 (lane 5), RE3 (lane 6). (C) Primers nptII-F and nptII-R, DL2000 DNA marker (M), PsnWRKY70 overexpression positive plasmid (lane 1), WT (lane 2), water (lane 3), OE1 (lane 4), OE2 (lane 5), OE3 (lane 6), RE1 (lane 7), RE2 (lane 8), RE3 (lane 9).
Ijms 23 13086 g001
Figure 2. The expression levels of PsnWRKY70 in leaves of transgenic and WT lines in poplar. The means and standard errors were calculated with six replications. Multiple comparison was used via Duncan test. Different letters indicate significant differences (p < 0.05).
Ijms 23 13086 g002
Figure 3. Phenotypic images among poplar transgenic and WT lines at day 15 under NaHCO3 stress treatment.
Ijms 23 13086 g003
Figure 4. The difference of leaf alkali injury indexes among poplar transgenic and WT lines under NaHCO3 stress treatment. The means and standard errors were calculated with six replications (p < 0.05). Multiple comparison was used via Duncan test. Different letters indicate significant differences.
Ijms 23 13086 g004
Figure 5. The difference of net photosynthesis rate among poplar transgenic and WT leaves under NaHCO3 stress treatment. The means and standard errors were calculated with three replications (p < 0.05). Multiple comparison was used via Duncan test. Different letters indicate significant differences.
Ijms 23 13086 g005
Figure 6. The difference of physiological indexes among poplar transgenic lines under NaHCO3 stress. (A) SOD activity of transgenic lines. (B) SOD activity of transgenic lines. (C) MDA content of different transgenic lines. The means and standard errors were calculated with three replications (p < 0.05). Multiple comparison was used via Duncan test. Different letters indicate significant differences.
Ijms 23 13086 g006
Figure 7. A Venn diagram of the number of differentially expressed genes. (A) Upregulated DEGs between OE and RE. (B) Downregulated DEGs between OE and RE.
Ijms 23 13086 g007
Figure 8. A GO enrichment analysis of DEGs in PsnWRKY70 transgenic poplar. (A) A GO enrichment analysis of uniquely upregulated genes in OE lines. (B) A GO enrichment analysis of uniquely downregulated genes in OE lines. (C) A GO enrichment analysis of uniquely upregulated genes in RE lines. (D) A GO enrichment analysis of uniquely downregulated genes in RE lines.
Ijms 23 13086 g008
Figure 9. The expression of genes related to cell wall tissue biogenesis and polysaccharide metabolism in poplar.
Ijms 23 13086 g009
Table 1. The difference of plant height growth among OE, RE and WT lines under NaHCO3 stress treatment.
LinesPlant Height (cm)Net Growth (cm)Relative Growth
Stress Day 0Stress Day 15
WT60.71 ± 7.52 c 112.00 ± 10.21 a51.29 ± 11.01 a0.86 ± 0.23 a
OE172.67 ± 10.23 abc114.17 ± 10.76 a41.50 ± 6.69 bc0.58 ± 0.14 bc
OE279.33 ± 8.82 a116.50 ± 2.88 a37.17 ± 9.52 c0.48 ± 0.17 c
OE369.17 ± 8.28 abc110.33 ± 12.75 a41.17 ± 6.94 bc0.60 ± 0.10 bc
RE168.50 ± 11.96 abc114.83 ± 7.00 a46.33 ± 6.15 abc0.71 ± 0.25 abc
RE273.75 ± 12.89 ab119.13 ± 8.36 a45.38 ± 6.63 abc0.65 ± 0.24 abc
RE366.25 ± 9.10 bc116.13 ± 8.71 a49.88 ± 6.64 ab0.77 ± 0.20 ab
Net growth (cm) was the difference between plant height (cm) at 15 days and 0 days under NaHCO3 stress treatment. Relative growth was the ratio of net growth (cm) and plant height (cm) at 0 day. Data indicate means ± STDEV (n = 10, p < 0.05). Multiple comparison was used by Duncan test. Different letters indicate significant differences.
Publisher’s Note: MDPI stays neutral with regard to jurisdictional claims in published maps and institutional affiliations.

