
Fecal Luminal Factors from Patients with Gastrointestinal Diseases Alter Gene Expression Profiles in Caco-2 Cells and Colonoids
 , , and
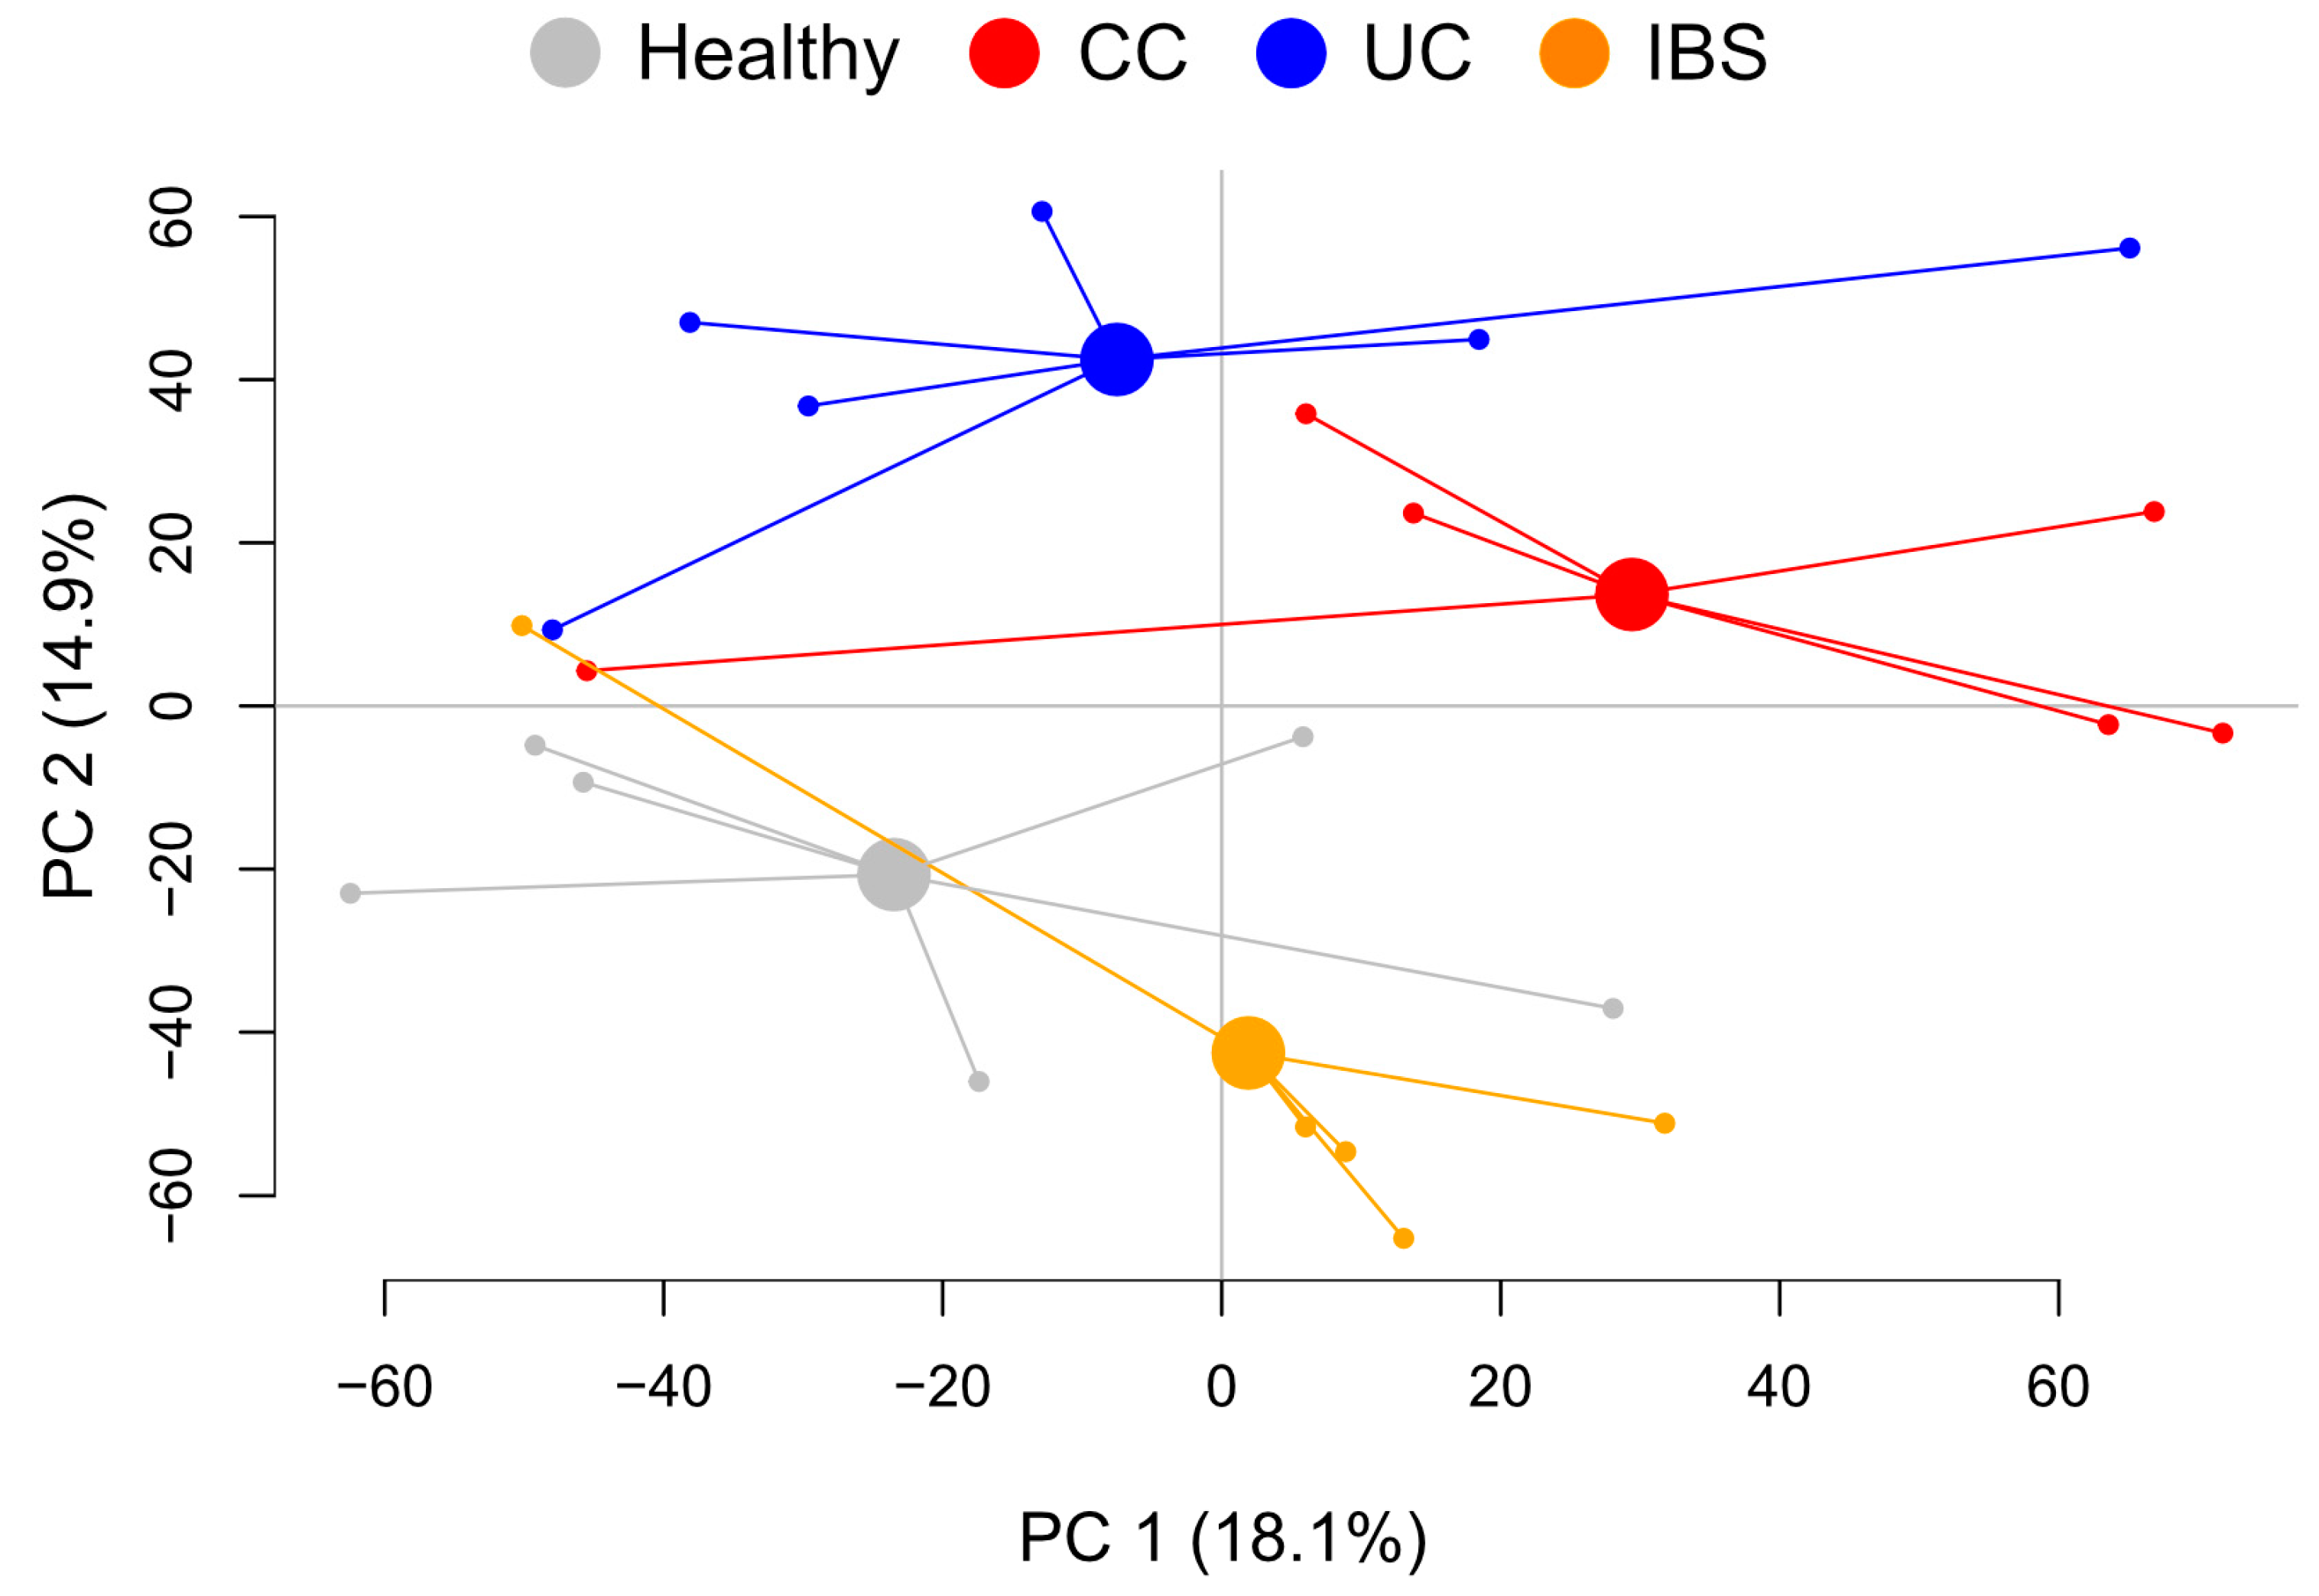
Abstract
:1. Introduction
2. Results
2.1. Study Subjects
2.2. Metabolite Profiles from Fecal Supernatants Distinguish between Patient Groups and Healthy Subjects
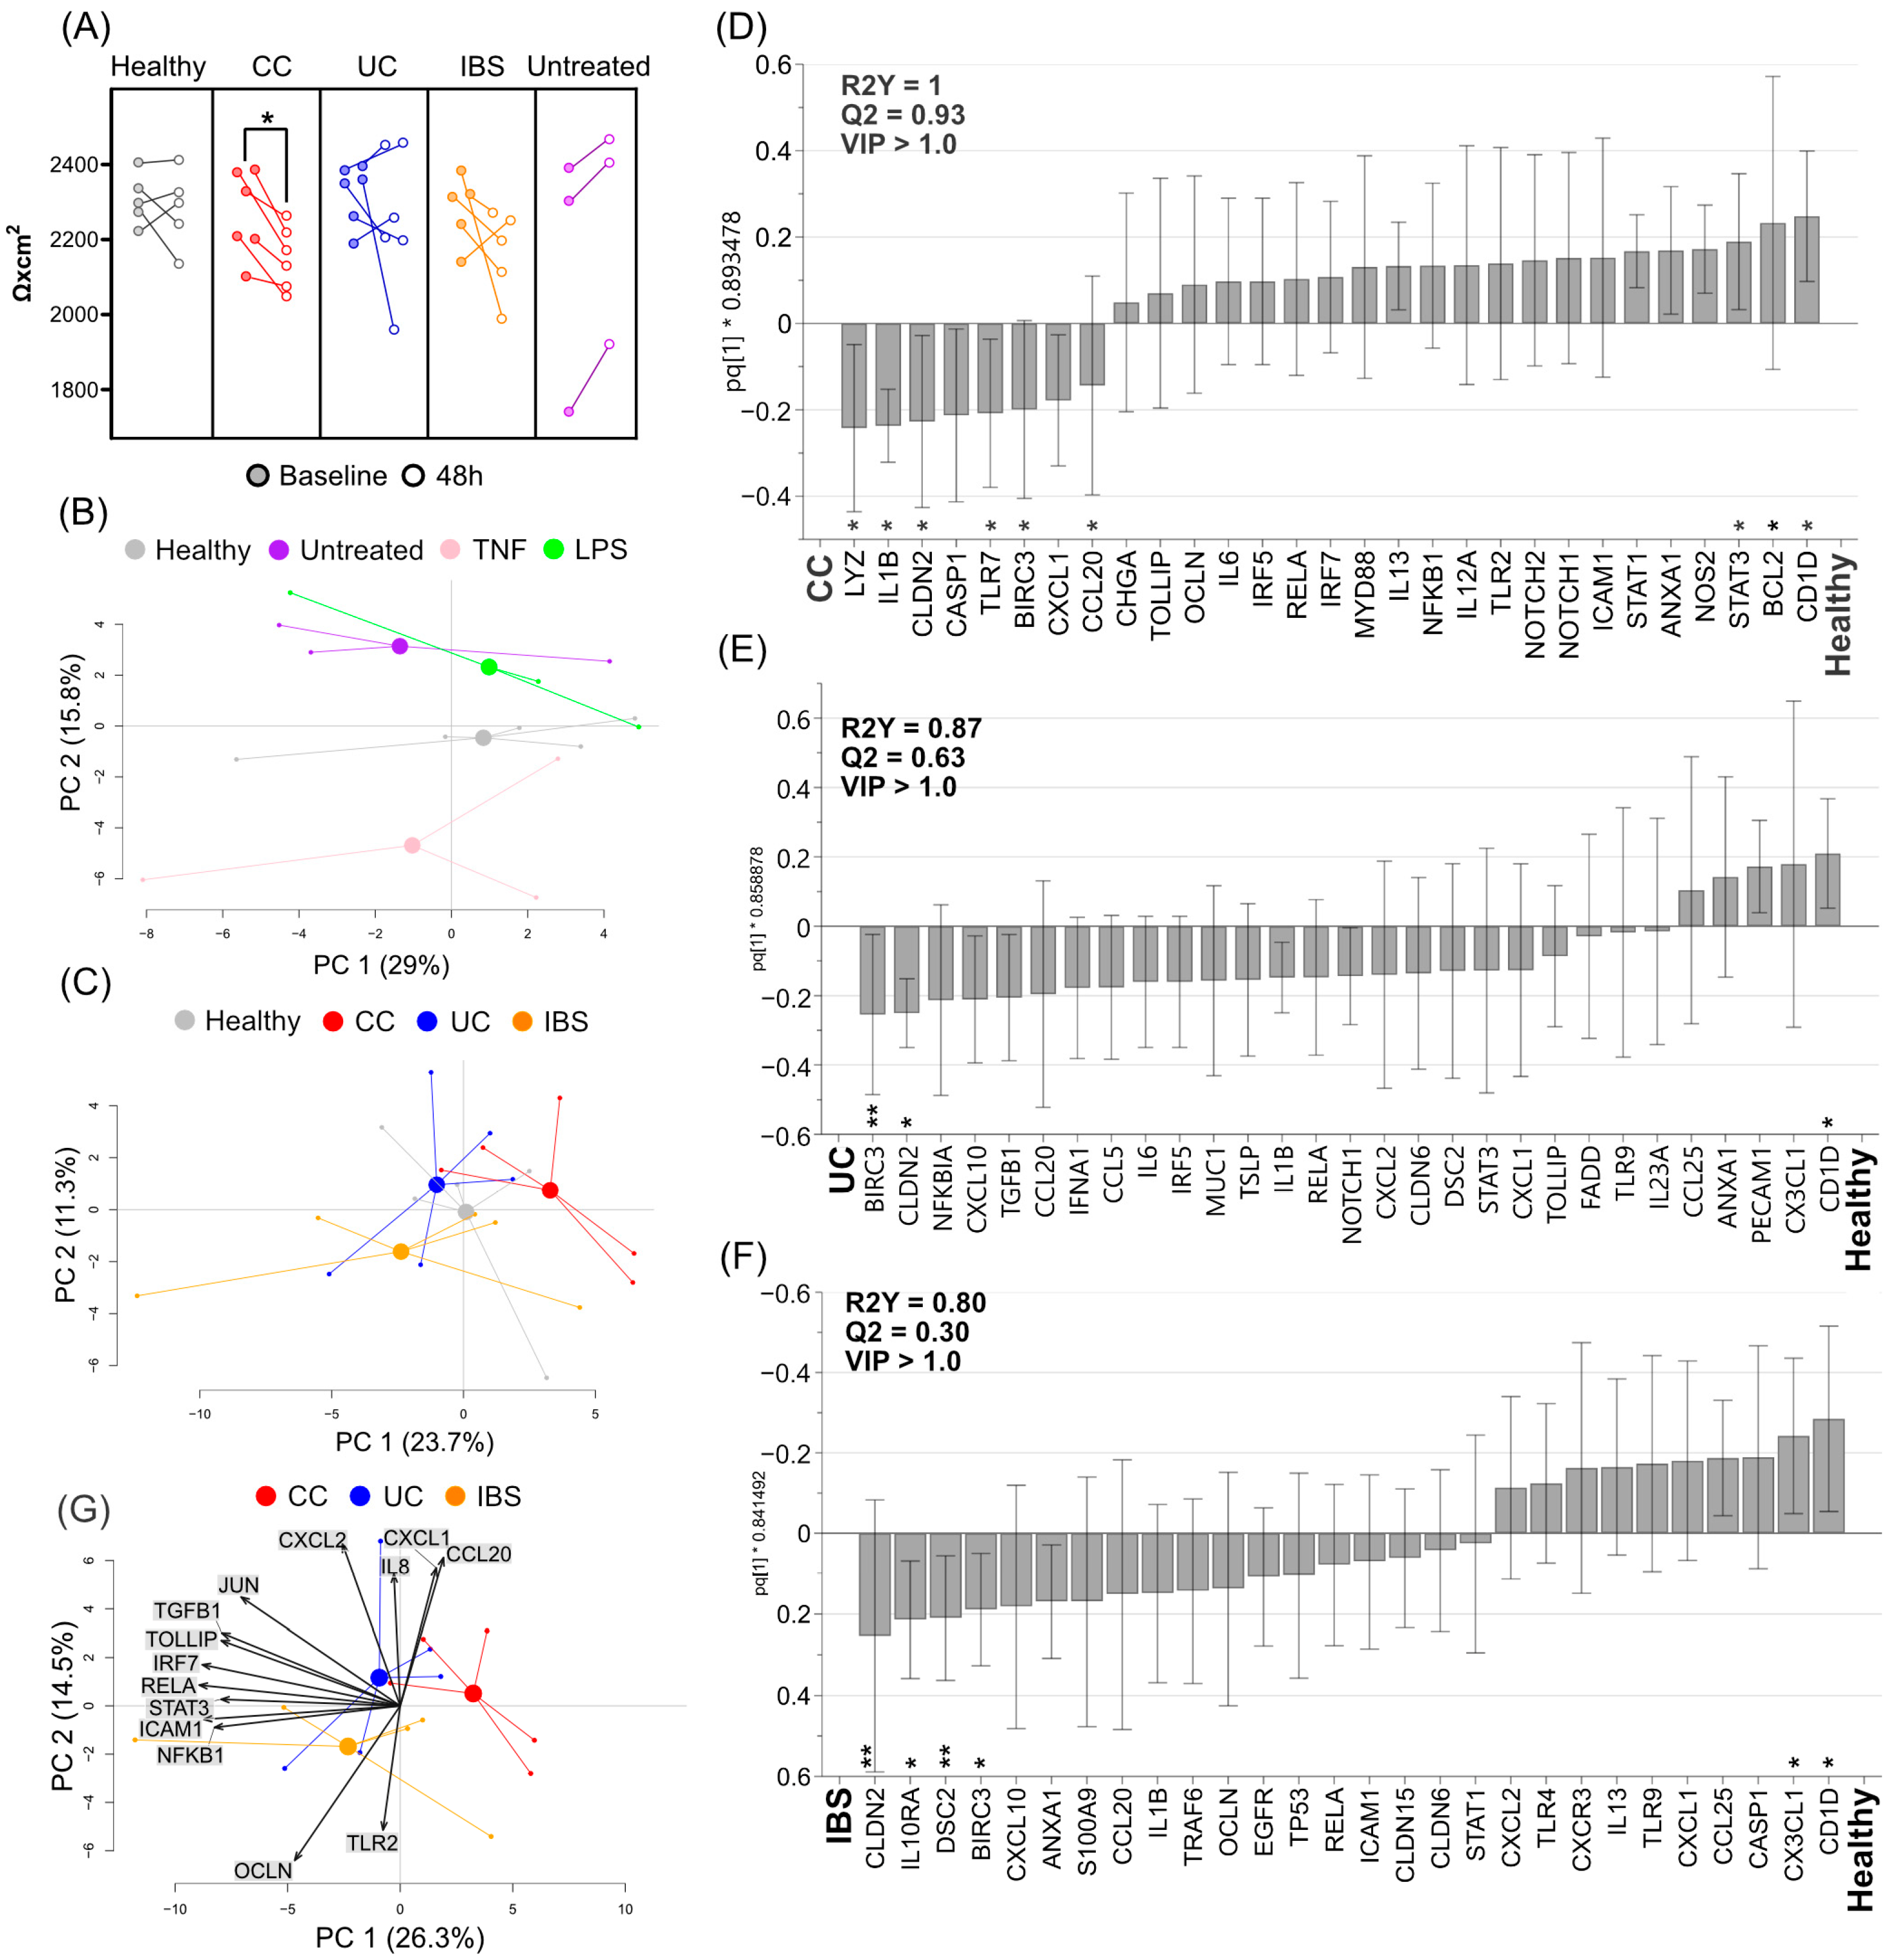
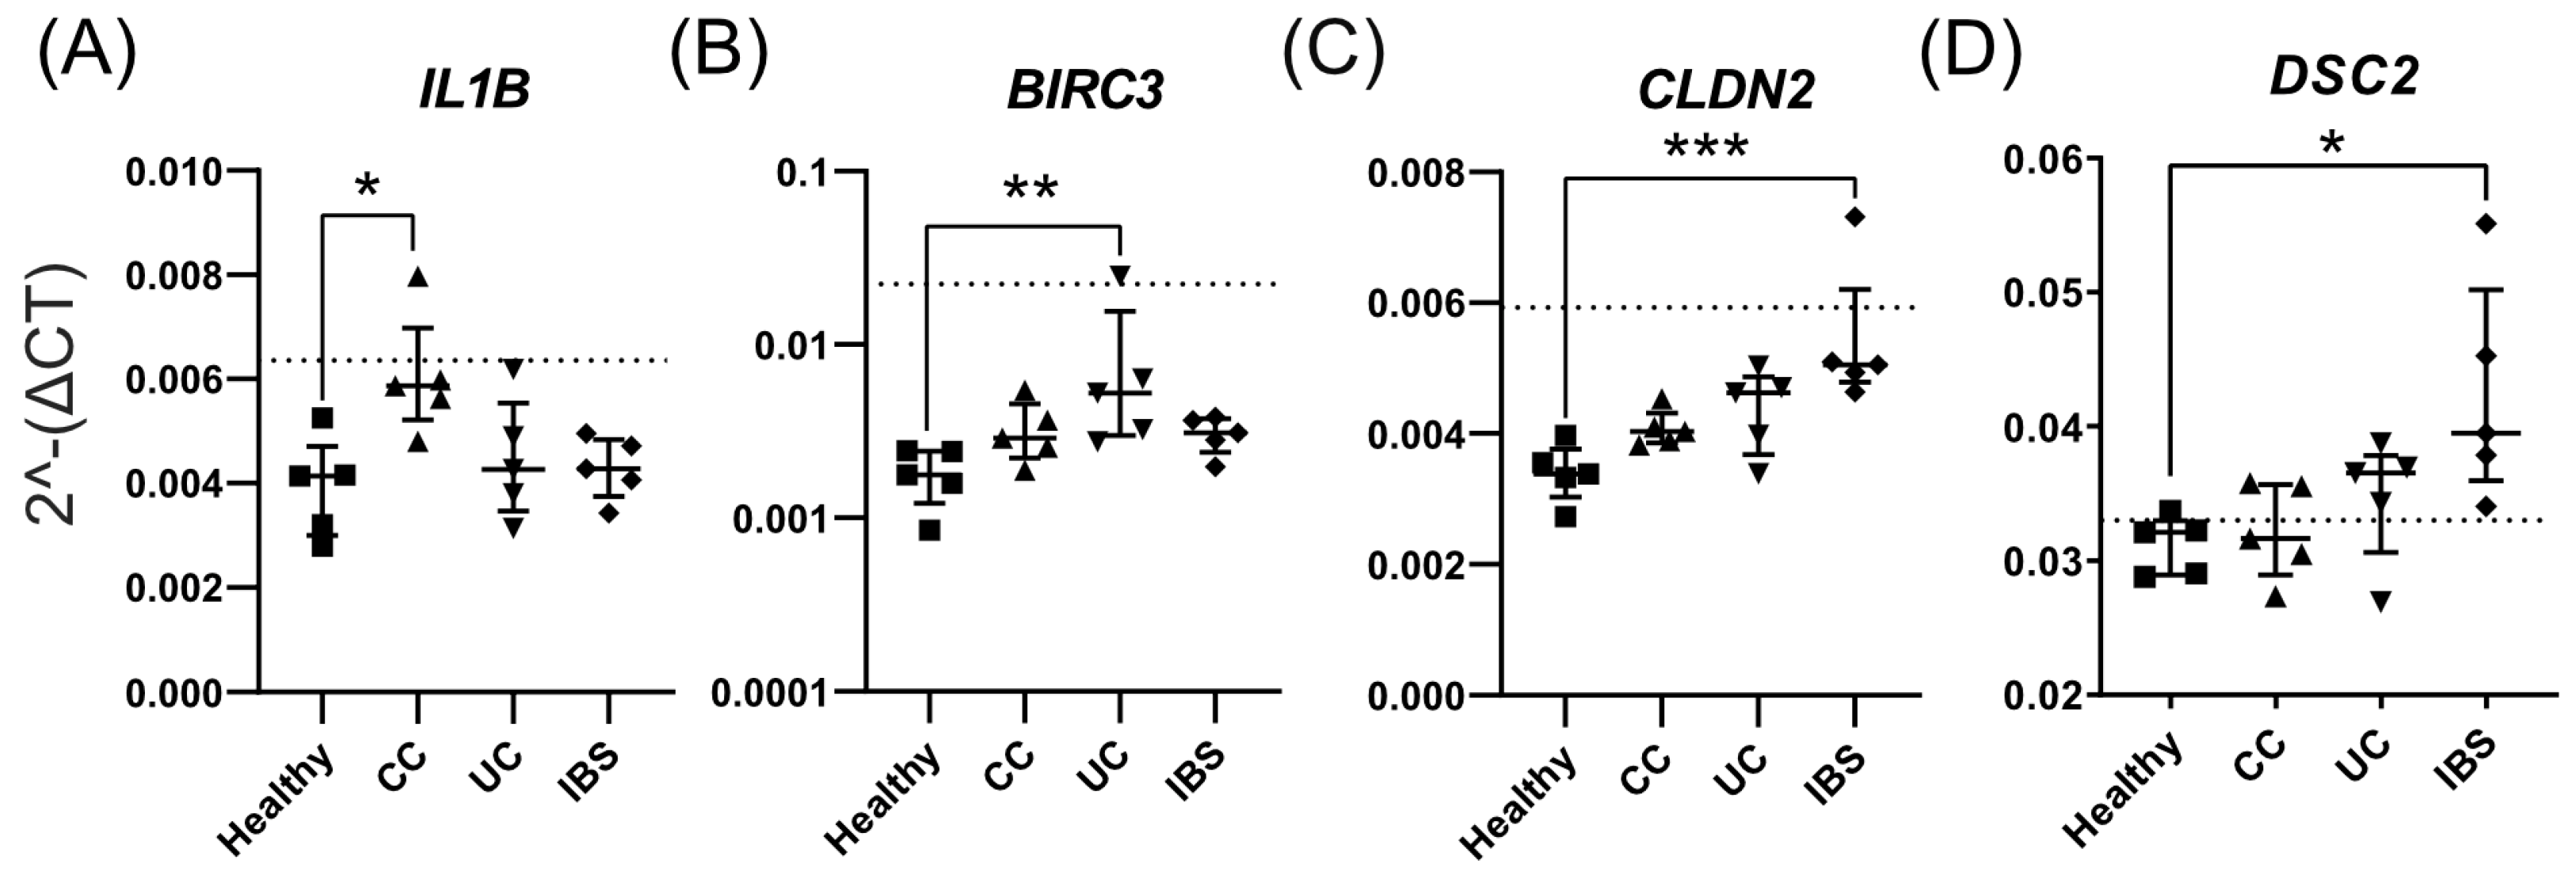
2.3. Fecal Supernatants from Patient Groups and Healthy Subjects Alter Gene Expression Profiles of Caco-2 Monolayer Cultures
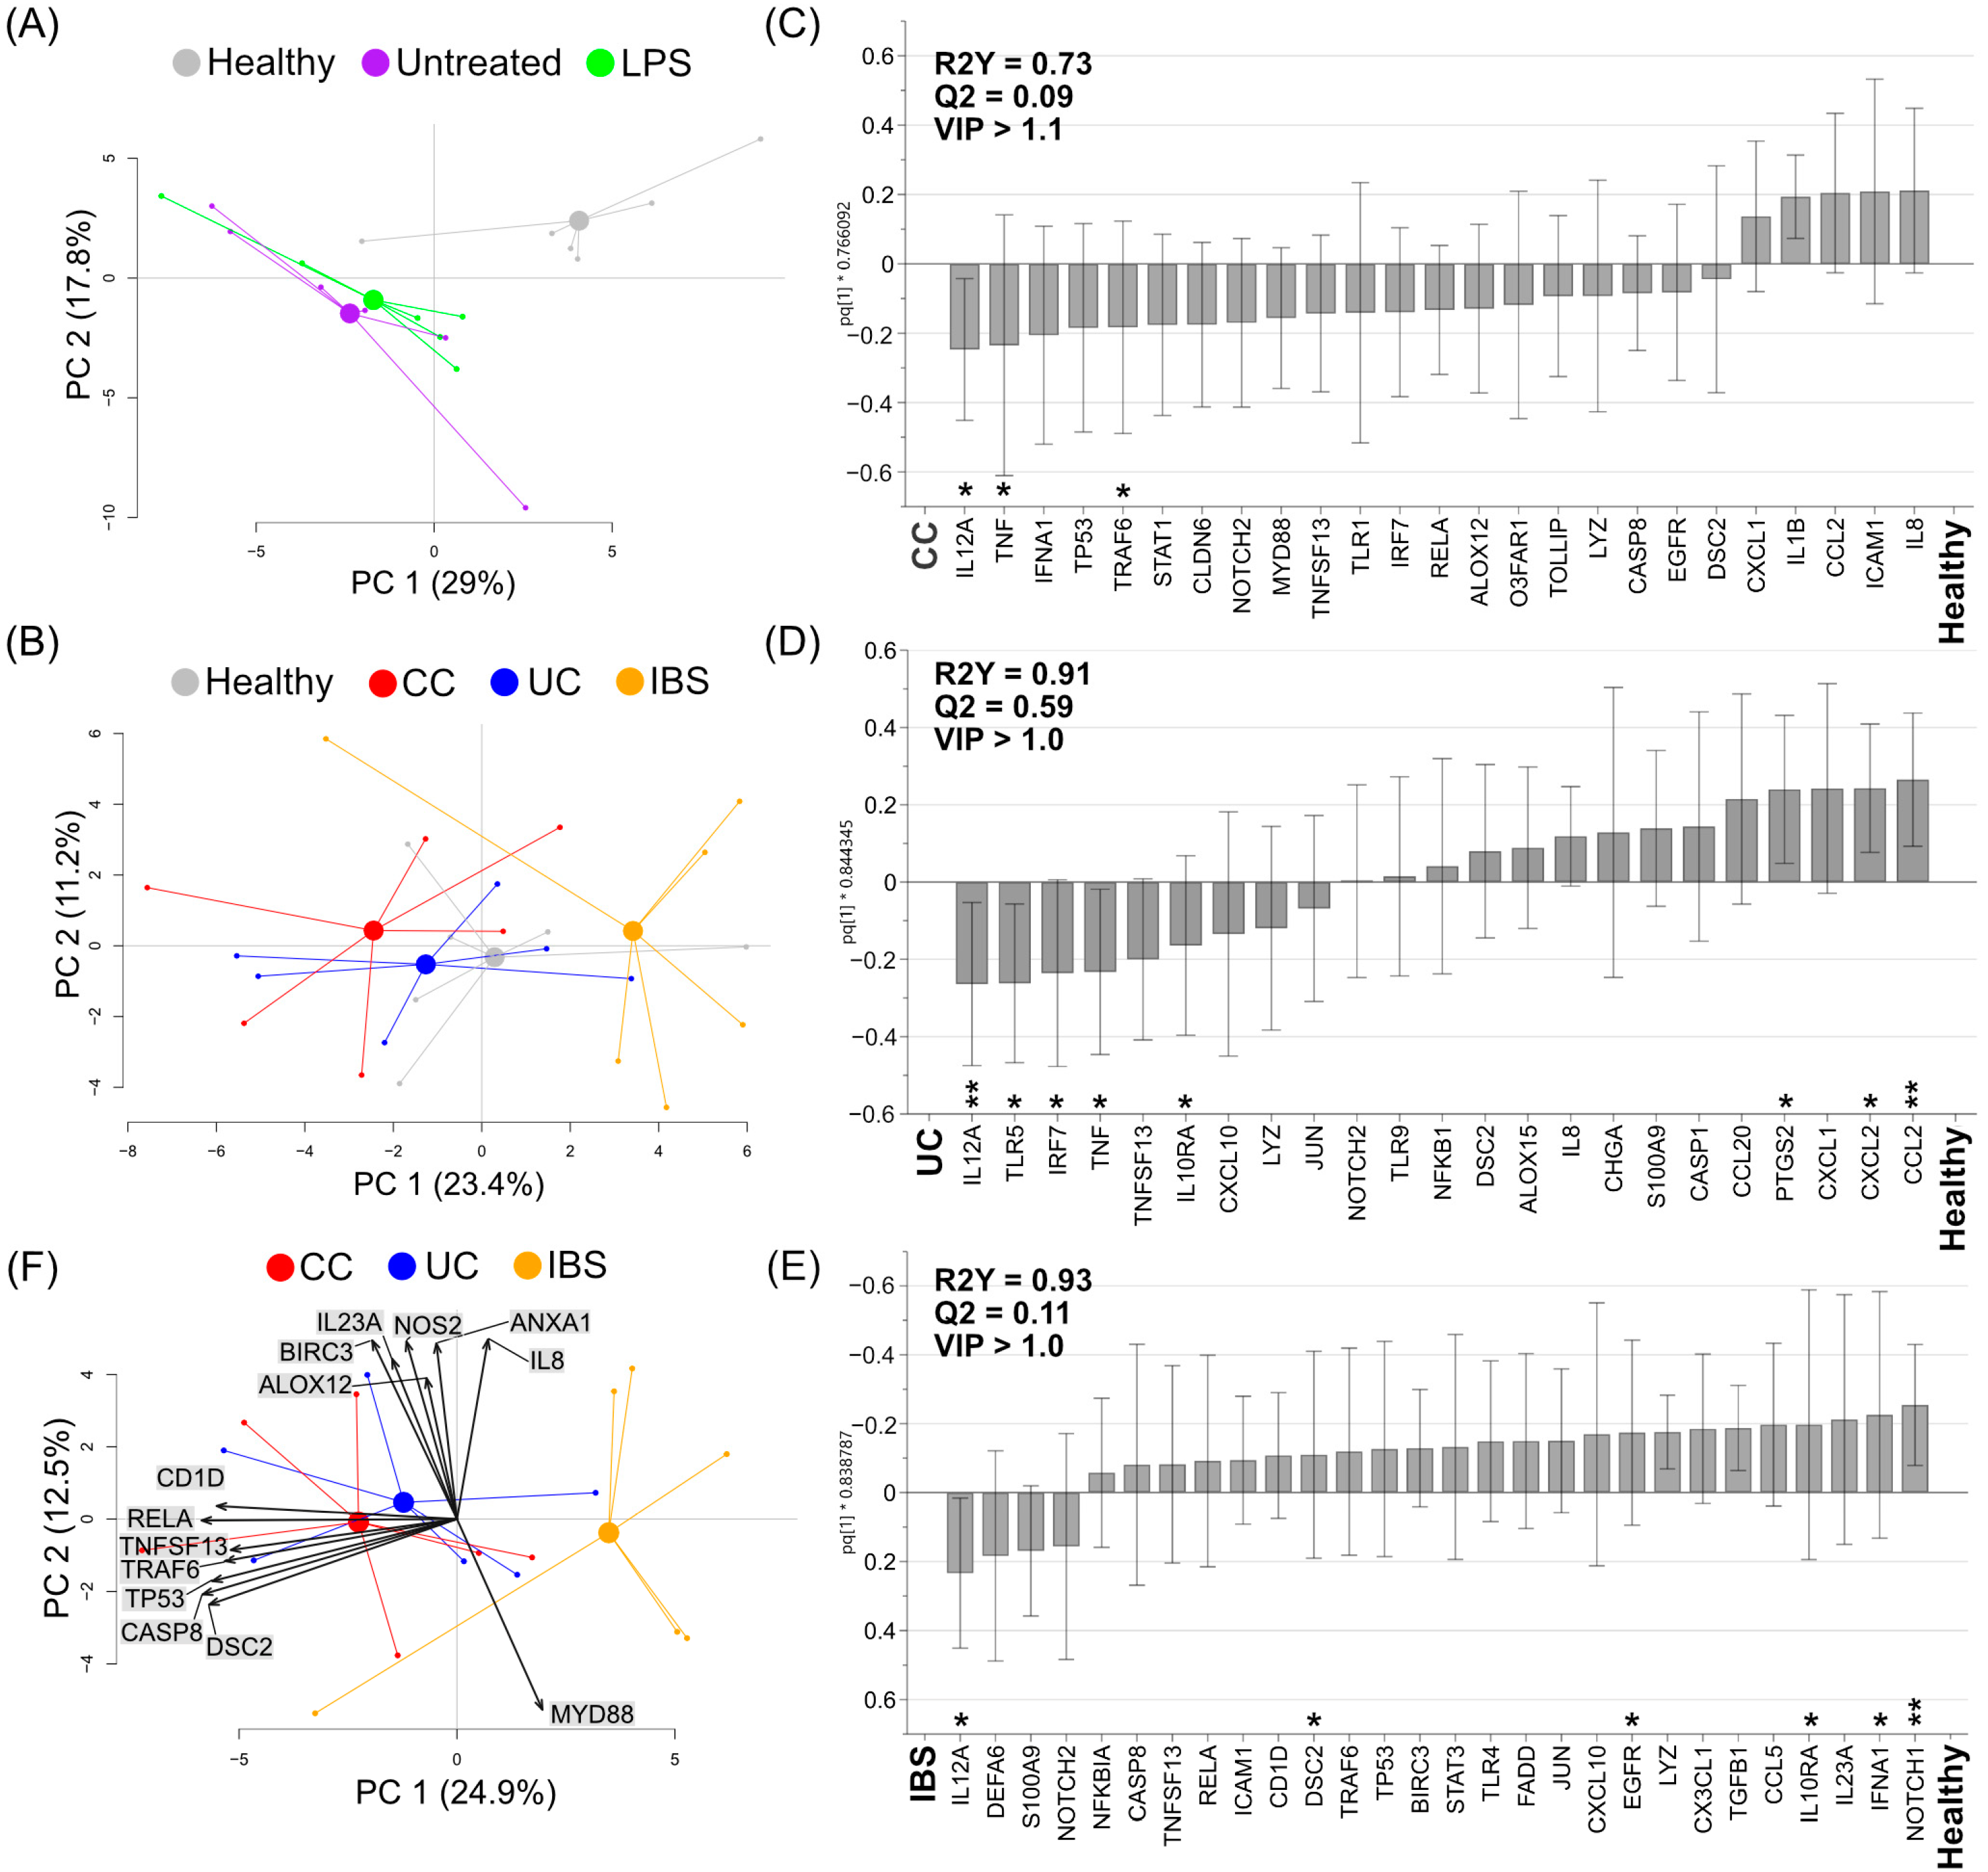
2.4. Fecal Supernatants from Patient Groups and Healthy Subjects Alter Gene Expression Profiles of Human Colonoid Cultures
3. Discussion
4. Materials and Methods
4.1. Study Subjects
4.2. Fecal Samples and Fecal Supernatant Preparation
4.3. Liquid Chromatography–Mass Spectrometry
4.4. Caco-2 Cell Culture and Stimulation with Fecal Supernatants
4.5. MTT (Tetrazolium) Assay
4.6. Generation of “Apical-Out” Colonoids and Stimulation with Fecal Supernatants
4.7. RNA Extraction and cDNA Preparation
4.8. RT2 Profiler PCR Array
4.9. Statistical Analyses
Supplementary Materials
Author Contributions
Funding
Institutional Review Board Statement
Informed Consent Statement
Data Availability Statement
Acknowledgments
Conflicts of Interest
References
- Zhou, A.; Yuan, Y.; Yang, M.; Huang, Y.; Li, X.; Li, S.; Yang, S.; Tang, B. Crosstalk Between the Gut Microbiota and Epithelial Cells Under Physiological and Infectious Conditions. Front. Cell. Infect. Microbiol. 2022, 12, 832672. [Google Scholar] [CrossRef] [PubMed]
- Genua, F.; Raghunathan, V.; Jenab, M.; Gallagher, W.M.; Hughes, D.J. The Role of Gut Barrier Dysfunction and Microbiome Dysbiosis in Colorectal Cancer Development. Front. Oncol. 2021, 11, 626349. [Google Scholar] [CrossRef] [PubMed]
- Zhou, Q.; Zhang, B.; Verne, N.G. Intestinal membrane permeability and hypersensitivity in the irritable bowel syndrome. Pain 2009, 146, 41–46. [Google Scholar] [CrossRef] [Green Version]
- McCole, D.F. IBD Candidate Genes and Intestinal Barrier Regulation. Inflamm. Bowel Dis. 2014, 20, 1829–1849. [Google Scholar] [CrossRef] [PubMed] [Green Version]
- Ahmad, R.; Sorrell, M.F.; Batra, S.K.; Dhawan, P.; Singh, A.B. Gut permeability and mucosal inflammation: Bad, good or context dependent. Mucosal Immunol. 2017, 10, 307–317. [Google Scholar] [CrossRef] [Green Version]
- UK IBD Genetics Consortium; Barrett, J.C.; Lee, J.C.; Lees, C.W.; Prescott, N.J.; Anderson, C.A.; Phillips, A.; Wesley, E.; Parnell, K.; Zhang, H.; et al. Genome-wide association study of ulcerative colitis identifies three new susceptibility loci, including the HNF4A region. Nat. Genet. 2009, 41, 1330–1334. [Google Scholar] [CrossRef]
- Anderson, C.A.; Boucher, G.; Lees, C.W.; Franke, A.; D’Amato, M.; Taylor, K.D.; Lee, J.C.; Goyette, P.; Imielinski, M.; Latiano, A.; et al. Meta-analysis identifies 29 additional ulcerative colitis risk loci, increasing the number of confirmed associations to 47. Nat. Genet. 2011, 43, 246–252. [Google Scholar] [CrossRef] [Green Version]
- Grivennikov, S.I. Inflammation and colorectal cancer: Colitis-associated neoplasia. Semin. Immunopathol. 2012, 35, 229–244. [Google Scholar] [CrossRef]
- Terzic, J.; Grivennikov, S.; Karin, E.; Karin, M. Inflammation and colon cancer. Gastroenterology 2010, 138, 2101–2114.e5. [Google Scholar] [CrossRef]
- Chen, Y.; Zhang, M.; Ren, F. A Role of Exopolysaccharide Produced by Streptococcus thermophilus in the Intestinal Inflammation and Mucosal Barrier in Caco-2 Monolayer and Dextran Sulphate Sodium-Induced Experimental Murine Colitis. Molecules 2019, 24, 513. [Google Scholar] [CrossRef]
- Sharma, M.; Chandel, D.; Shukla, G. Antigenotoxicity and Cytotoxic Potentials of Metabiotics Extracted from Isolated Probiotic, Lactobacillus rhamnosus MD 14 on Caco-2 and HT-29 Human Colon Cancer Cells. Nutr. Cancer 2019, 72, 110–119. [Google Scholar] [CrossRef] [PubMed]
- Co, J.Y.; Margalef-Català, M.; Li, X.; Mah, A.T.; Kuo, C.J.; Monack, D.M.; Amieva, M.R. Controlling Epithelial Polarity: A Human Enteroid Model for Host-Pathogen Interactions. Cell Rep. 2019, 26, 2509–2520.e4. [Google Scholar] [CrossRef] [PubMed] [Green Version]
- Sato, T.; Stange, D.E.; Ferrante, M.; Vries, R.G.J.; Van Es, J.H.; Van Den Brink, S.; Van Houdt, W.J.; Pronk, A.; Van Gorp, J.; Siersema, P.D.; et al. Long-term Expansion of Epithelial Organoids From Human Colon, Adenoma, Adenocarcinoma, and Barrett’s Epithelium. Gastroenterology 2011, 141, 1762–1772. [Google Scholar] [CrossRef] [PubMed]
- Noel, G.; Baetz, N.W.; Staab, J.F.; Donowitz, M.; Kovbasnjuk, O.; Pasetti, M.F.; Zachos, N.C. A primary human macrophage-enteroid co-culture model to investigate mucosal gut physiology and host-pathogen interactions. Sci. Rep. 2017, 7, 45270. [Google Scholar] [CrossRef] [PubMed] [Green Version]
- Sato, T.; Vries, R.G.; Snippert, H.J.; Van De Wetering, M.; Barker, N.; Stange, D.E.; Van Es, J.H.; Abo, A.; Kujala, P.; Peters, P.J.; et al. Single Lgr5 Stem Cells Build Crypt-Villus Structures in Vitro without a Mesenchymal Niche. Nature 2009, 459, 262–265. [Google Scholar] [CrossRef]
- McCracken, K.W.; Howell, J.C.; Wells, J.M.; Spence, J.R. Generating human intestinal tissue from pluripotent stem cells in vitro. Nat. Protoc. 2011, 6, 1920–1928. [Google Scholar] [CrossRef] [Green Version]
- Silva-Almeida, C.; Ewart, M.-A.; Wilde, C. 3D gastrointestinal models and organoids to study metabolism in human colon cancer. Semin. Cell Dev. Biol. 2019, 98, 98–104. [Google Scholar] [CrossRef]
- Ojo, B.A.; VanDussen, K.L.; Rosen, M.J. The Promise of Patient-Derived Colon Organoids to Model Ulcerative Colitis. Inflamm. Bowel Dis. 2021, 28, 299–308. [Google Scholar] [CrossRef]
- Cristobal, A.; van den Toorn, H.W.; van de Wetering, M.; Clevers, H.; Heck, A.J.R.; Mohammed, S. Personalized Proteome Profiles of Healthy and Tumor Human Colon Organoids Reveal Both Individual Diversity and Basic Features of Colorectal Cancer. Cell Rep. 2017, 18, 263–274. [Google Scholar] [CrossRef] [Green Version]
- Kashfi, S.M.H.; Almozyan, S.; Jinks, N.; Koo, B.-K.; Nateri, A.S. Morphological alterations of cultured human colorectal matched tumour and healthy organoids. Oncotarget 2018, 9, 10572–10584. [Google Scholar] [CrossRef]
- Iribarren, C.; Nordlander, S.; Sundin, J.; Isaksson, S.; Savolainen, O.; Törnblom, H.; Magnusson, M.K.; Simrén, M. Fecal luminal factors from patients with irritable bowel syndrome induce distinct gene expression of colonoids. Neurogastroenterol. Motil. 2022, 34, e14390. [Google Scholar] [CrossRef] [PubMed]
- Pearce, S.C.; Weber, G.J.; Doherty, L.A.; Soares, J.W. Human iPSC colon organoid function is improved by exposure to fecal fermentates. FASEB Bioadv. 2022, 4, 468–484. [Google Scholar] [CrossRef] [PubMed]
- Zhang, J.; Hernandez-Gordillo, V.; Trapecar, M.; Wright, C.; Taketani, M.; Schneider, K.; Chen, W.L.K.; Stas, E.; Breault, D.T.; Carrier, R.L.; et al. Coculture of primary human colon monolayer with human gut bacteria. Nat. Protoc. 2021, 16, 3874–3900. [Google Scholar] [CrossRef] [PubMed]
- Kim, K.; Castro, E.J.T.; Shim, H.; Advincula, J.V.G.; Kim, Y.-W. Differences Regarding the Molecular Features and Gut Microbiota Between Right and Left Colon Cancer. Ann. Coloproctology 2018, 34, 280–285. [Google Scholar] [CrossRef] [Green Version]
- Tong, M.; Li, X.; Parfrey, L.W.; Roth, B.; Ippoliti, A.; Wei, B.; Borneman, J.; McGovern, D.P.B.; Frank, D.N.; Li, E.; et al. A Modular Organization of the Human Intestinal Mucosal Microbiota and Its Association with Inflammatory Bowel Disease. PLoS ONE 2013, 8, e80702. [Google Scholar] [CrossRef] [Green Version]
- Frank, D.N.; St Amand, A.L.; Feldman, R.A.; Boedeker, E.C.; Harpaz, N.; Pace, N.R. Molecular-phylogenetic characterization of microbial community imbalances in human inflammatory bowel diseases. Proc. Natl. Acad. Sci. USA 2007, 104, 13780–13785. [Google Scholar] [CrossRef] [Green Version]
- Pittayanon, R.; Lau, J.T.; Yuan, Y.; Leontiadis, G.I.; Tse, F.; Surette, M.; Moayyedi, P. Gut Microbiota in Patients With Irritable Bowel Syndrome—A Systematic Review. Gastroenterology 2019, 157, 97–108. [Google Scholar] [CrossRef] [Green Version]
- Tap, J.; Derrien, M.; Törnblom, H.; Brazeilles, R.; Cools-Portier, S.; Doré, J.; Störsrud, S.; Le Nevé, B.; Öhman, L.; Simrén, M. Identification of an Intestinal Microbiota Signature Associated With Severity of Irritable Bowel Syndrome. Gastroenterology 2017, 152, 111–123.e8. [Google Scholar] [CrossRef] [Green Version]
- Lee, J.S.; Wang, R.X.; Alexeev, E.E.; Colgan, S.P. Intestinal Inflammation as a Dysbiosis of Energy Procurement: New Insights into an Old Topic. Gut Microbes 2021, 13, 1880241. [Google Scholar] [CrossRef]
- Dorrestein, P.C.; Mazmanian, S.K.; Knight, R. Finding the Missing Links among Metabolites, Microbes, and the Host. Immunity 2014, 40, 824–832. [Google Scholar] [CrossRef]
- Le Gall, G.; Guttula, K.; Kellingray, L.; Tett, A.J.; Ten Hoopen, R.; Kemsley, K.E.; Savva, G.M.; Ibrahim, A.; Narbad, A. Metabolite quantification of faecal extracts from colorectal cancer patients and healthy controls. Oncotarget 2018, 9, 33278–33289. [Google Scholar] [CrossRef] [PubMed] [Green Version]
- Ahluwalia, B.; Iribarren, C.; Magnusson, M.; Sundin, J.; Clevers, E.; Savolainen, O.; Ross, A.; Törnblom, H.; Simrén, M. A Distinct Faecal Microbiota and Metabolite Profile Linked to Bowel Habits in Patients with Irritable Bowel Syndrome. Cells 2021, 10, 1459. [Google Scholar] [CrossRef] [PubMed]
- Le Gall, G.; Noor, S.O.; Ridgway, K.; Scovell, L.; Jamieson, C.; Johnson, I.T.; Colquhoun, I.J.; Kemsley, E.K.; Narbad, A. Metabolomics of fecal extracts detects altered metabolic activity of gut microbiota in ulcerative colitis and irritable bowel syndrome. J. Proteome Res. 2011, 10, 4208–4218. [Google Scholar] [CrossRef] [PubMed]
- Hilgers, A.R.; Conradi, R.A.; Burton, P.S. Caco-2 Cell Monolayers as a Model for Drug Transport Across the Intestinal Mucosa. Pharm. Res. 1990, 7, 902–910. [Google Scholar] [CrossRef]
- Korecka, A.; Dona, A.; Lahiri, S.; Tett, A.J.; Al-Asmakh, M.; Braniste, V.; D’Arienzo, R.; Abbaspour, A.; Reichardt, N.; Fujii-Kuriyama, Y.; et al. Bidirectional communication between the Aryl hydrocarbon Receptor (AhR) and the microbiome tunes host metabolism. npj Biofilms Microbiomes 2016, 2, 16014. [Google Scholar] [CrossRef] [Green Version]
- Chen, T.; Kim, C.Y.; Kaur, A.; Lamothe, L.; Shaikh, M.; Keshavarzian, A.; Hamaker, B.R. Dietary fibre-based SCFA mixtures promote both protection and repair of intestinal epithelial barrier function in a Caco-2 cell model. Food Funct. 2017, 8, 1166–1173. [Google Scholar] [CrossRef]
- Simon-Assmann, P.; Turck, N.; Sidhoum-Jenny, M.; Gradwohl, G.; Kedinger, M. In vitro models of intestinal epithelial cell differentiation. Cell Biol. Toxicol. 2006, 23, 241–256. [Google Scholar] [CrossRef]
- Sambuy, Y.; De Angelis, I.; Ranaldi, G.; Scarino, M.L.; Stammati, A.; Zucco, F. The Caco-2 cell line as a model of the intestinal barrier: Influence of cell and culture-related factors on Caco-2 cell functional characteristics. Cell Biol. Toxicol. 2005, 21, 1–26. [Google Scholar] [CrossRef]
- Tsai, P.-Y.; Zhang, B.; He, W.-Q.; Zha, J.-M.; Odenwald, M.A.; Singh, G.; Tamura, A.; Shen, L.; Sailer, A.; Yeruva, S.; et al. IL-22 Upregulates Epithelial Claudin-2 to Drive Diarrhea and Enteric Pathogen Clearance. Cell Host Microbe 2017, 21, 671–681.e4. [Google Scholar] [CrossRef] [Green Version]
- Hanning, N.; Edwinson, A.L.; Ceuleers, H.; Peters, S.A.; De Man, J.G.; Hassett, L.C.; De Winter, B.Y.; Grover, M. Intestinal barrier dysfunction in irritable bowel syndrome: A systematic review. Ther. Adv. Gastroenterol. 2021, 14. [Google Scholar] [CrossRef]
- Nicchitta, C.V. Come forth CD1d: Hsp110 in the regulation of intestinal epithelial CD1d expression. J. Clin. Investig. 2003, 112, 646–648. [Google Scholar] [CrossRef] [PubMed] [Green Version]
- Eftychi, C.; Schwarzer, R.; Vlantis, K.; Wachsmuth, L.; Basic, M.; Wagle, P.; Neurath, M.F.; Becker, C.; Bleich, A.; Pasparakis, M. Temporally Distinct Functions of the Cytokines IL-12 and IL-23 Drive Chronic Colon Inflammation in Response to Intestinal Barrier Impairment. Immunity 2019, 51, 367–380.e4. [Google Scholar] [CrossRef] [PubMed]
- Greving, C.N.A.; Towne, J.E. A Role for IL-12 in IBD after All? Immunity 2019, 51, 209–211. [Google Scholar] [CrossRef] [PubMed]
- Alotaibi, A.G.; Li, J.V.; Gooderham, N.J. Tumour necrosis factor-α (TNF-α) enhances dietary carcinogen-induced DNA damage in colorectal cancer epithelial cells through activation of JNK signaling pathway. Toxicology 2021, 457, 152806. [Google Scholar] [CrossRef]
- Roulis, M.; Armaka, M.; Manoloukos, M.; Apostolaki, M.; Kollias, G. Intestinal epithelial cells as producers but not targets of chronic TNF suffice to cause murine Crohn-like pathology. Proc. Natl. Acad. Sci. USA 2011, 108, 5396–5401. [Google Scholar] [CrossRef] [Green Version]
- Xu, H.-M.; Zhao, H.-L.; Guo, G.-J.; Xu, J.; Zhou, Y.-L.; Huang, H.-L.; Nie, Y.-Q. Characterization of short-chain fatty acids in patients with ulcerative colitis: A meta-analysis. BMC Gastroenterol. 2022, 22, 117. [Google Scholar] [CrossRef]
- Gomes, S.D.; Oliveira, C.S.; Azevedo-Silva, J.; Casanova, M.R.; Barreto, J.; Pereira, H.; Chaves, S.R.; Rodrigues, L.R.; Casal, M.; Côrte-Real, M.; et al. The Role of Diet Related Short-Chain Fatty Acids in Colorectal Cancer Metabolism and Survival: Prevention and Therapeutic Implications. Curr. Med. Chem. 2020, 27, 4087–4108. [Google Scholar] [CrossRef]
- Sun, Q.; Jia, Q.; Song, L.; Duan, L. Alterations in fecal short-chain fatty acids in patients with irritable bowel syndrome: A systematic review and meta-analysis. Medicine 2019, 98, e14513. [Google Scholar] [CrossRef]
- Song, X.; Gao, H.; Lin, Y.; Yao, Y.; Zhu, S.; Wang, J.; Liu, Y.; Yao, X.; Meng, G.; Shen, N.; et al. Alterations in the Microbiota Drive Interleukin-17C Production from Intestinal Epithelial Cells to Promote Tumorigenesis. Immunity 2014, 40, 140–152. [Google Scholar] [CrossRef] [PubMed] [Green Version]
- Grivennikov, S.; Karin, E.; Terzic, J.; Mucida, D.; Yu, G.; Vallabhapurapu, S.; Scheller, J.; Rose-John, S.; Cheroutre, H.; Eckmann, L.; et al. IL-6 and Stat3 are required for survival of intestinal epithelial cells and development of colitis-associated cancer. Cancer Cell 2009, 15, 103–113. [Google Scholar] [CrossRef]
- Guthrie, L.; Spencer, S.P.; Perelman, D.; Van Treuren, W.; Han, S.; Yu, F.B.; Sonnenburg, E.D.; Fischbach, M.A.; Meyer, T.W.; Sonnenburg, J.L. Impact of a 7-day homogeneous diet on interpersonal variation in human gut microbiomes and metabolomes. Cell Host Microbe 2022, 30, 863–874.e4. [Google Scholar] [CrossRef] [PubMed]
- Öhman, L.; Lasson, A.; Strömbeck, A.; Isaksson, S.; Hesselmar, M.; Simrén, M.; Strid, H.; Magnusson, M.K. Fecal microbiota dynamics during disease activity and remission in newly diagnosed and established ulcerative colitis. Sci. Rep. 2021, 11, 1–8. [Google Scholar] [CrossRef] [PubMed]
- Rajilić-Stojanović, M.; Heilig, H.G.H.J.; Tims, S.; Zoetendal, E.G.; de Vos, W.M. Long-term monitoring of the human intestinal microbiota composition. Environ. Microbiol. 2012, 15, 1146–1159. [Google Scholar] [CrossRef] [PubMed]
- Mars, R.A.; Yang, Y.; Ward, T.; Houtti, M.; Priya, S.; Lekatz, H.R.; Tang, X.; Sun, Z.; Kalari, K.R.; Korem, T.; et al. Longitudinal Multi-omics Reveals Subset-Specific Mechanisms Underlying Irritable Bowel Syndrome. Cell 2020, 183, 1137–1140. [Google Scholar] [CrossRef]
- Longstreth, G.F.; Thompson, W.G.; Chey, W.D.; Houghton, L.A.; Mearin, F.; Spiller, R.C. Functional bowel disorders. Gastroenterology 2006, 130, 1480–1491. [Google Scholar] [CrossRef]
- O’Sullivan, B.; Brierley, J.; Byrd, D.; Bosman, F.; Kehoe, S.; Kossary, C.; Piñeros, M.; Van Eycken, E.; Weir, H.K.; Gospodarowicz, M. The TNM classification of malignant tumours-towards common understanding and reasonable expectations. Lancet Oncol. 2017, 18, 849–851. [Google Scholar] [CrossRef] [Green Version]
- Sturm, A.; Maaser, C.; Calabrese, E.; Annese, V.; Fiorino, G.; Kucharzik, T.; Vavricka, S.R.; Verstockt, B.; Van Rheenen, P.; Tolan, D.; et al. ECCO-ESGAR Guideline for Diagnostic Assessment in IBD Part 2: IBD scores and general principles and technical aspects. J. Crohn’s Colitis 2018, 13, 273–284. [Google Scholar] [CrossRef]
- Francis, C.Y.; Morris, J.; Whorwell, P. The irritable bowel severity scoring system: A simple method of monitoring irritable bowel syndrome and its progress. Aliment. Pharmacol. Ther. 1997, 11, 395–402. [Google Scholar] [CrossRef] [Green Version]
- Lewis, S.J.; Heaton, K.W. Stool Form Scale as a Useful Guide to Intestinal Transit Time. Scand. J. Gastroenterol. 1997, 32, 920–924. [Google Scholar] [CrossRef]
- Zheng, R.; Brunius, C.; Shi, L.; Zafar, H.; Paulson, L.; Landberg, R.; Naluai, T. Prediction and evaluation of the effect of pre-centrifugation sample management on the measurable untargeted LC-MS plasma metabolome. Anal. Chim. Acta 2021, 1182, 338968. [Google Scholar] [CrossRef]
- Stekhoven, D.J.; Buhlmann, P. MissForest-non-parametric missing value imputation for mixed-type data. Bioinformatics 2012, 28, 112–118. [Google Scholar] [CrossRef] [PubMed] [Green Version]
- Mosmann, T. Rapid colorimetric assay for cellular growth and survival: Application to proliferation and cytotoxicity assays. J. Immunol. Methods 1983, 65, 55–63. [Google Scholar] [CrossRef] [PubMed]
- Tolosa, L.; Donato, M.T.; Gómez-Lechón, M.J. General Cytotoxicity Assessment by Means of the MTT Assay. Methods Mol. Biol. 2014, 1250, 333–348. [Google Scholar] [CrossRef]
- Co, J.Y.; Margalef-Català, M.; Monack, D.M.; Amieva, M.R. Controlling the polarity of human gastrointestinal organoids to investigate epithelial biology and infectious diseases. Nat. Protoc. 2021, 16, 5171–5192. [Google Scholar] [CrossRef]


Publisher’s Note: MDPI stays neutral with regard to jurisdictional claims in published maps and institutional affiliations. |
© 2022 by the authors. Licensee MDPI, Basel, Switzerland. This article is an open access article distributed under the terms and conditions of the Creative Commons Attribution (CC BY) license (https://creativecommons.org/licenses/by/4.0/).
Share and Cite
Holst, L.M.; Iribarren, C.; Sapnara, M.; Savolainen, O.; Törnblom, H.; Wettergren, Y.; Strid, H.; Simrén, M.; Magnusson, M.K.; Öhman, L. Fecal Luminal Factors from Patients with Gastrointestinal Diseases Alter Gene Expression Profiles in Caco-2 Cells and Colonoids. Int. J. Mol. Sci. 2022, 23, 15505. https://0-doi-org.brum.beds.ac.uk/10.3390/ijms232415505
Holst LM, Iribarren C, Sapnara M, Savolainen O, Törnblom H, Wettergren Y, Strid H, Simrén M, Magnusson MK, Öhman L. Fecal Luminal Factors from Patients with Gastrointestinal Diseases Alter Gene Expression Profiles in Caco-2 Cells and Colonoids. International Journal of Molecular Sciences. 2022; 23(24):15505. https://0-doi-org.brum.beds.ac.uk/10.3390/ijms232415505
Chicago/Turabian StyleHolst, Luiza Moraes, Cristina Iribarren, Maria Sapnara, Otto Savolainen, Hans Törnblom, Yvonne Wettergren, Hans Strid, Magnus Simrén, Maria K. Magnusson, and Lena Öhman. 2022. "Fecal Luminal Factors from Patients with Gastrointestinal Diseases Alter Gene Expression Profiles in Caco-2 Cells and Colonoids" International Journal of Molecular Sciences 23, no. 24: 15505. https://0-doi-org.brum.beds.ac.uk/10.3390/ijms232415505