

Bioinformatic Analysis of Na+, K+-ATPase Regulation through Phosphorylation of the Alpha-Subunit N-Terminus

Abstract
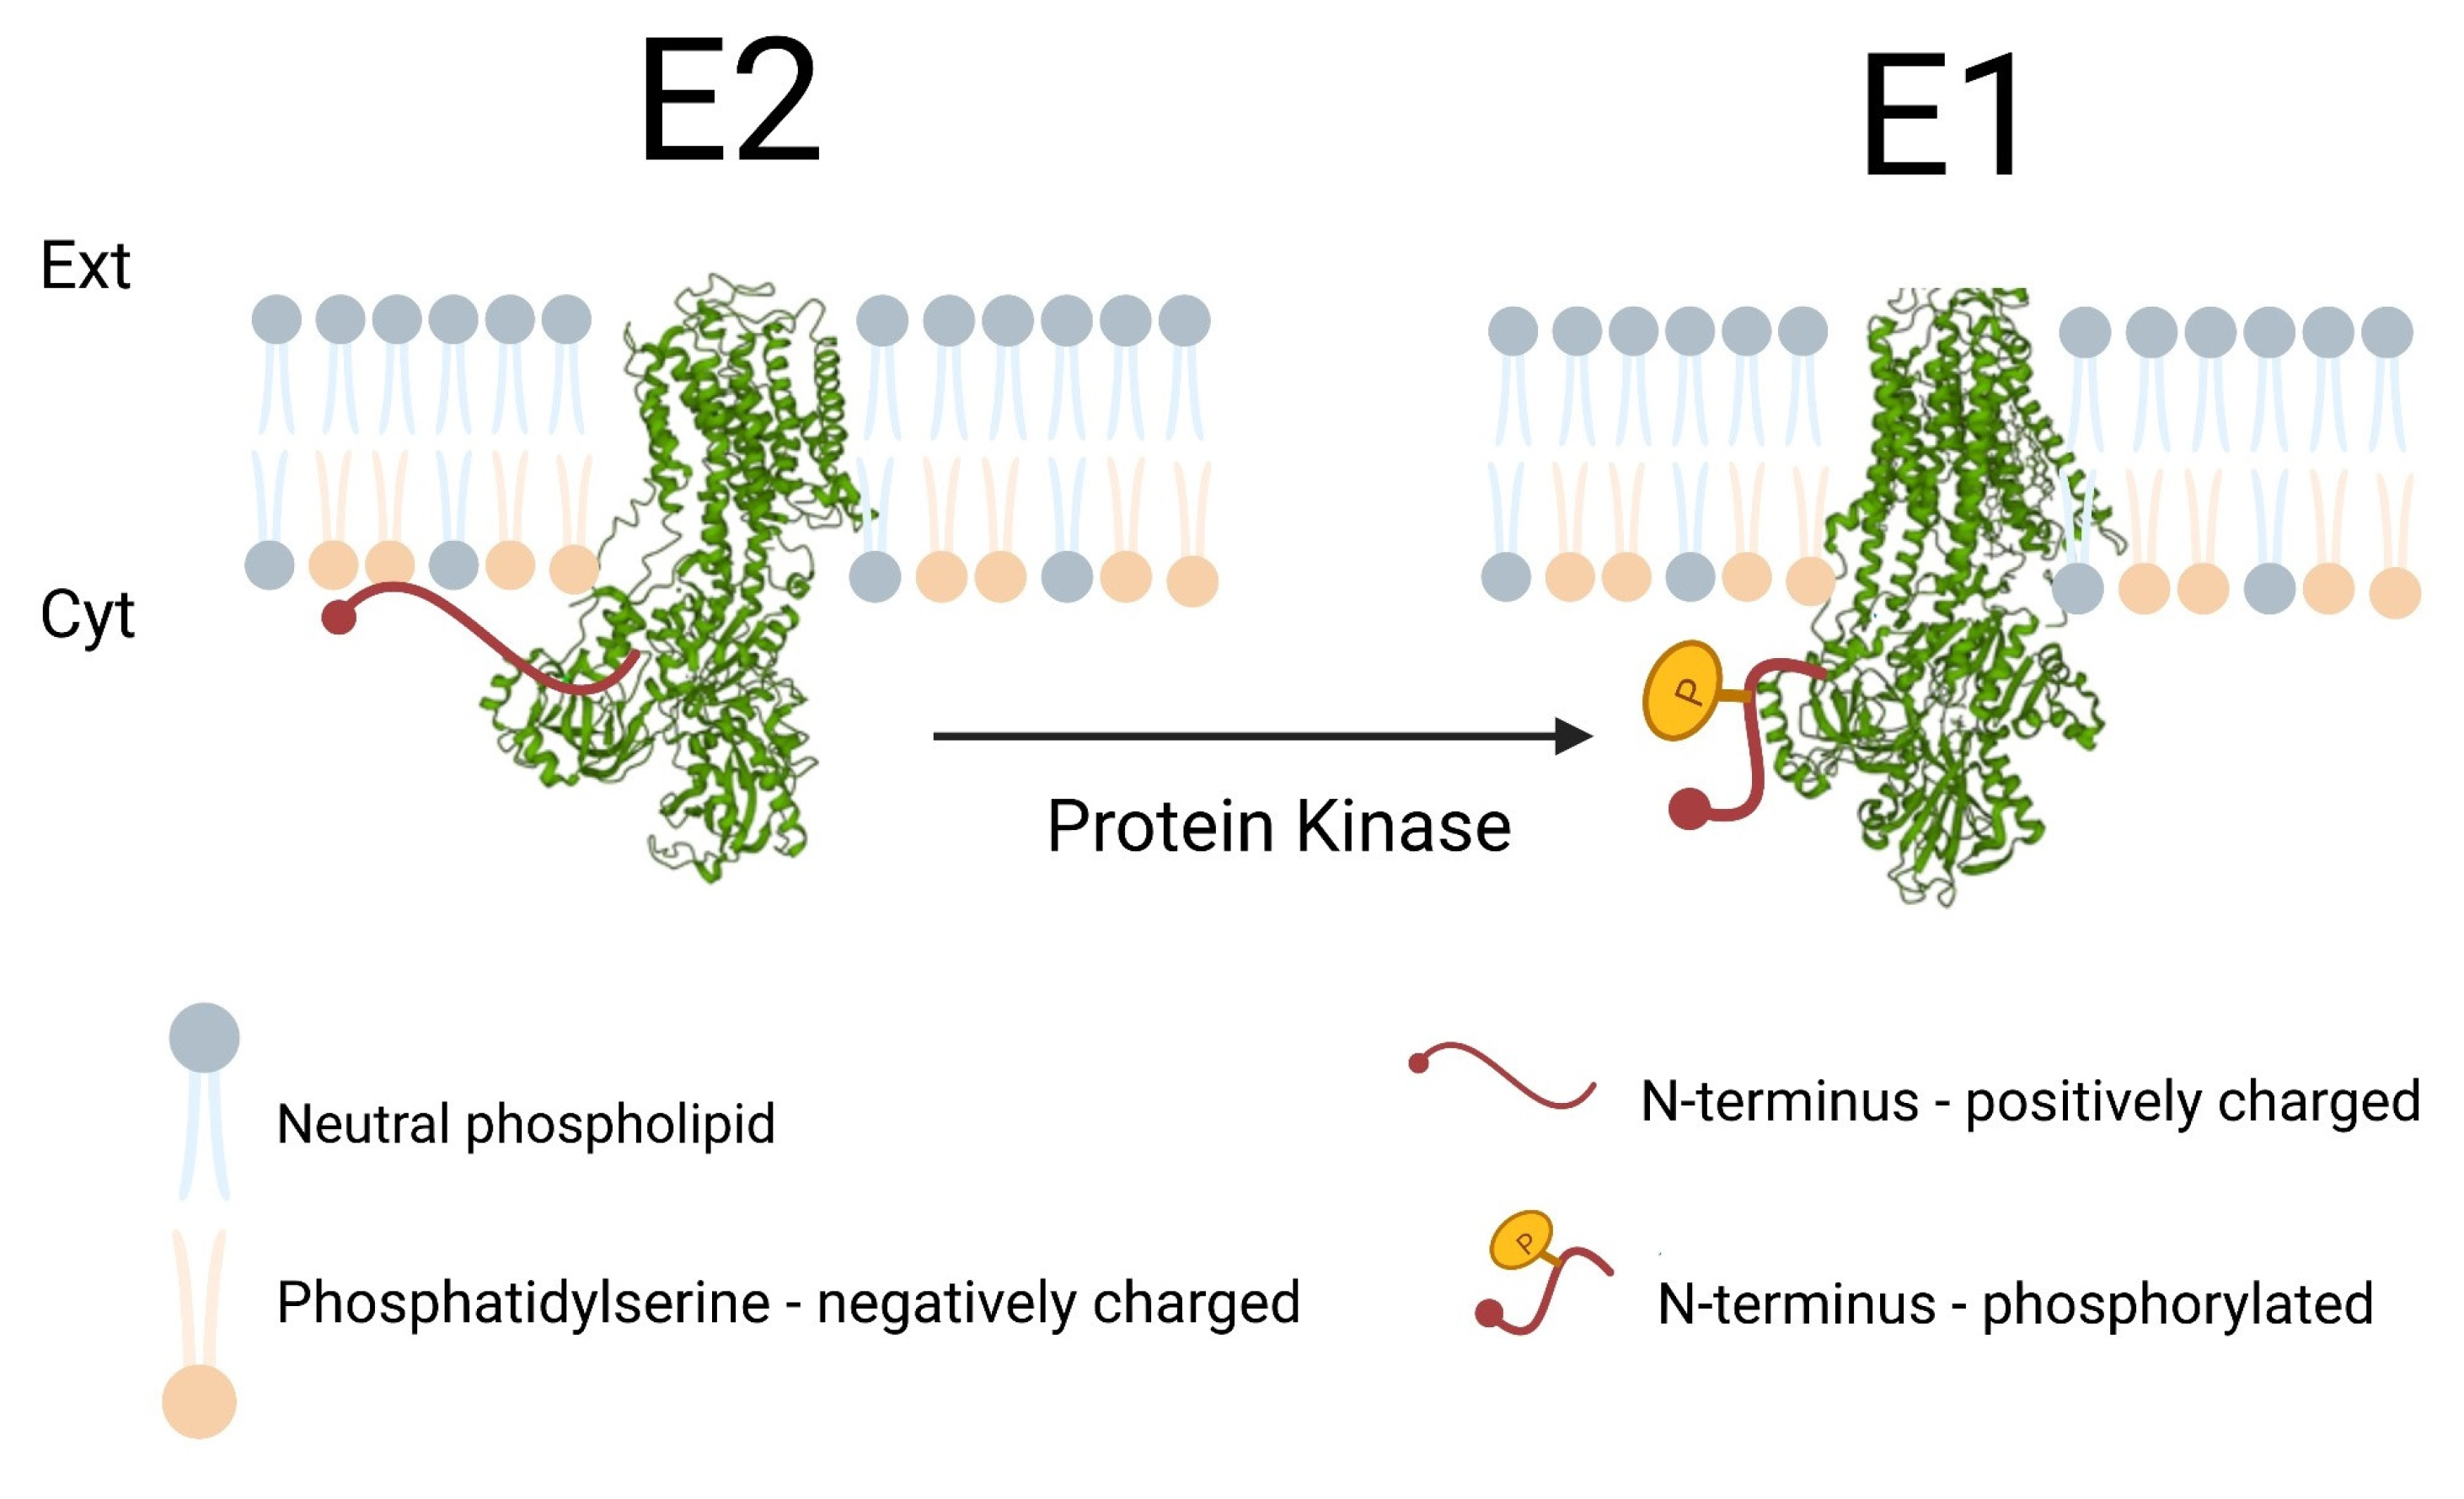
:1. Introduction
2. Results
2.1. Mirror Tree Analysis of the Na+, K+-ATPase with PKC Isoforms
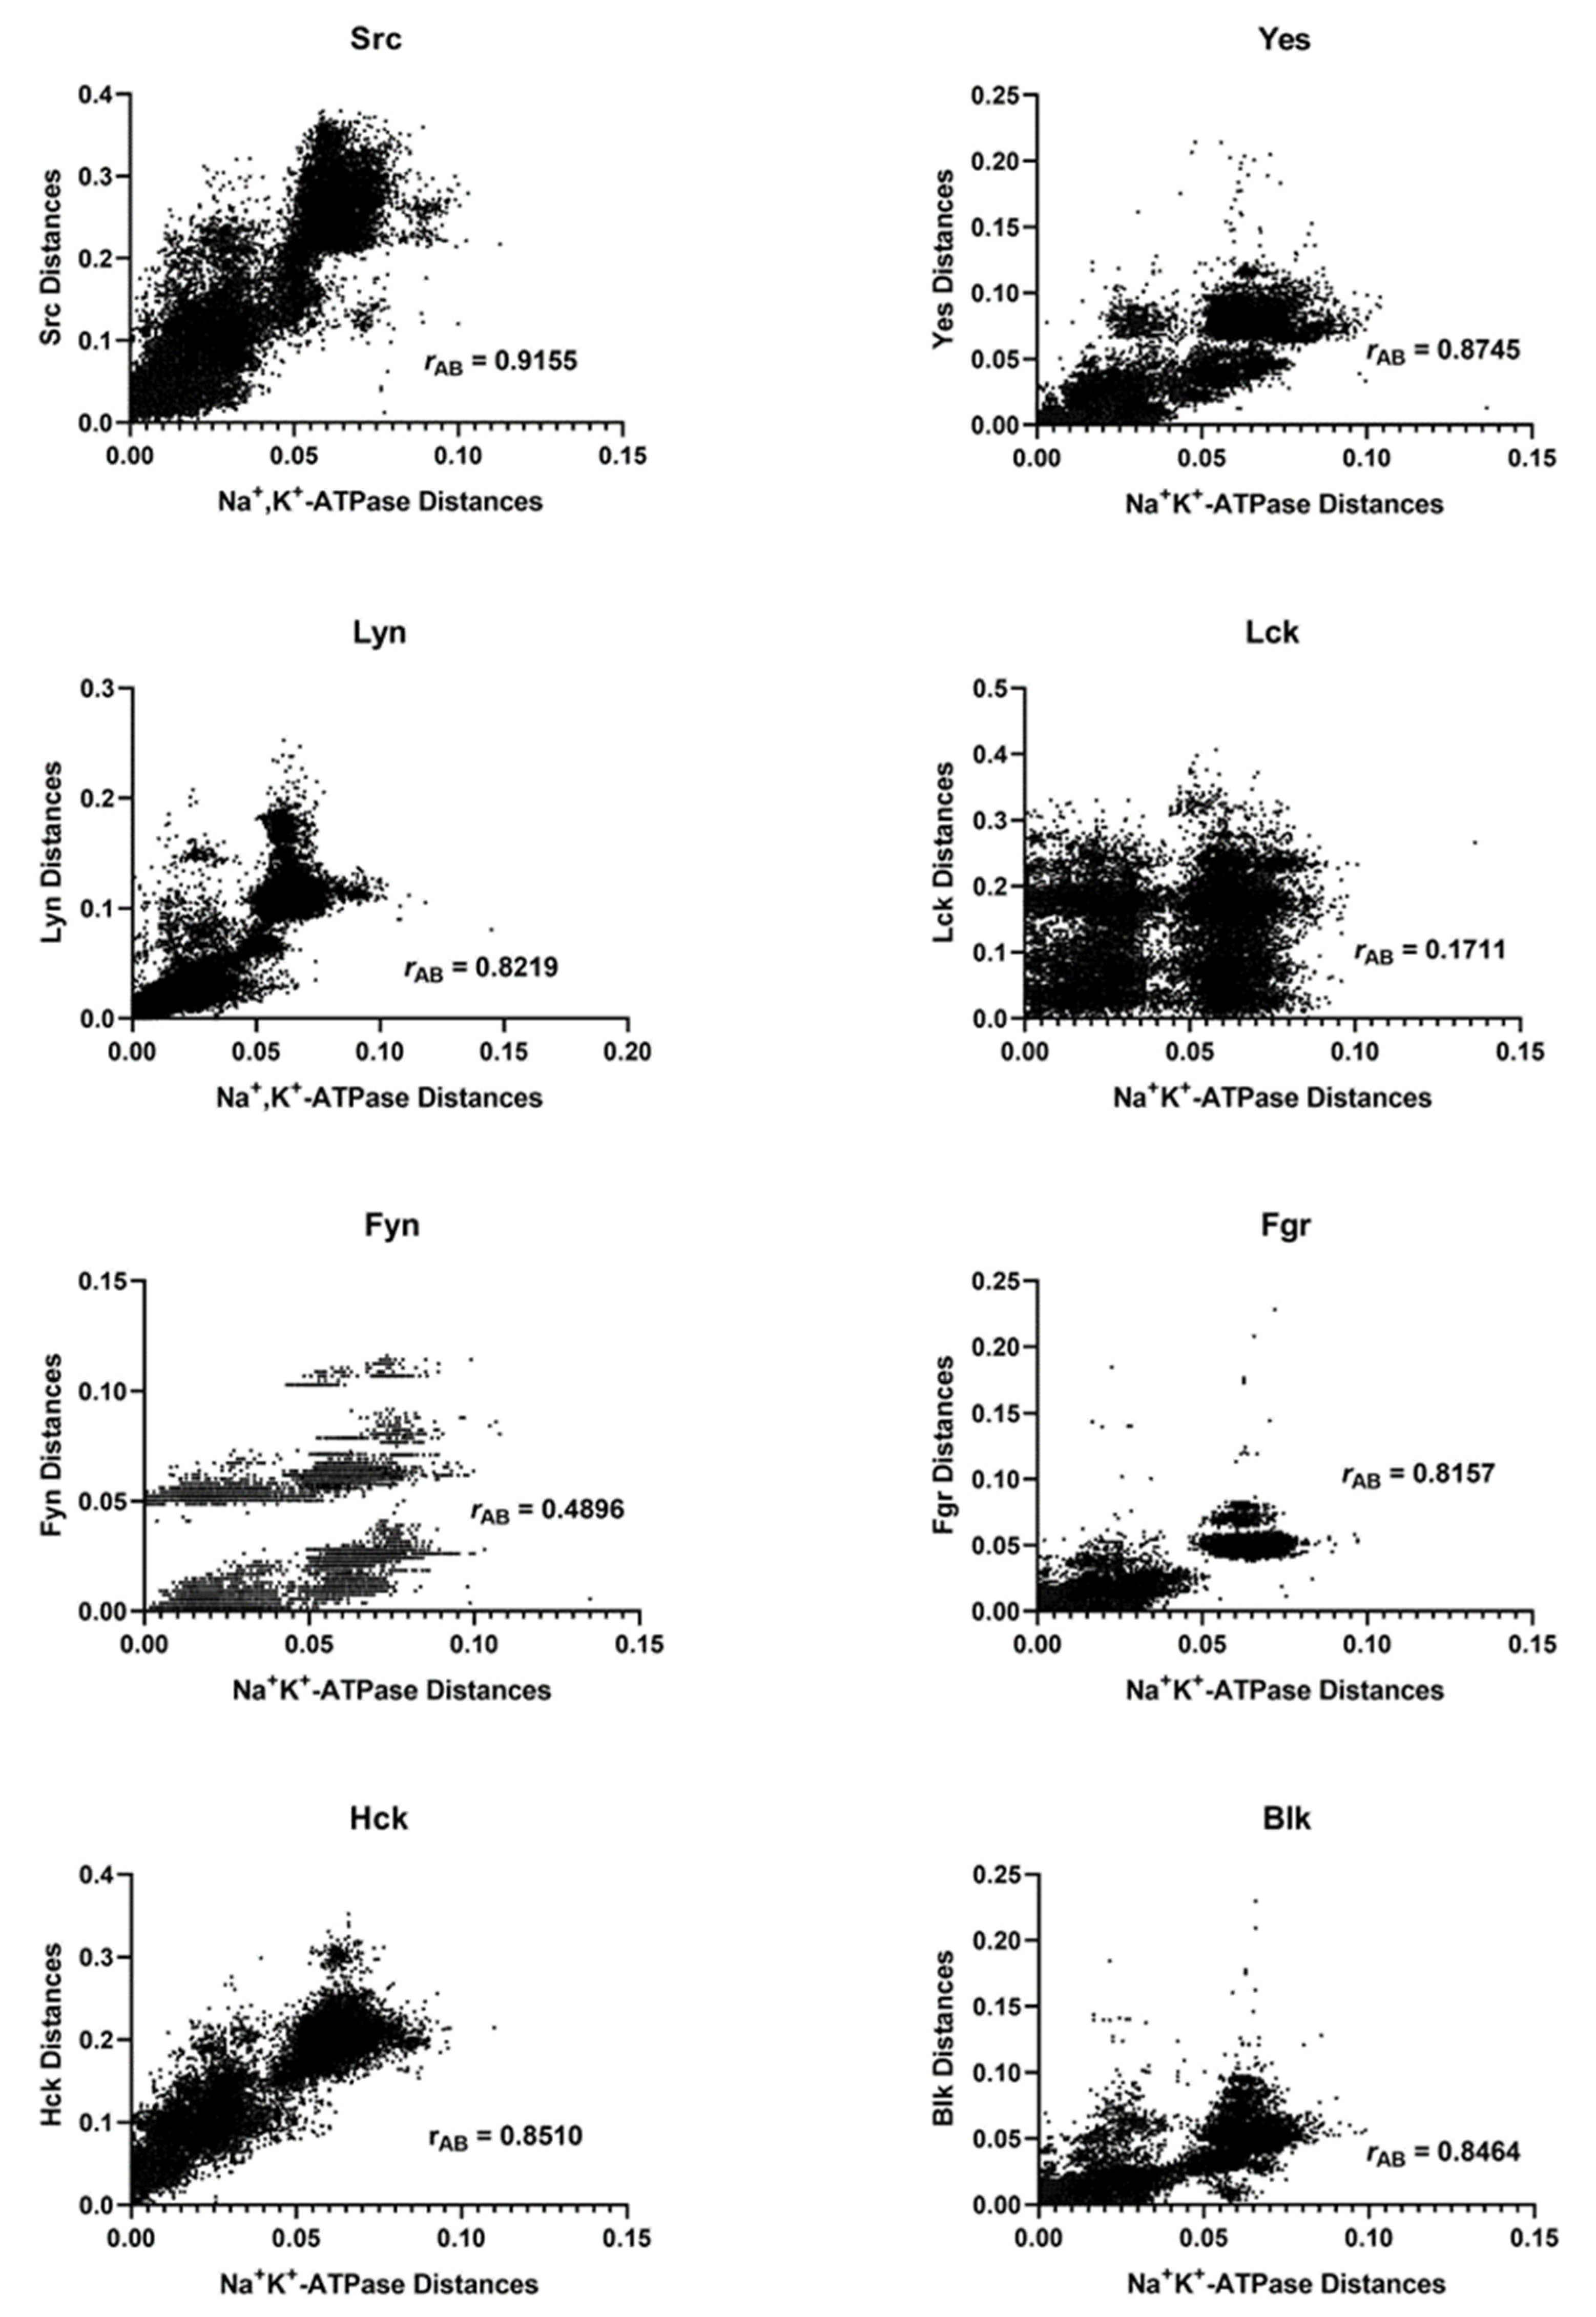
2.2. Mirror Tree Analysis of the Na+, K+-ATPase with the Enzymes of the Src Kinase Family
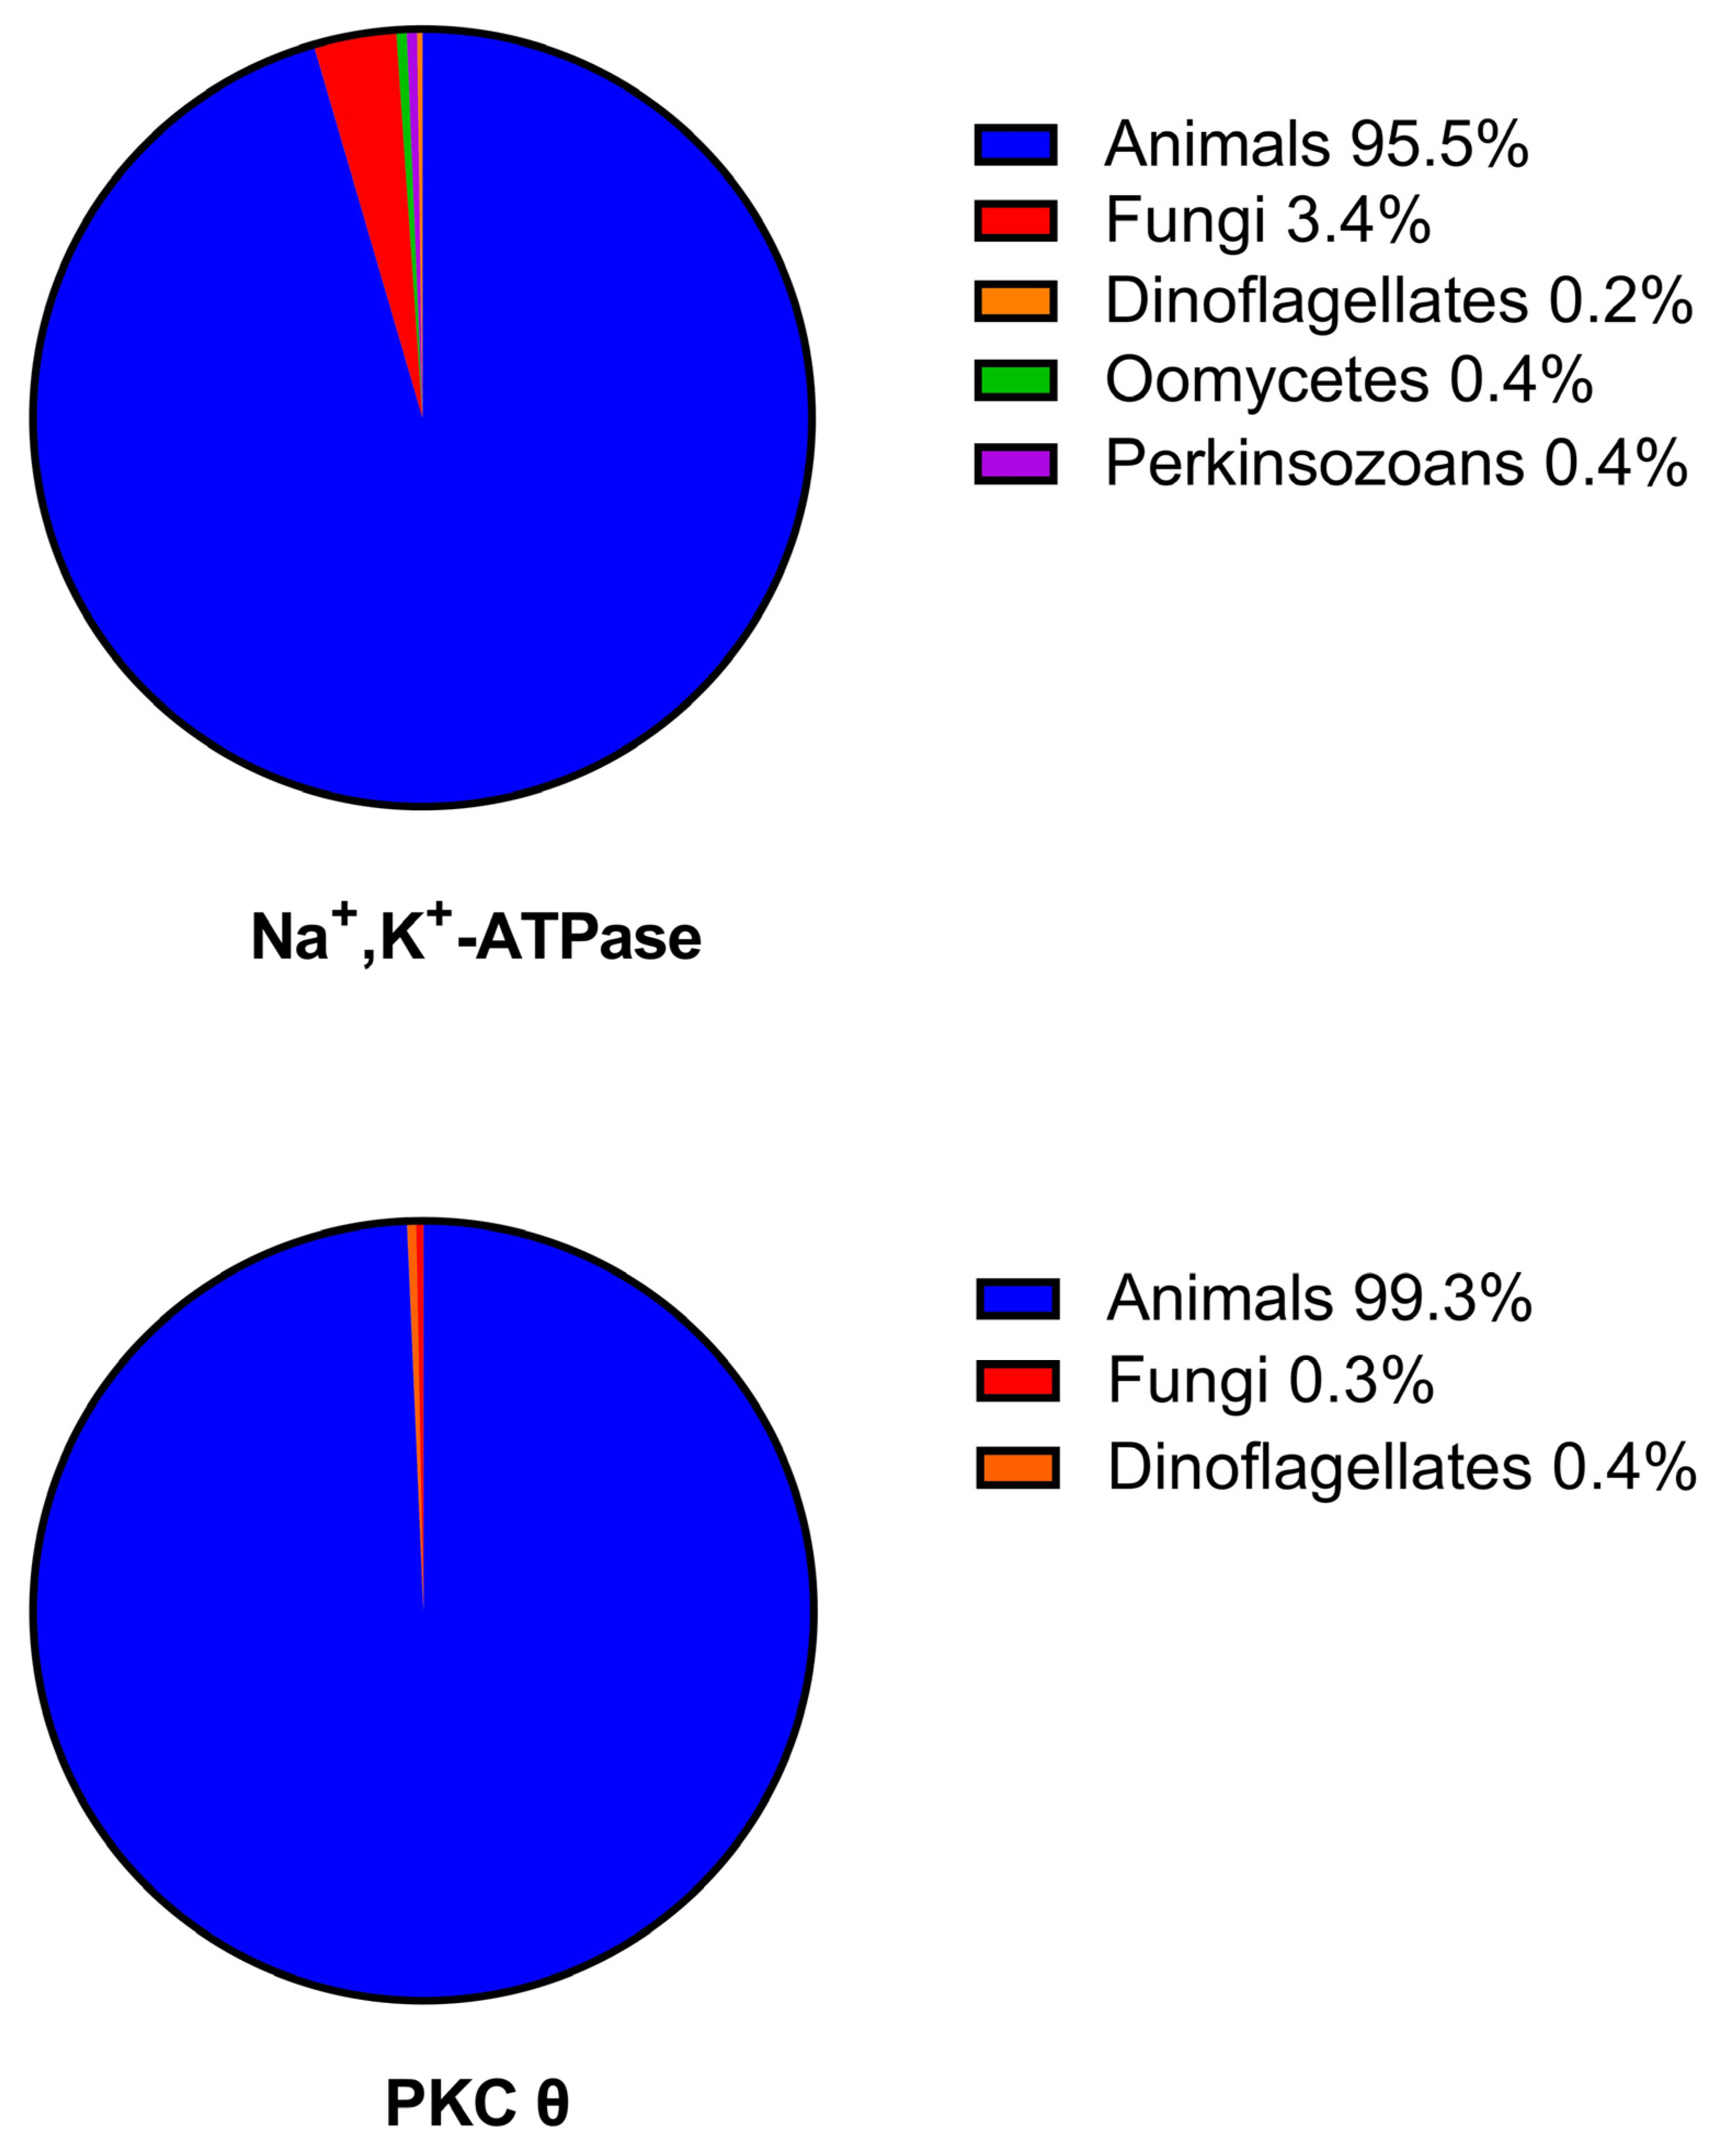
2.3. Comparisons of the Phylogenetic Distributions of the Na+, K+-ATPase with PKC Isoforms
3. Discussion
4. Methods
4.1. Mirror Tree Analysis
4.2. Phylogenetic Distribution Analysis
Author Contributions
Funding
Institutional Review Board Statement
Informed Consent Statement
Data Availability Statement
Acknowledgments
Conflicts of Interest
References
- Clarke, R.J.; Hossain, K.R.; Cao, K. Physiological roles of transverse lipid asymmetry of animal membranes. Biochim. Biophys. Acta-Biomembr. 2020, 1862, 183382. [Google Scholar] [CrossRef]
- Serber, Z.; Ferrell, J.E., Jr. Tuning bulk electrostatics to regulate protein function. Cell 2007, 128, 441–444. [Google Scholar] [CrossRef] [Green Version]
- Diaz, D.; Clarke, R.J. Evolutionary analysis of the lysine-rich N-terminal cytoplasmic domains of the gastric H+,K+-ATPase and the Na+,K+-ATPase. J. Membr. Biol. 2018, 251, 653–666. [Google Scholar] [CrossRef] [Green Version]
- Clarke, R.J.; Catauro, M.; Rasmussen, H.H.; Apell, H.-J. Quantitative calculation of the role of the Na+,K+-ATPase in thermogenesis. Biochim. Biophys. Acta-Bioenerg. 2013, 1827, 1205–1212. [Google Scholar] [CrossRef] [Green Version]
- Clarke, R.J.; Fan, X. Pumping ions. Clin. Exp. Pharmacol. Physiol. 2011, 38, 726–733. [Google Scholar] [CrossRef]
- Kay, A.R.; Blaustein, M.P. Evolution of our understanding of cell volume regulation by the pump-leak mechanism. J. Gen. Physiol. 2019, 151, 407–416. [Google Scholar] [CrossRef] [Green Version]
- Morth, J.P.; Pedersen, B.P.; Toustrup-Jensen, M.S.; Sørensen, T.L.-M.; Petersen, J.; Andersen, J.P.; Vilsen, B.; Nissen, P. Crystal structure of the sodium-potassium pump. Nature 2007, 450, 1043–1049. [Google Scholar] [CrossRef]
- Kanai, R.H.; Ogawa, H.; Vilsen, B.; Cornelius, F.; Toyoshima, C. Crystal structure of a Na+-bound Na+,K+-ATPase preceding the E1P state. Nature 2013, 502, 201–206. [Google Scholar] [CrossRef]
- Kaplan, J.H. Biochemistry of Na,K-ATPase. Annu. Rev. Biochem. 2002, 71, 511–535. [Google Scholar] [CrossRef]
- Petrič, M.; Vidović, A.; Dolinar, K.; Miš, K.; Chibalin, A.V.; Pirkmajer, S. Phosphorylation of Na+,K+-ATPase at Tyr10 of the α1-subunit is suppressed by AMPK and enhanced by ouabain in cultured kidney cells. J. Membr. Biol. 2021, 254, 531–548. [Google Scholar] [CrossRef]
- Feschenko, M.S.; Sweadner, K.J. Structural basis for species-specific differences in the phosphorylation of Na,K-ATPase by protein kinase C. J. Biol. Chem. 1995, 270, 14073–14077. [Google Scholar] [CrossRef] [PubMed] [Green Version]
- Beguin, P.; Beggah, A.T.; Chibalin, A.V.; Burgener-Kairuz, P.; Jaisser, F.; Mathews, P.M.; Rossier, B.C.; Cotecchia, S.; Geering, K. Phosphorylation of the Na,K-ATPase α-subunit by protein kinase A and C in vitro an in intact cells. J. Biol. Chem. 1994, 269, 24437–24445. [Google Scholar] [CrossRef] [PubMed]
- Kann, M.G.; Shoemaker, B.A.; Panchenko, A.R.; Prztyycka, T.M. Correlated evolution of interacting proteins: Looking behind the mirrortree. J. Mol. Biol. 2009, 385, 91–98. [Google Scholar] [CrossRef] [Green Version]
- Ochoa, D.; Pazos, F. Practical aspects of protein co-evolution. Front. Cell Dev. Biol. 2014, 2, 1–9. [Google Scholar] [CrossRef] [PubMed] [Green Version]
- McPartland, J.M.; Norris, R.W.; Kilpatrick, C.W. Coevolution between cannabinoid receptors and endocannabinoid ligands. Gene 2007, 397, 126–135. [Google Scholar] [CrossRef]
- Pei, Z.-Y.; Mu, G.-L.; Pan, J.; Zhang, D.-M. Codon usage and coevolution of the large and small subunits of ribulose-1,5-bisphosphate carboxylase/oxygenase. J. Syst. Evol. 2013, 51, 511–521. [Google Scholar] [CrossRef]
- De Juan, D.; Pazos, F.; Valencia, A. Emerging methods in protein co-evolution. Nat. Rev. Genet. 2013, 14, 249–261. [Google Scholar] [CrossRef]
- Roskoski, R., Jr. Src protein-tyrosine kinase structure, mechanism, and small molecule inhibitors. Pharmacol. Res. 2015, 94, 519–525. [Google Scholar] [CrossRef] [PubMed]
- Baier, G.; Telford, D.; Giampa, L.; Coggeshall, K.M.; Baier-Bitterlich, G.; Isakov, N.; Altman, A. Molecular cloning and characterization of PKCθ, a novel member of the protein kinase C (PKC) gene family expressed predominantly in hematopoietic cells. J. Biol. Chem. 1993, 268, 4997–5004. [Google Scholar] [CrossRef]
- Basu, A. The enigmatic protein kinase C-eta. Cancers 2019, 11, 214. [Google Scholar] [CrossRef]
- Bjorge, J.D.; Jakymiw, A.; Fujita, D.J. Selected glimpses into the activation and function of Src kinase. Oncogene 2000, 19, 5620–5635. [Google Scholar] [CrossRef] [PubMed] [Green Version]
- Pazos, F.; Valencia, A. Similarity of phylogenetic trees as indicator of protein-protein interactions. Protein Eng. 2001, 14, 609–614. [Google Scholar] [CrossRef] [PubMed]
- Ochoa, D.; Pazos, F. Studying the co-evolution of protein families with the Mirrortree web server. Bioinformatics 2010, 26, 1370–1371. [Google Scholar] [CrossRef] [PubMed] [Green Version]
- Ochoa, D.; Juan, D.; Valencia, A.; Pazos, F. Detection of significant protein co-evolution. Bioinformatics 2015, 31, 2166–2173. [Google Scholar] [CrossRef] [PubMed] [Green Version]
- Endres, N.F.; Barros, T.; Cantor, A.J.; Kuriyan, J. Emerging concepts in the regulation of the EGF receptor and other receptor tyrosine kinases. Trends Biochem. Sci. 2014, 39, 437–446. [Google Scholar] [CrossRef] [PubMed]
- Yudowski, G.A.; Efendiev, R.; Pedemonte, C.H.; Katz, A.I.; Berggren, P.-O.; Bertorello, A.M. Phosphoinositide-3 kinase binds to a proline-rich motif in the Na+,K+-ATPase α subunit and regulates its trafficking. Proc. Natl. Acad. Sci. USA 2000, 97, 6556–6561. [Google Scholar] [CrossRef] [Green Version]
- Edgar, R.C. MUSCLE: Multiple sequence alignment with high accuracy and high throughput. Nucleic Acids Res. 2004, 32, 1792–1797. [Google Scholar] [CrossRef] [Green Version]
- Kumar, S.; Stecher, G.; Li, M.; Knyaz, C.; Tamura, K. MEGA X: Molecular evolutionary genetics analysis across computing platforms. Mol. Biol. Evol. 2018, 35, 1547–1549. [Google Scholar] [CrossRef]


| PKC Isoform | rAB * | N | N |
|---|---|---|---|
| α | 0.9051 | 113 | 6328 |
| β | 0.8407 | 112 | 6216 |
| γ | 0.8833 | 81 | 3240 |
| δ | 0.8795 | 122 | 7381 |
| ε | 0.8254 | 116 | 6670 |
| η | 0.9495 | 106 | 5565 |
| θ | 0.9509 | 118 | 6903 |
| ζ | 0.8270 | 107 | 5671 |
| λ | 0.8484 | 113 | 6328 |
| Src Family Member | rAB * | N | N |
|---|---|---|---|
| Src | 0.9155 | 295 | 43,365 |
| Yes | 0.8745 | 271 | 36,585 |
| Lyn | 0.8219 | 303 | 45,753 |
| Lck | 0.1711 | 248 | 30,628 |
| Fyn | 0.4896 | 232 | 26,796 |
| Fgr | 0.8157 | 231 | 26,565 |
| Hck | 0.8510 | 262 | 34,191 |
| Blk | 0.8464 | 258 | 33,153 |
Disclaimer/Publisher’s Note: The statements, opinions and data contained in all publications are solely those of the individual author(s) and contributor(s) and not of MDPI and/or the editor(s). MDPI and/or the editor(s) disclaim responsibility for any injury to people or property resulting from any ideas, methods, instructions or products referred to in the content. |
© 2022 by the authors. Licensee MDPI, Basel, Switzerland. This article is an open access article distributed under the terms and conditions of the Creative Commons Attribution (CC BY) license (https://creativecommons.org/licenses/by/4.0/).
Share and Cite
Blayney, E.-L.; Chennath, M.; Cranfield, C.G.; Clarke, R.J. Bioinformatic Analysis of Na+, K+-ATPase Regulation through Phosphorylation of the Alpha-Subunit N-Terminus. Int. J. Mol. Sci. 2023, 24, 67. https://0-doi-org.brum.beds.ac.uk/10.3390/ijms24010067
Blayney E-L, Chennath M, Cranfield CG, Clarke RJ. Bioinformatic Analysis of Na+, K+-ATPase Regulation through Phosphorylation of the Alpha-Subunit N-Terminus. International Journal of Molecular Sciences. 2023; 24(1):67. https://0-doi-org.brum.beds.ac.uk/10.3390/ijms24010067
Chicago/Turabian StyleBlayney, Emma-Lucille, Milna Chennath, Charles G. Cranfield, and Ronald J. Clarke. 2023. "Bioinformatic Analysis of Na+, K+-ATPase Regulation through Phosphorylation of the Alpha-Subunit N-Terminus" International Journal of Molecular Sciences 24, no. 1: 67. https://0-doi-org.brum.beds.ac.uk/10.3390/ijms24010067