Aggressive Predation Drives Assembly of Adriatic Fish Communities


CIMMAR and Department of Ecology, Agronomy, and Aquaculture, University of Zadar, Zadar 23000, Croatia
*
Author to whom correspondence should be addressed.
†
These authors contributed equally to this work.
Diversity 2020, 12(4), 130; https://0-doi-org.brum.beds.ac.uk/10.3390/d12040130
Submission received: 29 February 2020
/
Revised: 24 March 2020
/
Accepted: 28 March 2020
/
Published: 30 March 2020
(This article belongs to the Special Issue Predators as Agents of Selection and Diversification)
Abstract
:We performed over 19,000 lure-assisted, underwater visual fish census transects at over 140 shallow coastal sampling locations in the mid- eastern Adriatic sea of the Croatian mainland and islands, recording all fish taxa observed, their predatory behavior in response to the lure, and the cover of benthic habitats with which they were associated. We hypothesized that prey habitat preference was a learned or selected response to aggressive behavior by piscivorous mesopredators, and predicted that mobile prey would be spatially segregated from aggressive predators into different benthic habitats within local sampling sites. We found that aggressive piscivores were primarily wait-chase or cruise-chase mesopredators that preferentially foraged along heterogeneous habitat edges within juxtapositions of rock, unconsolidated sediment, macroalgae (Cystoseira spp.) and seagrass (usually Posidonia oceanica). Prey species and less aggressive piscivores avoided these heterogeneous habitats and preferred more homogeneous habitats that the aggressive predators in turn avoided. We found strong and consistent spatial segregation between aggressive predators on the one hand, and less aggressive predators and prey on the other hand. These results are consistent with the hypothesis that aggressive behavior by piscivorous species is the primary organizing force shaping assembly of fish communities at our study sites, driving preference and occupancy of heterogeneous and homogeneous benthic habitats. Management of shallow benthic resources should recognize the value of complementarity in habitats allowing coexistence of predators and prey through contrasting habitat preferences.
1. Introduction
Predators play a dominant role in the evolution and organization of communities. As keystone species, they can regulate prey populations, prevent competitive exclusion, protect lower trophic levels in trophic cascades, and maintain biodiversity [1]. One effect of predators is to select for defensive adaptations in their prey, including habitat choice. In shallow demersal fish communities, both consumption and intimidation of prey by predators has been shown to influence prey habitat choice, through innate adaptations and learned preferences [2,3,4]. Prey choose habitats by balancing predation risks against foraging efficiency, often choosing less productive habitats that present lower risk of predation mortality when predators are detected in the immediate vicinity [5,6,7,8,9].
High value habitats in shallow marine or estuarine environments include three-dimensional structure, such as rocky reefs and submerged aquatic vegetation (seagrass, algae, salt marsh, mangrove, reed beds). These habitats are often hotspots for animal abundance or diversity, as prey use them as feeding areas and cover from predators [10,11]. The success of predators in such habitats depends on their predation mode. Visual predators who chase prey through the water column, for example, might have difficulty foraging in dense seagrass meadows due to obstruction of movement and light by plant biomass. In contrast, predators who sit and wait for prey to stray near, and then with a sudden explosive burst, ingest prey with suction and a wide gape, might find submerged vegetation or rock crevices optimal ambush cover [12].
Structural complexity is expected to primarily reduce mobile visual search and sustained-chase capture [13,14]. Complexity also causes increased hindrance to maneuvering, maintenance of the necessary speed and reduces the sustained visual tracking period [15,16]. Physical structure helps conceal predators that sit-and-wait and sneak-attack. If they are resident and dominant within complex habitat patches, then such places become the opposite of a refuge and can reduce fitness of the prey [5,17,18]. Faced with a mix of predators and habitats of varying complexity, prey can be flexible in their responses: hiding more, moving less, or completely switching habitat patches [19,20,21,22,23].
The habitat that carries the lowest predation risk at any time and place then depends on the relative abundance of search and capture modes within the predator guilds that happen to be in the vicinity of prey, and the number and type of habitats available [24]. Likewise, the total strength of selection for or against a particular habitat preference in the prey depends on the relative abundance of different predation modes. Abundant chase-pursuit predators may select for a positive prey preference for dense and dark 3D habitat as cover. That prey preference then might select for greater patrolling along the edges of 3D structure by chase-pursuit visual predators, for prey moving in and out of the structured habitat. On the other hand, a high ratio of ambushing burst-capture to cruise-chase predation might select for prey who avoid ambushing habitat, and use alternative defense behavior such as schooling in open water, crypsis, or burial in sediment.
The idea that the predation risk of a habitat is not constant but varies in time and space depending on the relative abundance of different predation modes of piscivorous fish guilds, the predation mode hypothesis (PMH), predicts that prey habitat preference should evolve to be flexible in response to the identity of nearby predators detected visually or chemically [25]. Under the PMH, if prey are mobile and are capable of avoiding contact with predators, and have evolved either innate or learned habitat preference in response to predator selection, then fish communities should assemble into the local habitat matrix depending on the relative abundance and activity of different predation modes, with the result that predators and prey are segregated in habitat space. This segregation should be especially pronounced for highly aggressive predators, which should have a disproportionate impact on community structure. While coexistence of predator and prey requires at least some local segregation in space, it does not necessarily require segregation across habitats at a larger spatial scale. Such segregation requires breadth and diversity of habitats sufficient to cause a selective advantage to prey that prefer habitats (e.g., refuges) that differ from those preferred by predators.
In the Adriatic Sea, as in all the world’s oceans, top predators at high trophic levels, have declined, in many cases to levels below 10% of historical abundance, due to chronic overharvest and habitat destruction [26,27]. As a result, their prey populations, including many species of mesopredators, are released and have increased up to four times their original abundance [6,28]. More abundant mesopredators in turn have depleted their prey populations and caused major changes in fish diversity, habitat use, and community organization.
At the same time, the available benthic habitats have changed. Submerged vegetation has declined in extent in the Adriatic and worldwide, in response to deteriorating water quality and coastal development [29,30]. Large seagrass and algal meadows in many areas have been replaced by urchin barrens, or mosaics of bare rock and sand interspersed with smaller and fragmented patches of surviving vegetated habitat [31,32]. As seagrass meadows and other vegetation have become fragmented, the amount of edge habitat, or juxtapositions between open water and vegetation, have most likely increased in many areas, along with the risk of predation by mesopredators [29,33]. Predation modes favored include cruise-chase and wait-chase modes, where mesopredators cruise or passively wait along the edges of fragmented structured habitat, and then swim-chase or burst-chase unsuspecting prey as they emerge.
In this study of Adriatic fish communities, we sought to verify community-level predictions of the hypothesis that habitat choice of mobile prey is selected by predators. These include (1) predators and prey are negatively associated at the local, single transect scale; (2) predators tend to prefer habitats that favor their predation search/capture modes, and (3) predators and prey are also negatively associated at larger scales with different habitat preferences, with aggressive predators more negatively associated than less-aggressive predators.
2. Materials and Methods
2.1. Sampling Fish and Habitats
We used a surface-based, nondestructive, underwater visual-census (VC) method enhanced with a simple 5 cm × 0.5 cm double-cone lead lure moved with a transparent monofilament line a few centimeters above the substratum. The lure has been shown to increase the probability of sampling fast-moving, cryptic, and motionless species [12,18,34]. VC offers important advantages over catch-based methods, including the potential to identify all species within their currently occupied habitats, to estimate the relative cover of each habitat in the sampled area, and to observe behavior of each fish visiting the lure, including predatory behavior targeting the lure. This allowed us to quantify the relative abundance of each habitat per sampled area (using the line-intercept method [35]), probabilities of choice, negative (avoidance) or positive (preference), as all habitats encountered were recorded for each species observed, and the incidence of aggressive behavior towards the lure for each visit. We estimated habitat choice for small (<5 cm) and large (≥5 cm) individuals within each species [36,37]. Most of the small individuals were juveniles, with most exceptions in the Gobidae family.
We chose a snorkel-based rather than SCUBA-based approach to avoid visual and auditory disruption of fish behavior [38] and to assess the entire water column from surface to bottom [39]. All VC counts were carried out in transparent water to a maximum depth of 9 m, where visibility approached 20–30 m and the lure was always clearly visible.
2.2. Sampling Scale and Locations
We performed a total of 19,678 lure-assisted, visual-census, field transects at 149 outer coast study sites in Croatia, for an average of 132 transects per site. Sampling was performed between May and October 2009 to 2015, during maximal occurrence of many Mediterranean littoral fish species including within Cymodocea nodosa seagrass meadows [40,41,42]. The sites were chosen to span the N-S and E-W range of the Croatian coast (north to central Adriatic), and to include both mainland and island locations, for a total of 18 inner and outer islands (Figure 1).
Sites differed in protection status and enforcement (including five statutory marine protected areas), shoreline development, the presence and extent of urchin barrens, and benthic habitat. Benthic habitats included rocky reefs and unconsolidated and vegetated (algae, Posidonia oceanica, Cymodocea nodosa) sediments. Effort was made to sample from early summer to fall and at haphazardly chosen sampling sites representative of natural site variability and to ensure that fish were observed at a range of ontogenetic stages and across the full spectrum of natural habitats and resources at all spatial scales within the republic of Croatia.
2.3. Transects
We used the standard VC transect method [43,44] in which a snorkeler (always CK) swam at the surface in a “random walk”: a sequence of haphazard changes in direction similar to those in a method pioneered by [45]. Speed was held constant for 10 seconds of travel but the transect length varied from 3 to 4.5 meters per second due to random variability in current. Each transect was defined by a straight line traversed by the lure and the sampling volume extended one meter to the right and left of the transect, from the snorkeler to the sea bottom [34].
Distinct nekton taxa were identified either as individuals or as observational groups of one to 1000 individuals of the same taxon. For each species in each group, the actual number of individuals to 20 was counted, and numbers higher than 20 were estimated in increments of 10 to a group size of 100, then in increments of 100 to the maximum observed group size of 1000.
2.4. Homogeneous vs. Heterogeneous Habitats
In order to match observed fish with the small-scale habitat they occupied at the time of observation, proportional cover of each transect with basic habitat types, including: rock (R), unconsolidated sediment (U), algae on sediment (A), Posidonia oceanica (P), and Cymodocea nodosa (C), Zostera noltii (N), and detrital plant litter (D, mainly Posidonia leaf material) was calculated as the proportion of the transect line-intercepted [35]. Transects with only one contributing basic habitat (R, U, A, P, C, N, D) were categorized as homogeneous, while transects that included distinct patches of more than one basic habitat (regardless of identity) were categorized as heterogeneous. Patches intersected that occupied less a minimum of 10% of the overall transect length were excluded. Heterogeneous habitats, as defined here, are therefore functionally equivalent to the presence of one or more habitat transitions at the scale of a single transect.
2.5. Fish Functional Groups
Fish were defined as potential prey if the size was equal to or smaller than 5 cm standard length (SL). This length was chosen because it is close to the maximum size that can be accommodated by the gape size of all the mesopredators in this community. Because the lure was also 5 cm long and was followed, attacked and ingested by mesopredators, we know that fish of this size or smaller can be preyed on by the mesopredators studied here. Most fish of that size were juveniles; fish that were prey size as adults were cryptic members of the families Blennidae and Tripterygiidae and sand-associated cryptic species, such as Pomatoschistus and similar unidentified Gobidae. Adult fish were identified as either being piscivores or non-piscivores based on Fishbase information on “food items” and additionally based on original observations of piscivory during the observations, e.g., Symphodus tinca and Coris julis.
2.6. Predator Aggression
The intensity or degree of aggression of predatory chase and attack was evaluated on the basis of interaction with the lure, whose length (5 cm) was the threshold for defining a fish as a prey individual. The lure itself was a double cone, thus resembling the shape of any streamlined fish. We categorized lure interaction based on four behaviours: visiting the lure, following the lure, partial and full ingestion of the lure. Visits were defined by a fish making a clear move towards the lure, following was defined as a sustained directional swimming after the lure. Ingestion was partial or full (followed always by its regurgitation). The lure was attached to a monofilament line, making it easy to retrieve after ingestion.
2.7. Predation Modes
We assigned predation modes to piscivorous taxa based on the detailed information in [46] and over 1000 h of original field observations in this and previous studies [12] (Table 1). The first dimension to define predation mode distinguished search and catch behaviors which can each be active or passive. The second dimension considered methods of search and catch within each of passive and active modes. The result are six predation modes that we label ambush, wait-chase, cruise-chase, sneak-attack, substrate dwelling, and planktivory.
2.8. Statistical Analysis
Spatial segregation of species defined by their predation status was tested with generalized linear mixed models assuming a Poisson family for the distribution of model residuals. Segregation was defined as a negative abundance correlation within individual transects, which were considered random replicates within random sampling sites.
Habitat segregation of species defined by their predation status was tested with generalized linear mixed models in which habitat and predation status were fixed factors, and sampling site a random factor, and segregation was defined as a significant interaction effect between habitat and predation status on observed abundance within transects. Habitat preference or avoidance was quantified as the value and sign of the chi-square residual for each habitat type for each level of predation status. For this analysis habitat was considered a categorical variable represented by one or more of the letters U, A, C, P, R, N, D indicating the presence within the transect of unconsolidated sediment, macroalgae, Cymodocea seagrass, Posidonia seagrass, rock (minus macroalgae), Zostera seagrass, or plant detritus.
Ordination of piscivores and prey taxa in habitat space was performed using non-metric multidimensional scaling of Bray-Curtis distances, in which each piscivorous taxon was classified as exhibiting high or low aggression, and prey taxa were classified simply as prey. The ordination matrix represented the mean proportion cover of all habitat types within transects in which each taxon was recorded as present. Proportion cover was estimated for habitat types rock with turf algae (Rt), rock with vertical algal growth (Rv), bare rock (Rb), unconsolidated sediment (U), macroalgae (A, usually Cystoseira spp.), the seagrass Cymodocea nodosa (C), and the seagrass Posidonia oceanica (P).
All analysis were performed with R [47], using the base and lme4 packages.
3. Results
We identified a total of approximately 50 benthic habitat types, as various combinations of substrates and vegetation. The most common homogeneous habitats were rock, unconsolidated sediment, Posidonia oceanica seagrass, and Cymodocea nodosa seagrass. The most common heterogeneous habitats were combinations of rock or algae with unconsolidated sediment or Posidonia seagrass (Figure 2).
We recorded a total of 216,157 individuals of 107 neritic taxa of fish and cephalopods, 86 identified to species level, of which the most abundant were Atherina spp., Chromis chromis, Coris julis, Oblada melanura, Diplodus vulgaris, Diplodus annularis, Sarpa salpa, and an unidentified juvenile fish (Figure 3, Table 2).
The most aggressive predators, as defined by approaching, attacking and ingesting the lure, were found to be nine taxa in the families Serranidae (3), Gobidae (3), Sparidae (2), and Labridae (1) (Table 3).
3.1. Spatial Segregation
The nine species identified as the most aggressive predators observed were very highly negatively correlated within transects with the total number of prey fish (Table 4). Presence of at least 10 individuals of one of the nine species of aggressive predators was associated with an average of 1.1 prey, while less than 10 individuals was associated with an average of over 2.3 prey. All non-aggressive adults were also negatively associated with prey, but the association was much weaker – deviance reduction in the fitted generalized linear model was 10x higher for the aggressive predators (“Deviance” column in Table 4 shows the amount by which the null deviance is reduced by the indicated model relationship).
3.2. Habitat Segregation
Highly aggressive predators significantly preferred heterogeneous habitats, where they were recorded 21% more often than expected by chance (Table 5 and Table 6). Potential prey in contrast significantly avoided heterogeneous habitats, where they were observed 12% less often than expected by chance. Less aggressive adults also significantly avoided heterogeneous habitat, where they were observed 21% less often than expected by chance (Table 6). Among habitats, chi-square residuals for aggressive and less-aggressive predators were in the opposite direction 42 out of 51 times (82%, Table 6).
Across the sampled sites, prey avoided heterogeneous habitats but had a positive association with certain homogeneous habitats such as Cymodocea (C) unconsolidated sediments (U) and Posidonia (P). The difference in habitat preference between prey and aggressive predators was overall highest in C and U: in both cases aggressive predators avoid C and U, while prey strongly prefer C. The difference in habitat preference between less-aggressive predators and prey is highest in C and in R. Prey avoided R while less-aggressive predators prefer it and prey has a much higher affinity to C than less-aggressive predators (Table 6).
As a group, aggressive predators significantly avoided homogeneous rock, unconsolidated sediment, and Cymodocea seagrass, and significantly preferred combinations involving unconsolidated sediment with rock, Posidonia seagrass, or algae (UA, RU, RP, RUA, RUP, and UP) (Table 6). In contrast, potential prey occupied five of these six habitats less often than expected by chance, and three of them (UA, RUA, and RUP) significantly less often. Less-aggressive adults significantly avoided all these habitats. The most preferred habitat by aggressive predators, a mixture of unconsolidated sediment and algae (UA), was also the single most avoided habitat by potential prey. Similarly, the most preferred habitat by potential prey, homogeneous Cymodocea seagrass (C), was one of the three habitats most avoided by the aggressive predators group. Less-aggressive adults overwhelmingly preferred homogeneous rock and unconsolidated sediment, which were the two most avoided habitats by aggressive predators.
3.3. Ordination
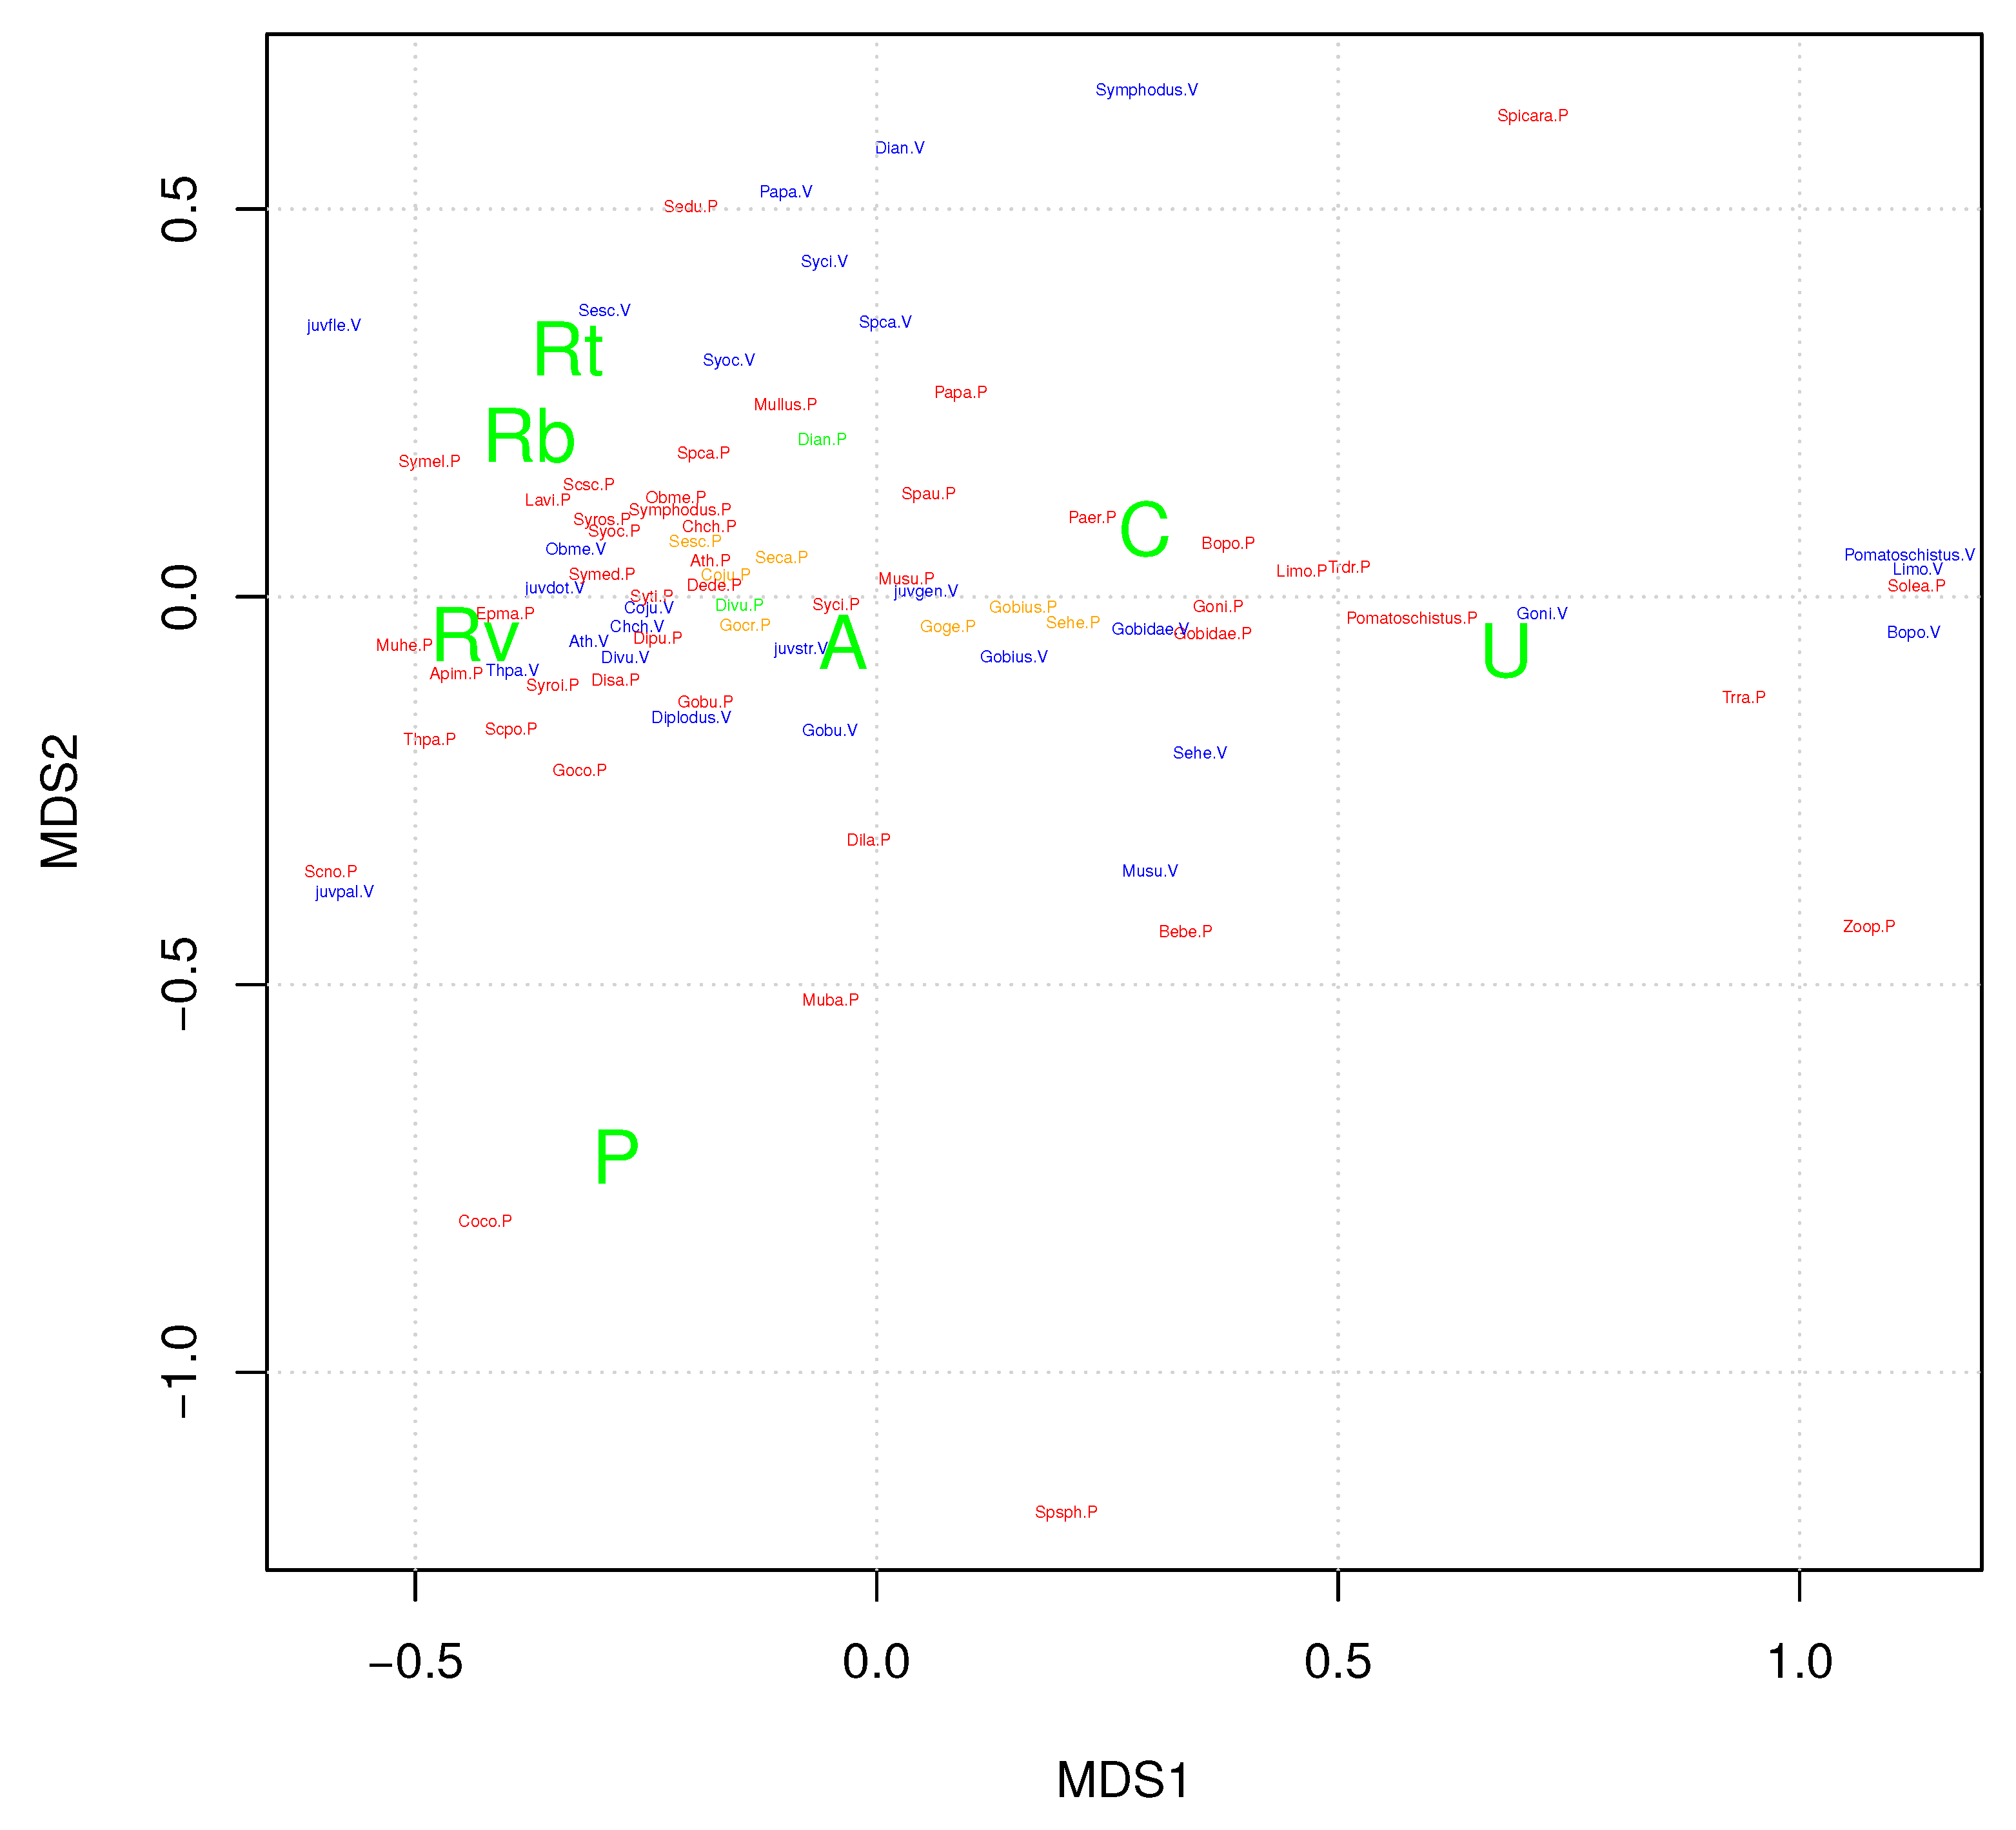
NMDS ordination shows that the aggressive predators occupy a compact region in the center of the map, near the origin where no single habitat type (substrate or vegetation) dominates (Figure 4). In contrast the prey and less aggressive adults occupy regions away from the center, towards extreme homogeneous habitat types of substrate and vegetation. Prey are not clustered within any single habitat type; rather, prey are dispersed outwards in the ordination, away from the aggressive predators, towards more homogeneous habitats.
4. Discussion
Predators are predicted to select for prey defenses, including negative behavioral preference for habitats with high risk of predation, if such preference results in a net marginal fitness gain. The simplest models predict that the optimal prey behavior is not a preference for a single habitat, but for at least two habitats: 1) the habitat with the absolute lowest predation risk (“refuge”) regardless of foraging needs, and 2) the habitat(s) capable of minimally satisfying the prey’s foraging needs, and of course the lowest risk among these should be preferred [9,48,49]. The prey is predicted to alternate occupancy between these two habitat types to balance the two components of fitness, remaining in the refuge until some threshold in nutritional need is passed. Of course if these two habitats are the same, then preference would evolve for that single habitat.
This model, however, oversimplifies by assuming constant predation risk in each habitat. If predators are potentially present in all habitats, and can move freely among habitats, then the system is evolutionarily dynamic with constantly changing optimal behavior. In this case, prey are selected to be behaviorally flexible and perceptually aware and able to alter habitat use in response to the local spatial cost/benefit matrix. In either model, the result is a negative association between predators and prey at small scale, the scale at which predators carry out their search, chase, and capture activities.
The truth may be somewhere between the two extremes: relative predation risk is at least somewhat predictable across habitats, but can still vary locally. Relative predation risk might be somewhat predictable because different predation modes are not equally effective, and their effectiveness varies in different habitats. If predators tend to prefer habitats that favor success in their predation mode, then the risk they impose is more predictable, and they will select for prey that tend to avoid those habitats (the predation mode hypothesis, [25]). This will be especially true if the most aggressive predators in a community have predictable habitat preferences. In this case, selection should favor both flexibility of prey and an overall average negative association between predators and prey in the habitat matrix over a larger spatial scale.
In this study we sought to check these predictions: 1) predators and prey are negatively associated at the local, single transect scale; 2) predators tend to prefer habitats that favor their predation search/capture modes, and 3) predators and prey are also negatively associated at larger scales with different habitat preferences, with aggressive predators more negatively associated than less-aggressive predators. We discuss these in turn.
4.1. Predators and Prey are Negatively Associated at the Local Scale
We found that mesopredators and prey are highly significantly negatively associated within individual transects. Moreover, aggressive predators were far more negatively associated with prey within transects than less aggressive predators, as is predicted if predation activity has a direct causal effect; i.e. direct selection on behavioral response. If the incorrect behavior is likely to result in death, then the selective differential will be high.
These results are consistent with both empirical and theoretical studies that argue for selective effects on prey defense behavior resulting in behavioral avoidance, most often reducing the likelihood of detection and attack [50,51]. A prerequisite is to know where the predator is located and ability to read its condition and behavior through multiple cues, at least visual and chemical [50,52]. Once a potentially dangerous predator has been detected, cues transmit additional information about type, position, distance and level of hunger and aggression. Prey then make a threat-sensitive assessment of risk: if the predator is less aggressive and easily monitored, prey will just alter its immediate distance to the predator and lower its activity level to evade detection [50], resulting in little or no cross-habitat movement.
If the predators are aggressive but predictable in their wider habitat use, e.g., because of predation mode requirements [12], prey can reduce mortality by switching habitats. Thus a positive spatial correlation of prey and predators might result locally if easily cue-monitored non-aggressive or low-risk but highly mobile predators are present, e.g., cruise-chase predators. Prey will be negatively correlated to highly aggressive predators on a local scale (transect) but are segregated by habitat use on a larger scale when difficult-to-monitor aggressive predators can be predicted in their habitat use, e.g., wait-chase predators.
4.2. Predators Tend to Prefer Habitats that Favor Their Predation Search/Capture Modes
Taxa identified as the most aggressive predators (Table 3 and Table 5) highly significantly preferred heterogeneous habitats. Seven of these species exhibit almost exclusively the classic wait-chase predation strategy: searching for and encountering prey during passive sit-and-wait behavior, followed by a burst-chase active pursuit of the prey (see Table 1). We observed consistent display of this sequence of typical WCH behaviors in these species towards the lure and occasionally towards real prey. Because active chase-pursuit is generally found to be more successful in an open environment, we predicted that species with this pursuit mode would prefer habitats with an open component, but near 3D structure where prey are likely to be finding refuge. This preference then in theory could create a predictably higher risk to prey near these heterogeneous edges, resulting in selection favoring cross-habitat movement by prey. We consider these species in turn.
Serranus scriba is a large-gaped demersal fish that waits in search for encounters with prey (or lure) from hidden positions at the edges of three-dimensional habitat patches. We observed that the majority of S. scriba waits above or within algal cover or an overhang within heterogeneous rocky reefs but also observed it hovering above or hiding at the base of algal or Posidonia meadows bordering the exposed sandy matrix. In all cases S. scriba monitors the visually open areas. Upon detection of passing prey (or the lure) S. scriba does a short but very fast burst chase and occupies, upon completion of prey pursuit, another waiting spot.
Serranus cabrilla is another large-gaped serranid we found to be mainly associated with partially algal-covered rock sheets and fragmented algal meadows, hiding within the vegetation while searching neighboring open areas. Like its congener S. scriba, it pursues nearing prey with a short burst chase and was the most successful species in ingesting the lure.
Serranus hepatus is the smallest species in the genus and we found it associated with fragmented algal and Cymodocea meadows on a sandy matrix. While S. hepatus aggressively followed the lure as often as S. cabrilla, its smaller size and gape prevented frequent ingestions.
Gobius cruentatus is a well camouflaged gobiid we found associated with rocky reefs, waiting for prey (or the lure) while hiding in cracks between or underneath boulders on or near sandy openings. The species infrequently attacked the lure, but its rate of ingestion per attack was the second highest within the group of aggressive mesopredators.
Gobius geniporus we observed to be a sand-associated species that is already strikingly camouflaged with the substrate but was usually nearby 3D structural elements such as boulders or small patches of algal cover, to enhance its surprise attack on bypassing prey. In contrast to G. cruentatus, this species follows the lure with a prolonged chase, yet without a high rate of lure ingestion. This is to be expected of a bottom-moving fish in pursuit of a lure 5 cm above the substrate.
Coris julis is a small-gaped fish that we observed in almost constant movement, changing positions within its heterogeneous home range at transitions from rocky reefs to algal meadows. Between moves we observed C. julis to wait above the substrate surveying for prey or other fish already in pursuit of prey. Its following rate of the lure was 69% and often small groups of C. julis followed other fish following the lure. C. julis pursued the lure in the most sustained way of all species in the aggressive mesopredator cohort. Yet, its rate of ingestion is low due to its small gape. On occasion we observed C. julis inhaling small juvenile fish in the 1 to 3 cm range. Despite the low ingestion rate, C. julis has potentially the highest impact on the prey community because of its 10x to 100x higher abundance.
Diplodus vulgaris and D. annularis are the two most abundant species in the genus Diplodus [53] and have a broad prey spectrum of invertebrate prey and fish [54]. Both species we observed to be cruise-chase predators searching actively for prey (or the lure) that they chase in an active and sustained pursuit. Their following rates of the lure were high; however, because of their relatively small gape, they were less successful in ingesting it than the wide-gaped Serranids or Gobius cruentatus. D. vulgaris cruises heterogeneous rock-sand transitions and fragmented algal meadows but can exhibit an alternative to the cruise-chase (CRCH) predation mode: a WCH strategy of hovering at the edge of vegetation for prey which they burst-chase in a very similar fashion to the Serranidae described above. D. annularis cruised Posidonia meadows and the transitions between Posidonia and Cymodocea beds or fragmented algal meadows.
4.3. Aggressive Predators and Prey are Negatively Associated at Larger Scales with Different Habitat Preferences
As discussed above, the most aggressive predators in our study generally preferred habitats with an open component near an edge of 3D structure, which is consistent with their modes of predation. This preference in theory should select for avoidance behavior of those habitats by prey, a prediction that our data confirmed, as prey tended to prefer homogeneous habitat that was generally avoided by aggressive predators as a group (Table 5 and Table 6, Figure 4). Prey were more negatively associated with aggressive than less-aggressive predators, as the former’s abundance resulted in 10 times the deviance reduction than the latter (Table 4).
Over the entire sampling scale, prey avoided heterogeneous habitats and the difference in habitat preference between prey and aggressive predators was overall highest for C and U habitats (Table 6), because aggressive predators avoid the C and U habitats. The difference in habitat preference between non-aggressive predators (N) and prey (V) is highest in C and R. These results indicate that, on average, Cymodocea nodosa meadows can offer a potential refuge from both aggressive and less-aggressive predators. Among individual species, however, only Diplodus annularis showed a clear preference for homogeneus C. nodosa while juvenile. Among the N and P species none showed an overall preference for homogeneus C. nodosa. These relationships are consistent with the hypothesis that prey flexibly and opportunistically use C. nodosa when it is present, as a refuge habitat either in areas with abundant aggressive predators in heterogeneous habitats of all combinations, or areas with abundant less-aggressive predators in homogeneous U and R, which favors ambush, sneak and attack, sand dwelling, and cruise-chase predators.
The reasons a prey individual would choose Cymodocea nodosa beds as refuge over other 3D structure are not answerable in this study. In previous work, C. nodosa beds have been shown in some situations to provide superior foraging returns to fish, which might have been instrumental in this choice. Comparative studies of epifauna on C. nodosa and Posidonia oceanica in the Mediterranean have shown that the epiphyte and epifauna communities associated with C. nodosa can provide equal or even larger quantities of algal and animal food for prey-sized fish [55,56,57,58].
4.4. Interactions among Predators
One unexpected result was the significant negative habitat associations within the mesopredator guild: aggressive and less-aggressive predators tended to be segregated into different habitats, with the less-aggressive tending to prefer homogeneous rock or unconsolidated sediment, or to a lesser extent, Cymodocea seagrass.
The simplest explanation for this negative association is direct: intimidation or interference by more aggressive species might select for avoidance behavior. Adults would then avoid them to reduce energetic demands of responding to the aggression, and juveniles might avoid because they are directly preyed on. Another possible explanation is that the two groups have largely different predation modes that require different optimal habitats.
The majority of the aggressive piscivorous mesopredators are wait-chase predators that require heterogeneous habitats with some 3D-cover to hide inside or hover above while enjoying an unobstructed view of more open habitat elements, such as unconsolidated sand or bare/turf covered rocks to monitor prey movement. These predators are rarely found in the interior of homogeneous habitats, whether 3D structure or not. The homogeneous habitats we observed occupied by ambush predators such as the three Scopaena species (S. porcus, S. notata, and S. scrofa) in the rocky reefs and homogeneous vegetation, or those that hide inside or camouflaged on the surface of homogenous sediments (Trachinus draco, T. radiatus, and Bothus podas). Thus ambush and wait-chase predators appear to be naturally segregated into those habitats predicted by their predation mode.
Another two aggressive mesopredators, D. annularis and D. vulgaris, are cruise-chase predators that we observed in heterogeneous habitats, cruising along unconsolidated corridors in pursuit of prey chased through open water. The highly aggressive D. vulgaris may compete with its less aggressive congeners D. puntazzo and D. sargus, whose populations are in decline [59], especially in areas with high artisanal fishing pressure. The Diplodus species are known to coexist in pristine sites through habitat or depth partitioning (e.g., D. vulgaris and D. sargus), but also through differential prey use within the same habitats and depths (e.g., D. vulgaris and D. puntazzo) [60]. As juveniles they all settle within rocky reefs, where they are well protected from physical stresses and mainly threatened by density dependent competition with each other [61,62,63]. The decline of D. sargus and D. puntazzo due to overfishing may have released D. vulgaris from its competitive restrictions and it may in turn contribute to the further decline of the other congeners through direct competition within the adults and juvenile cohorts or by increased intraguild predation on juveniles of D. sargus and D. puntazzo [53]. Further, the loss of algal cover to urchin barrens creates more heterogeneous environments that might benefit D. vulgaris over the other two congeners.
The habitat relationships observed here can be conceptualized with a recently proposed general theoretical framework addressing predator-prey interactions within habitat landscapes [64,65]. The model assumes a habitat domain of predator and prey whose width varies along a continuum. In this model, emergent interactions are determined by the differences in habitat domains between predator and prey. Predator habitat domain depends mostly on predation mode. The three most basic predation modes: sit-and-wait/ambush (here A), sit-and-pursue (here WCH), and active (here CRCH) have respectively small, larger, largest habitat domains and several species can be combined into these functional groups. If prey and predator habitat domains match, then predation risk is high and intense exploitative competition is expected among the predators. When prey domain is much larger than predator domain, prey can move into a refuge habitat and predators are forced to inflict intraguild predation on each other. This then reduces the predation risk for any prey species with narrower habitat domains unable to move into that refuge. These prey species benefit additionally from the interference competition among predators. These advantages may allow stable coexistence to emerge between predator and prey.
Predators with a wider habitat domain, as for instance sit-and-pursue or wait-chase predators, pose a larger risk to prey. This is because their predation mode is primarily linked to heterogeneity in the landscape rather than a particular habitat, as is often the case with ambush predators. The WCH predators have large domains because of the commonness of fragmented complex habitats, as for example in our study region, the Croatian Adriatic. Under this model we would predict that WCH predators pose a high predation risk to prey over most of the Adriatic shallow landscape. Predation risk is especially high if predators have a very broad prey-spectrum, as for example Diplodus annularis and Diplodus vulgaris and when the broad spectrum is combined with naturally high abundances e.g., Coris julis. These are three species that have a wide habitat breadth and in addition are highly mobile and active CRCH predators (Diplodus annularis, Diplodus vulgaris) or sit-and-pursue (WCH) predators with a relaxed need for a specialized hiding places in the “sit” phase (Coris julis, Gobius). We identified WCH predators as the most aggressive among the Adriatic mesopredators, which indicates the potential for intraguild or intraspecific predation, which we have documented by analysis of gut contents in several piscivorous species (manuscript in preparation). Interference competition is high in these aggressive fish as was observed during the lure observations throughout the study region.
5. Caveats and Recommendations for Further Research
While these patterns of organization of fish communities in the shallow Croatian Adriatic are highly significant, they certainly are not the only processes that determine relative abundance and diversity of species across the benthic habitat matrix. Our study sites lacked abundant top predators, which if present would depress the populations of mesopredators observed here and reduce their impacts on the prey guild, most likely resulting in a different matrix of species habitat preference and avoidance [6]. Because we rarely observed these, our data are unable to gauge their likely influence. Further research could explore this influence, as well as the role of other processes such as competitive or mutualistic interactions, increased/reduced fragmentation of submerged aquatic vegetation habitat due to urchin barrens and anthropogenic disturbance [66], and the foraging return of different refuge habitats used by prey.
Further, our data are unable to inform on the degree to which the prey responses we observed to predator selection were fixed as opposed to a flexible response to local detection and intimidation [67]. The overall preferences we observed across the study area could be in part an instinctive evolved response, or could be a dynamic outcome of the same or similar mesopredator guild selecting for a similar learned response throughout the sampled region.
From a management perspective, these results indicate that benthic habitats for demersal fish cannot be reliably sorted in terms of any fixed value as ecological habitat. Rather, all benthic habitats are valuable and used opportunistically during predator-prey search and escape. Habitats, however, can complement each other in promoting coexistence of predator and prey in the sense that those optimal for predator pursuit and attack can be complemented at any location by habitats that are poor for predator pursuit and attack, allowing escape refuges and stable coexistence. The identities and appropriate combinations of habitats that maximize coexistence and biodiversity depend then on the search, pursuit, and attack modes of the local guild of dominant mesopredators, and could be different at different locations.
6. Conclusions
Our study indicates that the assembly of shallow, demersal fish communities in the Croatian Adriatic can be seen in part as a solution to a predator-prey search-escape problem bounded by limitations on predator pursuit imposed by habitat structure. The result is that the community can be highly and predictably organized in space, as a result of the aggressive behavior of a few dominant mesopredator species. This is true even in communities, such as those we studied, strongly depleted in top predators, where mesopredators are safe from predation and common. The search and attack behavior of these mesopredators selects for prey defenses with predictably different intensity in different habitats. One of those defenses is simple avoidance of higher risk habitats, leading to spatial segregation between predators and mobile prey. Higher risk habitats are those that favor the search/pursuit modes of the mesopredators: heterogeneous edges between 3D structure and open habitat where prey can be monitored and also chased through high-visibility open water. Lower-risk refuges appear to be more homogeneous patches of 3D structure lacking nearby open water favoring the chasing mesopredators, such as patches of seagrass, especially Cymodocea nodosa. Management of shallow coastal habitats could benefit from attention to habitat complementarity, in which prey refugia are matched against the predation modes and habitats of the locally dominant mesopredators.
Author Contributions
Conceptualization, C.K. and S.T.S.; methodology, C.K.; writing—original draft preparation, C.K. and S.T.S.; writing—review and editing, C.K. and S.T.S.; data analysis, S.T.S.; visualization, S.T.S.; project administration, S.T.S.; funding acquisition, S.T.S. All authors have read and agreed to the published version of the manuscript.
Funding
This research was funded by the University of Zadar and the Croatian Science Foundation (HRZZ) grant number 3107.
Acknowledgments
We thank Kornati, Mljet, and Brijuni national parks for permissions, Ivana and Hrvoj Čižmek for field assistance, and Tatjana Bakran-Petricioli and Donat Petricioli for occasional boat transportation.
Conflicts of Interest
The authors declare no conflict of interest. The funders had no role in the design of the study; in the collection, analyses, or interpretation of data; in the writing of the manuscript, or in the decision to publish the results.
Abbreviations
The following abbreviations are used in this manuscript:
| U | unconsolidated sediment |
| R | rock lacking macroalgae |
| Rv | rock with macroalgae |
| Rt | rock with algal turf and no macroalgae |
| Rb | bare rock |
| A | macroalgae or Active or Ambush |
| C | Cymodocea nodosa seagrass |
| N | Zostera seagrass or less-aggressive predators |
| D | dead Posidonia litter |
| P | Posidonia seagrass or Passive or Predator |
| WCH | wait-chase |
| CRCH | cruise-chase |
| SNA | sneak-attack |
| SNCH | sneak-chase |
| CRDW | cruise-dwelling |
| V | prey |
| PMH | predation mode hypothesis |
References
- Clemente, S.; Hernandez, J.C.; Rodriguez, A.; Brito, A. Identifying keystone predators and the importance of preserving functional diversity in sublittoral rocky-bottom areas. Mar. Ecol. Prog. Ser. 2010, 413, 55–67. [Google Scholar] [CrossRef]
- Atherton, J.A.; McCormick, M.I. Active in the sac: Damselfish embryos use innate recognition of odours to learn predation risk before hatching. Anim. Behav. 2015, 103, 1–6. [Google Scholar] [CrossRef]
- Loennstedt, O.M.; McCormick, M.I. Chemical alarm cues inform prey of predation threat: The importance of ontogeny and concentration in a coral reef fish. Anim. Behav. 2011, 82, 213–218. [Google Scholar] [CrossRef]
- Arnason, E.; Hernandez, U.B.; Kristinsson, K. Intense Habitat-Specific Fisheries-Induced Selection at the Molecular Pan I Locus Predicts Imminent Collapse of a Major Cod Fishery. PLoS ONE 2009, 4, e5529. [Google Scholar] [CrossRef] [Green Version]
- Schultz, S.T.; Kruschel, C.; Bakran-Petricioli, T. Influence of seagrass meadows on predator-prey habitat segregation in an Adriatic lagoon. Mar. Ecol. Prog. Ser. 2009, 374, 85–99. [Google Scholar] [CrossRef]
- Ritchie, E.G.; Johnson, C.N. Predator interactions, mesopredator release and biodiversity conservation. Ecol. Lett. 2009, 12, 982–998. [Google Scholar] [CrossRef]
- Macreadie, P.I.; Geraldi, N.R.; Peterson, C.H. Preference for feeding at habitat edges declines among juvenile blue crabs as oyster reef patchiness increases and predation risk grows. Mar. Ecol. Prog. Ser. 2012, 466, 145–153. [Google Scholar] [CrossRef] [Green Version]
- Nunes, J.A.C.C.; Leduc, A.; Miranda, R.J.; Cipresso, P.H.; Alves, J.P.; Mariano-Neto, E.; Sampaio, C.L.S.; Barros, F. Refuge choice specificity increases with predation risk in a rocky reef fish. J. Exp. Mar. Biol. Ecol. 2019, 520, UNSP151207. [Google Scholar] [CrossRef]
- Gilliam, J.F.; Fraser, D.F. Habitat Selection under Predation Hazard - Test of a Model with Foraging Minnows. Ecology 1987, 68, 1856–1862. [Google Scholar] [CrossRef]
- Bostrom, C.; Pittman, S.J.; Simenstad, C.; Kneib, R.T. Seascape ecology of coastal biogenic habitats: Advances, gaps, and challenges. Mar. Ecol. Prog. Ser. 2011, 427, 191–217. [Google Scholar] [CrossRef] [Green Version]
- Whitfield, A.K. The role of seagrass meadows, mangrove forests, salt marshes and reed beds as nursery areas and food sources for fishes in estuaries. Rev. Fish Biol. Fish. 2017, 27, 75–110. [Google Scholar] [CrossRef]
- Kruschel, C.; Schultz, S. Lure-assisted visual census: A new method for quantifying fish abundance, behaviour, and predation risk in shallow coastal habitats. Mar. Freshw. Res. 2010, 61, 1349–1359. [Google Scholar] [CrossRef]
- Heck, K.; Crowder, L. Habitat structure and predator—Prey interactions in vegetated aquatic systems. In Habitat Structure; Springer: Berlin/Heidelberg, Germany, 1991; pp. 281–299. [Google Scholar]
- Kovalenko, K.E.; Thomaz, S.M.; Warfe, D.M. Habitat complexity: Approaches and future directions. Hydrobiologia 2012, 685, 1–17. [Google Scholar] [CrossRef]
- Bartholomew, A.; Diaz, R.J.; Cicchetti, G. New dimensionless indices of structural habitat complexity: Predicted and actual effects on a predator’s foraging success. Mar. Ecol. Prog. Ser. 2000, 206, 45–58. [Google Scholar] [CrossRef] [Green Version]
- Hovel, K.A.; Warneke, A.M.; Virtue-Hilborn, S.P.; Sanchez, A.E. Mesopredator foraging success in eelgrass (Zostera marina L.): Relative effects of epiphytes, shoot density, and prey abundance. J. Exp. Mar. Biol. Ecol. 2016, 474, 142–147. [Google Scholar] [CrossRef]
- Horinouchi, M. Review of the effects of within-patch scale structural complexity on seagrass fishes. J. Exp. Mar. Biol. Ecol. 2007, 350, 111–129. [Google Scholar] [CrossRef]
- Schultz, S.T.; Kruschel, C. Frequency and success of ambush and chase predation in fish assemblages associated with seagrass and bare sediment in an Adriatic lagoon. Hydrobiologia 2010, 649, 25–37. [Google Scholar] [CrossRef]
- Fouzai, N.; Opdal, A.F.; Jorgensen, C.; Fiksen, O. Dying from the lesser of three evils: Facilitation and non-consumptive effects emerge in a model with multiple predators. Oikos 2019, 128, 1307–1317. [Google Scholar] [CrossRef] [Green Version]
- Miller, J.R.B.; Ament, J.M.; Schmitz, O.J. Fear on the move: Predator hunting mode predicts variation in prey mortality and plasticity in prey spatial response. J. Anim. Ecol. 2014, 83, 214–222. [Google Scholar] [CrossRef]
- Peckarsky, B.L. Alternative predator avoidance syndromes of stream-dwelling mayfly larvae. Ecology 1996, 77, 1888–1905. [Google Scholar] [CrossRef]
- Sih, A. Prey Uncertainty and the Balancing of Antipredator and Feeding Needs. Am. Nat. 1992, 139, 1052–1069. [Google Scholar] [CrossRef]
- Stoks, R.; McPeek, M.A.; Mitchell, J.L. Evolution of prey behavior in response to changes in predation regime: Damselflies in fish and dragonfly lakes. Evolution 2003, 57, 574–585. [Google Scholar] [CrossRef] [PubMed]
- Hesse, J.; Stanley, J.A.; Jeffs, A.G. Relative predation risk in two types of habitat for juvenile Australasian spiny lobsters, Jasus edwardsii. Mar. Biol. Res. 2016, 12, 895–906. [Google Scholar] [CrossRef]
- Zubak, I.; Kruschel, C.; Schultz, S.T. Predators structure fish communities in Posidonia oceanica meadows: Meta-analysis of available data across the Mediterranean basin. Mar. Ecol. Prog. Ser. 2017, 566, 145–157. [Google Scholar] [CrossRef]
- Coll, M.; Piroddi, C.; Steenbeek, J.; Kaschner, K.; Lasram, F.B.; Aguzzi, J.; Ballesteros, E.; Bianchi, C.N.; Corbera, J.; Dailianis, T.; et al. The Biodiversity of the Mediterranean Sea: Estimates, Patterns, and Threats. PLoS ONE 2010, 5, e11842. [Google Scholar] [CrossRef] [Green Version]
- Coll, M.; Santojanni, A.; Palomera, I.; Arneri, E. Food-web changes in the Adriatic Sea over the last three decades. Mar. Ecol. Prog. Ser. 2009, 381, 17–37. [Google Scholar] [CrossRef]
- Boaden, A.E.; Kingsford, M.J. Predators drive community structure in coral reef fish assemblages. Ecosphere 2015, 6, 46. [Google Scholar] [CrossRef]
- Marba, N.; Diaz-Almela, E.; Duarte, C.M. Mediterranean seagrass (Posidonia oceanica) loss between 1842 and 2009. Biol. Conserv. 2014, 176, 183–190. [Google Scholar] [CrossRef]
- Airoldi, L.; Beck, M.W. Loss, status and trends for coastal marine habitats of Europe. Oceanogr. Mar. Biol. 2007, 45, 345–405. [Google Scholar]
- Giakoumi, S.; Cebrian, E.; Kokkoris, G.D.; Ballesteros, E.; Sala, E. Relationships between fish, sea urchins and macroalgae: The structure of shallow rocky sublittoral communities in the Cyclades, Eastern Mediterranean. Estuar. Coast. Shelf Sci. 2012, 109, 1–10. [Google Scholar] [CrossRef]
- Bonaviri, C.; Gianguzza, P.; Pipitone, C.; Hereu, B. Micropredation on sea urchins as a potential stabilizing process for rocky reefs. J. Sea Res. 2012, 73, 18–23. [Google Scholar] [CrossRef]
- VegaFernandez, T.; Milazzo, M.; Badalamenti, F.; D’Anna, G. Comparison of the fish assemblages associated with Posidonia oceanica after the partial loss and consequent fragmentation of the meadow. Estuar. Coast. Shelf Sci. 2005, 65, 645–653. [Google Scholar] [CrossRef]
- Kruschel, C.; Schultz, S.T. Use of a lure in visual census significantly improves probability of detecting wait-ambushing and fast cruising predatory fish. Fish. Res. 2012, 123, 70–77. [Google Scholar] [CrossRef]
- Loya, Y. Monographs on Oceanic Methodology.Coral Reefs: Research Methods; UNESCO: Paris, France, 1978; Chapter Plotless and Transect Methods; pp. 197–218. [Google Scholar]
- Murphy, H.M.; Jenkins, G.P.; Hindell, J.S.; Connolly, R.M. Response of fauna in seagrass to habitat edges, patch attributes and hydrodynamics. Austral Ecol. 2010, 35, 535–543. [Google Scholar] [CrossRef] [Green Version]
- Katsanevakis, S.; Weber, A.; Pipitone, C.; Leopold, M.; Cronin, M.; Scheidat, M.; Doyle, T.K.; Buhl-Mortensen, L.; Buhl-Mortensen, P.; D’Anna, G.; et al. Monitoring marine populations and communities: Methods dealing with imperfect detectability. Aquat. Biol. 2012, 16, 31–52. [Google Scholar] [CrossRef] [Green Version]
- Watson, D.L.; Harvey, E.S. Behaviour of temperate and sub-tropical reef fishes towards a stationary SCUBA diver. Mar. Freshw. Behav. Physiol. 2007, 40, 85–103. [Google Scholar] [CrossRef]
- Watson, J.J.; Kerley, G.I.H. Survey of the dune-breeding birds in the Eastern Cape, South Africa. Ostrich 1995, 66, 15–20. [Google Scholar] [CrossRef]
- Bussotti, S.; Guidetti, P. Timing and habitat preferences for settlement of juvenile fishes in the Marine Protected Area of Torre Guaceto (south-eastern Italy, Adriatic Sea). Ital. J. Zool. 2011, 78, 243–254. [Google Scholar] [CrossRef]
- García-Rubies, A.; Macpherson, E. Substrate use and temporal pattern of recruitment in juvenile fishes of the Mediterranean littoral. Mar. Biol. 1995, 124, 35–42. [Google Scholar] [CrossRef]
- Raventos, N.; Macpherson, E. Planktonic larval duration and settlement marks on the otoliths of Mediterranean littoral fishes. Mar. Biol. 2001, 138, 1115–1120. [Google Scholar]
- Harmelin-Vivien, M.; Harmelin, J.; Chauvet, C.; Duval, C.; Galzin, R.; Lejeune, P.; Barnabe, G.; Blanc, F.; Chevalier, R.; Duclerc, J.; et al. The underwater observation of fish communities and fish populations. Methods and problems. Revue d’Ecologie (France) 1985, 40, 467–539. [Google Scholar]
- Nagelkerken, I.; van der Velde, G.; Gorissen, M.W.; Meijer, G.J.; van’t Hof, T.; den Hartog, C. Importance of mangroves, seagrass beds and the shallow coral reef as a nursery for important coral reef fishes, using a visual census technique. Estuar. Coast. Shelf Sci. 2000, 51, 31–44. [Google Scholar] [CrossRef]
- Schmidt, T.W.; Thompson, M.J. Validation of the species/time random count technique sampling fish assemblages. In Proceedings of the Third International Symposium of Coral Reefs, Miami, FL, USA, May 1977; Volume 1, pp. 283–288. [Google Scholar]
- Gerking, S. Feeding Ecology of Fishes; Academic Press: San Diego, CA, USA, 1994. [Google Scholar]
- Team, R.C. R: A Language and Environment for Statistical Computing; R Foundation for Statistical Computing: Vienna, Austria, 2019. [Google Scholar]
- LIMA, S.L.; DILL, L.M. Behavioral Decisions Made under the Risk of Predation—A Review and Prospectus. Can. J. Zool. -Rev. Can. De Zool. 1990, 68, 619–640. [Google Scholar] [CrossRef]
- Gaynor, K.M.; Brown, J.S.; Middleton, A.D.; Power, M.E.; Brashares, J.S. Landscapes of Fear: Spatial Patterns of Risk Perception and Response. Trends Ecol. Evol. 2019, 34, 355–368. [Google Scholar] [CrossRef] [PubMed] [Green Version]
- Ferrari, M.C.O.; Wisenden, B.D.; Chivers, D.P. Chemical ecology of predator-prey interactions in aquatic ecosystems: A review and prospectus. Can. J. Zool. 2010, 88, 698–724. [Google Scholar] [CrossRef]
- Broom, M.; Higginson, A.D.; Ruxton, G.D. Optimal investment across different aspects of anti-predator defences. J. Theor. Biol. 2010, 263, 579–586. [Google Scholar] [CrossRef] [Green Version]
- Kruschel, C.; Schultz, S.T. Juvenile Gobius niger avoids seagrass in the presence and uncertain absence of seagrass-inhabiting predators. J. Exp. Mar. Biol. Ecol. 2011, 409, 240–246. [Google Scholar] [CrossRef]
- Kruschel, C.; Harras, J.; Blindow, I.; Schultz, S.T. Do fish assemblages at sites featuring man-made concrete walls differ from those at natural rocky-reef sites? Ann. Ser. Hist. Nat. 2017, 27, 167–180. [Google Scholar]
- Stergiou, K.I.; Karpouzi, V.S. Feeding habits and trophic levels of Mediterranean fish. Rev. Fish Biol. Fish. 2001, 11, 217–254. [Google Scholar] [CrossRef]
- Como, S.; Magni, P.; Baroli, M.; Casu, D.; De Falco, G.; Floris, A. Comparative analysis of macrofaunal species richness and composition in Posidonia oceanica, Cymodocea nodosa and leaf litter beds. Mar. Biol. 2008, 153, 1087–1101. [Google Scholar] [CrossRef]
- Mabrouk, L.; Ben Brahim, M.; Hamza, A.; Bradai, M.N. Diversity and temporal fluctuations of epiphytes and sessile invertebrates on the rhizomes Posidonia oceanica in a seagrass meadow off Tunisia. Mar. Ecol. - Evol. Perspect. 2014, 35, 212–220. [Google Scholar] [CrossRef]
- Sanchez-Jerez, P.; Cebrian, C.B.; Espla, A.A.R. Comparison of the epifauna spatial distribution in Posidonia oceanica, Cymodocea nodosa and unvegetated bottoms: Importance of meadow edges. Acta Oecologica-Int. J. Ecol. 1999, 20, 391–405. [Google Scholar] [CrossRef]
- Scipione, M.B.; Zupo, V. Crustacean amphipods from the seagrasses Zostera marina, Cymodocea nodosa and Posidonia oceanica in the Adriatic Sea (Italy): A first comparison. Zool. Baetica 2010, 21, 15–32. [Google Scholar]
- Hussein, C.; Verdoit-Jarraya, M.; Pastor, J.; Ibrahim, A.; Saragoni, G.; Pelletier, D.; Mahevas, S.; Lenfant, P. Assessing the impact of artisanal and recreational fishing and protection on a white seabream (Diplodus sargus sargus) population in the north-western Mediterranean Sea using a simulation model. Part 1: Parameterization and simulations. Fish. Res. 2011, 108, 163–173. [Google Scholar] [CrossRef]
- Sala, E.; Ballesteros, E. Partitioning of space and food resources by three fish of the genus Diplodus (Sparidae) in a Mediterranean rocky infralittoral ecosystem. Mar. Ecol. Prog. Ser. 1997, 152, 273–283. [Google Scholar] [CrossRef] [Green Version]
- Macpherson, E.; Biagi, F.; Francour, P.; Garcia-Rubies, A.; Harmelin, J.; Harmelin-Vivien, M.; Jouvenel, J.Y.; Planes, S.; Vigliola, L.; Tunesi, L. Mortality of juvenile fishes of the genus Diplodus in protected and unprotected areas in the western Mediterranean Sea. Mar. Ecol. Prog. Ser. 1997, 160, 135–147. [Google Scholar] [CrossRef] [Green Version]
- Cuadros, A.; Basterretxea, G.; Cardona, L.; Cheminee, A.; Hidalgo, M.; Moranta, J. Settlement and post-settlement survival rates of the white seabream (Diplodus sargus) in the western Mediterranean Sea. PLoS ONE 2018, 13, e0190278. [Google Scholar] [CrossRef]
- Bouchoucha, M.; Darnaude, A.M.; Gudefin, A.; Neveu, R.; Verdoit-Jarraya, M.; Boissery, P.; Lenfant, P. Potential use of marinas as nursery grounds by rocky fishes: Insights from four Diplodus species in the Mediterranean. Mar. Ecol. Prog. Ser. 2016, 547, 193–209. [Google Scholar] [CrossRef] [Green Version]
- Northfield, T.D.; Barton, B.T.; Schmitz, O.J. A spatial theory for emergent multiple predator-prey interactions in food webs. Ecol. Evol. 2017, 7, 6935–6948. [Google Scholar] [CrossRef]
- Schmitz, O.J. Predator diversity and trophic interactions. Ecology 2007, 88, 2415–2426. [Google Scholar] [CrossRef]
- Teckentrup, L.; Kramer-Schadt, S.; Jeltsch, F. The risk of ignoring fear: Underestimating the effects of habitat loss and fragmentation on biodiversity. Landsc. Ecol. 2019, 34, 2851–2868. [Google Scholar] [CrossRef]
- McGhee, K.E.; Pintor, L.M.; Bell, A.M. Reciprocal Behavioral Plasticity and Behavioral Types during Predator-Prey Interactions. Am. Nat. 2013, 182, 704–717. [Google Scholar] [CrossRef] [PubMed] [Green Version]
Figure 1.
Sampling locations.

Figure 2.
The total number of transects with the indicated benthic habitats present. U: unconsolidated sediment. R: rock. A: macroalgae (usually Cystoseira spp.). P: seagrass Posidonia oceanica. C: seagrass Cymodocea nodosa. Shown are the 30 most common habitat combinations out of a total of 50. Horizontal axis uses a log scale to show relative sizes of the bars more clearly.

Figure 3.
The total number of individuals recorded for each of the 20 most abundant taxa. See Table names for Latin binomials.
Figure 3.
The total number of individuals recorded for each of the 20 most abundant taxa. See Table names for Latin binomials.

Figure 4.
NMDS ordination of taxon relative habitat abundance. Red: piscivorous predators greater than 5 cm in length. Blue: prey taxa, all individuals under 5 cm in length. Orange: aggressive predators, wait-chasers. Green: aggressive predators, cruise-chasers. See Table 2 for Latin binomials. Rb, Rt, Rv: bare rock, rock covered with algal turf, and rock covered with macroalgae respectively. U: unconsolidated sediment. A: macroalgae (usually Cystoseira spp.). P: seagrass Posidonia oceanica. C: seagrass Cymodocea nodosa.


Table 1.
Observed predatory fish taxa categorized by predatory behavioral mode. Sources and detailed descriptions: [12,46] and personal observations. Category names in parentheses from [12].
| Prey Search Mode | Search Activity | Interactions with Substrate | Predator Size | Interactions with Prey | Pursuit Mode | Pursuit Activity | Category Names | Taxa |
|---|---|---|---|---|---|---|---|---|
| Lie-in-wait or sit-and wait, no lure | P | Motionless, aggressive and/or protective resemblance | Small to medium | Suction and Strike | No chase | P | A (A) ambush | Bopo, Goco, Gopa, Solea, Zoop Sysa, Trla, Trdr, Trra, Scorpaena, Scno, Scpo, Scsc |
| Lie-in-wait or sit-and wait, no lure | P | Hovering inside caves | Medium to large | Suction and strike | No chase | P | A (A) | Apim, Epma, Scorpaena, Scno, Scpo, Scsc |
| Lie-in-wait or sit-and wait, no lure | P | Hovering above substrate aggressive and/or protective resemblance | Medium | Rushing forward, C-start or S-start | Burst chase | A | WCH | Coju, Epma, Spsph, Seca, Sesc, Sehe, Spsph |
| Lie-in-wait or sit-and wait no lure | P | On or inside substrate, motionless, aggressive and/or protective resemblance | Medium | Burst chase | A | WCH Wait-chase | Coju, Gocr, Gobidae, Gobius, Goge, Goni, Lame, Epma, Spsph, Lavi, Seca, Sesc, Sehe | |
| Stalking and sneaking | A | Slow motion in contact with substrate | Small to medium | Hopping forward use suction | No chase | P | SNA (A) Sneak attack | Scorpaena, Scno, Scpo. Scsc, |
| Stalking and sneaking | A | Slow motion in contact with substrate | Medium to large | chase and strike | Burst chase | A | SNCH (A) | Coco, Muhe, Spsph, Scpo Scorpaena, Scno, |
| Cruising | A | Constant swimming | Medium to large | Sustained fast cruise swimming | Sustained chase | A | CRCH (CH) Cruise-chase | Epal, Bebe, Dila, Racl, Sedu, |
| Cruising | A | Constant swimming | Medium | Sustained patrol swimming | Burst chases | A | CRCH | Dede, Dian, Diplodus, Dipu, Disa, Divu, Papa, Spau, Spca, Limo, Coco, Epal, Bebe, Dila, Sedu |
| Substrate dwelling: | A | Constant swimming | Small to medium | Slow swimming, picking off surface | No chase | A | CRDW (DW) Cruise-dwelling | Syti |
| Sand probers rock, algae, seagrass | A | Constant swimming | Small to medium | probing habitat, suction, biting | No chase | P | CRDW | Limo, Muba, Mullus, Musu, |
| Scrapers | A | Constant swimming | Small to medium | probing habitat suction, biting | No chase | P | CRDW | Spcr |
| Sand scoopers | A | Constant swimming | Small to medium | probing habitat, suction, filtering | No chase | P | CRDW | Limo, Mugilidae, Muba, Mullus, Musu, |
| Detritivores and herbivores | A | Constant swimming | Small to medium | probing, suction, filtering, biting | No chase | P | CRDW | Musu, Sasal, Pasa, Mugilidae |
| Family | Binomial | Abbrev | Family | Binomial | Abbrev |
|---|---|---|---|---|---|
| Apogonidae | Apogon imberbis | Apim | Moronidae | Dicentrarchus labrax | Dila |
| Atherinidae | Atherina boyeri/hepsetus | Ath | Mullidae | Mullus barbatus | Muba |
| Belonidae | Belone belone | Bebe | Mullidae | Mullus surmuletus | Musu |
| Blennidae | Aidablenius sphynx | Aisp | Muraenidae | Muraena helena | Muhe |
| Blennidae | Microlipophrys canevae | Mica | Pomacentridae | Chromis chromis | Chch |
| Blennidae | Microlipophrys nigroceps | Mini | Rajidae | Raja clavata | Racl |
| Blennidae | Parablennius gattorugine | Paga | Sciaenidae | Sciaena umbra | Scum |
| Blennidae | Parablennius incognitus | Pain | Scorpaenidae | Scorpaena notata | Scno |
| Blennidae | Parablennius rouxi | Coco | Scorpaenidae | Scorpaena porcus | Scpo |
| Blennidae | Parablennius sanuinolentus | Pasa | Scorpaenidae | Scorpaena scrofa | Scsc |
| Blennidae | Parablennius tentacularis | Pate | Serranidae | Epinephelus marginatus | Epma |
| Blennidae | Parablennius zvonimiri | Pazv | Serranidae | Serranus cabrilla | Seca |
| Blennidae | Salaria pavo | Sapa | Serranidae | Serranus hepatus | Sehe |
| Bothidae | Bothus podas | Bopo | Serranidae | Serranus scriba | Sesc |
| Carangidae | Seriola dumerili | Sedu | Sparidae | Boops boops | Bobo |
| Congridae | Conger conger | Coco | Sparidae | Dentex dentex | Dede |
| Gobiesocidae | Lepadogaster lepadogaster | Lele | Sparidae | Diplodus annularis | Dian |
| Gobiidae | Gobius bucchichi | Gobu | Sparidae | Diplodus puntazzo | Dipu |
| Gobiidae | Gobius cobitis | Goco | Sparidae | Diplodus sargus | Disa |
| Gobiidae | Gobius cruentatus | Gocr | Sparidae | Diplodus vulgaris | Divu |
| Gobiidae | Gobius fallax | Gofa | Sparidae | Lithognathus mormyrus | Limo |
| Gobiidae | Gobius geniporus | Goge | Sparidae | Oblada melanura | Obme |
| Gobiidae | Gobius auratus | Goau | Sparidae | Pagellus acarne | Paar |
| Gobiidae | Gobius niger | Goni | Sparidae | Pagellus erythrinus | Paer |
| Gobiidae | Gobius paganellus | Gopa | Sparidae | Pagrus pagrus | Papa |
| Gobiidae | Gobius vitatus | Govi | Sparidae | Sarpa salpa | Sasal |
| Gobiidae | Zebrus zebrus | Zeze | |||
| Labridae | Coris julis | Coju | Sepidae | Sepia officinalis | Seof |
| Labridae | Labrus merula | Lame | Octopodidae | Octopus vulgaris | Ocvu |
| Labridae | Labrus viridis | Lavi |
Table 3.
Species exhibiting the most aggressive predatory behavior, as defined by observed proportion success in ingesting the lure. Mode: Predation mode (refer to Table 1). Abundance: total number of individuals recorded. Prey pursued/caught: total number of times the predatory species was observed pursuing/partially to wholly ingesting the lure.
| Species | Abbr. | Mode | Abundance | Prey Pursued | Prey Caught |
|---|---|---|---|---|---|
| Coris julis | Coju | WCH | 14,528 | 10,024 | 436 |
| Serranus scriba | Sesc | WCH | 3044 | 1826 | 396 |
| Diplodus annularis | Dian | CRCH | 6119 | 4406 | 245 |
| Serranus cabrilla | Seca | WCH | 515 | 458 | 160 |
| Diplodus vulgaris | Divu | CRCH | 6679 | 3072 | 67 |
| Gobius geniporus | Goge | WCH | 268 | 134 | 16 |
| Serranus hepatus | Sehe | WCH | 693 | 319 | 14 |
| Gobius spp. | Gobius | WCH | 458 | 156 | 9 |
| Gobius cruentatus | Gocr | WCH | 125 | 125 | 4 |
Table 4.
Analysis of deviance generalized linear (Poisson) model of aggressive predator (P), prey (V), and non-aggressive adult (N) abundance within visual transects. Model: V predicted by P, V predicted by N, and N predicted by P.
Table 4.
Analysis of deviance generalized linear (Poisson) model of aggressive predator (P), prey (V), and non-aggressive adult (N) abundance within visual transects. Model: V predicted by P, V predicted by N, and N predicted by P.
| Model | Df | Deviance | Resid. Df | Resid. Dev | Pr(>Chi) |
|---|---|---|---|---|---|
| V ∼ P | 1 | 2217 | 19676 | 343101 | <0.001 |
| V ∼ N | 1 | 253 | 19676 | 345066 | <0.001 |
| N ∼ P | 1 | 270 | 19676 | 711294 | <0.001 |
Table 5.
The top three preferred and avoided habitats for each aggressive predator species.
| Species | Most Preferred | Most Avoided | ||||
|---|---|---|---|---|---|---|
| 1 | 2 | 3 | 1 | 2 | 3 | |
| Coris julis | UA | RUA | RU | U | C | P |
| Serranus scriba | UA | RU | P | U | C | R |
| Diplodus annularis | P | PC | UA | R | U | RU |
| Serranus cabrilla | RD | UA | RUA | R | U | C |
| Diplodus vulgaris | UA | RU | RUA | P | U | C |
| Gobius geniporus | RU | UA | U | R | P | C |
| Serranus hepatus | UA | RUAD | C | R | P | RP |
| Gobius spp. | U | RU | UC | R | P | RP |
| Gobius cruentatus | RU | RUC | AC | P | U | C |
Table 6.
Habitat preference and avoidance by prey (V), non-aggressive adults (N), and aggressive predators (P). Occurrence: total number of individuals observed in each indicated habitat. Chi-square residuals: the Pearson residuals (observed minus expected)/sqrt(expected). All rows of this table are sorted by the chi-square residuals of the prey.
| Habitat | Occurrence | Chi-Square Residuals | ||||
|---|---|---|---|---|---|---|
| V | N | P | V | N | P | |
| UA | 213 | 1891 | 3021 | −9.03 | −12.12 | 16.58 |
| RUA | 36 | 485 | 718 | −6.03 | −4.83 | 7.62 |
| RUP | 16 | 219 | 399 | −4.66 | −5.11 | 7.35 |
| UP | 29 | 268 | 403 | −3.35 | −3.95 | 5.58 |
| A | 6 | 162 | 112 | −3.33 | 2.19 | −0.92 |
| RP | 96 | 661 | 965 | −3.11 | −6.14 | 7.79 |
| N | 0 | 51 | 25 | −2.41 | 2.3 | −1.42 |
| R | 1651 | 12695 | 8458 | −2.21 | 15.05 | −14.98 |
| D | 0 | 18 | 44 | −2.18 | −2.22 | 3.26 |
| RUD | 1 | 30 | 19 | −1.44 | 1.14 | −0.6 |
| RUAC | 0 | 7 | 13 | −1.24 | −0.88 | 1.45 |
| UPA | 0 | 7 | 13 | −1.24 | −0.88 | 1.45 |
| UD | 3 | 28 | 40 | −1.04 | −1.12 | 1.62 |
| RUAP | 0 | 7 | 6 | −1 | 0.27 | 0.14 |
| AP | 2 | 19 | 30 | −0.96 | −1.17 | 1.64 |
| PA | 0 | 1 | 6 | −0.73 | −1.31 | 1.68 |
| APC | 0 | 1 | 5 | −0.68 | −1.12 | 1.47 |
| CA | 8 | 95 | 30 | −0.68 | 3.75 | −3.68 |
| RAP | 0 | 2 | 3 | −0.62 | −0.28 | 0.55 |
| PC | 5 | 27 | 53 | −0.59 | −2.24 | 2.61 |
| PCD | 0 | 0 | 4 | −0.55 | −1.4 | 1.71 |
| RPC | 0 | 0 | 4 | −0.55 | −1.4 | 1.71 |
| RUAD | 0 | 0 | 3 | −0.48 | −1.21 | 1.48 |
| UCA | 0 | 2 | 1 | −0.48 | 0.45 | −0.27 |
| CD | 0 | 1 | 1 | −0.39 | 0.03 | 0.14 |
| AU | 0 | 2 | 0 | −0.39 | 1.04 | −0.93 |
| UCD | 0 | 2 | 0 | −0.39 | 1.04 | −0.93 |
| UPC | 0 | 2 | 0 | −0.39 | 1.04 | −0.93 |
| AN | 0 | 1 | 0 | −0.28 | 0.73 | −0.66 |
| UAD | 0 | 1 | 0 | −0.28 | 0.73 | −0.66 |
| UN | 5 | 38 | 30 | −0.25 | 0.41 | −0.33 |
| RD | 4 | 15 | 40 | −0.24 | −2.56 | 2.81 |
| RPU | 1 | 5 | 9 | −0.14 | −0.85 | 0.96 |
| PD | 5 | 21 | 38 | 0.05 | −1.82 | 1.91 |
| RAC | 1 | 6 | 3 | 0.27 | 0.51 | −0.65 |
| UAP | 10 | 38 | 66 | 0.44 | −2.35 | 2.3 |
| RU | 907 | 4909 | 5802 | 0.63 | −9.97 | 10.27 |
| CN | 1 | 0 | 1 | 2.17 | −0.99 | 0.14 |
| RC | 24 | 113 | 60 | 2.3 | 1.74 | −2.8 |
| U | 332 | 2359 | 1125 | 2.36 | 11.6 | −13.24 |
| RPD | 5 | 6 | 11 | 2.56 | −1.44 | 0.45 |
| UC | 44 | 192 | 151 | 2.65 | 0.25 | −1.38 |
| UCN | 1 | 0 | 0 | 3.34 | −0.7 | −0.66 |
| RA | 34 | 85 | 122 | 3.63 | −2.99 | 1.64 |
| UPD | 6 | 4 | 8 | 3.94 | −1.61 | 0.05 |
| P | 532 | 2460 | 2359 | 6.08 | −2.87 | 0.49 |
| UAC | 47 | 51 | 140 | 6.75 | −6.03 | 3.55 |
| AC | 36 | 64 | 57 | 6.93 | −1.43 | −1.39 |
| RUC | 55 | 114 | 110 | 7.29 | −1.88 | −1.07 |
| C | 304 | 999 | 725 | 11.96 | 0.35 | −5.38 |
© 2020 by the authors. Licensee MDPI, Basel, Switzerland. This article is an open access article distributed under the terms and conditions of the Creative Commons Attribution (CC BY) license (http://creativecommons.org/licenses/by/4.0/).
Share and Cite
MDPI and ACS Style
Kruschel, C.; Schultz, S.T. Aggressive Predation Drives Assembly of Adriatic Fish Communities. Diversity 2020, 12, 130. https://0-doi-org.brum.beds.ac.uk/10.3390/d12040130
AMA Style
Kruschel C, Schultz ST. Aggressive Predation Drives Assembly of Adriatic Fish Communities. Diversity. 2020; 12(4):130. https://0-doi-org.brum.beds.ac.uk/10.3390/d12040130
Chicago/Turabian StyleKruschel, Claudia, and Stewart T. Schultz. 2020. "Aggressive Predation Drives Assembly of Adriatic Fish Communities" Diversity 12, no. 4: 130. https://0-doi-org.brum.beds.ac.uk/10.3390/d12040130
Note that from the first issue of 2016, this journal uses article numbers instead of page numbers. See further details here.