Functional Diversity Effects of Vegetation on Runoff to Design Herbaceous Hedges for Sediment Retention


1
AGHYLE, UP 2018.C101, SFR Condorcet FR CNRS 3417, UniLaSalle, 60026 Beauvais, France
2
AREAS, 76460 St Valéry en Caux, France
*
Author to whom correspondence should be addressed.
Diversity 2020, 12(4), 131; https://0-doi-org.brum.beds.ac.uk/10.3390/d12040131
Submission received: 12 February 2020
/
Revised: 10 March 2020
/
Accepted: 27 March 2020
/
Published: 31 March 2020
(This article belongs to the Special Issue Plant-Soil Interactions)
Abstract
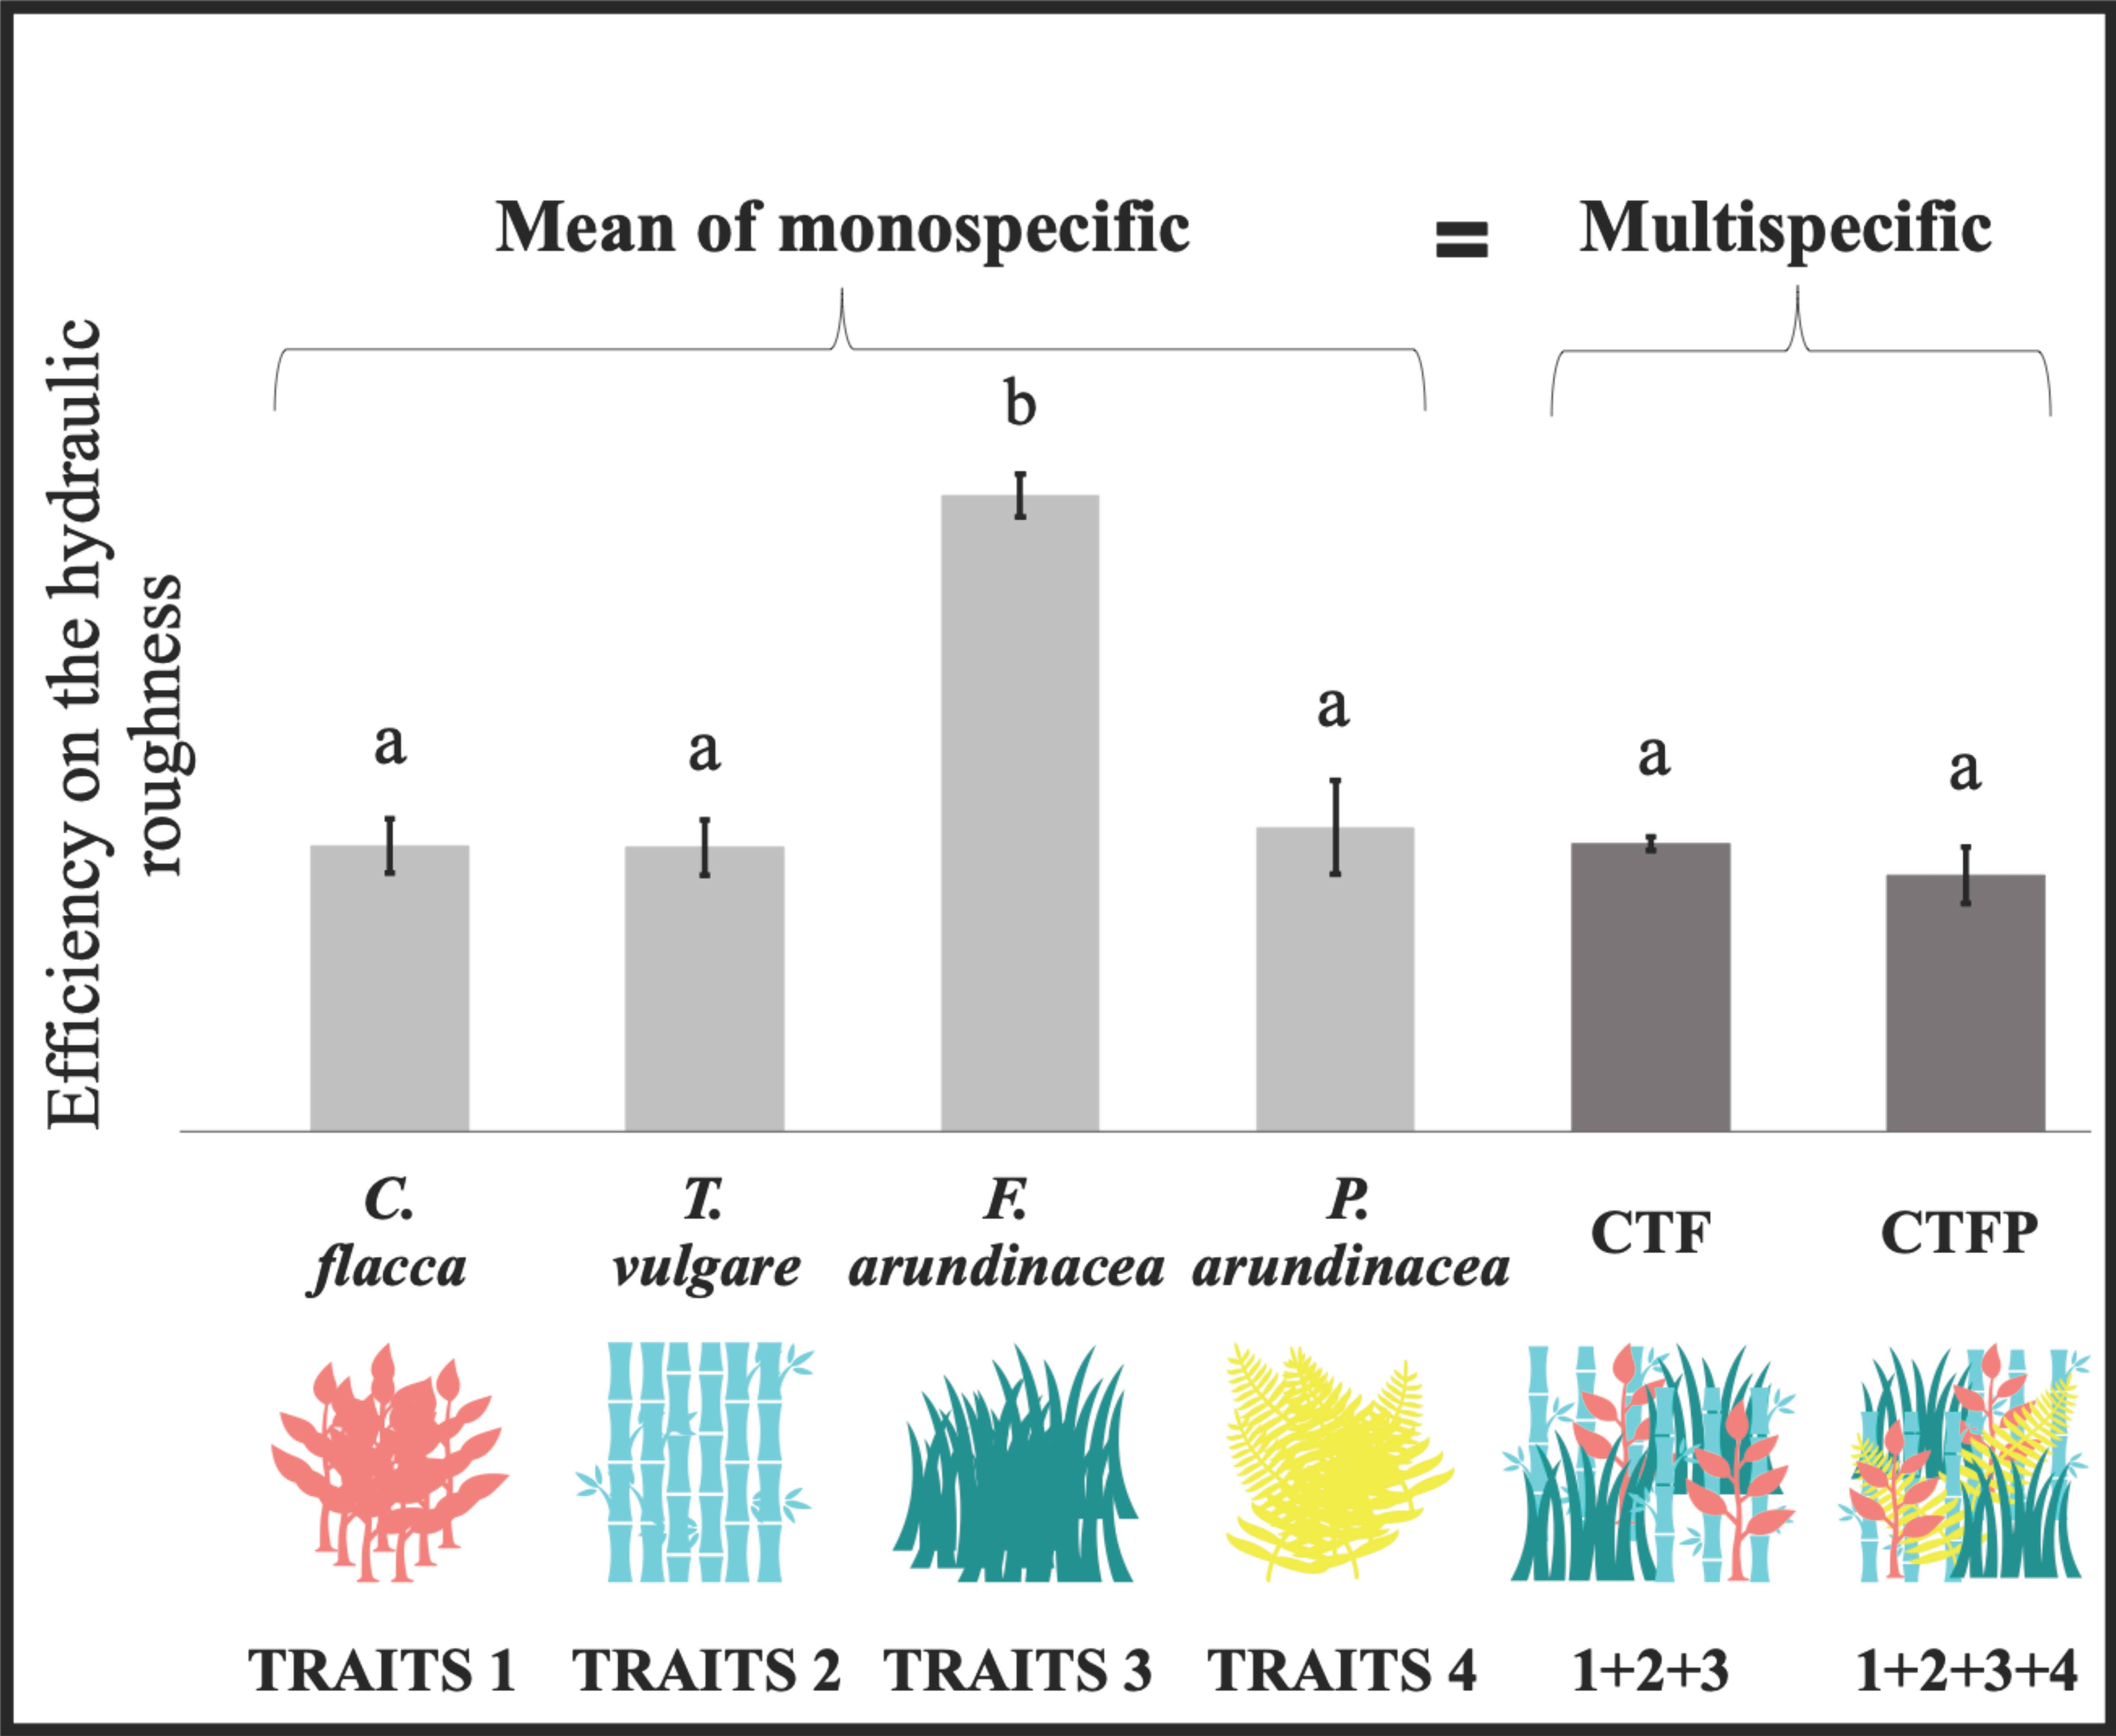
:Background: Functional diversity effects on ecosystem processes, like on soil erosion, are not fully understood. Runoff and soil erosion in agricultural landscapes are reduced by the hydraulic roughness (HR) of vegetation patches, which furthers sediment retention. Vegetation with important stem density, diameters, leaf areas, and density impact the HR. A functional structure composed of these negatively correlated traits involved in the increase of the HR would constitute a positive effect of the functional diversity. Methods: Runoff simulations were undertaken on four mono-specific and two multi-specific communities, using herbaceous plant species from North-West Europe, presenting six contrasting aboveground functional traits involved in the HR increase. Results: An effect of dominant traits in the community was found on the HR, identified as the community-weighted leaf density. The non-additive effect of functional diversity on the HR could be explained by the presence of species presenting large stems in the communities with high functional diversity. Conclusion: We argued that functional diversity effect on the HR could change due to idiosyncratic effects of the plant traits, which would be influenced by soil properties, phylogeny diversity, and plant species interactions. These findings constitute an advancement in the understanding of plant trait assemblage on runoff and soil erosion processes.

1. Introduction
Natural ecosystem processes are driven by the plant functional traits in vegetation communities [1,2]. Plant functional diversity, defined as “the value, range and relative abundance of plant functional traits in a given ecosystem” [3,4], can play a major role in ecosystem functioning and in supplying ecosystem services [2,5,6,7]. Studies have focused on the effects of functional diversity on ecosystem processes to understand if these effects were due to a dominant species composing the community or due to its functional diversity [3,6,8,9]. The mass ratio hypothesis stipulates that ecosystem processes would be driven by the traits of the most abundant species in the community, characterised as dominant species, and is represented by the community-weighted mean traits [10,11]. On the contrary, the diversity hypothesis specifies that ecosystem processes are driven by the trait diversity composing the plant community, inducing complementarity effects among species [7,12]. Higher dissimilarity of traits in a community would lead to a more complete use of resources and, thus, to a more important plant productivity [9,13], as well as a stronger impact on less studied plant–soil related processes like soil erosion, through an increase of hydraulic roughness and sediment retention [14].
The effect of plant functional diversity on soil erosion processes have recently appealed to the interest of the scientific community that studies plant–soil erosion processes, although the results of the functional diversity effects are contentious [14,15,16]. However, these studies focused on the effects of functional diversity of root traits of non-herbaceous communities, on soil stabilization and resistance in mountainous or semi-arid vegetation, which are community structures selected under the erosion processes, specific to these soil and climatic contexts [14,17,18]. In landscapes where annual crop fields on loamy soils represent an important area, runoff and linear soil erosion are mainly reduced by the hydraulic roughness in small vegetation patches [19]. Hydraulic roughness is defined as frictional resistance due to the contact of runoff with the vegetation [20,21,22,23,24]. Hydraulic roughness of herbaceous vegetation furthers sediment retention by reducing flow velocity; however, it is highly variable depending on the plant species and traits [21,24,25,26,27,28,29]. A positive relationship between the aboveground biomass and hydraulic roughness was highlighted, as an increase in the biomass productivity would further hydraulic roughness and sediment retention [25]. The aboveground functional traits that directly impact the hydraulic roughness for erosional events found under temperate climates were identified by Kervroëdan et al. [26]—herbaceous vegetation with important leaf density, leaf area, stem diameter, and stem projected area (stem area toward the flow direction) were found to be the most efficient in increasing hydraulic roughness. Nonetheless, these results emphasized the effects of negatively correlated trait combinations (i.e., leaf density and area) involved in hydraulic roughness increase, which suggested that communities with a high functional diversity would reach the best trade-off to maximize the vegetation effects on hydraulic roughness. A primary analysis was undertaken on the effects of aboveground functional trait divergence in herbaceous vegetation on the hydraulic roughness and sediment retention for processes occurring in loamy agricultural soils, emphasizing a dominant effect of the community-weighted traits in vegetation [16]. However, these results highlighted the need to deepen the understanding of the effects of functional diversity on runoff and linear soil erosion processes, by integrating a functional diversity gradient within the tested conditions.
In this study on trait-based plant ecohydrology, we aimed to examine the effects of functional diversity on hydraulic roughness, based on a functional diversity gradient, by using four monospecific and two multi-specific communities. We predicted that functional diversity increased the hydraulic roughness, by exerting a synergistic effect. The stem and leaf traits involved in the hydraulic roughness increase (stem diameter and projected area; leaf density, area, and specific area) would present a complementarity in the space-use, representing a competitive balance among the species in the community. The communities with a high differentiation degree among these traits will, thus, use the aboveground space more efficiently and lead to an increase in hydraulic roughness.
2. Materials and Methods
2.1. Plant Material
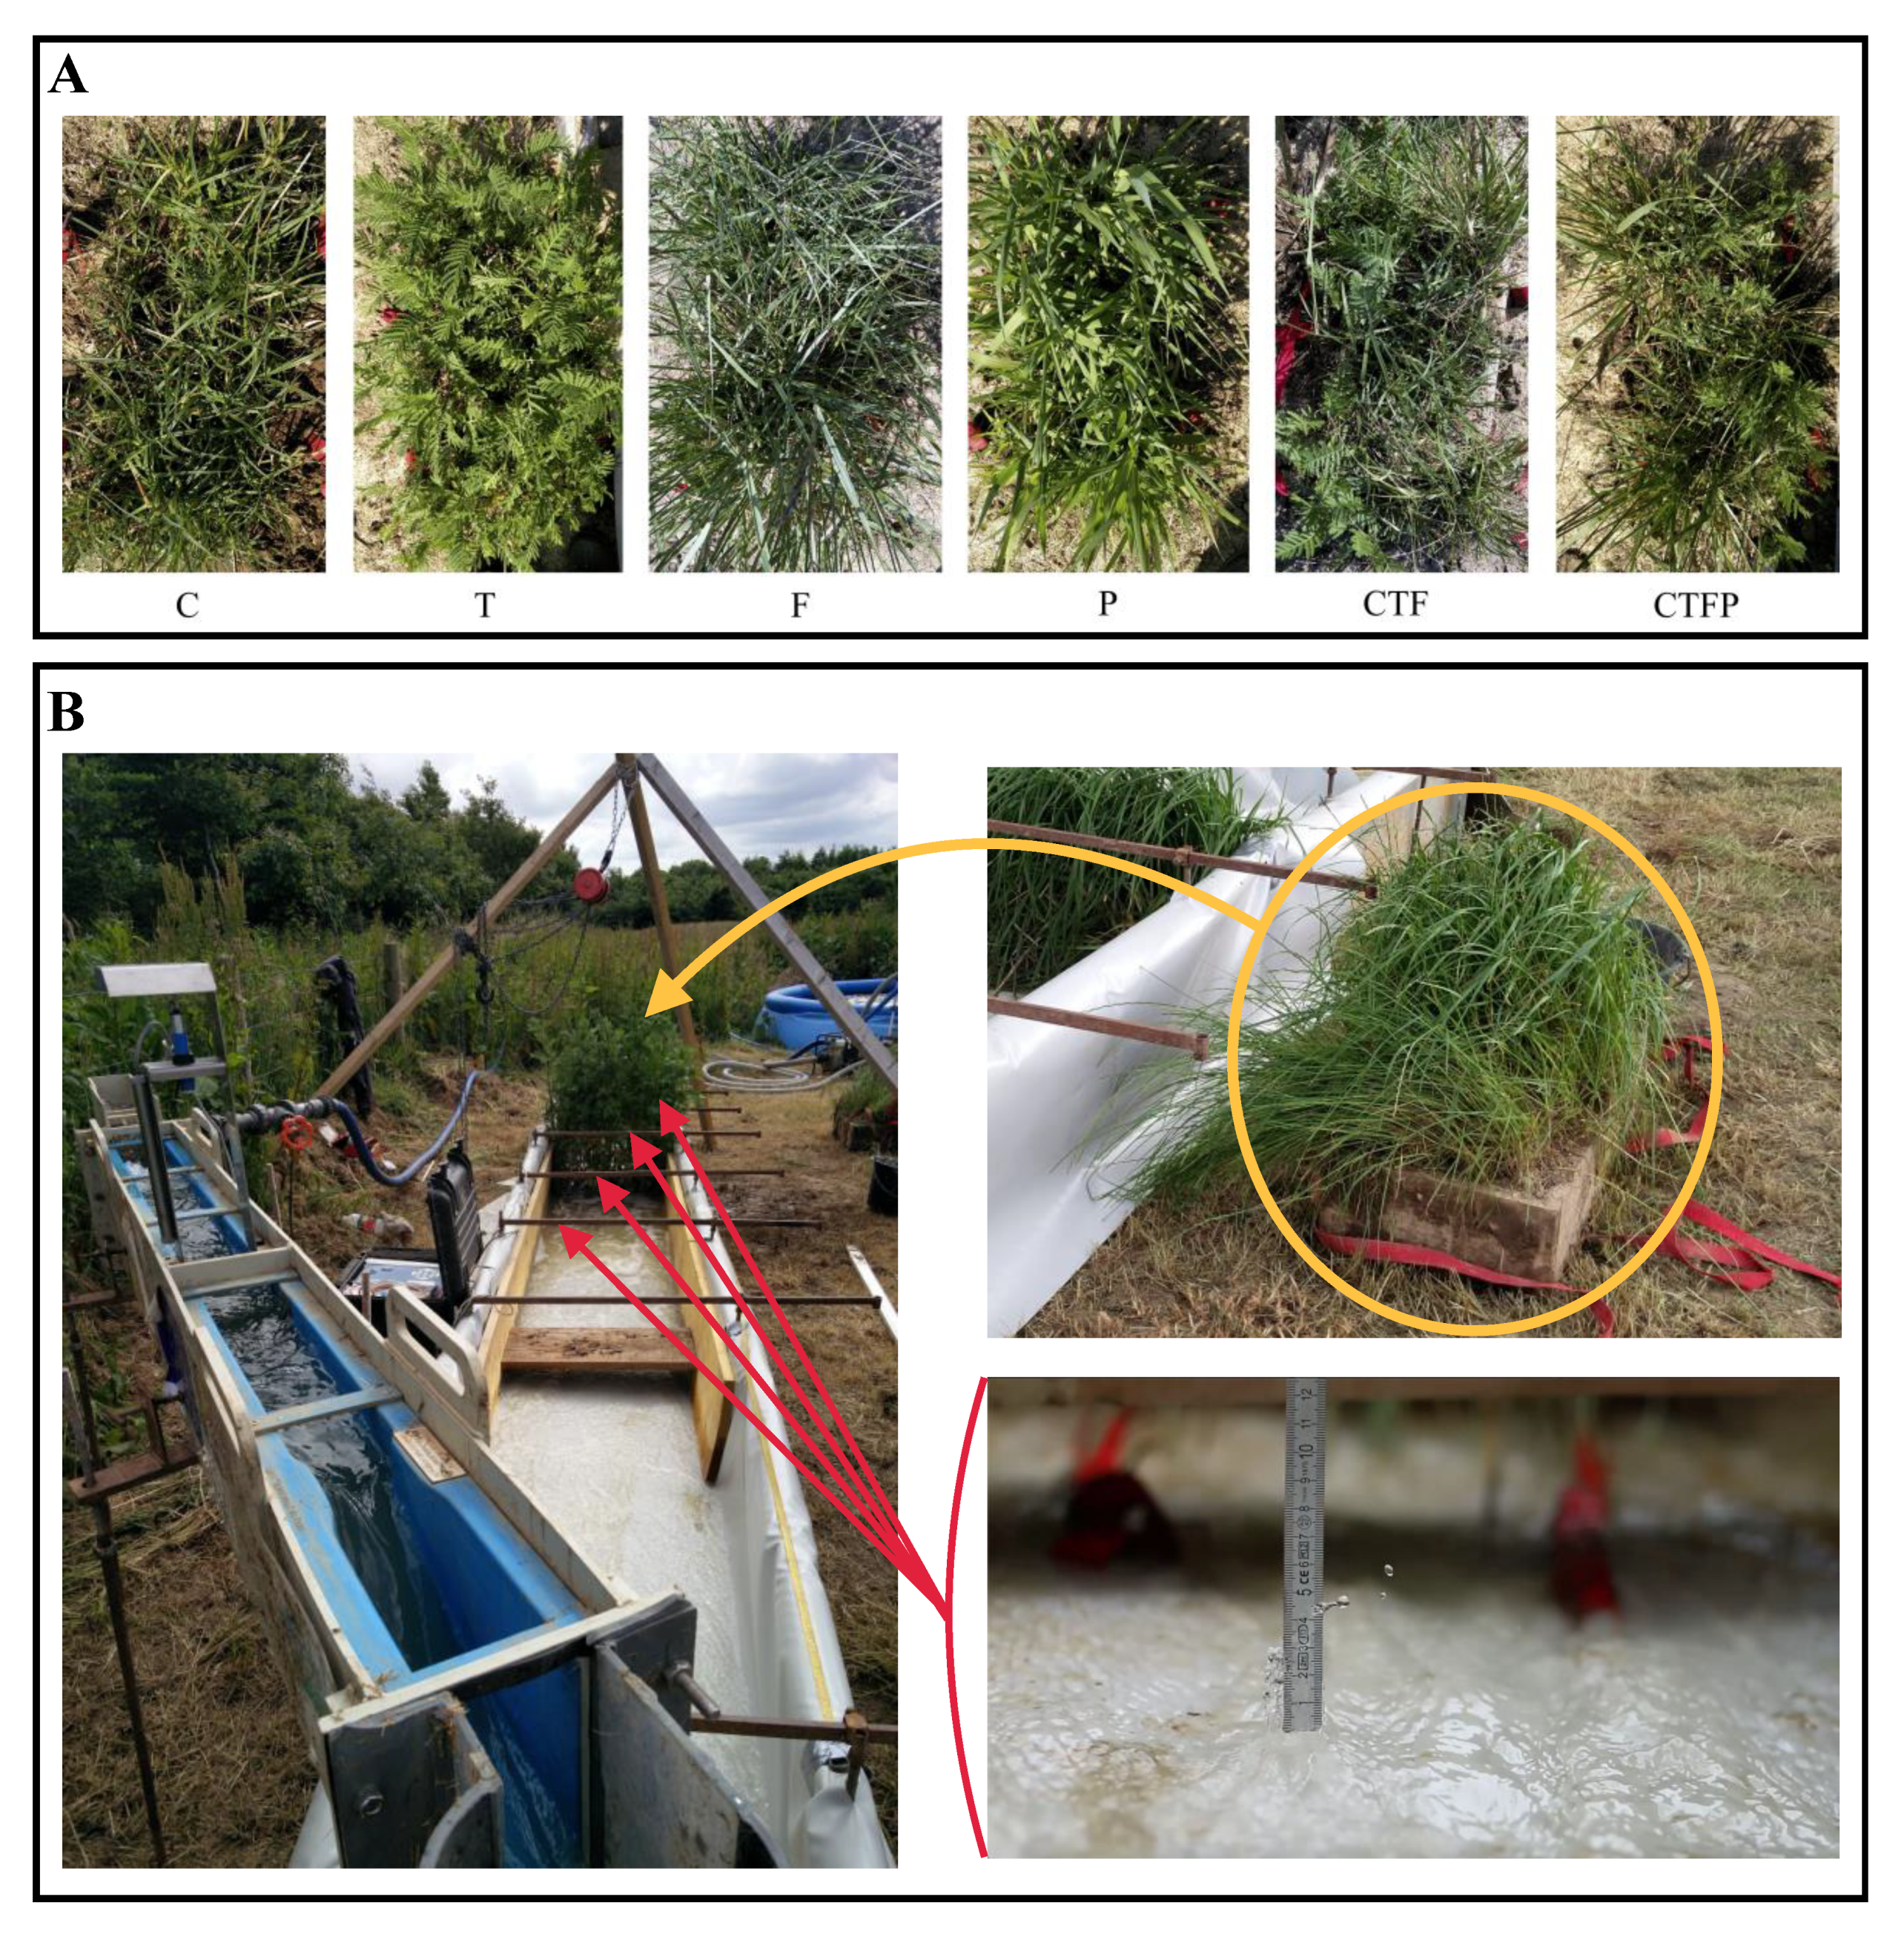
Four indigenous plant species from North-West Europe that presented selected functional types, contrasting aboveground functional traits, and that were involved in the increase of hydraulic roughness (leaf—area and density; stem—projected area, diameter, and density) [26], were used in the present study. The chosen plant species presented a minimal vegetative height within the range of 20 and 60 cm, in order to limit competition for light and ensure a uniform development of each species in the plots. Three replicates of monospecific and two multi-specific communities of Carex flacca Schreb. I, Tanacetum vulgare L. (T), Festuca arundinacea Schreb. (F), and Phalaris arundinacea L. (P), with contrasting traits were tested (Figure 1A). There were two types of multi-specific communities, one composed of C. flacca, T. vulgare, and F. arundinacea (CTF); and the other with C. flacca, T. vulgare, F. arundinacea, and P. arundinacea (CTFP). Each species was collected in their natural habitat in March 2016 (i.e., three months before the experiments), to ensure the creation of densely planted plots with grown individuals. The experiments were ex-situ and the plants were planted in a 60 × 30 × 15 cm wooden frame with a grid fence at the bottom to allow the roots’ development. The multi-specific plots were covered with the same proportion of each species, which were placed such that patches of the same species would not be in contact.
2.2. Plant Functional Traits Measurements
Six aboveground functional plant traits (stem—density, diameter, and projected area; leaf—density and area) that are known to increase the hydraulic roughness [29], were measured on three levels along the stem—between 0 and 5 cm, 0 and 10 cm, and 0 and 20 cm. Guidelines from Pérez-Harguindeguy et al. [30] were followed regarding the sampling collection, samples conservation, and analyses methods. As analyses could not be performed directly after sampling, the leaves were stored in sealed bags with moist tissue until measurements, and were then dried at 70 °C for 72 h.
As the plots presented a homogeneous plant cover, all traits measurements were carried out within one quadrat (10 by 10 cm) per monospecific community plot and one quadrat per species within the multi-specific community plots. The determination of stem density (stem dm−2) included plant stems, as well as pseudoculms for the sedges species (Cyperaceae) and tillers for the grass species, which here are considered to have the same functional effect on hydraulic roughness, as the stems. The stem diameter (mm) was measured on three representative stems and was used to determine the stem projected area (mm2) of each stem, using the rectangle area formula. The leaf area (mm2) and the specific leaf area (mm2 mg−1) were estimated from six representative leaves, which were scanned using a 600 dpi resolution and the images were processed using Gimp 2.8. The aboveground biomass (g) was entirely removed, dried at 70 °C for 72 h and weighted.
Furthermore, the density of traits within the quadrat was calculated through the product of (1) the leaf traits by the leaf density and (2) the stem traits by the stem density. These densities and the traits were dissociated with a “D” in front of the trait names.
2.3. Characterisation of the Community Functional Structure
Both multi-specific communities were created with an equal abundance of each species. The CTF communities accounted for 33% of each species (C. flacca, T. vulgare, and F. arundinacea) and the CTFP communities accounted for 25% of each species (C. flacca, T. vulgare, F. arundinacea, and P. arundinacea).
The community-weighted traits (CWT) were calculated, for each trait in both multi-specific communities, as the mean trait value after each trait was weighted by the abundance of each species composing the community [11,31]:
where CWTi is the community-weighted value of the trait in the community i, Ak,i, and Tk,i are, respectively, the relative abundance and the trait value of the species k in the community i and ni is the number of species in community i.
The functional variance (FDvar) was calculated for each trait in both multi-specific communities. FDvar represents the variance of the trait values of the species in the community [32]:
where Ci is the value of the trait i, is the weighted logarithmic mean of the trait and Ai is the abundance of the species with trait i [32,33].
The Rao’s quadratic entropy (FDQ) [34], a multidimensional index of the functional diversity to reflect the diversity hypothesis, was also used to characterize the functional divergence within the multi-specific conditions. It is a generalized form of the diversity Simpson index [35] and combines a measure of the pairwise functional differences between species and the relative abundance of the species [36]. The FDQ was determined using the package FD in R (version 3.3.2).
2.4. Hydraulic Measurements
The effect of the functional diversity on the hydraulic roughness was measured using a runoff simulator that recreated a flow at set discharges in controlled conditions [37]. The flow discharge was monitored through Venturi channels (flow range of 0.06–6 L s−1) and ultrasound probes measuring the water level in the channels (±1.26 mm), located in the upper and lower parts of the simulator. This system was manufactured by ISMA, France [37]. Measures of the hydrological processes were carried out in the central part of the simulator, a channel area which consisted of two 5.40 m galvanized iron sheets buried 60 cm away from each other on a 5% levelled slope. The entire channel area was waterproofed using a tarpaulin to avoid water losses during the experiment, such as leaks and infiltration in the ground. The plot was located 4 m away from the head of the channel in a 17 cm deep rectangular hole to level the plants with the channel (Figure 1B). To measure the channel topography and the backwater level in front of the plants, five spacers were placed upstream of the plot, from approximately 1.46 m from the channel head, every 0.75 m. Each spacer was levelled and its elevation was measured to use them as elevation-known baselines for the water level measurements.
In order to investigate the behaviour of the plant communities towards processes occurring more or less frequently, four discharges were used: 2, 4, 8, and 11 L s−1 m−1 at ±7% (observed approximately every 0.5, 1, 2, and 5 years, respectively, in 5 ha catchments with a 5 m-wide thalweg [37]). Discharges were continuously monitored through both upstream and downstream flowmeters. When the upstream and downstream discharges were equivalent, the water levels were measured as the perpendicular distance between the bottom of the spacer and the top of the water flow (Figure 1B), using the closest spacer upstream of the plot. Seven vertical water profiles were made per discharge per plot, one every 10 cm along the spacer from the edges of the channel.
The unit stream power (USP) was used here as a proxy to characterize the hydraulic roughness, being often used as a sediment transport capacity index [38,39], as it represents the “energy dissipation per unit of time and per unit of weight of the flow” [39]:
where USP (m s−1) depends on V, the mean velocity of the flow (m s−1), and S, the slope of the channel (m m−1). The USP is negatively related to the hydraulic roughness—the lower it is, the higher is the hydraulic roughness. The Manning n coefficients and the water levels data at each discharge for each condition are provided as supplementary data (Table S1).
USP = VS,
2.5. Data Analysis
Mann Whitney and T tests were conducted on the functional variance for each trait to analyze the variation of the functional structure between the two multi-specific communities. After regrouping the data under the categories “monospecific” and “multi-specific”, Mann Whitney analyses were performed on the USP data to compare (1) the mean value of monospecific communities with the multi-specific communities and (2) both multi-specific communities. The monospecific P community data were excluded from the analysis for the comparison with the three-species communities (CTF). ANOVA and Tukey post-hoc tests were then computed on the USP data to examine the differences between each community category to understand if one species/community had more impact on the USP than another.
ANOVA and Kruskal-Wallis analyses, as well as respective post-hoc tests Tukey and Mann-Whitney were used on the traits, the community-weighted traits and the biomass data, according to the normality of the data, to examine the differences in trait and community-weighted trait compositions between the communities. Moreover, after combining the data under “monospecific” and “multi-specific” categories, Mann Whitney analyses were carried out on the biomass and the community-weighted trait data, to compare the mean value of the monospecific communities with the multi-specific communities. Regarding the analysis of the CTF communities, the monospecific P communities were removed from the data.
All statistical analyses were computed using the statistical software R (version 3.3.2).
3. Results
3.1. Variation of Community-Weighted Trait and the Unit Stream Power
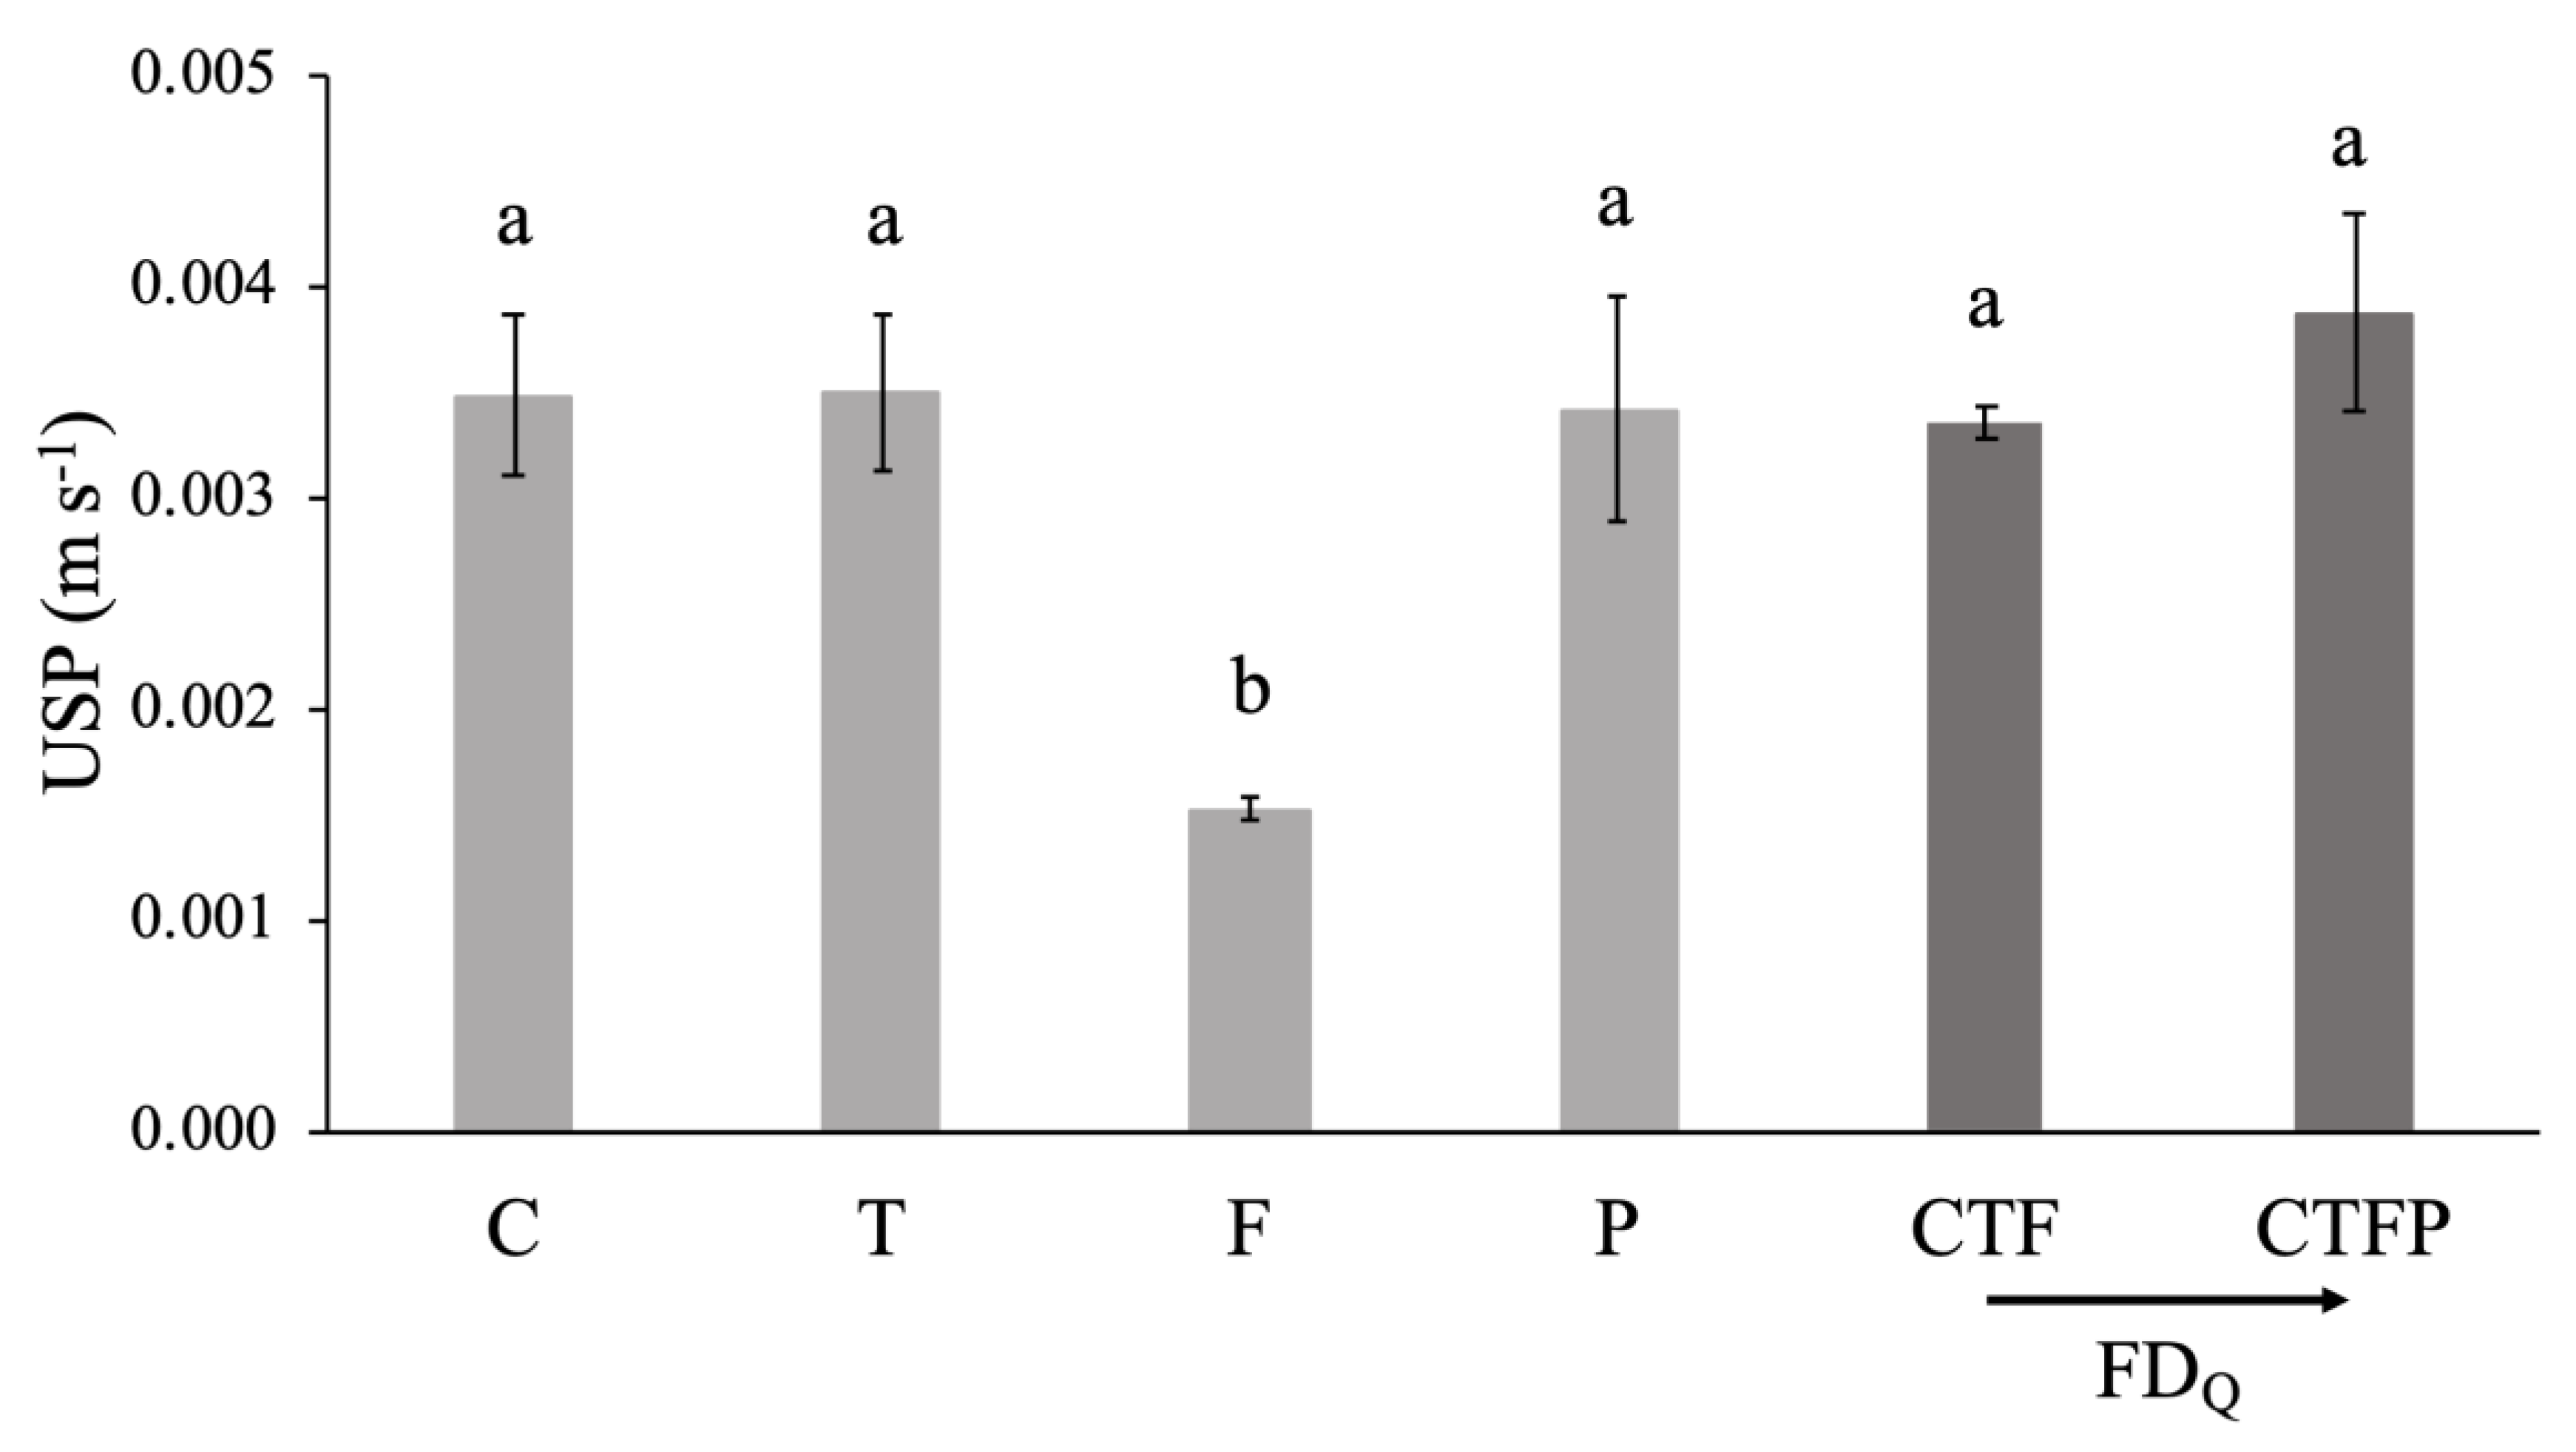
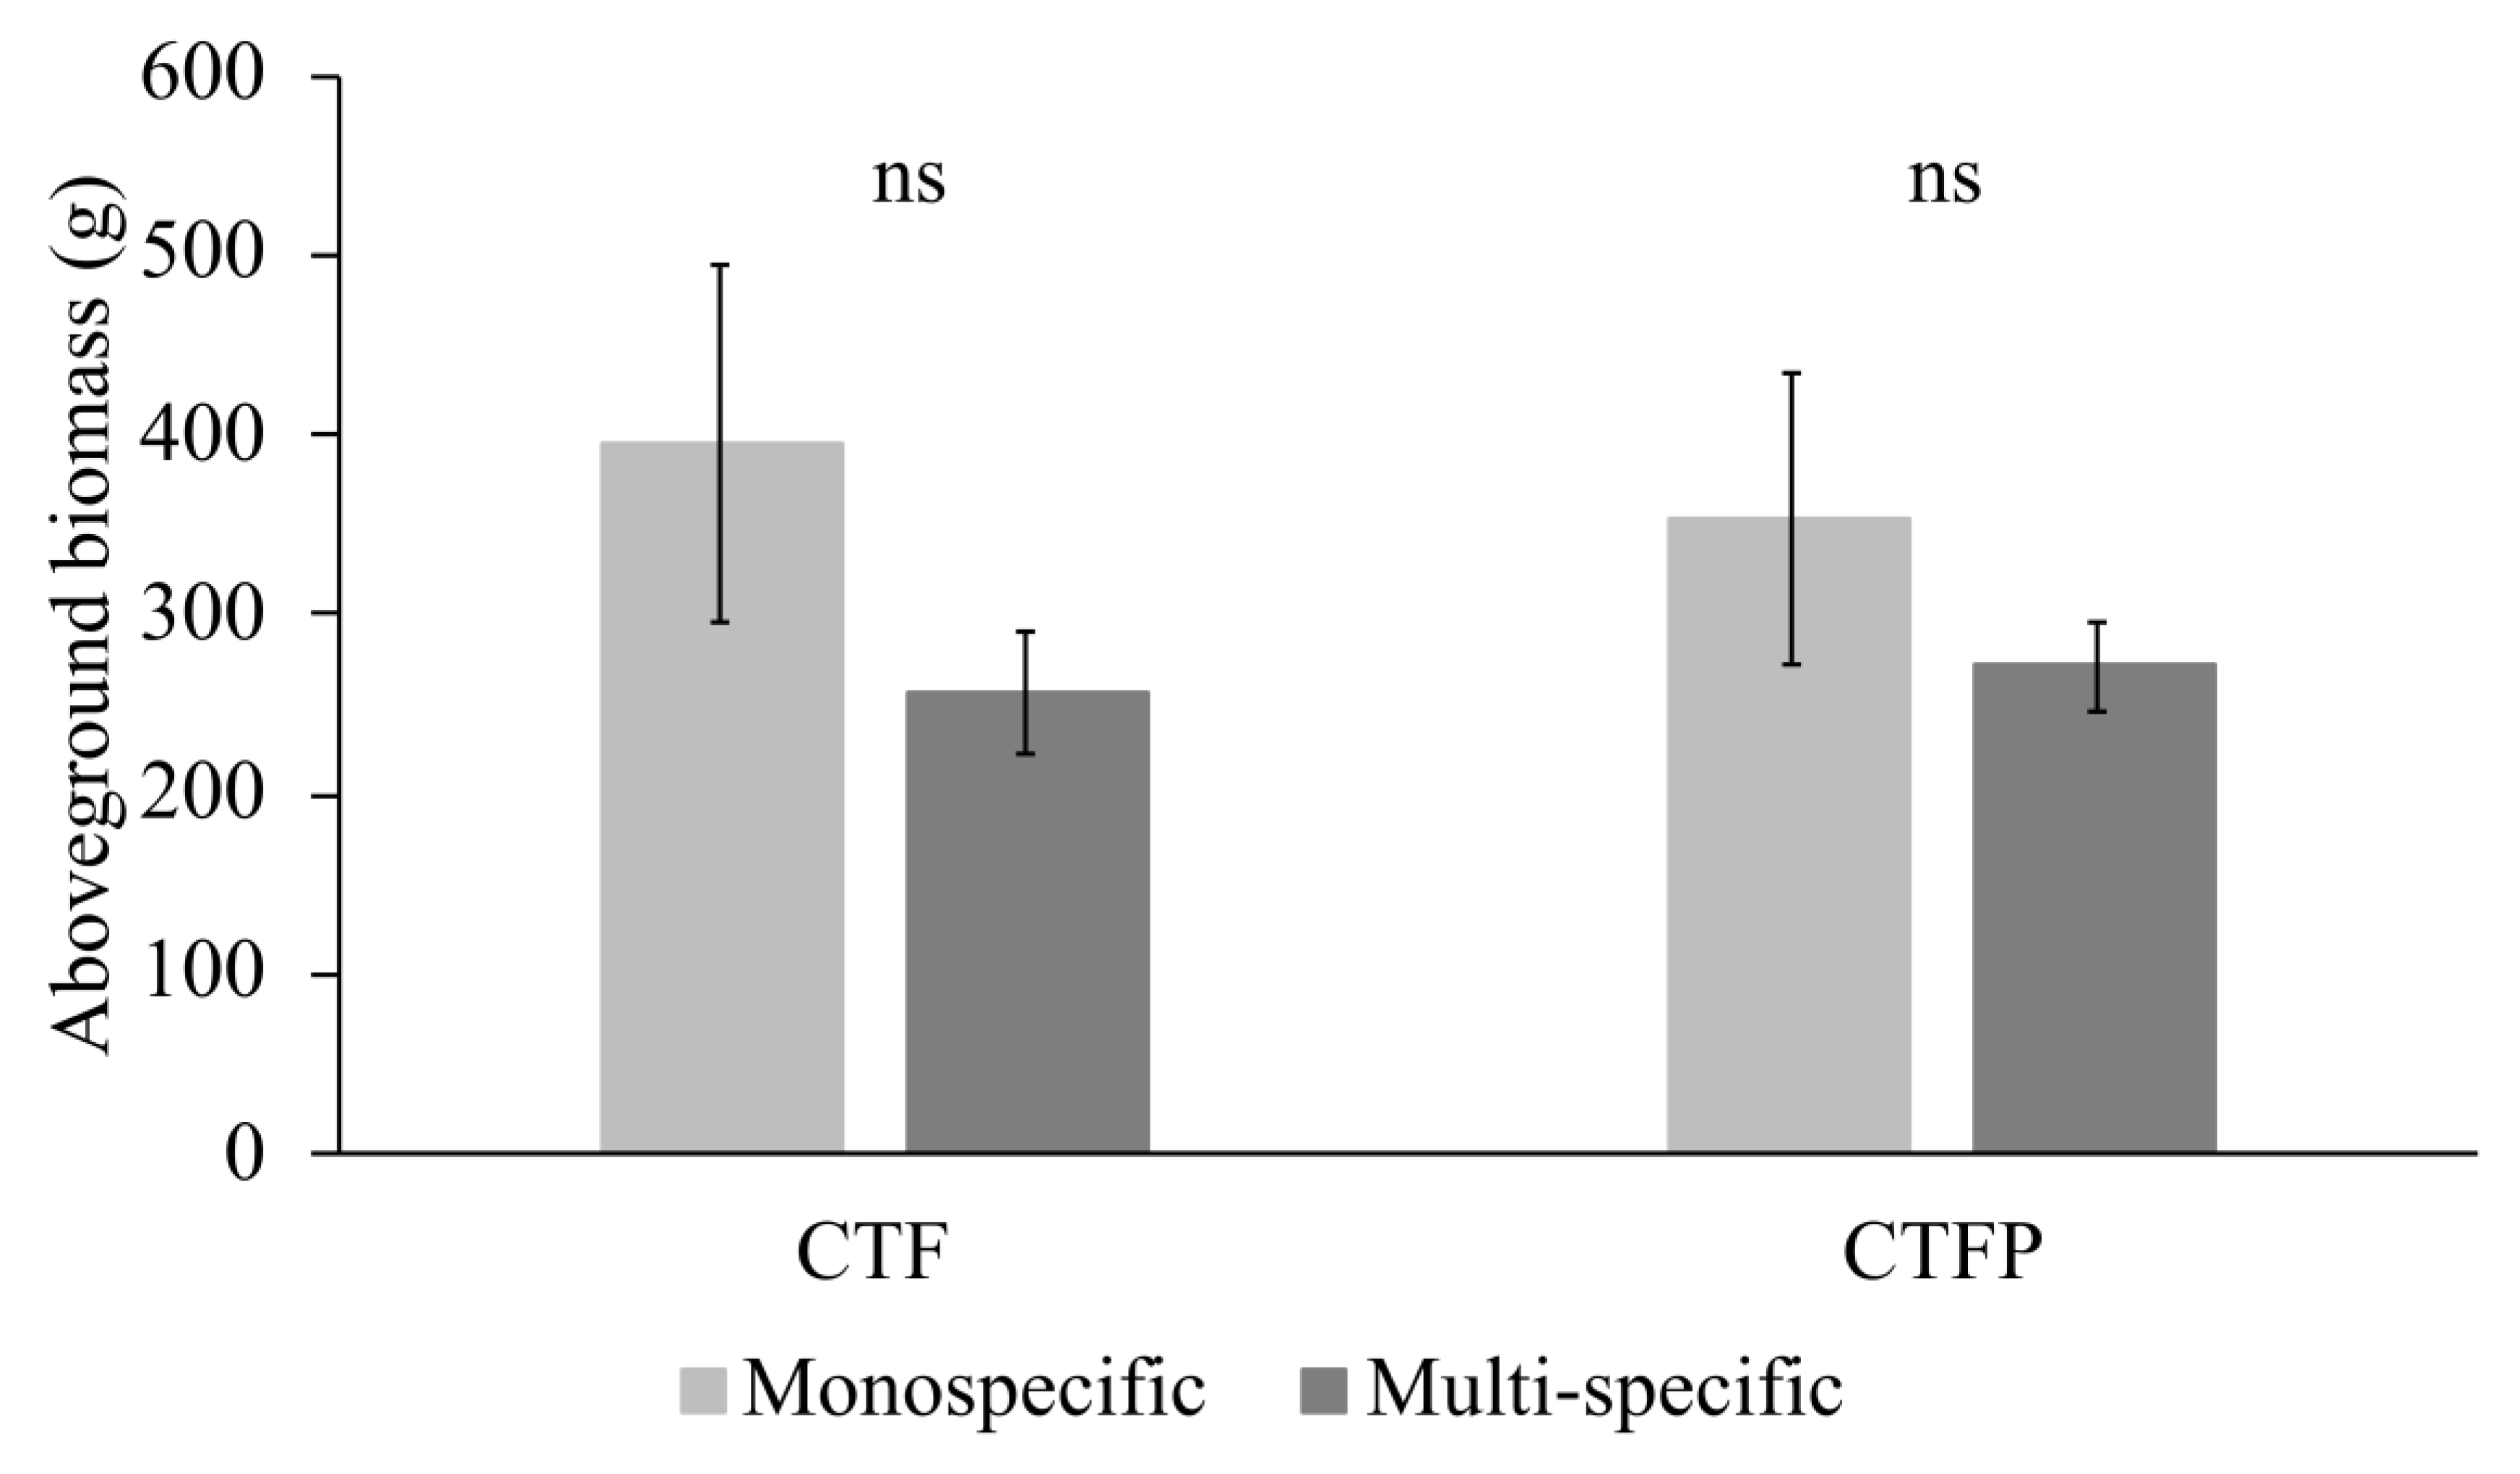
According to the results from the comparison analyses between each community on the USP, only the F. arundinacea in monoculture presented a significant difference to the other communities (Figure 2). Similar results were found at each tested discharge (Table 1). There were no significant differences between the other communities studied. The results on the aboveground biomass did not show any differences between the mean of the monospecific with the multi-specific communities (Figure 3). The analyses comparing the biomass productivity of all the conditions showed a significant difference between C. flacca and T. vulgare (with a trend between C. flacca and all other communities, as well as between T. vulgare and F. arundinacea, as the p-values from the Mann-Whitney tests were 0.057). Regarding the community-weighted trait analysis, all ANOVA/Kruskal-Wallis tests were found to be significant (Table 2). Except for the CW leaf area (CW-LA), CW leaf density (CW-LD; 0–10 cm), CW leaf density (CW-LD; 0–20 cm), and CW density-weighted SLA (CW-DSLA; 0–10 cm), both multi-specific communities showed no significant difference from any monospecific community. CW density-weighted stem projected (CW-DSA) and CW density-weighted stem diameter (CW-DSDm), for all levels along the stem, showed only a difference of F. arundinacea, within the monospecific communities. Differences between F. arundinacea and the multi-specific communities were found for the CW leaf density (0–20 cm) (with both multi-specific communities) and CW leaf density (0–10 cm) (only with CTFP).
3.2. Variation of Functional Diversity within the Communities
The results on the functional variance showed significant differences and a higher variance of the traits in CTFP than in CTF, except for the leaf area (LA) and the density-weighted leaf area (DLA; 0–5 cm) (Table 3). The values of FDQ found for the community CTF was 10 and 11.25 for the community CTFP.
3.3. Variation of Functional Diversity and the Unit Stream Power
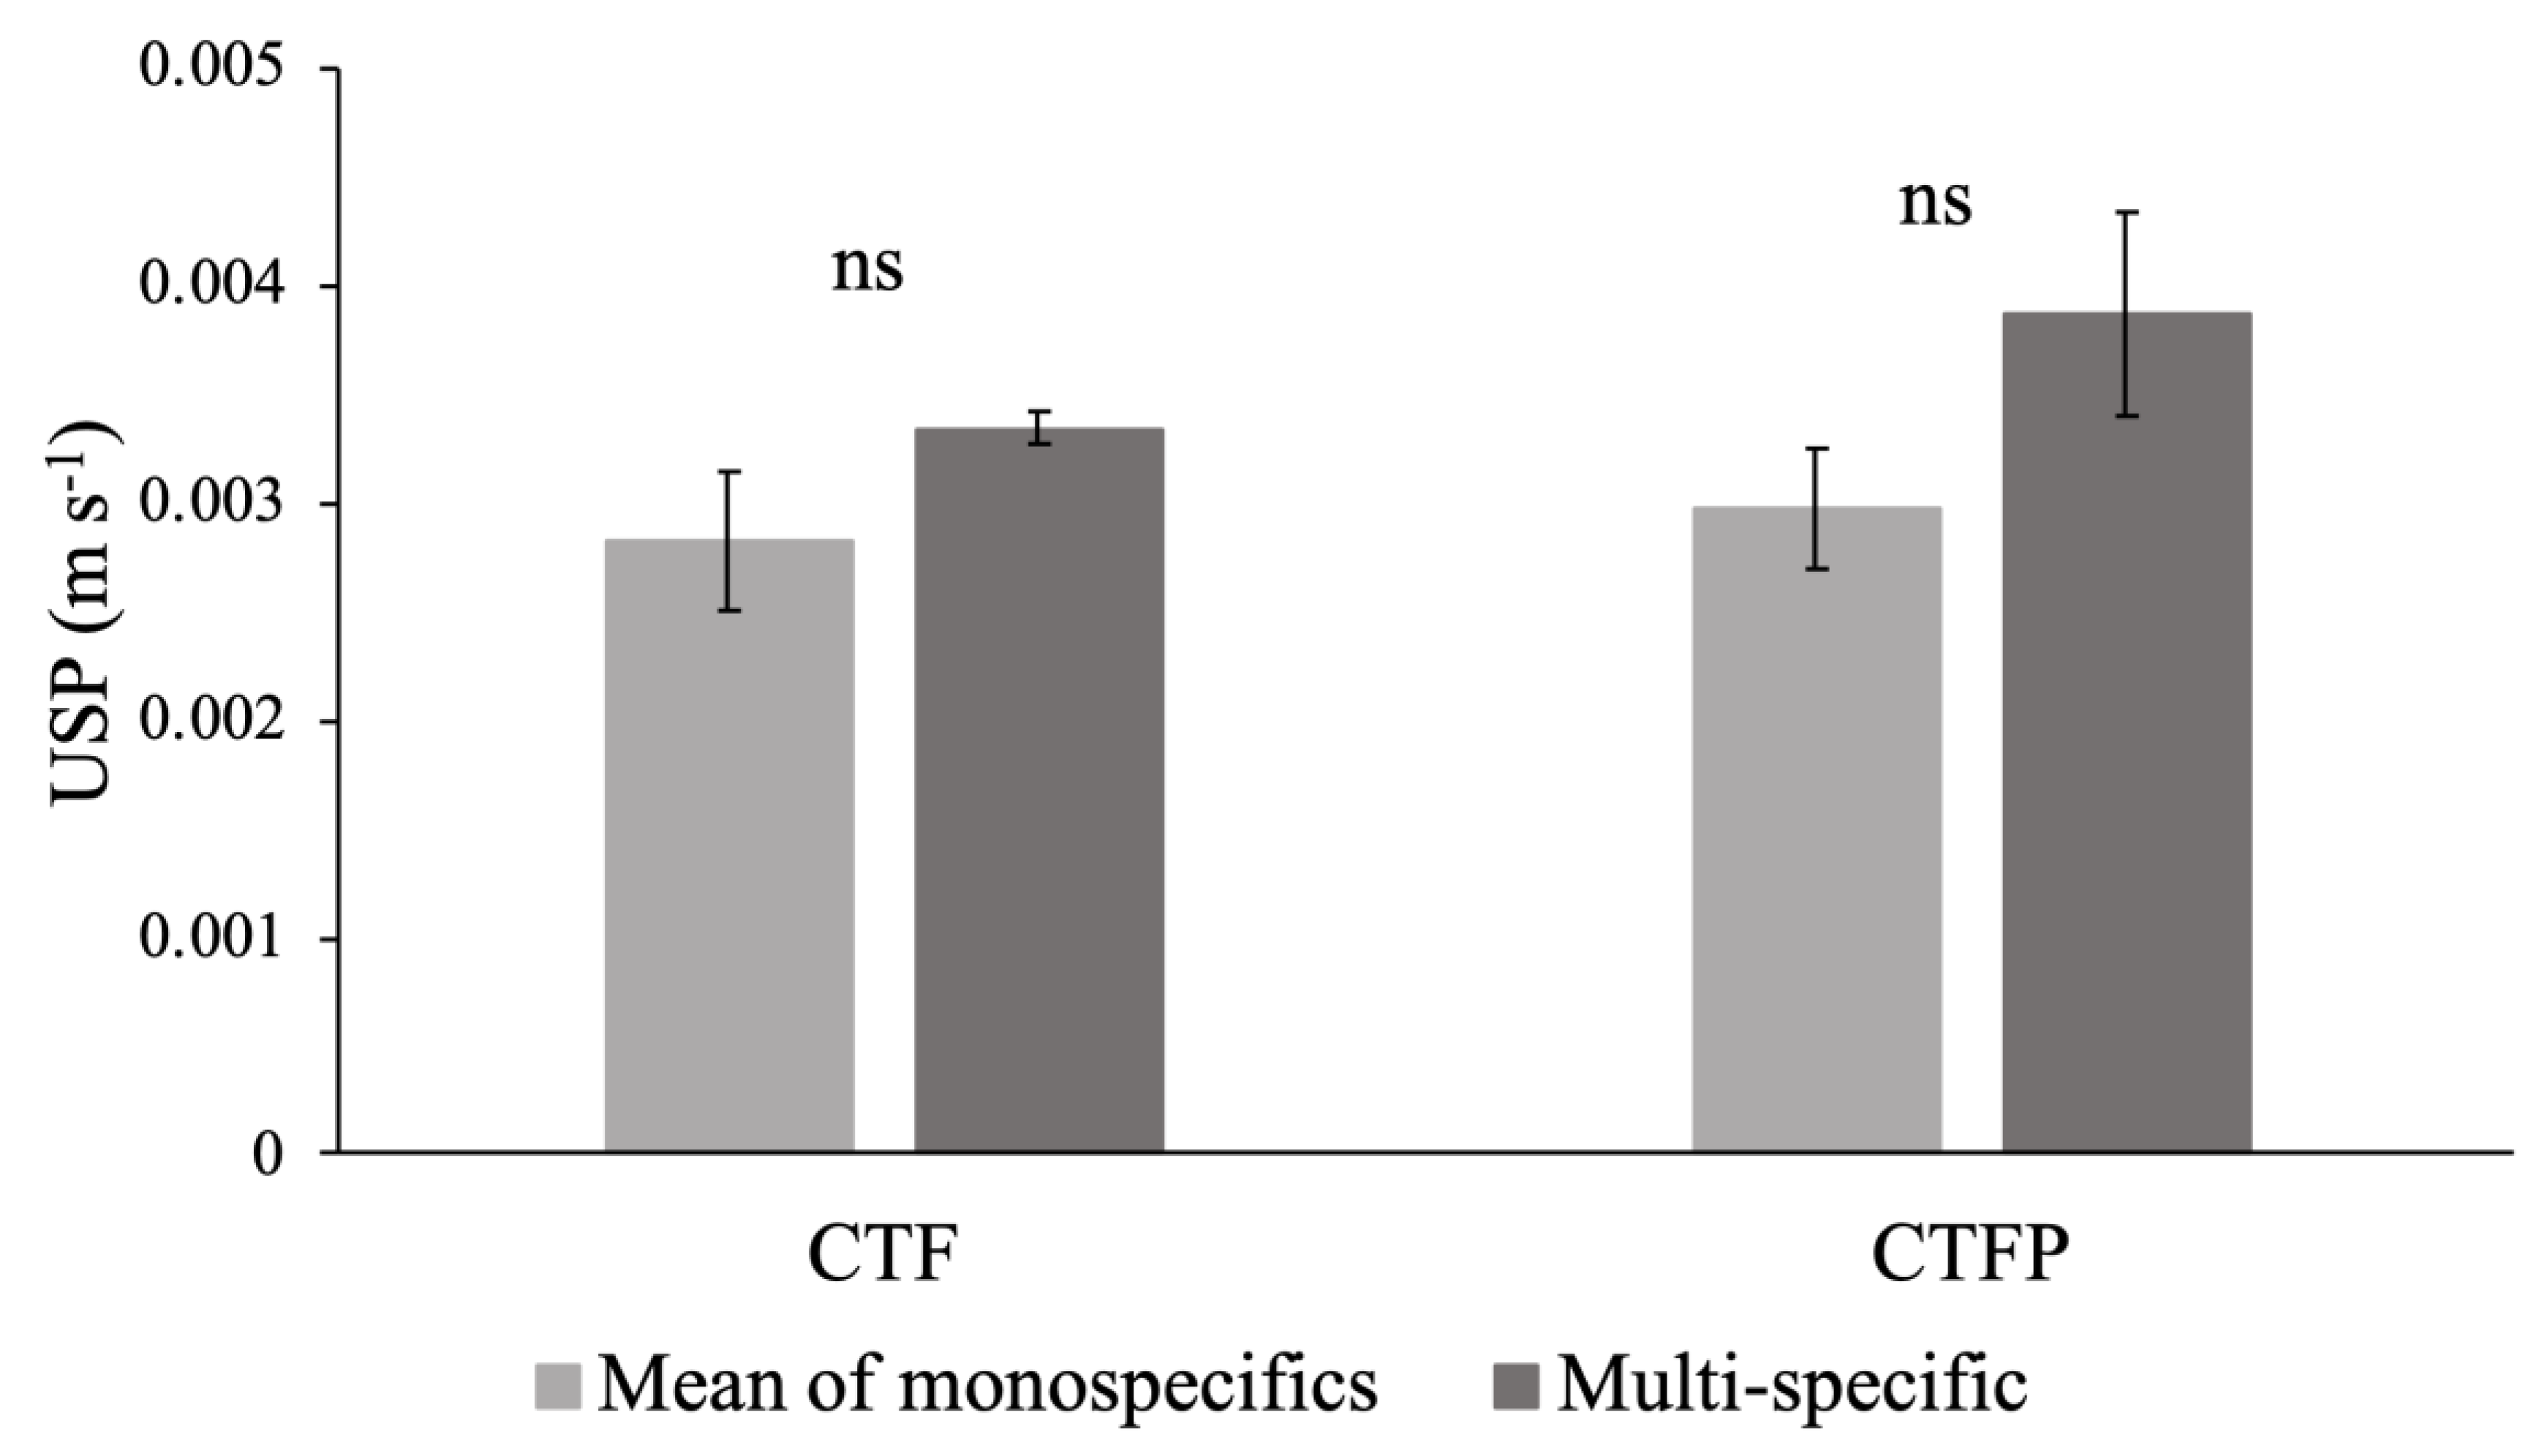
The comparison analysis of the USP values for the monospecific communities and for the multi-specific communities, using the Kruskal-Wallis tests, showed no significant differences for any of the combinations tested (Figure 4). Moreover, no difference was observed between both multi-specific communities and the USP did not show a decrease of its value with an increase of functional diversity in the communities (Figure 4). Similar results were found through all tested discharges.
4. Discussion
4.1. Non-Additive Effect of the Functional Diversity on Hydraulic Roughness
The hydraulic roughness is mainly increased by aboveground plant functional traits in herbaceous plant communities, inducing sediment retention. Associating contrasting traits within a plant community would lead to a better trade-off in the traits values and would more efficiently increase the hydraulic roughness and sediment retention [26]. An increase of functional variance was observed for most of the traits with an increase of functional diversity in the multi-specific conditions. These differences in functional diversity observed among the communities should have led to an additive effect on hydraulic roughness. Indeed, the complementarity hypothesis stipulates that the diversity in trait attributes in a community influences the ecosystem processes, by inducing synergetic effects of functional diversity (i.e., complementarity or facilitation effects) among the coexisting species [7,40]. However, the results did not show any synergetic effect of the functional diversity on hydraulic roughness, in the presence of contrasting traits. This could be justified by the absence of complementarity between the traits, as there were no significant difference between the mean of the monospecific and the multi-specific communities, nor between both multi-specific communities presenting different functional diversities (FDQ). These findings highlighted the dominant effect of the community-weighted traits of specific species in the communities, on runoff. The vegetation effect on the hydraulic roughness was, thus, driven by the traits of one or more species in the community, which presented a dominant effect on the process compared to the traits of other species [6,10,11]. The results emphasized the effects of the community-weighted trait of F. arundinacea on hydraulic roughness being the only species that was significantly different from the other communities, which would be led by the different CW leaf densities (0–20 cm and 0–10 cm), which is a major trait that is known to positively impact hydraulic roughness [26]. While similar effects of the dominance of community-weighted traits on soil retention have been observed in mixtures of different functional types [15] and herbaceous vegetation [16], additive effects of functional diversity on erosion rates were also shown [14]. These opposing effects of functional diversity on the hydraulic roughness and erosion rates could be explained by the idiosyncratic effects, which represent the contrasting effects of functional diversity affected by species and trait interactions, and soil–plant interactions. Idiosyncratic effects could be influenced by the functional structure within the communities [15]. Within the chosen species, T. vulgare presented larger stem diameters than other species, but if the proportion of large stem diameters was too high in the community, preferential flow paths would be taken by water, limiting the effects of denser individuals, which would impact the effect of functional diversity on hydraulic roughness [15,19]. This hypothesis is consistent with results showing that the presence of functional types with larger stem diameters would influence the water path within a vegetation and, thus, displayed no effect of community functional diversity [15]. These findings are also coherent with primary results obtained on herbaceous vegetation, showing the negative influence of plants with low stem density, large diameters, and low leaf density, by reducing the hydraulic roughness and sediment retention within multi-specific communities [16]. The perspective is to study a gradient of functional structure, using a variation of abundances of large stem diameters, to confirm and show the idiosyncratic effects of functional diversity on water flow.
4.2. Implication to Design Herbaceous Hedges for Sediment Retention
These findings constitute an advancement in the understanding of community functional structure effects on runoff and hydraulic roughness. The results highlighted that the presence of high leaf density species would tend to dominate the community effects on hydraulic roughness and, thus, sediment retention. This response was found to be independent from the intensity of the event occurrence, as similar results were found for all tested discharges.
In order to model the effects of multi-specific plant communities on runoff and sediment retention processes, the community-weighted mean value of traits could be implemented, as, depending on the functional structure of the community, a non-additive effect of functional diversity could be found. The integration of the community-weighted traits into modeling vegetation effects would allow to take this dominance effect into account and modeled the community overall effects on runoff and soil erosion in herbaceous hedges that were essentially involved in sediment retention.
Moreover, an absence of negative effect of the functional diversity was found in this study; however, a high competition within the herbaceous hedge due to the species combination could lead to a decrease of stem and leaf densities in the plant community and, thus, to a negative effect of functional diversity on hydraulic roughness. Using combinations of species involved in hydraulic roughness, within the hedge design for increased soil erosion control, is recommended, as long as the competitiveness of the plants (e.g., same range of vegetative height) is taken into account in the species selection process. Indeed, using multi-specific communities would create multi-functional ecosystems that could offer other ecosystem services, such as biodiversity conservation through the creation of new habitats and the enhancement of ecological connectivity, to mitigate biodiversity erosion [41].
5. Conclusions
This ecohydrology study allowed to identify the relationship between the aboveground functional structure and the hydraulic roughness. The results showed that there was no influence of the functional diversity on the hydraulic roughness but rather an effect of the dominant traits was observed in the community, identified as the community-weighted leaf densities. The absence of functional diversity effect on hydraulic roughness would be explained through the idiosyncratic effects of the traits. A new perspective would be to study the functional diversity effects on a wider diversity gradient of candidate species that are involved in the increase of hydraulic roughness, in order to explain the contrasting results found for the functional diversity effects on sediment retention and runoff processes.
Supplementary Materials
The following are available online at https://0-www-mdpi-com.brum.beds.ac.uk/1424-2818/12/4/131/s1. Table S1: Differences in Manning n coefficient and water levels for each community tested at each discharge.
Author Contributions
Conceptualization, L.K., M.-P.F. and R.A.; Methodology, L.K., M.-P.F. and R.A.; Validation, L.K., M.-P.F. and R.A.; Formal Analysis, L.K.; Resources, L.K., M.-P.F., M.S. and R.A.; Data Curation, L.K. and M.S.; Writing—Original Draft Preparation, L.K.; Writing—Review & Editing, L.K., M.-P.F. and R.A.; Supervision, M.-P.F. and R.A. All authors have read and agreed to the published version of the manuscript.
Funding
This research received no external funding.
Acknowledgments
The authors thank the funders of this study: Agence de l’Eau Seine-Normandie (Seine-Normandie Catchment Agency), Région Normandie (Normandy council), and ANRT (National Association for Technological Research). Special acknowledgements are given to Yves le Bissonnais and Freddy Rey for their scientific comments on the methods of our study and to Jean-François Ouvry and M. Jean-Baptiste Richet for their insightful comments and technical advices.
Conflicts of Interest
The authors declare no conflict of interest. The funders had no role in the design of the study; in the collection, analyses, or interpretation of data; in the writing of the manuscript, or in the decision to publish the results
References
- Lavorel, S.; McIntyre, S.; Landsberg, J.; Forbes, T.D.A. Plant functional classifications: From general groups to specific groups based on response to disturbance. Trends Ecol. Evol. 1997, 12, 474–478. [Google Scholar] [CrossRef]
- Cadotte, M.W.; Carscadden, K.; Mirotchnick, N. Beyond species: Functional diversity and the maintenance of ecological processes and services. J. Appl. Ecol. 2011, 48, 1079–1087. [Google Scholar] [CrossRef]
- Díaz, S.; Lavorel, S.; Chapin, F.S.; Tecco, P.A.; Gurvich, D.E.; Grigulis, K. Functional Diversity—At the Crossroads between Ecosystem Functioning and Environmental Filters. In Terrestrial Ecosystems in a Changing World; Canadell, J.G., Pataki, D.E., Pitelka, L.F., Eds.; Springer Berlin Heidelberg: Berlin/Heidelberg, Germany, 2007; pp. 81–91. ISBN 978-3-540-32729-5. [Google Scholar]
- Tilman, D. Functional Diversity. In Encyclopedia of Biodiversity; Levin, S.A., Ed.; Elsevier: Amsterdam, The Netherlands, 2001; pp. 109–120. ISBN 978-0-12-226865-6. [Google Scholar]
- Faucon, M.-P.; Houben, D.; Lambers, H. Plant functional traits: Soil and ecosystem services. Trends Plant Sci. 2017, 22, 385–394. [Google Scholar] [CrossRef] [PubMed]
- Lavorel, S.; Garnier, E. Predicting changes in community composition and ecosystem functioning from plant traits: Revisiting the Holy Grail. Funct. Ecol. 2002, 16, 545–556. [Google Scholar] [CrossRef]
- Tilman, D.; Knops, J.; Wedin, D.; Reich, P.; Ritchie, M.; Siemann, E. The influence of functional diversity and composition on ecosystem processes. Science 1997, 277, 1300–1302. [Google Scholar] [CrossRef] [Green Version]
- Song, Y.; Wang, P.; Li, G.; Zhou, D. Relationships between functional diversity and ecosystem functioning: A review. Acta Ecol. Sin. 2014, 34, 85–91. [Google Scholar] [CrossRef]
- Cadotte, M.W. Functional traits explain ecosystem function through opposing mechanisms. Ecol. Lett. 2017, 20, 989–996. [Google Scholar] [CrossRef]
- Grime, J.P. Benefits of plant diversity to ecosystems: Immediate, filter and founder effects. J. Ecol. 1998, 86, 902–910. [Google Scholar] [CrossRef]
- Díaz, S.; Lavorel, S.; de Bello, F.; Quetier, F.; Grigulis, K.; Robson, T.M. Incorporating plant functional diversity effects in ecosystem service assessments. Proc. Natl. Acad. Sci. USA 2007, 104, 20684–20689. [Google Scholar] [CrossRef] [Green Version]
- Petchey, O.L. Integrating methods that investigate how complementarity influences ecosystem functioning. Oikos 2003, 101, 323–330. [Google Scholar] [CrossRef]
- Loreau, M.; Hector, A. Partitioning selection and complementarity in biodiversity experiments. Nature 2001, 412, 72–76. [Google Scholar] [CrossRef] [PubMed]
- Zhu, H.; Fu, B.; Wang, S.; Zhu, L.; Zhang, L.; Jiao, L.; Wang, C. Reducing soil erosion by improving community functional diversity in semi-arid grasslands. J. Appl. Ecol. 2015, 52, 1063–1072. [Google Scholar] [CrossRef]
- Erktan, A.; Cécillon, L.; Roose, E.; Frascaria-Lacoste, N.; Rey, F. Morphological diversity of plant barriers does not increase sediment retention in eroded marly gullies under ecological restoration. Plant Soil 2013, 370, 653–669. [Google Scholar] [CrossRef]
- Kervroëdan, L.; Armand, R.; Saunier, M.; Faucon, M.-P. Effects of plant traits and their divergence on runoff and sediment retention in herbaceous vegetation. Plant Soil 2019, 441, 511–524. [Google Scholar] [CrossRef]
- Guerrero-Campo, J.; Montserrat-Martí, G. Effects of soil erosion on the floristic composition of plant communities on marl in northeast Spain. J. Veg. Sci. 2000, 11, 329–336. [Google Scholar] [CrossRef]
- Martin, C.; Pohl, M.; Alewell, C.; Körner, C.; Rixen, C. Interrill erosion at disturbed alpine sites: Effects of plant functional diversity and vegetation cover. Basic Appl. Ecol. 2010, 11, 619–626. [Google Scholar] [CrossRef]
- Styczen, M.E.; Morgan, R.P.C. Engineering properties of vegetation. In Slope Stabilization and Erosion Control: A Bioengineering Approach; Morgan, R.P.C., Rickson, R.J., Eds.; E & FN SPON: London, UK, 1995; pp. 4–60. ISBN 978-1-135-83190-5. [Google Scholar]
- Haan, C.T.; Barfield, B.J.; Hayes, J.C. Design Hydrology and Sedimentology for Small Catchments; Academic Press: Cambridge, MA, USA, 1994; ISBN 978-0-08-057164-5. [Google Scholar]
- Cao, L.; Zhang, Y.; Lu, H.; Yuan, J.; Zhu, Y.; Liang, Y. Grass hedge effects on controlling soil loss from concentrated flow: A case study in the red soil region of China. Soil Tillage Res. 2015, 148, 97–105. [Google Scholar] [CrossRef]
- Cantalice, J.R.B.; Silveira, F.P.M.; Singh, V.P.; Silva, Y.J.A.B.; Cavalcante, D.M.; Gomes, C. Interrill erosion and roughness parameters of vegetation in rangelands. CATENA 2017, 148, 111–116. [Google Scholar] [CrossRef]
- Temple, D.M.; Robinson, K.M.; Ahring, R.M.; Davis, A.G. Stability Design of Grass-Lined Open Channels; Agriculture Handbook; U.S. Department of Agriculture: Washington, DC, USA, 1987.
- Akram, S.; Yu, B.; Ghadiri, H.; Rose, C.; Hussein, J. The links between water profile, net deposition and erosion in the design and performance of stiff grass hedges. J. Hydrol. 2014, 510, 472–479. [Google Scholar] [CrossRef]
- Burylo, M.; Rey, F.; Bochet, E.; Dutoit, T. Plant functional traits and species ability for sediment retention during concentrated flow erosion. Plant Soil 2012, 353, 135–144. [Google Scholar] [CrossRef] [Green Version]
- Kervroëdan, L.; Armand, R.; Saunier, M.; Ouvry, J.-F.; Faucon, M.-P. Plant functional trait effects on runoff to design herbaceous hedges for soil erosion control. Ecol. Eng. 2018, 118, 143–151. [Google Scholar] [CrossRef] [Green Version]
- Hussein, J.; Yu, B.; Ghadiri, H.; Rose, C. Prediction of surface flow hydrology and sediment retention upslope of a vetiver buffer strip. J. Hydrol. 2007, 338, 261–272. [Google Scholar] [CrossRef] [Green Version]
- Cantalice, J.R.B.; Melo, R.O.; Silva, Y.J.A.B.; Cunha Filho, M.; Araújo, A.M.; Vieira, L.P.; Bezerra, S.A.; Barros, G.; Singh, V.P. Hydraulic roughness due to submerged, emergent and flexible natural vegetation in a semiarid alluvial channel. J. Arid Environ. 2015, 114, 1–7. [Google Scholar] [CrossRef]
- Järvelä, J. Flow resistance of flexible and stiff vegetation: A flume study with natural plants. J. Hydrol. 2002, 269, 44–54. [Google Scholar] [CrossRef]
- Pérez-Harguindeguy, N.; Díaz, S.; Garnier, E.; Lavorel, S.; Poorter, H.; Jaureguiberry, P.; Bret-Harte, M.S.; Cornwell, W.K.; Craine, J.M.; Gurvich, D.E.; et al. New handbook for standardised measurement of plant functional traits worldwide. Aust. J. Bot. 2013, 61, 167–234. [Google Scholar] [CrossRef]
- Violle, C.; Navas, M.-L.; Vile, D.; Kazakou, E.; Fortunel, C.; Hummel, I.; Garnier, E. Let the concept of trait be functional! Oikos 2007, 116, 882–892. [Google Scholar] [CrossRef]
- Mason, N.W.H.; Mouillot, D.; Lee, W.G.; Wilson, J.B. Functional richness, functional evenness and functional divergence: The primary components of functional diversity. Oikos 2005, 111, 112–118. [Google Scholar] [CrossRef]
- Mason, N.W.H.; MacGillivray, K.; Steel, J.B.; Wilson, J.B. An index of functional diversity. J. Veg. Sci. 2003, 14, 571–578. [Google Scholar] [CrossRef]
- Rao, C.R. Diversity and dissimilarity coefficients: A unified approach. Theor. Popul. Biol. 1982, 21, 24–43. [Google Scholar] [CrossRef]
- Leps, J.; De Bello, F.; Lavorel, S.; Berman, S. Quantifying and interpreting functional diversity of natural communities: Practical considerations matter. Preslia 2006, 78, 481–501. [Google Scholar]
- Botta-Dukát, Z. Rao’s quadratic entropy as a measure of functional diversity based on multiple traits. J. Veg. Sci. 2005, 16, 533–540. [Google Scholar] [CrossRef]
- Richet, J.-B.; Ouvry, J.-F.; Saunier, M. The role of vegetative barriers such as fascines and dense shrub hedges in catchment management to reduce runoff and erosion effects: Experimental evidence of efficiency, and conditions of use. Ecol. Eng. 2017, 103, 455–469. [Google Scholar] [CrossRef]
- Yang, C.T. Unit stream power and sediment transport. ASCE J. Hydraul. Div. 1972, 98, 1805–1826. [Google Scholar]
- Govers, G. Relationship between discharge, velocity and flow area for rills eroding loose, non-layered materials. Earth Surf. Process. Landf. 1992, 17, 515–528. [Google Scholar] [CrossRef]
- Petchey, O.L.; Gaston, K.J. Functional diversity: Back to basics and looking forward. Ecol. Lett. 2006, 9, 741–758. [Google Scholar] [CrossRef]
- Ouin, A.; Burel, F. Influence of herbaceous elements on butterfly diversity in hedgerow agricultural landscapes. Agric. Ecosyst. Environ. 2002, 93, 45–53. [Google Scholar] [CrossRef]
Figure 1.
Experimental design: (A) Three levels of plant functional diversity with four monospecific and two multi-specific conditions; and (B) runoff simulator set-up used for the experiments and water level measurement. The photos of the plots were taken 1.5 month prior to the experiments. C – Carex flacca, T—Tanacetum vulgare, F—Festuca arundinacea and P—Phalaris arundinacea; CTF—Carex flacca + Tanacetum vulgare + Festuca arundinacea; CTFP—Carex flacca + Tanacetum vulgare + Festuca arundinacea + Phalaris arundinacea.

Figure 2.
Differences between each community, at discharge 2 L s−1 m−1. The bars represent the mean ± standard error. The letters represent the significant differences between each community according to the Tukey post-hoc tests. The arrow represents the increase of the functional diversity between both multi-specific conditions (with Rao’s quadratic entropy (FDQ)).

Figure 3.
Differences in biomass productivity between the mean of the monospecific communities and the multi-specific communities. The bars represent the mean ± standard error. Significance level: ns = not significant.
Figure 3.
Differences in biomass productivity between the mean of the monospecific communities and the multi-specific communities. The bars represent the mean ± standard error. Significance level: ns = not significant.

Figure 4.
Differences between the mean of the monospecific and the multi-specific conditions at the discharge 2 L s−1 m−1. The bars represent the mean ± standard error. Significance level: ns = not significant.
Figure 4.
Differences between the mean of the monospecific and the multi-specific conditions at the discharge 2 L s−1 m−1. The bars represent the mean ± standard error. Significance level: ns = not significant.


Table 1.
Differences in unit stream power for each community tested at each discharge.
| Discharges | C | T | F | P | CTF | CTFP | ANOVA |
|---|---|---|---|---|---|---|---|
| Q1 = 2 L s−1 m−1 | 0.0035 (±0.0008) a | 0.0035 (±0.0007) a | 0.0015 (±0.0001) b | 0.0034 (±0.0011) a | 0.0033 (±0.0001) a | 0.0039 (±0.0008) a | 5.29 ** |
| Q2 = 4 L s−1 m−1 | 0.0046 (±0.0007) a | 0.0051 (±0.0009) a | 0.0021 (±0.0001) b | 0.0046 (±0.0011) a | 0.0044 (±0.0002) a | 0.0053 (±0.0008) a | 8.8 *** |
| Q3 = 8 L s−1 m−1 | 0.0066 (±0.001) a | 0.0083 (±0.0013) a | 0.0032 (±0.0002) b | 0.0067 (±0.0013) a | 0.0064 (±0.0004) a | 0.0077 (±0.0015) a | 10.92 *** |
| Q4 = 11 L s−1 m−1 | 0.0078 (±0.0011) a | 0.0105 (±0.0015) a | 0.0038 (±0.0001) b | 0.0079 (±0.0016) a | 0.0077 (±0.0006) a | 0.009 (±0.0017) a | 12.64 *** |
Data are unit stream power (USP) mean values (±standard deviation) and the results of the statistical tests F in ANOVA. C—Carex flacca; T—Tanacetum vulgare; F—Festuca arundinacea; P—Phalaris arundinacea; CTF—Carex flacca + Tanacetum vulgare + Festuca arundinacea; and CTFP—Carex flacca + Tanacetum vulgare + Festuca arundinacea + Phalaris arundinacea. The letters represent the significant differences between the communities, according to the Tukey post-hoc tests. Significance levels: *** = p < 0.001; ** = p < 0.01; * = p < 0.05; ns = not significant.
Table 2.
Differences in community-weighted traits (CW) for each community tested.
| Community-Weighted Traits | C | T | F | P | CTFP | CTF | ANOVA /Kruskal-Wallis |
|---|---|---|---|---|---|---|---|
| CW-LA (mm2) | 1575.8 (±144.6) a | 4168.5 (±1049.5) b | 3130 (±298.4) bc | 3054.4 (±331.1) bc | 3116.2 (±605.6) bc | 2715.9 (±224.8) ac | 9.28 *** |
| CW-LD5 (dm−2) | 96.3 (±15.6) a | 12 (±2.6) b | 193.1 (±73.3) c | 46.6 (±24.5) a | 91.2 (±7.1) abc | 111.2 (±21.8) abc | 18.99 ** |
| CW-LD10 (dm−2) | 148.8 (±30.8) a | 20.8 (±1.5) b | 280.3 (±79.6) c | 74.9 (±43.1) ab | 154.8 (±37.8) a | 171.7 (±31.4) ac | 15.53 *** |
| CW-LD20 (dm−2) | 236.5 (±43.4) a | 38.8 (±2.6) b | 423.9 (±61.4) c | 108.5 (±61.4) bd | 214.8 (±79.7) ad | 212.8 (±40.2) ad | 24.89 *** |
| CW-DLA5 (mm2 dm−2) | 153,175 (±35,395) a | 50,527 (±20,693) b | 599,417 (±210,360) c | 147,223 (±90,166) ab | 229,484 (±25,910) abc | 251,565 (±59,698) abc | 17.96 ** |
| CW-DLA10 (mm2 dm−2) | 236,709 (±61,527) a | 86,420 (±23,545) b | 868,938 (±216,666) c | 237,161 (±156,858) a | 406,719 (±121,334) abc | 389,669 (±77,960) abc | 17.63 ** |
| CW-DLA20 (mm2 dm−2) | 376,697 (±93,429) a | 163,234 (±48,516) b | 1,325,651 (±212,015) c | 343,506 (±223,961) ab | 573,873 (±251,557) abc | 474,577 (±79,275) abc | 15.91 ** |
| CW-DSA5 (mm2 dm−2) | 4675.3 (±1258.3) a | 2263.4 (±593.7) a | 19,926 (±7469.9) b | 3880.1 (±2061) a | 6088.6 (±1345) ab | 5579.4 (±1499.8) ab | 15.48 ** |
| CW-DSA10 (mm2 dm−2) | 9226.5 (±2471.1) a | 4412.9 (±1116.5) a | 40,673 (±15,603) b | 7458.3 (±3858.2) a | 12,040 (±2561.4) ab | 11,169 (±2975.2) ab | 15.95 ** |
| CW-DSA20 (mm2 dm−2) | 16,841 (±4587.3) a | 8739.8 (±2140.3) a | 82,565 (±30,896) b | 14,356 (±7515.9) a | 23,190 (±5038.9) ab | 21,497 (±5331.6) ab | 16.09 ** |
| CW-DSDm5 (mm dm−2) | 93.5 (±25.2) a | 45.3 (±11.9) a | 398.5 (±149.4) b | 77.6 (±41.2) a | 121.8 (±26.9) ab | 111.6 (±30) ab | 15.48 ** |
| CW-DSDm10 (mm dm−2) | 92.3 (±24.7) a | 44.1 (±11.2) a | 406.7 (±156) b | 74.6 (±38.6) a | 120.4 (±25.6) ab | 111.7 (±29.8) ab | 15.95 ** |
| CW-DSDm20 (mm dm−2) | 91.5 (±24) a | 43.7 (±10.7) a | 412.8 (±154.5) b | 71.8 (±37.6) a | 119.2 (±25.4) ab | 110.6 (±27.1) ab | 15.95 ** |
Data are CW mean values (±standard deviation) and results of F (ANOVA) and Chi-squared (Kruskal-Wallis, in bold) statistical tests. C—Carex flacca; T—Tanacetum vulgare; F—Festuca arundinacea; P—Phalaris arundinacea; CTF—Carex flacca + Tanacetum vulgare + Festuca arundinacea; CTFP—Carex flacca + Tanacetum vulgare + Festuca arundinacea + Phalaris arundinacea; LA—leaf area; LD—leaf density; DLA—leaf area density; DSA—stem area density; and DSDm—stem diameter density. The letters represent the significant differences between the communities, according to the Tukey and Mann-Whitney post-hoc tests. Significance levels: *** = p < 0.001; ** = p < 0.01; * = p < 0.05; ns = not significant.
Table 3.
Summary of the functional diversity variance FDvar for both multi-specific communities and results from the T and Mann-Whitney tests.
Table 3.
Summary of the functional diversity variance FDvar for both multi-specific communities and results from the T and Mann-Whitney tests.
| Traits | CTF | CTFP | t/W |
|---|---|---|---|
| LA (mm2) | 0.7454 (±0.0836) | 0.7614 (±0.0735) | −0.24864 ns |
| LD5 (dm−2) | 0.9855 (±0.0009) | 0.9883 (±0.0006) | −4.5579 * |
| LD10 (dm−2) | 0.9879 (±0.0008) | 0.9905 (±0.0007) | −4.1791 * |
| LD20 (dm−2) | 0.9889 (±0.0009) | 0.9917 (±0.001) | −3.6474 * |
| DSA5 (mm2 dm−2) | 0.9967 (±0.0002) | 0.9974 (±0.0002) | −4.9464 * |
| DSA10 (mm2 dm−2) | 0.9972 (±0.0002) | 0.9979 (±0.0001) | −5.5758 ** |
| DSA20 (mm2 dm−2) | 0.9976 (±0.0001) | 0.9982 (±0.0001) | −6.6792 ** |
| DSDm5 (mm dm−2) | 0.9878 (±0.0013) | 0.9903 (±0.0009) | −2.7224 ° |
| DSDm10 (mm dm−2) | 0.9878 (±0.0012) | 0.9902 (±0.0009) | −2.8 ° |
| DSDm20 (mm dm−2) | 0.9878 (±0.001) | 0.9902 (±0.0009) | −3.0036 * |
| DLA5 (mm2 dm−2) | 0.9986 (±0.00003) | 0.999 (±0.00003) | 0 ns |
| DLA10 (mm2 dm−2) | 0.9987 (±0.00002) | 0.9991 (±0.0001) | −11.108 ** |
| DLA20 (mm2 dm−2) | 0.9988 (±0.00003) | 0.9992 (±0.0001) | −8.8503 ** |
Data are FDvar mean values (±standard deviation) and t values of T tests and the W value of Mann-Whitney (in bold) test. CTF—Carex flacca + Tanacetum vulgare + Festuca arundinacea; CTFP—Carex flacca + Tanacetum vulgare + Festuca arundinacea + Phalaris arundinacea; LA—leaf area; LD—leaf density; DLA—leaf area density; DSA—stem area density; and DSDm—stem diameter density. Significance levels: *** = p < 0.001; ** = p < 0.01; * = p < 0.05; ° = p < 0.1; ns = not significant.
© 2020 by the authors. Licensee MDPI, Basel, Switzerland. This article is an open access article distributed under the terms and conditions of the Creative Commons Attribution (CC BY) license (http://creativecommons.org/licenses/by/4.0/).
Share and Cite
MDPI and ACS Style
Kervroëdan, L.; Armand, R.; Saunier, M.; Faucon, M.-P. Functional Diversity Effects of Vegetation on Runoff to Design Herbaceous Hedges for Sediment Retention. Diversity 2020, 12, 131. https://0-doi-org.brum.beds.ac.uk/10.3390/d12040131
AMA Style
Kervroëdan L, Armand R, Saunier M, Faucon M-P. Functional Diversity Effects of Vegetation on Runoff to Design Herbaceous Hedges for Sediment Retention. Diversity. 2020; 12(4):131. https://0-doi-org.brum.beds.ac.uk/10.3390/d12040131
Chicago/Turabian StyleKervroëdan, Léa, Romain Armand, Mathieu Saunier, and Michel-Pierre Faucon. 2020. "Functional Diversity Effects of Vegetation on Runoff to Design Herbaceous Hedges for Sediment Retention" Diversity 12, no. 4: 131. https://0-doi-org.brum.beds.ac.uk/10.3390/d12040131
Note that from the first issue of 2016, this journal uses article numbers instead of page numbers. See further details here.