Article

On the Challenge to Correctly Identify Rasboras (Teleostei: Cyprinidae: Danioninae) Inhabiting the Mesangat Wetlands, East Kalimantan, Indonesia

1
Zoologisches Forschungsmuseum Alexander Koenig, 53113 Bonn, Germany
2
Ichthyology Laboratory, Division of Zoology, Research Centre for Biology, Indonesian Institute of Science (LIPI), (+62) 251 Cibinong, Indonesia
3
Cologne Zoo, 50735 Cologne, Germany
4
Institute of Zoology, University of Cologne, 50674 Cologne, Germany
*
Author to whom correspondence should be addressed.
In special memory of our friend and colleague Renny K. Hadiaty (21 August 1960–30 January 2019), who devoted her life to the exploration of the Indonesian fish diversity.
Submission received: 27 November 2020 / Revised: 18 December 2020 / Accepted: 24 December 2020 / Published: 30 December 2020

Abstract

:
Within the subfamily Danioninae, rasborine cyprinids are known as a ‘catch-all’ group, diagnosed by only a few characteristics. Most species closely resemble each other in morphology. Species identification is therefore often challenging. In this study, we attempted to determine the number of rasborine species occurring in samples from the Mesangat wetlands in East Kalimantan, Indonesia, by using different approaches. Morphological identification resulted in the distinction of five species (Trigonopoma sp., Rasbora cf. hubbsi Brittan, 1954, R. rutteni Weber and de Beaufort, 1916, R. trilineata Steindachner, 1870, and R. vaillantii, Popta 1905). However, genetic species delimitation methods (Poisson tree processes (PTP) and multi-rate PTP (mPTP)) based on DNA barcodes and principal component analysis (PCA) based on homologous geometric morphometric landmarks, revealed a single cluster for Trigonopoma sp. and R. trilineata, respectively, whereas the remaining traditionally identified species were distinguished neither by DNA barcodes nor by the morphometry approach. A k-mean clustering based on the homologous landmarks divided the sample into 13 clusters and was thus found to be inappropriate for landmark data from species extremely resembling each other in morphology. Due to inconsistent results between the applied methods we refer to the traditional identifications and distinguish five rasborine species for the Mesangat wetlands.

1. Introduction

Sundaland (Southeastern Asia) is one of the global biodiversity hotspots [1]. About 400 freshwater fish species are endemic to the region [2], and species determination remains a major challenge especially in species-rich groups of freshwater fishes [3]. Reliable identification is crucial for management of biodiversity, and freshwater ecosystems are no exception in this respect [2,4,5,6].
The Danau Mesangat-Kenohan Suhuwi wetlands in East Kalimantan, Indonesia is part of the Mahakam River drainage and expands over approximately 18,500 hectares. It is characterized by annual fluctuations in water level, as well as heterogeneous habitats such as peat swamps, flooded forests, and small rivers entering the Mesangat Lake [7,8,9,10]. More information is given by Staniewicz et al. [7] as well as in Sudrajat and Saleh [8].
The fish fauna of the Mahakam River, the second-largest river on Borneo, is also only poorly known. Some fish records were made in the beginning of the 20th century by A. W. Nieuwenhuis and M. Schmidt [11,12,13,14,15,16,17,18,19] as well as by Christensen [20] and Kottelat [12]. In total, 178 native freshwater fish species have been recorded, from which 20 are endemic to the Mahakam basin [12,20,21,22]. The Cyprinidae, with 57 species is the most species-rich family, dominated by the genera Osteochilus (10 spp.) and 11 Rasbora species (R. atranus Kottelat and Tan, 2011, R. bankanensis (Bleeker, 1853), R. cephalotaenia (Bleeker, 1852), R. elegans Volz, 1903, R. lacrimula Hadiaty and Kottelat, 2009a, R. laticlavia Siebert and Richardson, 1997, R. subtilis Roberts, 1989, R. trilineata Steindachner, 1870, R. trifasciata Popta, 1905, R. vaillantii Popta, 1905, and R. volzii Popta, 1905) [12,20,21,22,23,24,25]. However, both Christensen [20] and Kottelat [12] stated that their species lists are far from being complete, and that further studies are necessary.
There are 79 species of Rasborinae in Sundaland, including 65 that belong to the genus Rasbora and only two to the genus Trigononopoma [26,27]. Most of them closely resemble each other in general morphology and the taxonomy of the group suffers from the absence of clear diagnostic morphological characteristics. Brittan [27,28,29] classified the Rasbora according to specific morphology and hypothetic evolutionary linkages into eight ‘species complexes’: the lateristriata, the sumatrana-elegans, the caudimaculata, the trifasciata, the argyrotaenia, the daniconius, the einthovenii, and the pauciperforata. Based on these ‘species complexes’, which were modified by Kottelat and Vidthayanon [30] and named ‘species groups’, several studies aimed at resolving the Rasbora phylogeny. Referring to 41 morphological characters Liao et al. [31] partly confirmed Brittan’s [29] ‘species groups’, established the Rasbora semilineata species group, and abandoned the Rasbora caudimaculata and Rasbora pauciperforata species groups. In addition, Liao et al. [31] described the genera Kottelatia, Brevibora, Rasbosoma, and Trigonopoma, in order to maintain the monophyly of the genus Rasbora. Together with Boraras, Horadandia, Rasbora, Rasboroides, and Trigonostigma, these genera make up the rasborines. [31]. In contrast, Tang et al. [32] considered these new genera as polyphyletic, based on evidence from mitochondrial (cytochrome b (Cyt b) and cytochrome oxidase I (COI)) and nuclear (recombination activating gene 1 (RAG1), rhodopsine (RHO)) DNA markers, and suggested synonymy of these, as well as of Boraras and Trigonostigma, with Rasbora. In addition, the groups suggested by Liao et al. [31] are poorly supported by Sholihah et al. [27] using the DNA barcode marker COI and therefore calling for a broader assessment of the monophyly of the different Rasbora groups. Thus, the taxonomic composition of Rasbora remains poorly understood, and partially uncertain.
Confronted with the difficulties to readily identify the rasborine specimens of the Mesangat wetlands, we compared traditional morphology-based identifications with species delimitation approaches that apply k-mean learning algorithm for both morphometric data and DNA barcoding. The clustering approach was applied to aid in solving discrepancies between morphological and genetic identification, and to estimate the number of rasborine species entities of the Mesangat wetlands.

2. Materials and Methods

2.1. Sampling Design

The sample consisted of 946 rasborines, collected at 16 sampling sites during a survey in the Mesangat wetlands in September 2014 (Table 1). Maps of the region are available in Staniewicz et al. [7] as well as in Sudrajat and Saleh [8]. Methods applied included dip- and gill-netting, beach-seining, fish-trapping, and electrofishing. Fishes were euthanized with chlorobutanol, and fixed directly in 80% ethanol or 4% formaldehyde, when tissue samples were taken separately. Vouchers were stored in the collection of the Zoologisches Forschungsmuseum Alexander Koenig (ZFMK), Bonn, Germany, and in the collection of the Museum Zoologicum Bogoriense (MZB), Bogor, Indonesia.

2.2. Material Examined

Rasbora cf. hubbsi: MZB 25541-25692; ZFMK 68393-68394, 68397, 68418, 68421, 68426, 68429, 68433-68435, 124585-124853
Rasbora rutteni: MZB 25693-25694; ZFMK 68390-68392, 68405-68407, 68415, 68417, 68425, 68432, 124854-124855
Rasbora trilineata: MZB 25695-25701; ZFMK 68386-68389, 68395-68396, 68399-68402, 124856-124857
Rasbora vaillantii: MZB 25702-25888; ZFMK 68398, 68403-68404, 68419-68420, 68422-68424, 68427-68428, 124858-125098
Trigonopoma sp.: MZB 25889-25895; ZFMK 68408-68414, 68416, 68430-68431, 125099-125125

2.3. Classical Species Determination

Character examination and species determination followed Brittan [29], Inger and Chin [33], Kottelat et al. [34], Weber and de Beaufort [35], and recent species descriptions (e.g., Britz and Hui [36]; Hui and Kottelat [37], and Lumbantobing [26,38]). Measurements were taken from point to point using a dial calliper to the nearest 0.1 mm. Whenever determination was uncertain, this was indicated with ‘cf.’ [39]. The taxonomy follows Fricke et al. (2020) [40].

2.4. DNA Barcoding

Genomic DNA from four to ten specimens of each species identified by classical determination was extracted from fin clips using Macherey and Nagel NucleoSpin® Tissue kits following the manufacturer’s protocol on an Eppendorf EpMotion® pipetting-roboter with vacuum manifold. The standard vertebrate DNA barcode region of the COI (cytochrome c oxidase subunit 1) was amplified using a M13 tailed primer cocktail including FishF2_t1 (5′TGTAAAACGACGGCCAGTCGACTAATCATAAAGATATCGGCAC), FishR2_t1 5′CAGGAAACAGCTATGACACTTCAGGGTGACCGAAGAATCAGAA), VF2_t1 (5′TGTAAAACGACGGCCAGTCAACCAACCACAAAGACATTGGCAC) and FR1d_t1 (5′CAGGAAACAGCTATGACACCTCAGGGTGTCCGAARAAYCARAA) [41]. PCR were performed using Qiagen Multiplex® taq as follows: 15 min at 95 °C; 10 cycles of 35 s at 94 °C, 90 s at 52–49 °C (‘touch-down’) and 90 s at 72 °C followed by 25 cycles of 35 s at 94 °C, 90 s at 55 °C and 90 s at 72 °C with final elongation for 10 min at 72 °C and hold at 10 °C. Sequencing of the ExoSAP-IT (USB) purified PCR product in both directions was conducted at Macrogen Europe Laboratories with forward sequencing primer M13F (5′ GTAAAACGACGGCCAGT) and reverse sequencing primer M13R-pUC (5′ CAGGAAACAGCTATGAC).
In total, 43 new DNA barcodes have been generated and are available in NCBI GenBank under accession numbers MW417152–MW417194. In addition, we included 101 DNA sequences from NCBI GenBank representing 31 additional Rasbora and Trigonopoma species from the broader geographic and taxonomic region of interest. As outgroup taxon to root the phylogenetic tree we chose to include two Danio rerio specimens (JQ667529 and JQ667530). Although there are several hundred DNA barcodes available on NCBI GenBank that are labelled as Rasbora spp., we included only available sequences of those species occurring in the Mahakam drainage and those belonging to the corresponding ‘species groups’ by Liao et al. [31] of the a priori identified species. Data processing and sequence assembly was done with the software Geneious Pro and the Muscle algorithm used to align the DNA barcodes after manually screening for unexpected indels or stop codons [42,43]. Modeltest implemented in the MEGA 6 software was used to determine the most appropriate sequence evolution model for the given data, removing missing data with the complete deletion option [44,45]. The model with the lowest BIC scores (Bayesian information criterion) was considered to best describe the substitution pattern. According to Modeltest, the Hasegawa–Kishino–Yano model (HKY) distinguishing between the rate of transitions and transversions and allowing for unequal base frequencies best explained the resulting multiple sequence alignment [46]. A discrete Gamma distribution was applied to model rate differences among sites with five categories (+G, parameter = 0.9407) and invariable ((+I), 54.3558%) sites were allowed. All codon positions were included and positions with less than 95% site coverage were eliminated resulting in a total of 573 analysed positions in the final dataset. We generated neighbour-joining, and maximum-likelihood (ML) phylogenetic trees with 1000 bootstrap replicates to explore the phylogenetic affinities of the mitochondrial lineages [47]. The Species Delimitation Plugin for Geneious Pro was used for summarizing measures of genetic K2P distances to provide readily comparable data with other studies using this standard DNA barcoding approach [42,48]. In addition, we used the reconstructed ML-based hypothesis of the mitochondrial relationships as input for a species delimitation approach using Poisson tree processes (PTP) and the refined multi-rate PTP (mPTP) version [49,50,51]. In both versions, the aim is to find a group delimitation that maximizes the likelihood of the partition of branch lengths, in PTP using a uniform evolutionary rate (lambda) and assuming different rates for each group (species) in the newer mPTP model. The null model assumes no delimitation with all tips of the tree belonging to a single species. In PTP a p-value test decides, whether to keep the null model or reject it and use the maximum likelihood delimitation instead. Since mPTP compares models with different numbers of parameters (separate lambdas for each species), the p-value test cannot be applied and instead the Akaike information criterion is used to decide which number of groups best fits the given topology and branch lengths. In theory, this approach avoids over-splitting into too many groups [49].

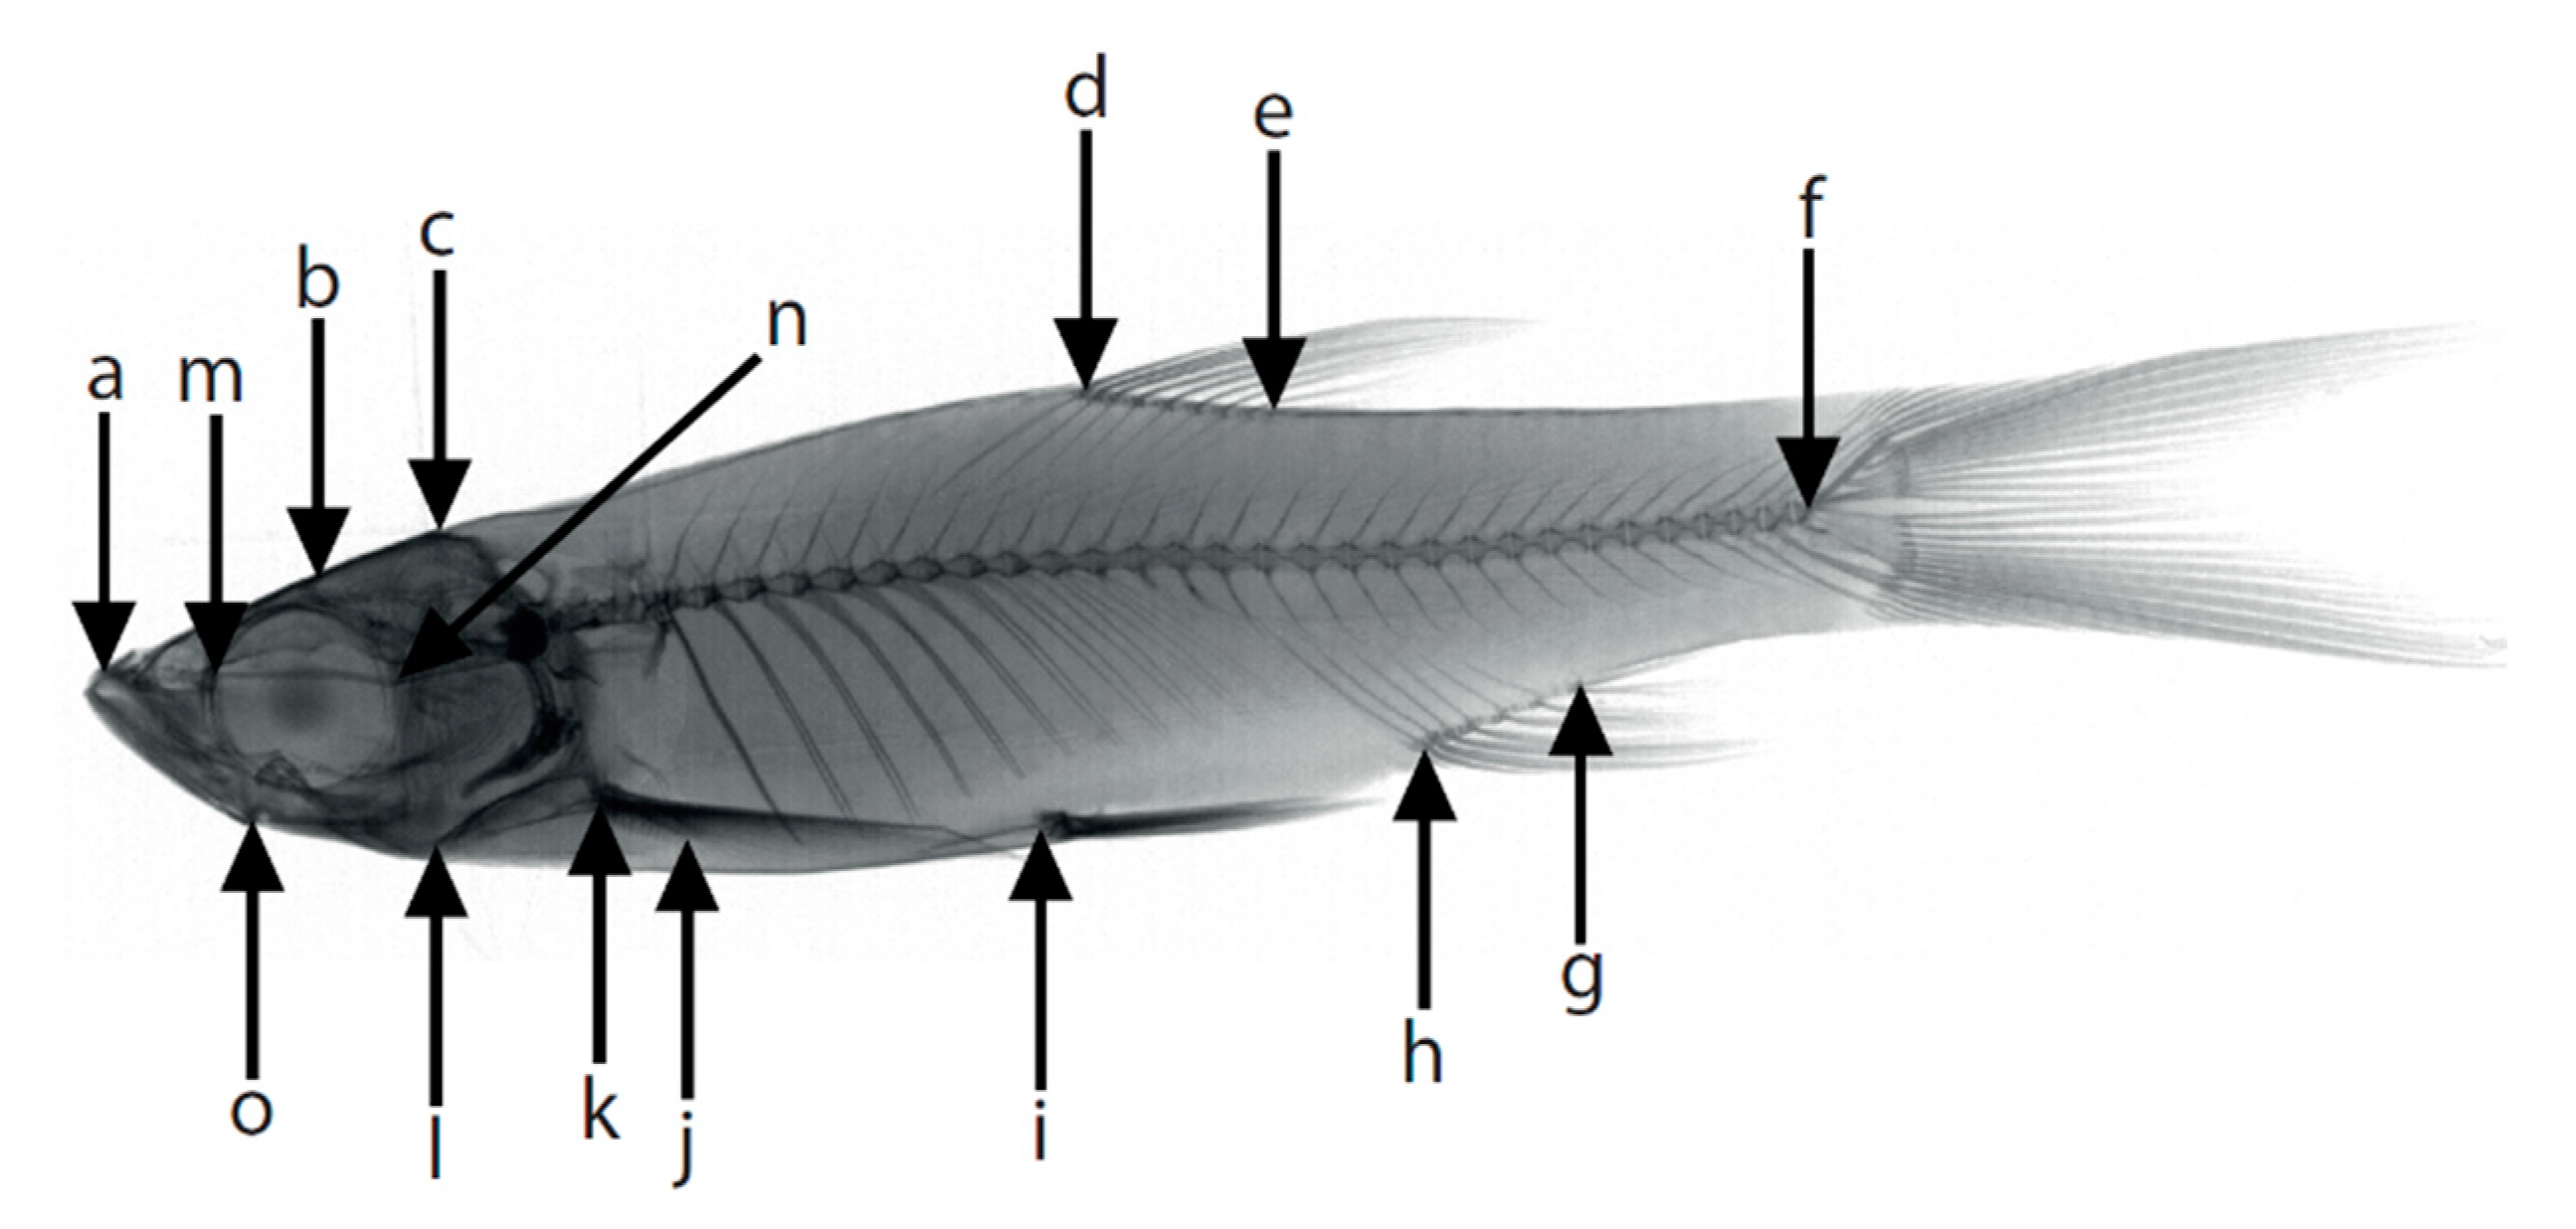
2.5. Morphometric Analysis

For the morphometric analysis, only adult, perfectly fixated, and most straight specimen in a comparable number per species identified by classical determination was chosen. Thus, 159 appropriate specimens were included in the geometric morphometric analysis (Trigonopoma sp. (n = 38), Rasbora cf. hubbsi (n = 49), R. rutteni (n = 13), R. trilineata (n = 16), and R. vaillantii (n = 40)). Radiographs were made in a plane position using a Faxitron LX-60 Cabinet X-ray System. Fifteen homologous landmarks (Figure 1) were placed on each specimen using TPSdig v 2.22 following the criteria of Zelditch et al. [52,53]. Outliers were identified using the Find outliers… function in MorphoJ v. 1.06d [54]. A generalized least squares Procrustes superimposition (GLS) was applied on the raw landmark data in MorphoJ v. 1.06d [54]. Pooled regressions within species were computed between GLS results and the respective log centroid size to reduce the effect of allometric growth using MorphoJ v. 1.06d [54,55]. A principal component analysis (PCA) was run in MorphoJ v. 1.06d with the residuals of the correlation to detect interspecific shape differences. Principal components (PC) describing a total variation > 5.0% were tested for significance using a one-way analysis of variance (ANOVA) and Tukey´s pairwise post-hoc test in PAST v. 3.09 [54,56].
To determine the number of clusters within the size-corrected landmark data, a k-mean cluster analysis including all PCs describing >99.0% of the cumulative variance was computed using the find.clusters function of the ‘adegenet’ package in R v. 3.2.2 [57,58,59,60]. The best-supported model corresponded to the lowest Bayesian information criterion (BIC) score [59]. To calculate the membership probability of individuals to the clusters, we used a discriminant analysis of principal components (DAPC). The DAPC was computed with all PCs describing >99.0% of the cumulative variance using the dapc function of the ‘adegenet’ package [57,58,59,60].

3. Results

3.1. Classical Species Determination
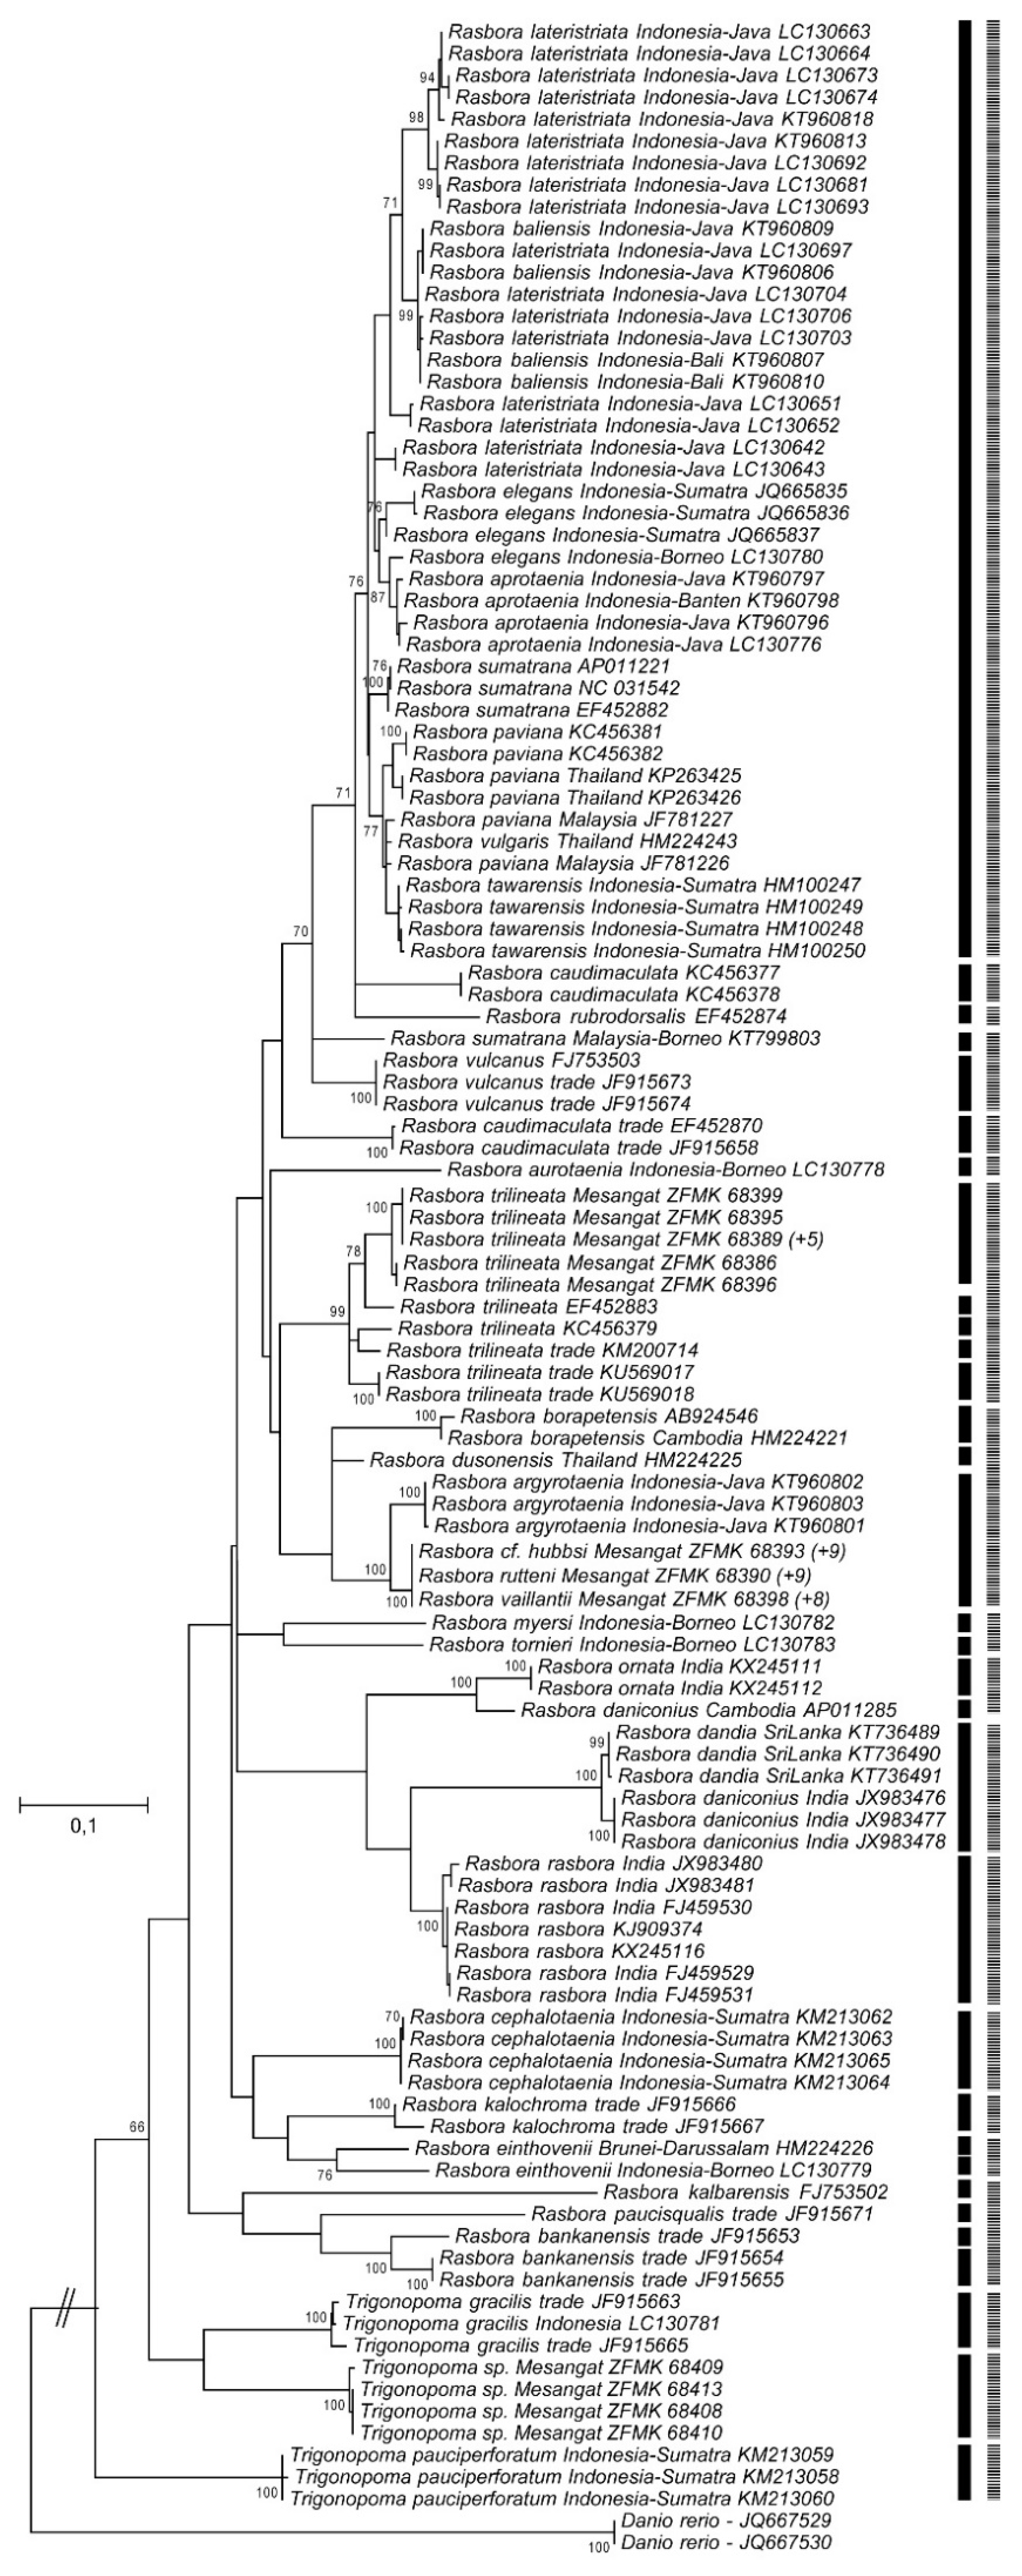
The classical identification of the collected rasborines resulted in five species: Trigonopoma sp., Rasbora cf. hubbsi Brittan, 1954, R. rutteni Weber and de Beaufort, 1916, R. trilineata Steindachner, 1870, and R. vaillantii Popta, 1905. A characteristic for Trigonopoma sp. is the narrow lateral stripe beginning at the posterior margin of the eye (versus the wide stripe in T. gracile (Kottelat, 1991)), the absence of pigments between the pectoral- and anal-fin base (versus present in T. gracile), a black lateral stripe in life (versus red in life in T. pauciferatum (Weber and de Beaufort, 1916)), which reaches to the end of the median caudal-fin rays (versus to the caudal-fin base only in T. pauciperforatum), and red membranes of dorsal and caudal fin (versus hyaline in T. gracile and T. pauciperforatum) [24,29,34,61,62]. Rasbora cf. hubbsi differs from the nominal species in having a faded dark edge along the caudal fin (versus hyaline in R. hubbsi), occasional ½4/1/2½ scales along the transverse line (versus ½4/1/3½ in R. hubbsi), and an occasionally yellow coloration on dorsal and/or anal fin (vs. hyaline in R. hubbsi) (Table 2) [29,34]. Within the present sample R. cf. hubbsi (431 specimens) and R. vaillantii (438) were the dominant species, whereas Trigonopoma sp. (44), R. rutteni (14), and R. trilineata (19) were rather rare.

3.2. DNA Barcoding

Analyses of the COI barcode region distinguish only three genetic clusters among 43 Mesangat rasborines, taken from all the five morphological species groups (Figure 2). Specimens identified as Rasbora trilineata and Trigonopoma sp. form a respectively distinct clade, and both show significant evolutionary distances to the rasborine species included in our analysis and available from GenBank: R. trilineata differs by a nearest neighbour distance (NND) of 4.2% K2P from the Rasbora trilineata specimen with GenBank accession EF452883 used in the study of Mayden et al. [63] (Figure 2) and Trigonopoma sp. from the Mesangat area differs by a NND of 15.9% K2P from Trigonopoma gracilis (Figure 2). One third of the mitochondrial clades is comprised of specimens identified as R. cf. hubbsi, R. rutteni, and R. vaillantii, with no pattern pointing towards species distinction (Figure 2). With 3.4% K2P NND, the complex is in our analysis closest to specimens of Rasbora argyrotaenia from Java. The model-based species delimitation approaches delivered two different estimates for the total species number present in the data: PTP detected 33 entities (p = 0.001, null-model score: 309.844573, best score for single coalescent rate: 376.530240), mPTP a total of 19 putative species (null-model score: 309.844573, best score for multi coalescent rate: 309.844573) (Figure 2). Concerning the Mesangat rasborines, PTP groups all R. trilineata into one unit (and the remaining ones into four), Trigonopoma sp. into one, and, as expected, R. cf. hubbsi, R. rutteni, and R. vaillantii together into one entity. With respect to the focus group, the mPTP outcome differs in that all included R. trilineata are grouped into one species, and that the unit with R. cf. hubbsi, R. rutteni, and R. vaillantii now also contains R. borapetensis, R. dusonensis, and R. argyrotaenia.

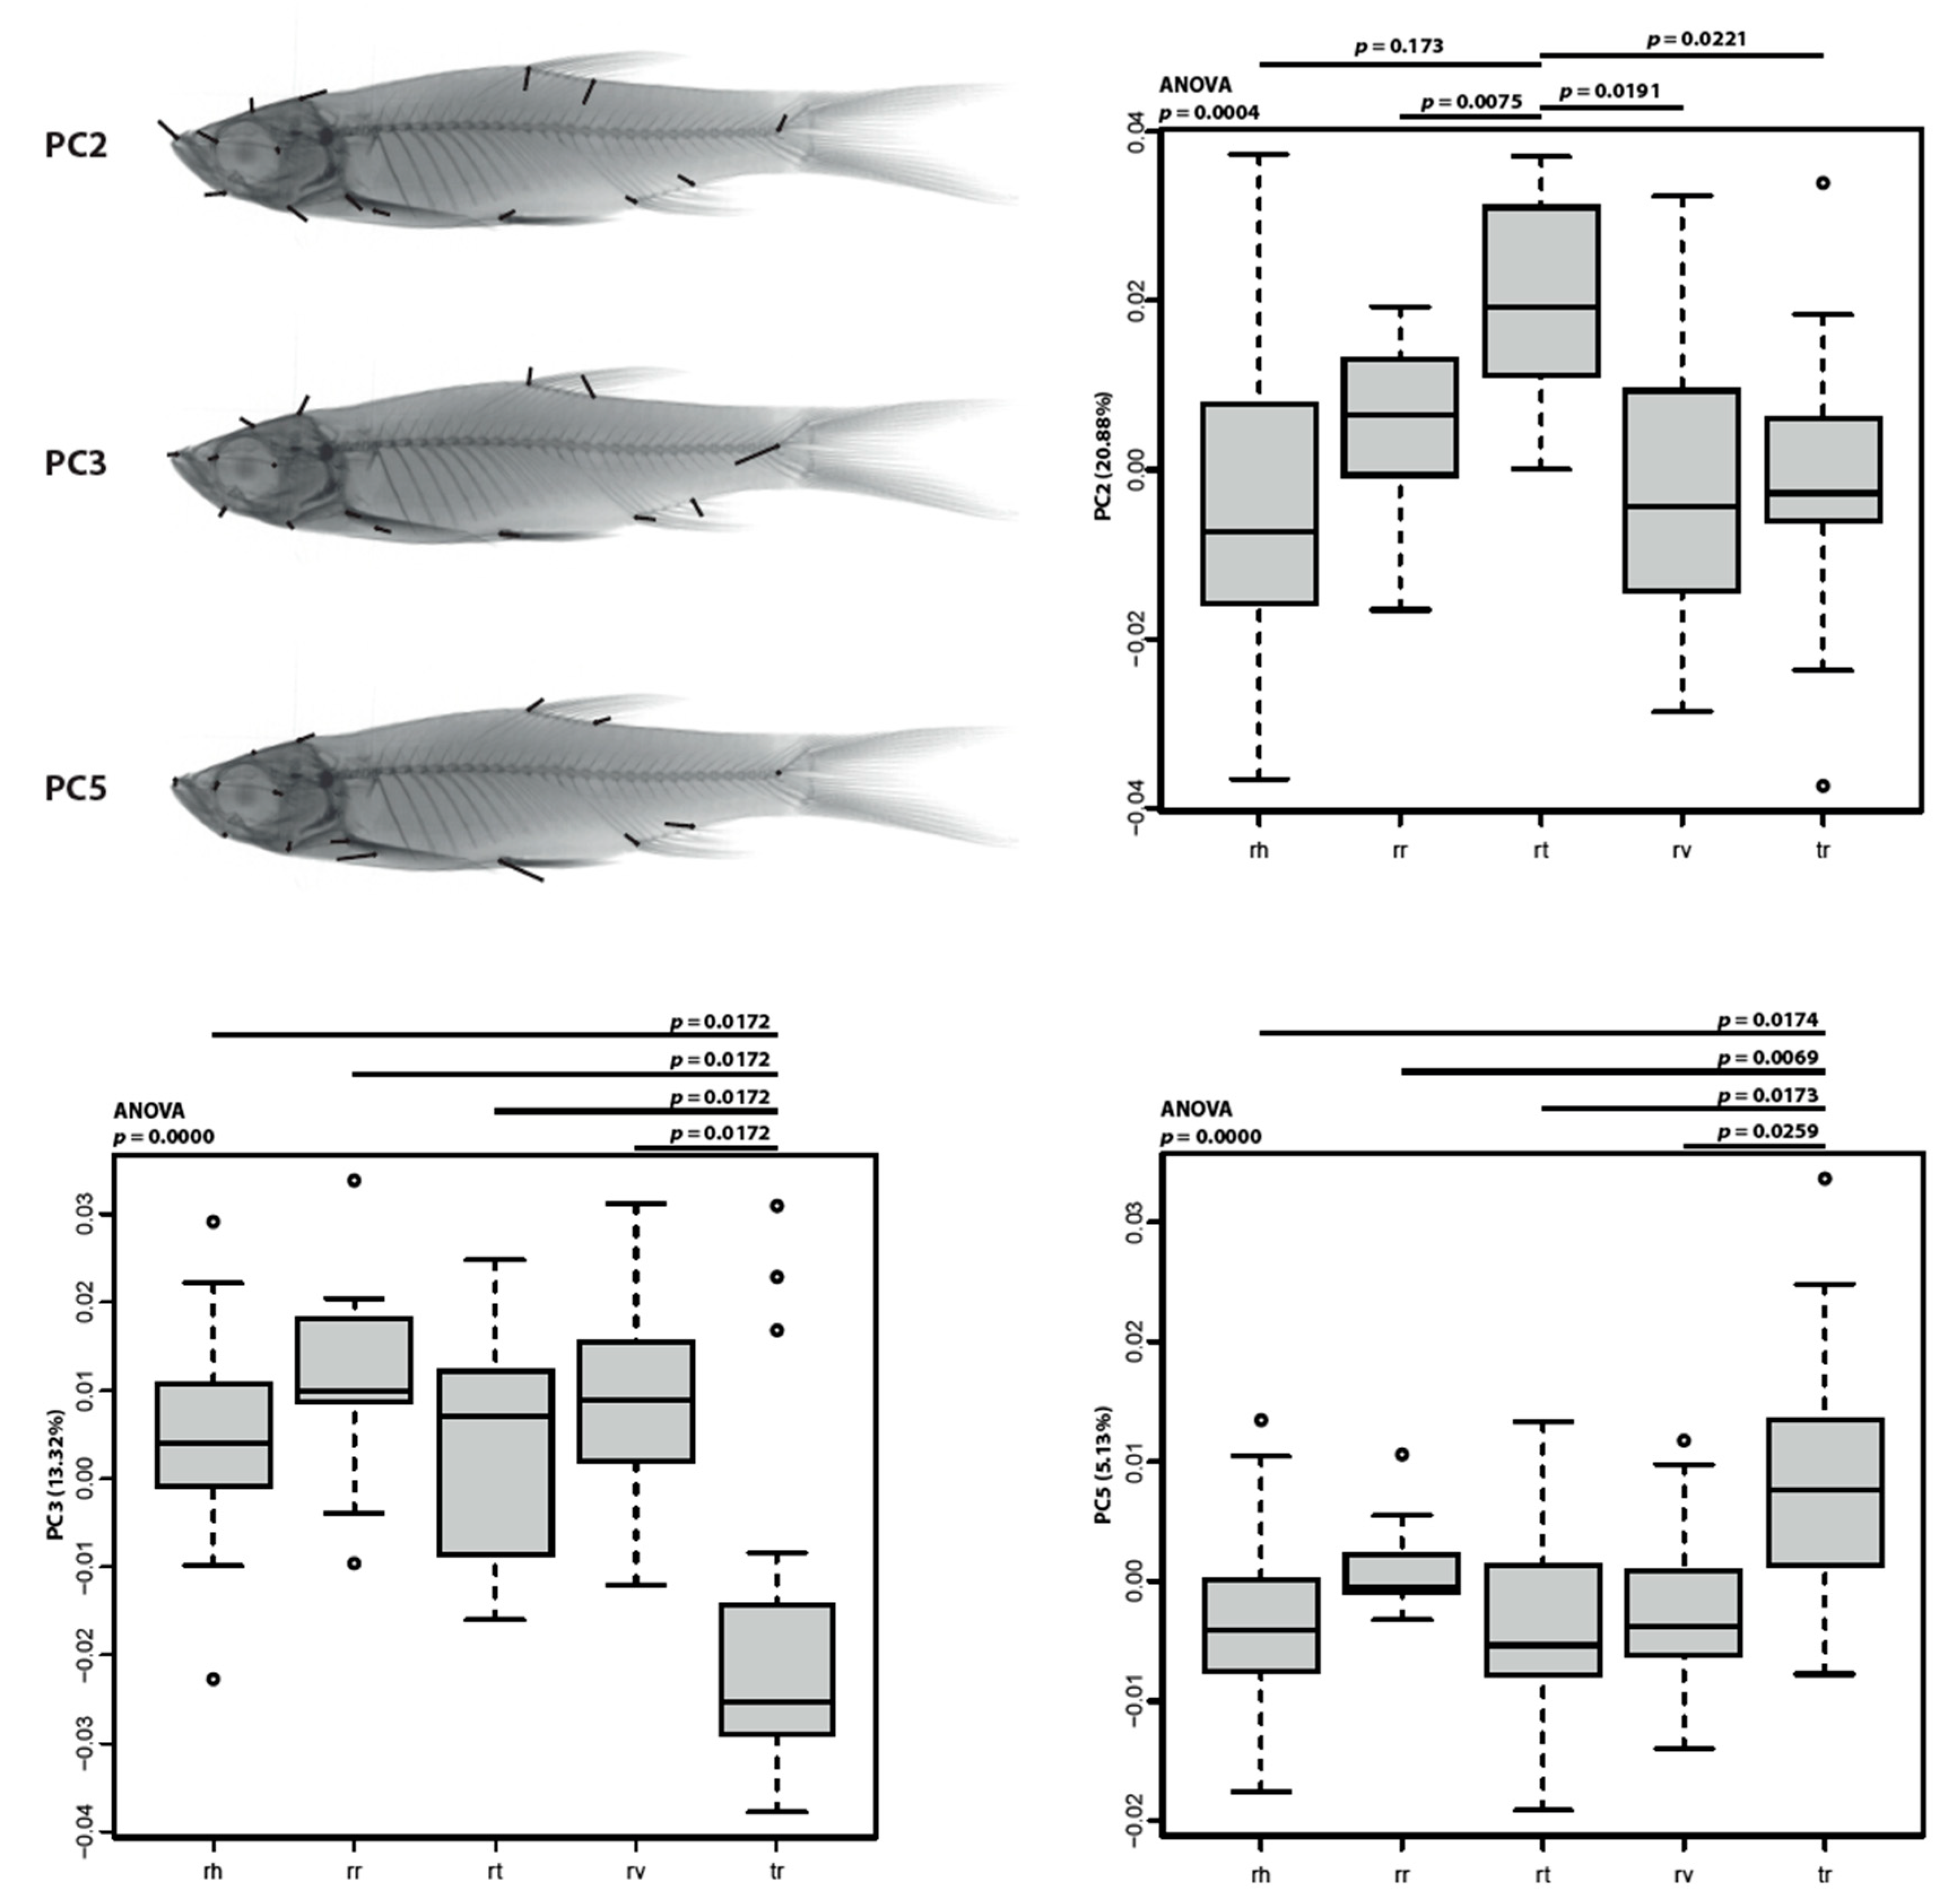
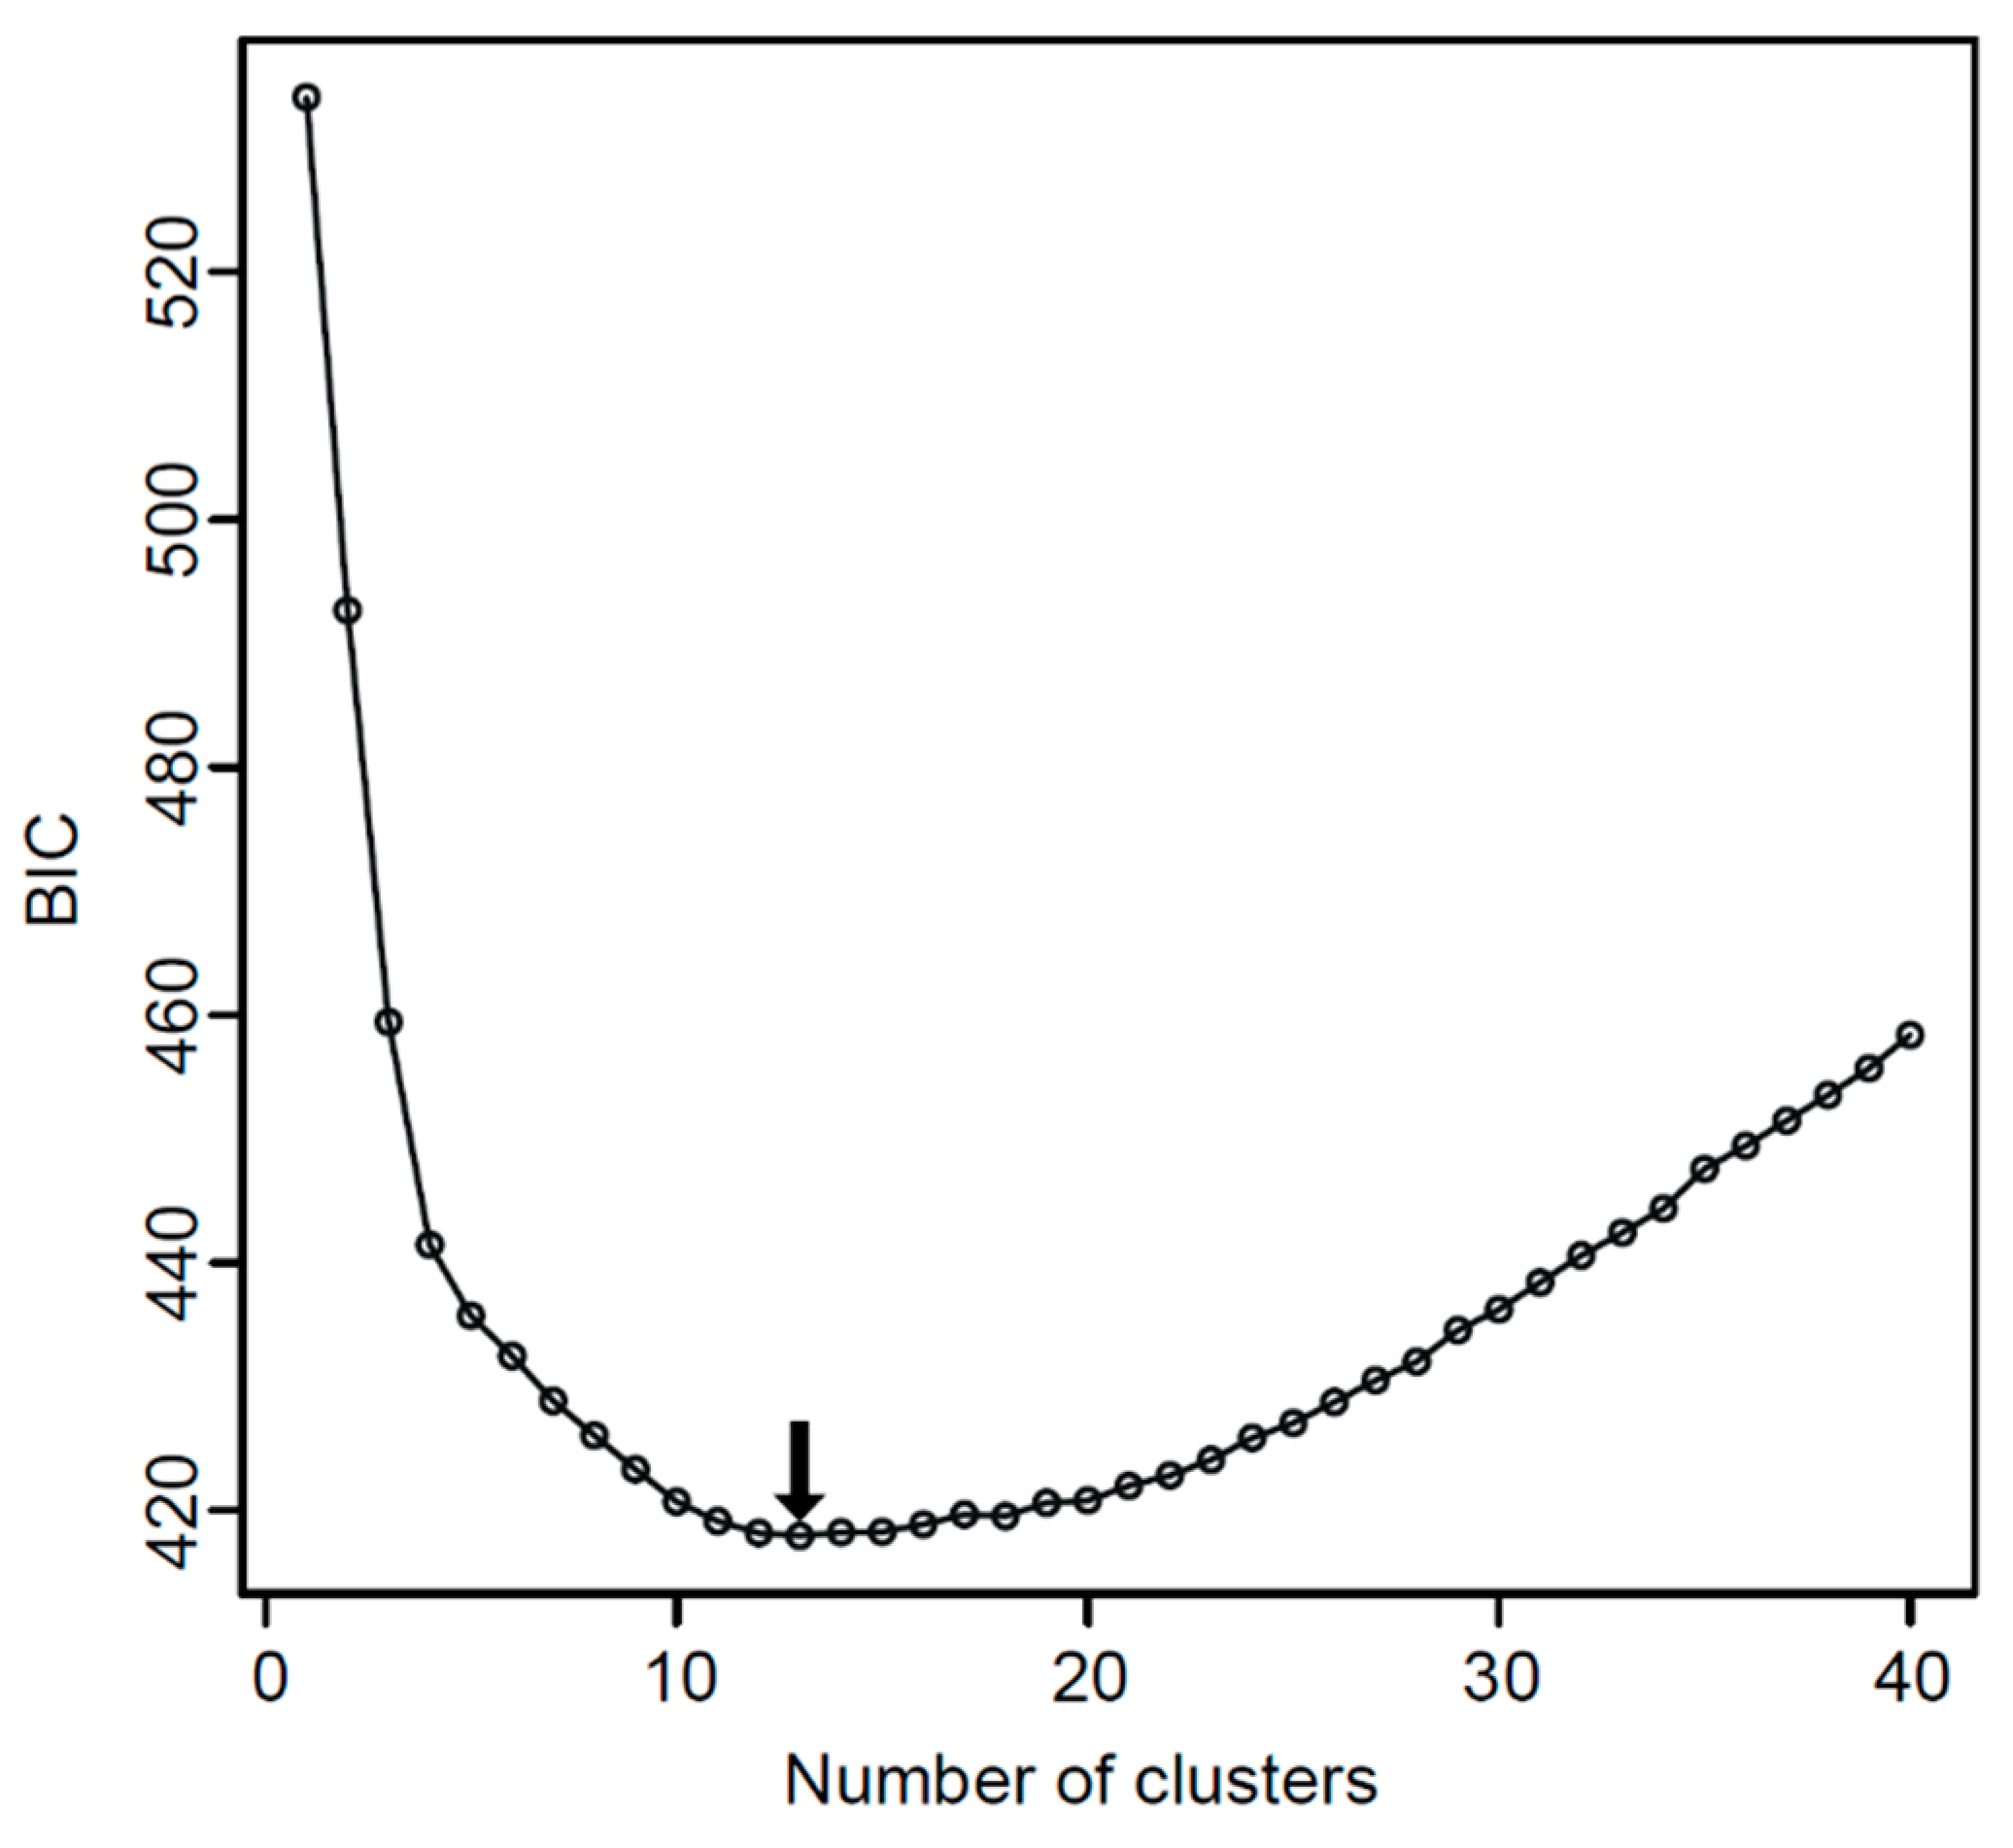
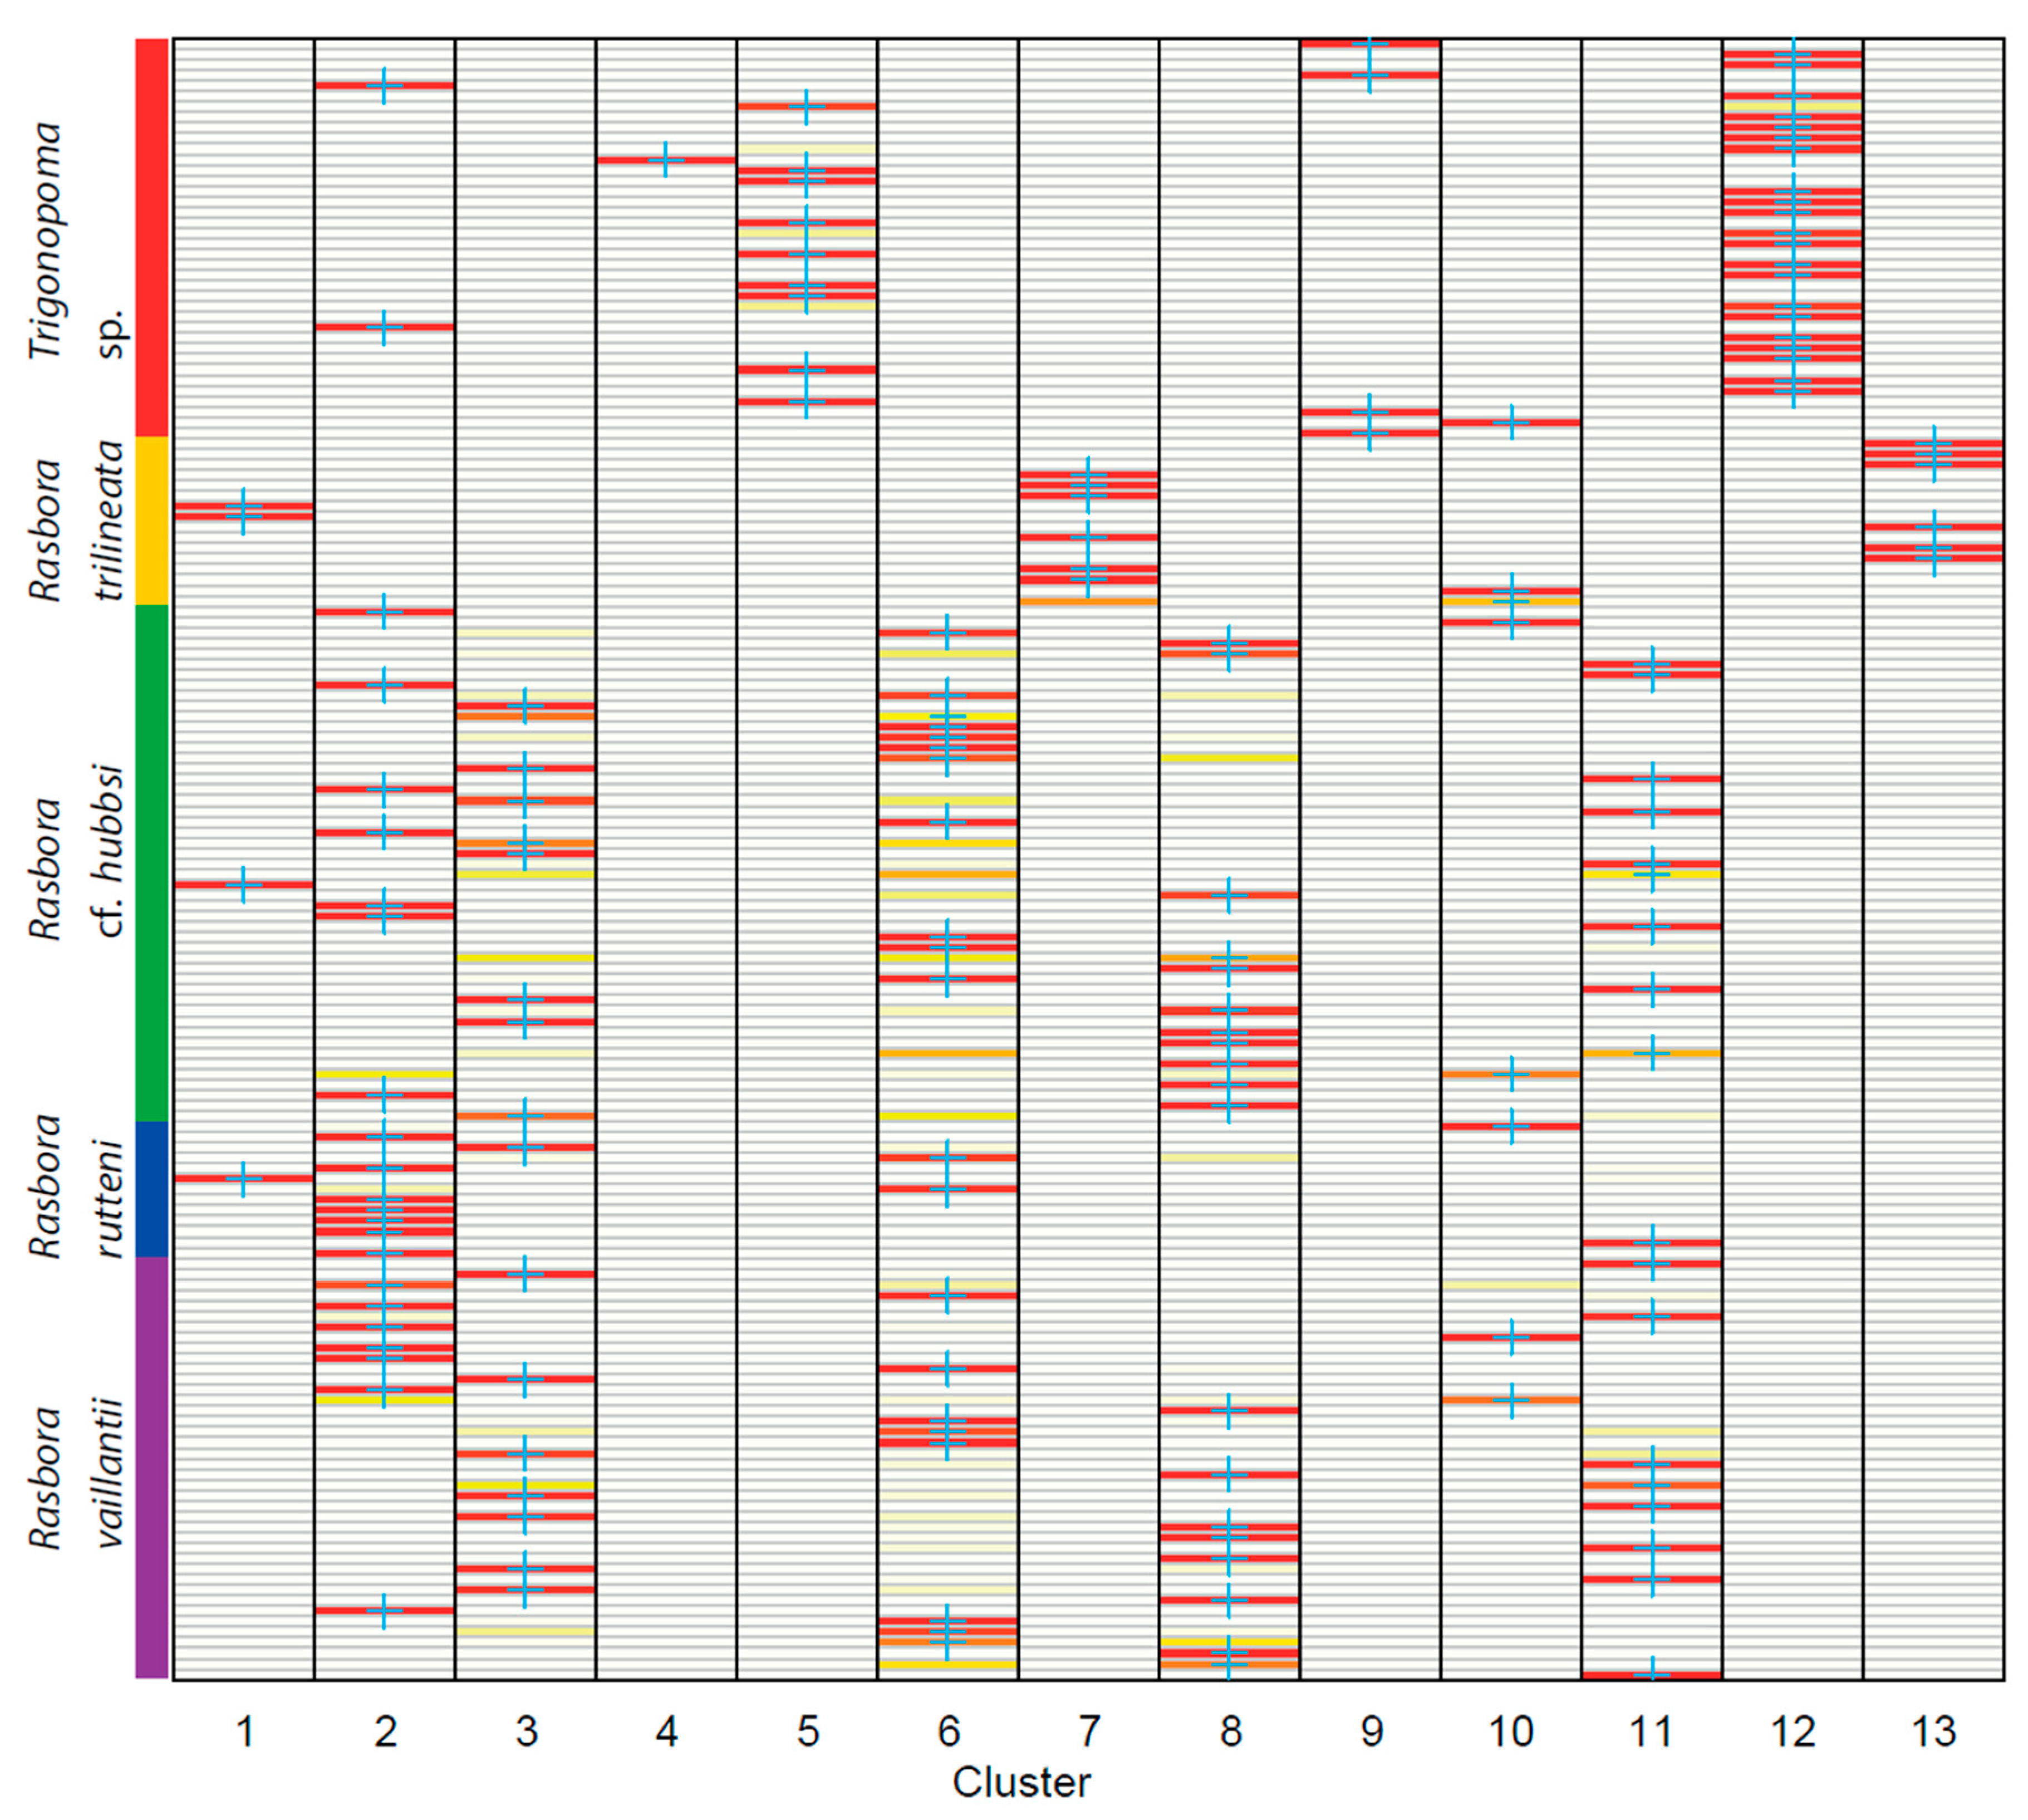
3.3. Morphometric Analysis

The PCA differentiates Trigonopoma sp. (n = 38) and Rasbora trilineata (n = 16) from other species (Figure 3). There are no significant differences between R. cf. hubbsi (n = 49), R. rutteni (n = 13), and R. vaillantii (n = 40). The first PC (35.53%) reflects a bending bias, and the deviation from averaged shape in PC4 (6.77%) reveals no significant differences in the Tukey´s pairwise post-hoc test. Thus, PC1 and PC4 are not considered in further results. The second PC (20.88%) differentiates R. trilineata from all other species by having a relatively larger head as well as a more slender body (Figure 3). According to PC3 (13.32%) and PC5 (5.13%), Trigonopoma sp. can be distinguished from the four Rasbora in having a relatively smaller head and a shorter, slender caudal peduncle (PC3) as well as in having a larger distance between the pectoral- and pelvic-fin bases (PC5) (Figure 3).
In contrast, the k-mean clustering resulted in 13 groups as the most likely division of the sample according to the BIC score (Figure 4). This divides Trigonopoma sp. into six clusters (Figure 5), whereby 35 out of 38 specimens are spread over four clusters only represented by that species. The remaining three individuals are separated into two clusters. One is shared with R. cf. hubbsi, R. rutteni, and R. vaillantii. The second is shared with the former three species and T. trilineata. The assignment probabilities for single specimens of that species range from 87.0 to 100.0% (98.84 ± 3.17%) to its allocated cluster. Rasbora trilineata is split into four clusters (Figure 5). Twelve out of 16 specimens build two groups consisting of six specimens from only that species, respectively. Additional two specimens are assigned to two other clusters. One cluster is shared with R. cf. hubbsi and the other is shared with all species included in that analysis. The assignment probability for all specimens of R. trilineata to its assigned cluster is 100.0%, except for one single individual with 43.92% (96.49 ± 13.57%). Specimens from R. cf. hubbsi are spread over seven clusters (Figure 5). All these clusters are shared with other species (six clusters with R. rutteni, five clusters with R. vaillantii, two clusters with R. trilineata, and two clusters with Trigonopoma sp.). The assignment probability of specimens from R. cf. hubbsi is the lowest among the a priori-defined species (90.40 ± 17.63%). Rasbora rutteni is divided into six clusters (Figure 5). All clusters are shared with specimens from R. cf. hubbsi. Among these clusters four clusters are shared with R. vaillantii, two with Trigonopoma sp. and two with R. trilineata. The assignment probability ranges from 88.23 to 100.00% (97.34 ± 3.56%) for single specimens of R. cf. hubbsi. Specimens of predefined R. vaillantii are split into six clusters (Figure 5). All these clusters are shared with R. cf. hubbsi followed by five clusters shared with R. rutteni. A further two clusters are shared with Trigonopoma sp. and one cluster with R. trilineata. The assignment probability for individuals of R. vaillantii ranges from 64.91 to 100.00% (93.96 ± 9.60%).

4. Discussion

Based on the traditional identification, five rasborines (Trigonopoma sp., Rasbora cf. hubbsi, R. rutteni, R. trilineata, and R. vaillantii) are present in the Mesangat wetlands. Trigonopoma sp., R. cf. hubbsi, and R. rutteni are first records for the Mahakam River drainages. The differentiation of R. cf. hubbsi from the nominal species is based on caudal fin coloration (faded dark edge along the caudal-fin and yellowish vs. hyaline) and transverse scale count (½4/1/2½ vs. ½4/1/3½). Further morphological and/or genetic investigations including type or topotypic material of R. hubbsi are necessary to clarify its taxonomic status. Trigonopoma sp. is probably a new species differing from its congeners in coloration (reddish fins vs. hyaline fins) and the lateral stripe (broader in T. gracile; extending to median caudal-fin rays vs. ending at caudal-fin base in T. pauciperforatum) (Figure 6) [24,29,34,61,62]. In addition, Trigonopoma sp. shows a substantial mitochondrial genetic distance to the other two Trigonopoma species (Figure 2). The identity of R. trilineata is supported by the traditional identification and its close molecular distance to other R. trilineata of unknown origin (e.g., material from Mayden et al. [63]). Although R. cf. hubbsi, R. rutteni, and R. vaillantii can be distinguished by morphology (Table 2), these species share the same COI haplotype (Figure 2). In addition, a canonical variate analysisbased on the geometric morphometric data including the three species supported caudal peduncle length and dorsohypural distance as suitable characters for discrimination, but also detected differences in head shape and pectoral fin position (Result S1). Possible explanations for the incongruence between morphological and genetic assignment are: (i) lacking taxonomic resolution of the DNA barcoding marker due to recent speciation (e.g., Ward [64]), (ii) hybridization leading to the admixture of mtDNA haplotypes (e.g., Herder et al. [65] and April et al. [66]), and (iii) the individuals identified here as R. cf. hubbsi, R. rutteni, and R. vaillantii are conspecific and show strong variation within the population of the Mesangat wetlands. This implies that the validity of all three taxa needs to be verified by analyzing specimens from the respective type localities, which are in reasonable distance to the Mesangat wetlands: Rivulet near Bontang, East Kalimantan, East Borneo (approx. 95 km) (R. rutteni) [35], Boh River, East Kalimantan, East Borneo (approx. 185 km) (R. vaillantii) [17], and Lahad Datu River, Sabah, North Borneo (approx. 540 km) (R. hubbsi) [29].
The k-mean clustering is a tool commonly used for objectively finding subsets [67,68]. The number of clusters revealed by k-mean is hypothetical and might be far from the real number [59,69]. Given the way lower species numbers are estimated by traditional species discrimination and genetic analyses, the number of clusters resulting from the k-mean approach detected here (Figure 4) appears a clear case of over-splitting. It suggests that k-mean clustering might be inappropriate for distinguishing very similar species based on morphometric data—in contrast to its suitability for genetic data (e.g., Gasch and Eisen [70], Kapil et al. [68], and Wu et al. [71]).
No shape differences caused by sex or size between clusters were detected during a careful examination of vouchers by the authors. Thus, there are no indications that signal of e.g., sex or size, might affect DAPC-groups. The unclear discrimination of clusters by a DAPC rather points to possible admixture or to possible limitations of this method to barely differentiated morphometric data [59].
In general, distinguishing rasborine diversity is not a simple task; traditional determination, DNA barcoding, and recent morphometric approaches provide conflicting estimates of potential species entities. The “true” number of rasborine species inhabiting the Mesangat wetlands hence remains unclear. Until additional data or more appropriate methods are available, we keep the results of the traditional identification approach as proof for the presence of five rasborine species in the Mesangat wetlands. We are aware, that the subtle differences distinguishing R. cf. hubbsi, R. rutteni, and R. vaillantii in their descriptions (Table 2), might be based on extreme phenotypes of the same species or result from a recent, radiating species complex—issues that require additional systematic work.

Supplementary Materials

The following are available online at https://0-www-mdpi-com.brum.beds.ac.uk/1424-2818/13/1/8/s1, Result S1: Scores and results (scatter plot, deformation grid, one-way ANOVA, Tukey´s pairwise post-hoc test, and boxplot) from the canonical variate analysis detecting differences between Rasbora cf. hubbsi, R. rutteni, and R. vaillantii.

Author Contributions

Methodology, M.F.G. and S.H.; formal analysis, S.H. and C.M.; investigation, C.M. and G.W.; writing—original draft preparation, M.F.G., F.H. and S.H.; writing—review and editing, M.F.G., R.K.H., F.H. and T.Z.; supervision, R.K.H., F.H. and T.Z. All authors have read and agreed to the published version of the manuscript.

Funding

Fieldwork was funded by the European Association of Aquarium Curators (EUAC), the Zoological Society for the Conservation of Species and Population (ZGAP), and the Alexander Koenig Stiftung (AKS).

Institutional Review Board Statement

Not applicable.

Informed Consent Statement

Not applicable.

Data Availability Statement

The data presented in this study are available on request from the corresponding author. The data are not publicly available due to privacy.

Acknowledgments

We are grateful to YASIWA (especially to Kahang Aran, Monica Kusneti, Sandra Schaefer, Suimah, and Ingan Njuk), a local conservation agency managing the Mesangat wetlands, Yayat Priatna from the Ichthyology Laboratory, Division of Zoology, Research Centre for Biology, Indonesian Institute of Science (LIPI) in Cibinong, Indonesia, and the local fishermen from the Muara Ancalong district (especially to Pak Yus) in East Kalimantan, Indonesia, for assistance in the field. We thank the Kementerian Riset dan Teknologi (RISTEK) in Jakarta, Indonesia, for the permit to the first author (295/SIP/FRP/SM/IX/2014).

Conflicts of Interest

The authors declare no conflict of interest.

References

  1. Myers, N.; Mittermeier, R.A.; Mittermeier, C.G.; da Fronseca, G.A.B.; Kent, J. Biodiversity hotspots and conservation priorities. Nature 2000, 403, 853–858. [Google Scholar] [CrossRef] [PubMed]
  2. Hubert, N.; Kadarusman; Wibowo, A.; Busson, F.; Caruso, D.; Sulandari, S.; Nafiqoh, N.; Pouyaud, L.; Rüber, L.; Avarre, J.-V.; et al. DNA barcoding indonesian freshwater fishes: Challenges and prospects. DNA Barcodes 2015, 3, 144–169. [Google Scholar]
  3. Decru, E.; Moelants, T.; de Gelas, K.; Vreven, E.; Verheyen, E.; Snoeks, J. Taxonomic challenges in freshwater fishes: A mismatch between morphology and DNA barcoding in fish of the north-eastern part of the Congo basin. Mol. Ecol. Resour. 2015, 16, 342–352. [Google Scholar] [CrossRef] [PubMed]
  4. Chapin, S.F.; Zavaleta, E.S.; Eviner, V.T.; Naylor, R.L.; Vitousek, P.M.; Reynolds, H.L.; Hooper, D.U.; Lavorel, S.; Sala, O.E.; Hobbie, S.E.; et al. Consequences of changing biodiversity. Nature 2000, 405, 234–242. [Google Scholar] [CrossRef] [PubMed]
  5. Laurila-Pant, M.; Lehikoinen, A.; Uusitalo, L.; Venesjärvi, R. How to value biodiversity in environmental management? Ecol. Indic. 2015, 55, 1–11. [Google Scholar] [CrossRef] [Green Version]
  6. Lohbeck, M.; Bongers, F.; Martinez-Ramos, M.; Poorter, L. The importance of biodiversity and dominance for multiple ecosystem functions in a human-modified tropical landscape. Ecology 2016, 97, 2772–2779. [Google Scholar] [CrossRef]
  7. Staniewicz, A.; Behler, N.; Dharmasyah, S.; Hones, G. Niche partitioning between juvenile sympatric crocodilians in Mesangat Lake, East Kalimantan, Indonesia. Raffles Bull. Zool. 2018, 66, 528–537. [Google Scholar]
  8. Sudrajat; Saleh, H.A. The potential of Mesangat Lake, East Kutai, Indonesia as an essential ecological area for habitat conservation of critically endangered Crocodylus siamensis. Biodiversitas 2019, 22, 3126–3133. [Google Scholar] [CrossRef]
  9. Stuebing, R.; Sommerlad, R.; Staniewicz, A. Conservation of the Sunda gharial Tomistoma schlegelii in Lake Mesangat, Indonesia. Int. Zoo Yearb. 2015, 49, 137–149. [Google Scholar] [CrossRef]
  10. Wijayanti, A.; Suripto, B.A.; Sancayaningsih, R.P. Bird of mesangat in East Kutai, East Kalimantan. AIP Conf. Proc. 2017, 1813, 1–7. [Google Scholar]
  11. Ahl, E. Einige neue süsswasserfische des indo-malayischen archipels. Ges. Nat. Freunde Berl. 1922, 1992, 30–36. [Google Scholar]
  12. Kottelat, M. The Fishes of the Mahakam River, East Borneo: An example of the limitations of zoogeographic analysis and the need for extensive fish surveys in Indonesia. Trop. Biodivers. 1995, 2, 401–426. [Google Scholar]
  13. Nieuwenhuis, A.W. Die durchquerung borneos durch die niederländische Expedition, 1896–1897. Petermanns Geogr. Mitt. 1898, 44, 9–19. [Google Scholar]
  14. Nieuwenhuis, A.W. Centraal Borneo. Reis von Pontianak naar Samarinda 2; Brill: Leiden, The Netherlands, 1900; pp. 1–520. [Google Scholar]
  15. Nieuwenhuis, A.W. Quer Durch Borneo, Ergebnisse Seiner Reisen in Den Jahren 1894, 1896–1987 und 1898–1900 Band 2; Brill: Leiden, The Netherlands, 1904–1907; pp. 1–340. [Google Scholar]
  16. Popta, C.M.L. Descriptions préliminaires des nouvelles espèces de poissons recueillies au Bornéo central par M. le Dr A.W. Nieuwenhuis en 1898 et en 1900. Notes Leyden Mus. 1904, 24, 179–202. [Google Scholar]
  17. Popta, C.M.L. Suite des descriptions préliminaires des nouvelles espèces de poissons recueillies au Bornéo central par M. le Dr. A. Nieuwenhuis en 1989 et an 1900. Notes Leyden Mus. 1905, 25, 171–186. [Google Scholar]
  18. Popta, C.M.L. Résultats ichthyologique des voyages scientifiques de Monsieur le professeur Dr. A. W. Nieuwenhuis dans le centre de Bornéo (1898 et 1900). Notes Leyden Mus. 1906, 27, 1–304. [Google Scholar]
  19. Vaillant, L.L. Résultats zoologiques de l’expédition scientifique Néerlandaise au Bornéo central. Poissons. Notes Leyden Mus. 1902, 24, 1–166. [Google Scholar]
  20. Christensen, M.S. Investigations on the ecology and fish fauna of the Mahakam River in east Kalimantan (Borneo), Indonesia. Int. Rev. Hydrobiol. 1992, 77, 593–608. [Google Scholar] [CrossRef]
  21. Hadiaty, R.K.; Kottelat, M. Rasbora lacrimula, a new species of cyprinid fish from eastern Borneo (Teleostei: Cyprinidae). Ichthyol. Explor. Freshw. 2009, 20, 105–109. [Google Scholar]
  22. Hadiaty, R.K.; Kottelat, M. Pangio lidi, a new species of loach from eastern Borneo, Indonesia (Teleostei: Cobitidae). Zootaxa 2009, 2171, 65–68. [Google Scholar] [CrossRef]
  23. Kottelat, M. Rasbora rheophila, a new species of fish from northern Borneo (Teleostei: Cyprinidae). Rev. Suisse Zool. 2012, 119, 77–87. [Google Scholar] [CrossRef]
  24. Kottelat, M.; Tan, H.H. Rasbora atranus, a new species of fish from central Borneo (Teleostei: Cyprinidae). Ichthyol. Explor. Freshw. 2011, 22, 215–220. [Google Scholar]
  25. Siebert, D.J.; Richardson, P.J. Rasbora latoclava, a new cyprinid from Kalimantan, Indonesia, and lectotype designation for R. vaillantii. Ichthyol. Explor. Freshw. 1997, 8, 89–95. [Google Scholar]
  26. Lumbantobing, D.N. Four new species of Rasbora of the Sumatrana group (Teleostei: Cyprinidae) from northern Sumatra, Indonesia. Zootaxa 2014, 3764, 1–25. [Google Scholar] [CrossRef] [Green Version]
  27. Sholihah, A.; Delrieu-Trottin, E.; Sukmono, T.; Dahruddin, H.; Risdawati, R.; Elvyra, R.; Wibowo, A.; Kustiati, K.; Busson, F.; Sauri, S.; et al. Disentangling the taxonomy of the subfamily Rasborinae (Cypriniformes, Danionidae) in Sundaland using DNA barcodes. Sci. Rep. 2020, 10, 2818. [Google Scholar] [CrossRef] [Green Version]
  28. Kottelat, M.; Tan, H.H. Rasbora cryptica, a new species of fish from Sarawak, Borneo (Teleostei: Cyprinidae). Ichthyol. Explor. Freshw. 2012, 23, 37–44. [Google Scholar]
  29. Brittan, M.R. A Revision of the Indo-Malayan Fresh-Water Fish Genus Rasbora; Monograph Institute of Science and Technology: Manila, Philippines, 1954; pp. 1–224. [Google Scholar]
  30. Kottelat, M.; Vidthayanon, C. Boraras micros, a new genus and species of minute freshwater fish from Thailand (Teleostei: Cyprinidae). Ichthyol. Explor. Freshw. 1993, 4, 161–176. [Google Scholar]
  31. Liao, T.Y.; Kullander, S.O.; Fang, F. Phylogenetic analysis of the genus Rasbora (Teleostei: Cyprinidae). Zool. Scr. 2011, 39, 155–176. [Google Scholar] [CrossRef]
  32. Tang, K.L.; Agnew, M.K.; Hirt, M.V.; Sado, T.; Schneider, L.M.; Freyhof, J.; Sulaiman, Z.; Swartz, E.; Vidthayanon, C.; Miya, M.; et al. Systematics of the subfamily Danioninae (Teleostei: Cypriniformes: Cyprinidae). Mol. Phylogenet. Evol. 2010, 57, 189–214. [Google Scholar] [CrossRef]
  33. Inger, R.F.; Ching, P.K. The freshwater fishes of North Borneo. Fieldiana Zool. 1962, 45, 1–268. [Google Scholar]
  34. Kottelat, M.; Whitten, A.J.; Kartikasari, S.N.; Wirjoatmodjo, S. Freshwater Fishes of Western Indonesia and Sulawesi, Indonesia; Periplus Editions Ltd.: Hong Kong, China, 1993; pp. 1–259. [Google Scholar]
  35. Weber, M.; de Beaufort, L.F. The fishes of the Indo-Australian Archipelago. III. Ostariophysi: II Cyprinoidea, Apodes, Synbranchi; Brill: Leiden, The Netherlands, 1916; pp. 1–455. [Google Scholar]
  36. Britz, R.; Tan, H.H. Rasbora simonbirchi, a new species of cyprinid fish from Central Kalimantan, Borneo. Ichthyol. Explor. Freshw. 2018, 28, 337–344. [Google Scholar]
  37. Hui, T.H.; Kottelat, M. Rasbora marinae, a new species of cyprinid fish from northwestern Borneo (Teleostei: Danionidae). Raffles Bull. Zool. 2020, 68, 750–758. [Google Scholar]
  38. Lumbantobing, D.N. Four new species of the Rasbora trifasciata-group (Teleostei: Cyprinidae) from Northwestern Sumatra, Indonesia. Copeia 2010, 4, 644–670. [Google Scholar] [CrossRef]
  39. Bengtson, P. Open nomenclature. Palaeontology 1988, 16, 713–719. [Google Scholar]
  40. Fricke, R.; Eschmeyer, W.N.; Van der Laan, R. Eschmeyer’s Catalog of Fishes: Genera, Species. Available online: http://researcharchive.calacademy.org/research/ichthyology/catalog/fishcatmain.asp (accessed on 8 November 2020).
  41. Ivanova, N.V.; Zemlak, T.S.; Hanner, T.H.; Hebert, P.D.N. Universal primer cocktails for fish DNA barcoding. Mol. Ecol. Notes 2007, 7, 544–548. [Google Scholar] [CrossRef]
  42. Kearse, M.; Moir, R.; Wilson, A.; Stones-Havas, S.; Cheung, M.; Sturrock, S.; Buxton, S.; Cooper, A.; Markowitz, S.; Duran, C.; et al. Geneious basic: An integrated and extendable desktop software platform for the organization and analysis of sequence data. Bioinformatics 2012, 28, 1647–1649. [Google Scholar] [CrossRef]
  43. Edgar, R.C. MUSCLE: Multiple sequence alignment with high accuracy and high throughput. Nucleic Acids Res. 2004, 32, 1792–1797. [Google Scholar] [CrossRef] [Green Version]
  44. Posada, D.; Crandall, K.A. Modeltest: Testing the model of DNA substitution. Bioinformatics 1998, 14, 817–818. [Google Scholar] [CrossRef] [Green Version]
  45. Tamura, K.; Stecher, G.; Peterson, D.; Filipski, A.; Kumar, S. Mega 6: Molecular evolutionary genetics analysis version 6.0. Mol. Biol. Evol. 2013, 30, 2725–2729. [Google Scholar] [CrossRef] [Green Version]
  46. Hasegawa, M.; Kishino, H.; Yano, T.J. Dating of the human-ape splitting by a molecular clock of mitochondrial DNA. J. Mol. Evol. 1958, 22, 160–174. [Google Scholar] [CrossRef]
  47. Saitou, N.; Nei, M. The neighbor-joining method: A new method for reconstructing phylogenetic trees. Mol. Biol. Evol. 1987, 4, 406–425. [Google Scholar]
  48. Masters, B.C.; Fan, V.; Ross, H.A. Species delimitation—A geneious plugin for the exploration of species boundaries. Mol. Ecol. Resour. 2011, 11, 154–157. [Google Scholar] [CrossRef] [PubMed]
  49. Kapli, P.; Lutteropp, S.; Zhang, J.; Kobert, K.; Pavlidis, P.; Stamatakis, A.; Flouri, T. Multi-rate poisson tree processes for single-locus species delimitation under Maximum Likelihood and Markov Chain Monte Carlo. Bioinformatics 2017, 33, 1630–1638. [Google Scholar] [CrossRef] [PubMed] [Green Version]
  50. Zhang, J.; Kapli, P.; Pavlidis, P.; Stamatakis, A. A general species delimitation method with applications to phylogenetic placements. Bioinformatics 2013, 29, 2869–2876. [Google Scholar] [CrossRef] [PubMed] [Green Version]
  51. The Exelixis Lab. MPTP. Available online: https://mptp.h-its.org/#/tree (accessed on 5 December 2020).
  52. Rohlf, F.J. TPSDIG2: A Program for Landmark Development and Analysis. Available online: http://life.bio.sunysb.edu/morph/ (accessed on 8 November 2020).
  53. Zelditch, M.L.; Swiderski, D.L.; Sheets, H.D.; Fink, W.L. Geometric Morphometrics for Biologists: A Primer; Elsevier: San Diego, CA, USA, 2004; pp. 1–443. [Google Scholar]
  54. Klingenberg, C.P. MorphoJ: An integrated software package for geometric morphometrics. Mol. Ecol. Resour. 2011, 11, 353–357. [Google Scholar] [CrossRef] [PubMed]
  55. Sidlauskas, B.L.; Mol, J.H.; Vari, R.P. Dealing with allometry in linear and geometric morphometrics: A taxonomic case study in the Leporinus cylindriformis group (Characiformes: Anostomidae) with description of a new species from Suriname. Zool. J. Linn. Soc. 2011, 162, 103–130. [Google Scholar] [CrossRef]
  56. Hammer, Ø.; Harper, D.A.T.; Ryan, P.D. PAST: Paleontological statistics software package for education and data analysis. Palaeontol. Electron. 2001, 4, 1–9. [Google Scholar]
  57. Jombart, T. adegenet: A R package for the multivariate analysis of genetic markers. Bioinformatics 2008, 24, 1403–1405. [Google Scholar] [CrossRef] [Green Version]
  58. Jombart, T.; Ahmed, I. adegenet 1.3-1: New tools for the analysis of genome-wide SNP data. Bioinformatics 2011, 27, 3070–3071. [Google Scholar] [CrossRef] [Green Version]
  59. Jombart, T.; Collins, C. A Tutorial for Discriminant Analysis of Principal Components (DAPC) Using Adegenet 2.0.0. Available online: http://adegenet.r-forge.r-project.org/files/tutorial-dapc.pdf (accessed on 8 November 2020).
  60. R Development Core Team. R: A Language and Environment for Statistical Computing. R Foundation for Statistical Computing, Vienna, Austria. Available online: http://www.R-project.org (accessed on 8 November 2020).
  61. Kottelat, M. Notes on the taxonomy of some Sundaic and Indochinese species of Rasbora, with description of four new species (Pisces: Cyprinidae). Ichthyol. Explor. Freshw. 1991, 2, 177–191. [Google Scholar]
  62. Rainboth, W.J. Fishes of the Combodian Mekong; FAO: Rome, Italy, 1996; pp. 1–265. [Google Scholar]
  63. Mayden, R.L.; Conway, K.W.; Tang, K.; Freyhof, J.; Chamberlain, S.; Haskins, M.; Schneider, L.; Sudkamp, M.; Wood, R.M.; Agnew, M.; et al. Phylogenetic relationships of Danio within the order cypriniformes: A framework for comparative and evolutionary studies of a model species. J. Exp. Zool. B Mol. Dev. Evol. 2007, 308, 642–654. [Google Scholar] [CrossRef] [PubMed]
  64. Ward, R.D. DNA barcode divergence among species and genera of birds and fishes. Mol. Ecol. Resour. 2009, 9, 1077–1085. [Google Scholar] [CrossRef] [PubMed]
  65. Herder, F.; Nolte, A.W.; Pfaender, J.; Schwarzer, J.; Hadiaty, R.K.; Schliewen, U.K. Adaptive radiation and hybridization in Wallace’s Dreamponds: Evidence from sailfin silversides in the Malili Lakes of Sulawesi. Proc. R. Soc. B 2006, 273, 2209–2217. [Google Scholar] [CrossRef] [PubMed]
  66. April, J.; Mayden, R.L.; Hanner, R.H.; Bernatchez, L. Genetic calibration of species diversity among North America’s freshwater fishes. Proc. Natl. Acad. Sci. USA 2011, 108, 10602–10607. [Google Scholar] [CrossRef] [PubMed] [Green Version]
  67. Jombart, T.; Devillard, S.; Balloux, F. Discriminant analysis of principal components: A new method for the analysis of genetically structured populations. BMC Genet. 2010, 11, 94. [Google Scholar] [CrossRef] [Green Version]
  68. Kapil, S.; Chawla, M.; Ansari, M.D. On k-means data clustering algorithm with genetic algorithm. In Proceedings of the Fourth International Conference on Parallel, Distributed and Grid Computing (PDGC), Solan, India, 22–24 December 2016; pp. 202–206. [Google Scholar]
  69. Fraley, C.; Raftery, A.E. How many clusters? Which clustering method? Answers via model-based cluster analysis. Comput. J. 1998, 41, 578–588. [Google Scholar] [CrossRef]
  70. Gasch, A.P.; Eisen, M.B. Exploring the conditional coregulation of yeast gene expression through fuzzy k-means clustering. Genome Biol. 2002, 3, 1–22. [Google Scholar] [CrossRef] [Green Version]
  71. Wu, F.X.; Zhang, W.J.; Kusalik, A.J. A genetic k-means clustering algorithm applied to gene expression data. In Proceedings of the Sixteenth Canadian Conference on Artificial Intelligence, Halifax, NS, Canada, 11–13 June 2003; Xiang, Y., Chaib-draa, B., Eds.; Springer: Heidelberg, Germany, 2003; pp. 520–526. [Google Scholar]
Figure 1. Fifteen homologous landmarks (black arrows) were placed on characteristic points describing the shape of each individual. (a) anterior tip of premaxilla, (b) dorsal neurocranium process, (c) posterior dorsal point of neurocranium, (d) anterior insertion of dorsal fin, (e) posterior insertion of dorsal fin, (f) posterior tip of last vertebrae, (g) posterior insertion of anal fin, (h) anterior insertion of anal fin, (i) anterior insertion of pelvic fin, (j) posterior insertion of pectoral fin, (k) anterior insertion of pectoral fin, (l) preopercular corner, (m) anterior ventral point of eye socket, (n) posterior ventral point of eye socket, and (o) posterior ventral end of articular.
Diversity 13 00008 g001
Figure 2. Maximum Likelihood estimation of the mitochondrial cytochrome oxidase I relationships with bootstrap support values above 65% based on 1000 pseudoreplicates (Hasegawa-Kishino-Yano model, 95% site coverage). For a better readability only up to three specimens per haplotype (i.e., identical COI sequence) have been included in the figure. The solid vertical bar indicates the species delimitation outcome using PTP (33 entities) and the dashed bar the species delimitation resulting from the mPTP approach (19 entities). If available from GenBank, country and sub-region has been included in specimen labels.
Diversity 13 00008 g002
Figure 3. Shape changes resulting from a PCA for the relevant PCs are displayed in the upper left corner. The boxplots of PCs with significant shape differences according to a one-way ANOVA show interspecific differences. Results of the one-way ANOVA for each PC are displayed in the upper left corner of each plot and p-values resulting from Tukey´s pairwise post-hoc test are displayed over the black solid horizontal lines connecting relevant pairs.
Diversity 13 00008 g003
Figure 4. The BIC scores for the k-mean cluster analysis computed with PCs describing >99.0% of total variance. The lowest score (black arrow) indicates the best fitted model to describe clusters within the morpho data set.
Diversity 13 00008 g004
Figure 5. Assignment probabilities computed by the discriminant analysis of principal components (DAPC) of the five species to the 13 clusters calculated by a k-mean cluster algorithm. (Red) assignment probability of 100%; (orange) assignment probability of 50%; and (yellow) assignment probability of 25%.
Diversity 13 00008 g005
Figure 6. (a) Trigonopoma sp. from the Mesangat wetlands differs from its congeners in coloration (reddish fins vs. hyaline fins) and the lateral stripe (thinner than in T. gracile; extending to median caudal-fin rays vs. ending at caudal-fin base in T. pauciperforatum). Picture is mirrored. (b) Rasbora cf. hubbsi from the Mesangat wetlands differs in coloration (faded dark edges along the entire caudal-fin margin and a distinct yellowish caudal fin vs. hyaline) from the nominal species. Picture is mirrored.
Diversity 13 00008 g006
Table 1. Sixteen sampling locations including coordinates (latitude, longitude), date(s), and number of rasborine specimen collected per site.
Location CoordinatesDate(s) in September 2014 Number of Collected Rasborines
S. Mesangat Ulu0.502 116.6982, 10, 11, 25145
Sungai Sebastian0.502 116.6998, 22, 2366
Loa Blöma 10.503 116.6974, 23206
Loa Kahang0.504 116.6989, 21, 2437
Loa Lakum 1.10.502 116.6982, 1148
Loa Lakum 1.30.500 116.69929
Loa Lakum 2.10.502 116.6984, 22118
Loa Lakum 3.10.500 116.699610
Loa Lakum 3.30.500 116.69916100
Loa Sangkal 10.501 116.6986, 718
Loa Sangkal 20.502 116.6981517
Loa Toh 10.497 116.69771
Long Potok 20.492 116.7002030
Mesangat Ilir 10.493 166.685175
Mesangat River0.494 116.6971111
Mesangat Swamp 20.508 116.6978, 24107
unknown--18
Total sample number 946
Table 2. Most-relevant characters considered for the identification of Rasbora cf. hubbsi, R. rutteni, and R. vaillantii. “-” indicates missing data in the quoted publication.
Rasbora vaillantiiRasbora rutteniRasbora hubbsi
AuthorPopta [17]Weber and de Beaufort [35]Weber and de Beaufort [35]Brittan [29]Kottelat et al. [34]Brittan [29]Kottelat et al. [34]
ColorationLateral StripeDark, narrower anteriorlyBroader posteriorlyBroader and darker posteriorlyBroader and darker posteriorlyIndistinct anteriorlySlightly darker and narrower posteriorly; ends in spot posteriorlyIndistinct anteriorly
Axial StreakSeparated from lateral stripe anteriorly--Above lateral stripe anteriorly; coincident posteriorly-Weaker anteriorly, above lateral stripe anteriorly-
Anal StreakDark, forms subpeduncular streak posteriorlyDark, forms subpeduncular streak posteriorly-Some melanophores-Distinct; forms subpeduncular streal posteriorly-
Dorsal StripeDorsal part of caudal peduncleDorsal part of caudal peduncleDorsal part of caudal peduncleDistinct-Distinct-
FinsHyaline-HyalineHyaline; in life sometimes rosy-Hyaline-
Caudal-FinDark margin, blotch at lobesBlackish border---yellowish at base of lobes-
FinraysDorsalII,7II,7II,7II,7-II,7-
PectoralI,15I,15I,12; not reaching pelvicsI,11-12; not reaching pelvics-I,11-13-
PelvicII,8II,8; not reaching analII,7; reaching analII,7; not reaching anal-II,7-8-
AnalIII,5-6III,5III,5III,5-III,5-
Caudal1/17/1--6/1/17/1/8-8/1/17/1/8-
ScalesLateral Line27–3027–302626–29; 24–26 perforated26–29; 24–26 perforated28–31; 25–29 perforated29–30; 25–26 perforated
Transverse Row4,5/1/3,54,5/1/3,5 4,5/1/3,5-4,5/1/2,5-3,5-
Predorsal--1010-10-12-
Caudal Peduncle---12-12-1414
MeasurementsDorsohypuralNot reaching snout--Fallen on anterior margin of pupil-Fallen on snout tip-
Publisher’s Note: MDPI stays neutral with regard to jurisdictional claims in published maps and institutional affiliations.

