Provincial Dietary Intake Study (PDIS): Prevalence and Sociodemographic Determinants of the Double Burden of Malnutrition in A Representative Sample of 1 to Under 10-Year-Old Children from Two Urbanized and Economically Active Provinces in South Africa

 ,
, 
 and
and
Abstract
:1. Introduction
2. Materials and Methods
2.1. Study Area
2.2. Structure of the Sample and the Sampling Procedure
2.3. Selection of Households
2.4. Selection of Children Within Households
2.5. Fieldwork Teams
2.6. Measures
2.6.1. Socio-Demographic Questionnaire
2.6.2. Hunger Scale Questionnaire
2.6.3. Anthropometry: Weight of Children and Mothers
2.6.4. Anthropometry: Height of Children and Mothers
2.6.5. Anthropometry: Mid-Upper Arm Circumference (MUAC) of Children
2.6.6. Interpretation of Anthropometric Measures
2.7. Data Analyses
2.8. Ethics
3. Results
4. Discussion
5. Conclusions
Supplementary Materials
Author Contributions
Funding
Acknowledgments
Conflicts of Interest
References
- Min, J.; Zhao, Y.; Slivka, L.; Wang, Y. Double burden of diseases worldwide: Coexistence of undernutrition and overnutrition-related non-communicable chronic diseases. Obes. Rev. 2018, 19, 49–61. [Google Scholar] [CrossRef] [PubMed]
- De Onis, M.; Branca, F. Childhood stunting: A global perspective. Matern. Child Nutr. 2016, 12, 12–26. [Google Scholar] [CrossRef] [PubMed]
- Bouzitou, G.D.N.; Fayomi, B.; Delisle, H. Child malnutrition and maternal overweight in same households in poor areas of Benin. Sante 2005, 15, 263–270. [Google Scholar]
- WHO. World Health Organization: Facts and Figures on Childhood Obesity. Available online: https://www.who.int/end-childhood-obesity/facts/en/ (accessed on 22 February 2019).
- Wijga, A.H.; Scholtens, S.; Bemelmans, W.J.; de Jongste, J.C.; Kerkhof, M.; Schipper, M.; Sanders, E.A.; Gerritsen, J.; Brunekreef, B.; Smit, H.A. Comorbidities of obesity in school children: A cross-sectional study in the PIAMA birth cohort. BMC Public Health 2010, 10, 184. [Google Scholar] [CrossRef]
- Kelsey, M.M.; Zaepfel, A.; Bjornstad, P.; Nadeau, K.J. Age-related consequences of childhood obesity. Gerontology 2014, 60, 222–228. [Google Scholar] [CrossRef]
- South African MRC. South African Demographic and Health Survey: 2016; South Africa Medical Research Council: Pretoria, South Africa, 2017. [Google Scholar]
- Shisana, O.; Labadarios, D.; Rehle, T.; Simbayi, L.; Zuma, K.; Dhansay, A.; Reddy, P.; Parker, W.; Hoosain, E.; Naidoo, P.; et al. South African National Health and Nutrition Examination Survey (SANHANES-1); HSRC Press: Cape Town, Sounth Africa, 2014. [Google Scholar]
- Bates, K.; Gjonca, A.; Leone, T. Double burden or double counting of child malnutrition? The methodological and theoretical implications of stuntingoverweight in low and middle income countries. J. Epidemiol. Community Health 2017, 71, 779–785. [Google Scholar] [CrossRef] [Green Version]
- Singhal, A. Early Life Origins of Obesity and Related Complications. Indian J. Pediatr. 2018, 85, 472–477. [Google Scholar] [CrossRef]
- Trandafir, L.M.; Temneanu, O.R. Pre and post-natal risk and determination of factors for child obesity. J. Med. Life 2016, 9, 386–391. [Google Scholar]
- Kominiarek, M.A.; Peaceman, A.M. Gestational weight gain. Am. J. Obstet. Gynecol. 2017, 217, 642–651. [Google Scholar] [CrossRef]
- Labadarios, D.; Van Middelkoop, A. Children Aged 6 to 71 Months in South Africa, 1994: Their Anthropometric, Vitamin A, Iron and Immunisation Coverage Status; The South African Vitamin A Consultative Group (SAVACG): Johannesburg, South Africa, 1995; Available online: http://www.sun.ac.za/english/faculty/healthsciences/interdisciplinary-health-sciences/Documents/Ch4_AntropometricStatus.pdf (accessed on 10 September 2019).
- South African Department of Health. South African Demographic and Health Survey: 1998; National Department of Health South Africa: Pretoria, South Africa, 1998.
- Labadarios, D.; Steyn, N.P.; Maunder, E.; MacIntryre, U.; Gericke, G.; Swart, R.; Huskisson, J.; Dannhauser, A.; Vorster, H.H.; Nesmvuni, A.E.; et al. The National Food Consumption Survey (NFCS): South Africa, 1999. Public Health Nutr. 2005, 8, 533–543. [Google Scholar] [CrossRef]
- South African MRC. South African Demographic and Health Survey: 2003; South Africa Medical Research Council: Pretoria, South Africa, 2007. [Google Scholar]
- Labadarios, D.; Swart, R.; Maunder, E.; Kruger, H.S.; Gericke, G. Executive Summary: National Food Consumption Survey - Fortification Baseline (NFCS-FB-1). S. Afr. J. Clin. Nutr. 2008, 21, 245–300. [Google Scholar]
- Statistics South Africa. Mid-Year Population Estimates 2018. Available online: http://www.statssa.gov.za/?p=11341 (accessed on 6 March 2019).
- ICF International. Demographic and Health Survey Sampling and Household Listing Manual: MEASURE DHS; Inner City Fund (ICF) International: Calverton, MD, USA, 2012. [Google Scholar]
- Filmer, D.; Pritchett, L. Estimating Wealth Effects Without Expenditure Data-or Tears: With an Application to Educational Enrollments in the States of India. Demography. 2001, 38, 115–132. [Google Scholar] [PubMed]
- Wehler, C.; Scott, R.; Anderson, J. The community childhood hunger identification project: A model of domestic hunger-demonstration. J. Nutr. Edu. 1992, 24, 295–355. [Google Scholar] [CrossRef]
- Lee, R.D.; Nieman, D.C. Nutritional Assessment, 6th ed.; McGraw-Hill: London, UK, 2013. [Google Scholar]
- WHO. World Health Organization Child Growth Standards: Length/Height-for-Age, Weight-for-Age, Weight-for-Length, Weight-for-Height and Body Mass Index-for-Age (Methods and Development). Available online: https://www.who.int/childgrowth/standards/technical_report/en/ (accessed on 5 March 2019).
- De Onis, M.; Lobstein, T. Defining obesity risk status in the general childhood population: Which cut-offs should we use? Int. J. Pediatr. Obes. 2010, 5, 458–460. [Google Scholar] [CrossRef] [PubMed]
- WHO. Obesity: Preventing and Managaing the Global Epidemic (Report of a World Health Organization Consultation). Available online: https://www.who.int/nutrition/publications/obesity/WHO_TRS_894/en/ (accessed on 6 March 2019).
- World Medical Association. Declaration of Helsinki: Ethical principles for medical research involving human subjects. JAMA 2013, 310, 2191–2194. [Google Scholar] [CrossRef] [PubMed]
- United Nations. The Sustainable Development Goals Report 2017; United Nations: New York, NY, USA, 2017. [Google Scholar]
- WHO/UNICEF. The Extension of the 2025 Maternal, Infant and Young Child Nutrition Targets to 2030. Available online: https://www.who.int/nutrition/global-target-2025/discussion-paper-extension-targets-2030.pdf (accessed on 12 April 2019).
- Dhansay, A.; Labadarios, D.; Nel, J.; Nannan, N.; Laubscher, R.; Bradshaw, D. The dual burden of maternal and child malnutrition-evidence from national surveys in South Africa over a decade. In International Symposium on Understanding the Double Burden of Malnutrition for Effective Interventions; IAEA, Ed.; Book of Abstracts: Vienna, Austria, 2018; p. 396. [Google Scholar]
- Casale, D. Analysing the Links Between Child Health and Education Outcomes: Evidence from NIDS Waves 1-4; South Africa Labour and Development Research Unit: University of Cape Town: Cape Town, South Africa, 2016. [Google Scholar]
- Tzioumis, E.; Kay, M.C.; Bentley, M.E.; Adair, L.S. Prevalence and trends in the childhood dual burden of malnutrition in low- and middle-income countries, 1990–2012. Public Health Nutr. 2016, 19, 1375–1388. [Google Scholar] [CrossRef] [PubMed]
- Zembe-Mkabile, W.; Surender, R.; Sanders, D.; Swart, R.; Ramokolo, V.; Wright, G.; Doherty, T. To be a woman is to make a plan: A qualitative study exploring mothers experiences of the Child Support Grant in supporting children’s diets and nutrition in South Africa. BMJ Open 2018, 8, e019376. [Google Scholar] [CrossRef]
- Akombi, B.J.; Agho, K.E.; Hall, J.J.; Wali, N.; Renzaho, A.M.N.; Merom, D. Stunting, Wasting and Underweight in Sub-Saharan Africa: A Systematic Review. Int. J. Environ. Res. Public Health 2017, 14, 863. [Google Scholar] [CrossRef]
- Statistics South Africa. Millenium Development Goals: Country Report 2015. Available online: http://www.statssa.gov.za/MDG/MDG_Country%20Report_Final30Sep2015.pdf (accessed on 16 April 2019).
- Devereux, S.; Waidler, J. Why does Malnutrition Persist in South Africa Despite Social Grants? Food Security SA Working Paper Series No.001; South Africa DST-NRF Centre of Excellence in Food Security: Cape Town, South Africa, 2017. [Google Scholar]
- Steyn, N.P.; Labadarios, D.; Maunder, E.; Nel, J.; Lombard, C. Directors of the National Food Consumption, S. Secondary anthropometric data analysis of the National Food Consumption Survey in South Africa: The double burden. Nutrition 2005, 21, 4–13. [Google Scholar] [CrossRef]
- Wang, Y.; Min, J.; Khuri, J.; Li, M. A Systematic Examination of the Association between Parental and Child Obesity across Countries. Adv. Nutr. 2017, 8, 436–448. [Google Scholar] [CrossRef] [Green Version]
- Bahreynian, M.; Qorbani, M.; Khaniabadi, B.M.; Motlagh, M.E.; Safari, O.; Asayesh, H.; Kelishadi, R. Association between Obesity and Parental Weight Status in Children and Adolescents. J. Clin. Res. Pediatr. Endocrinol. 2017, 9, 111–117. [Google Scholar] [CrossRef] [PubMed]
- Ntenda, P.A.M.; Mhone, T.G.; Nkoka, O. High Maternal Body Mass Index Is Associated with an Early-Onset of Overweight/Obesity in Pre-School-Aged Children in Malawi. A Multilevel Analysis of the 2015-16 Malawi Demographic and Health Survey. J. Trop. Pediatr. 2019, 65, 147–159. [Google Scholar] [CrossRef] [PubMed]
- Mikkelsen, B.; Williams, J.; Rakovac, I.; Wickramasinghe, K.; Hennis, A.; Shin, H.R.; Farmer, M.; Weber, M.; Berdzuli, N.; Borges, C.; et al. Life course approach to prevention and control of non-communicable diseases. BMJ 2019, 364, l257. [Google Scholar] [CrossRef] [Green Version]
- Cole, T.J.; Lobstein, T. Extended international (IOTF) body mass index cut-offs for thinness, overweight and obesity. Pediatric Obes. 2012, 7, 284–294. [Google Scholar] [CrossRef] [PubMed]
- South African Department of Health. Strategy for the Prevention and Control of Obesity in South Africa; National Department of Health South Africa: Pretoria, South Africa, 2016.
- The World Bank. World Bank Country and Lending Groups. Available online: https://datahelpdesk.worldbank.org/knowledgebase/articles/906519-world-bank-country-and-lending-groups (accessed on 29 July 2019).


| Age Group & Malnutrition Category [23,24] | HAZ | WAZ | BAZ |
|---|---|---|---|
| 1–<10-year olds (all children) | |||
| Stunted & very stunted | <−2 SD | ||
| Very stunted | <−3 SD | ||
| Underweight & severely underweight | <−2 SD | ||
| Severely underweight | <−3 SD | ||
| 1–<5-year olds only | |||
| Wasted | <−2 SD | ||
| At risk of overweight | > +1 SD; ≤ +2 SD | ||
| Overweight | > +2 SD; ≤ +3 SD | ||
| Obese | > +3 SD | ||
| Stunted & overweight | <−2 SD | > +2 SD | |
| 5–<10-year olds only | |||
| Wasted | <−2 SD | ||
| Overweight | > +1 SD; ≤ +2 SD | ||
| Obese | > +3 SD | ||
| Stunted & overweight | <−2 SD | > +1 SD |
| Gauteng % (95% CI) | Western Cape % (95% CI) | Total Group % (95% CI) | |
|---|---|---|---|
| Who looks after the child most of the time | N = 733 | N = 592 | N = 1325 |
| Mother | 70.2 (65.7–74.9) ## | 71.0 (64.9–77.2) | 70.5 (66.9–74.1) |
| Father | 6.5 (3.4–9.6) | 1.8 (0.2–3.3) | 4.9 (2.8–7.0) |
| Grandparent | 16.6 (12.8–20.4) | 21.0 (15.5–26.5) | 18.0 (15.0–21.1) |
| Other (sibling, aunt, uncle) | 6.7 (4.0–9.5) | 6.2 (2.4–10.1) | 6.6 (4.4–8.8) |
| Age of child | N = 733 | N = 593 | N = 1326 |
| 1–<5 years | 50.7 (46.4–55.0) | 49.2 (42.1–56.3) | 50.2 (46.5–53.8) |
| 5–<10 years | 49.3 (45.0–53.6) | 50.8 (43.7–57.9) | 49.8 (46.2–53.5) |
| Gender | N = 733 | N = 593 | N = 1326 |
| Male | 50.2 (45.6–54.9) | 47.7 (43.2–52.2) | 49.4 (46.0–52.8) |
| Female | 49.8 (45.1–54.4) | 52.3 (47.8–56.8) | 50.6 (47.2–54.0) |
| Head of household | N = 733 | N = 593 | N = 1326 |
| Father | 40.2 (33.7–46.7) # | 39.2 (34.8–43.6) | 39.9 (35.5–44.4) |
| Mother | 16.9 (13.9–19.9) | 10.8 (7.0–14.6) | 14.9 (12.4–17.1) |
| Grandmother | 22.0 (15.5–28.4) | 27.6 (21.0–34.1) | 23.8 (19.0–28.5) |
| Grandfather | 11.7 (8.5–15.0) | 14.0 (10.3–17.8) | 12.5 (10.1–15.2) |
| Other (e.g., aunt, uncle, friend) | 9.2 (5.5–12.9) | 8.4 (5.2–11.7) | 9.0 (6.3–11.6) |
| Marital status of mother | N = 733 | N = 593 | N = 1326 |
| Unmarried | 41.2 (35.1–47.4) ### | 34.3 (27.8–40.9) | 39.0 (34.3–43.6) |
| Married | 24.8 (20.3–29.4) | 41.2 (33.3–49.0) | 30.3 (26.3–34.2) |
| Divorced/separated/widowed | 4.8 (2.5–7.0) | 2.8 (0.7–4.9) | 4.1 (2.5–5.7) |
| Living together | 27.8 (22.0–33.5) | 21.0 (16.2–25.9) | 25.5 (21.4–29.6) |
| Other | 1.4 (0.2–2.6) | 0.7 (0.0–1.6) | 1.1 (0.3–2.0) |
| Mother’s highest education | N = 733 | N = 592 | N = 1325 |
| Less than grade 12 | 51.2 (44.9–57.5) ## | 57.8 (47.2–68.4) | 53.4 (48.0–58.8) |
| Grade 12 | 33.9 (28.3–39.5) | 24.2 (17.1–31.3) | 30.8 (26.3–35.0) |
| Qualification after grade 12 | 12.2 (8.6–15.8) | 15.9 (7.8–24.1) | 13.4 (9.9–17.0) |
| Do not know | 2.7 (1.4–4.1) | 2.1 (0.5–3.7) | 2.5 (1.5–3.5) |
| Father’s highest education | N = 733 | N = 592 | N = 1325 |
| Less than grade 12 | 26.9 (22.1–31.7) | 33.6 (29.0–38.3) | 29.1 (25.6–32.6) |
| Grade 12 | 32.8 (27.0–38.6) | 29.7 (24.3–35.0) | 31.8 (27.6–36.0) |
| Qualification after grade 12 | 13.2 (9.5–17.0) | 11.0 (6.1–16.0) | 12.5 (9.5–15.4) |
| Do not know | 27.1 (22.1–32.1) | 25.7 (20.2–31.1) | 26.6 (22.9–30.4) |
| Mother’s employment status | N = 732 | N = 593 | N = 1325 |
| Yes | 22.3 (17.8–26.8) ### | 39.2 (31.8–46.7) | 28.0 (24.2–31.7) |
| No | 74.6 (69.6–79.6) | 59.4 (52.2–66.7) | 69.6 (65.5–73.6) |
| Don’t know/not applicable | 3.0 (1.3–4.8) | 1.3 (0.3–2.4) | 2.5 (1.3–3.7) |
| Father’s employment status | N = 731 | N = 593 | N = 1324 |
| Yes | 64.7 (60.4–69.0) | 65.4 (59.7–71.1) | 64.9 (61.5–68.3) |
| No | 21.6 (17.7–25.6) | 20.2 (14.8–25.7) | 21.2 (18.0–24.3) |
| Don’t know/not applicable | 13.7 (11.0–16.4) | 14.4 (10.3–18.5) | 13.9 (11.7–16.1) |
| Wealth index quintiles | N = 733 | N = 593 | N = 1326 |
| One | 21.1 (14.5–27.7) ## | 17.3 (10.0–24.6) | 19.8 (14.9–24.8) |
| Two | 18.1 (12.3–23.9) | 25.0 (20.8–29.1) | 20.4 (16.4–24.4) |
| Three | 21.0 (16.8–25.3) | 16.0 (12.0–20.0) | 19.4 (16.3–22.5) |
| Four | 21.6 (16.9–26.4) | 18.0 (12.8–23.1) | 20.4 (16.9–23.9) |
| Five | 18.1 (11.5–24.8) | 23.7 (14.7–32.7) | 20.0 (14.7–25.2) |
| Ethnicity | N = 732 | N = 593 | N = 1325 |
| Black African | 97.8 (96.0–99.7) ### | 27.5 (13.0–41.9) | 74.4 (69.6–79.3) |
| Mixed ancestry | 2.1 (0.3–4.0) | 68.1 (54.1–82.2) | 24.1 (19.3–28.8) |
| Other | 0.03 (0.0–0.07) | 4.4 (0.6–8.2) | 1.5 (0.2–2.7) |
| Type of residence | N = 733 | N = 593 | N = 1326 |
| Rural | 2.4 (2.4–2.5) ## | 6.6 (5.7–7.5) | 3.8 (3.5–4.1) |
| Urban formal | 88.9 (88.7–89.1) | 86.8 (85.7–87.9) | 88.2 (87.8–88.6) |
| Urban informal | 8.7 (8.5–8.9) | 6.6 (6.2–7.0) | 8.0 (7.8–8.2) |
| Mother BMI | N = 730 | N = 513 | N = 1243 |
| Underweight/normal weight (BMI < 25) | 33.2 (28.0–38.5) ## | 28.9 (23.6–34.2) | 31.9 (28.0–35.8) |
| Overweight (BMI ≥ 25; <30) | 27.8 (23.6–31.9) | 20.5 (16.5–24.6) | 25.5 (22.4–28.6) |
| Obese (BMI ≥ 30) | 38.9 (35.9–42.1) | 50.6 (43.1–58.1) | 42.6 (39.4–45.7) |
| Hunger Scale [21] | N = 733 | N = 593 | N = 1326 |
| Total score = 0: No risk | 58.1 (49.7–66.4) # | 49.1 (39.7–58.6) | 55.1 (48.8–61.4) |
| 1–4: At risk of hunger | 21.8 (17.1–26.6) | 28.6 (22.9–34.3) | 24.1 (20.4–27.8) |
| 5–8: Food shortage in house | 20.1 (14.9–25.3) | 22.3 (16.8–27.8) | 20.8 (16.9–24.7) |
| Parameter | Category | Gauteng 2018 (N= 723) Weighted % (95% CI) | Western Cape N = 577) Weighted% (95% CI) | Total Group (n = 1300) Weighted% (95% CI) | ||||||||
|---|---|---|---|---|---|---|---|---|---|---|---|---|
| Area of residence | Urban Formal | Urban Informal | Rural | Chi Square p-Value | Total GTG | Urban Formal | Urban Informal | Rural | Chi Square p-Value | Total WC | All | |
| Sample size | 1–<5 years | N = 196 | N = 87 | N = 90 | N = 373 | N = 140 | N = 79 | N = 82 | N = 301 | N = 674 | ||
| Height-for-age | ||||||||||||
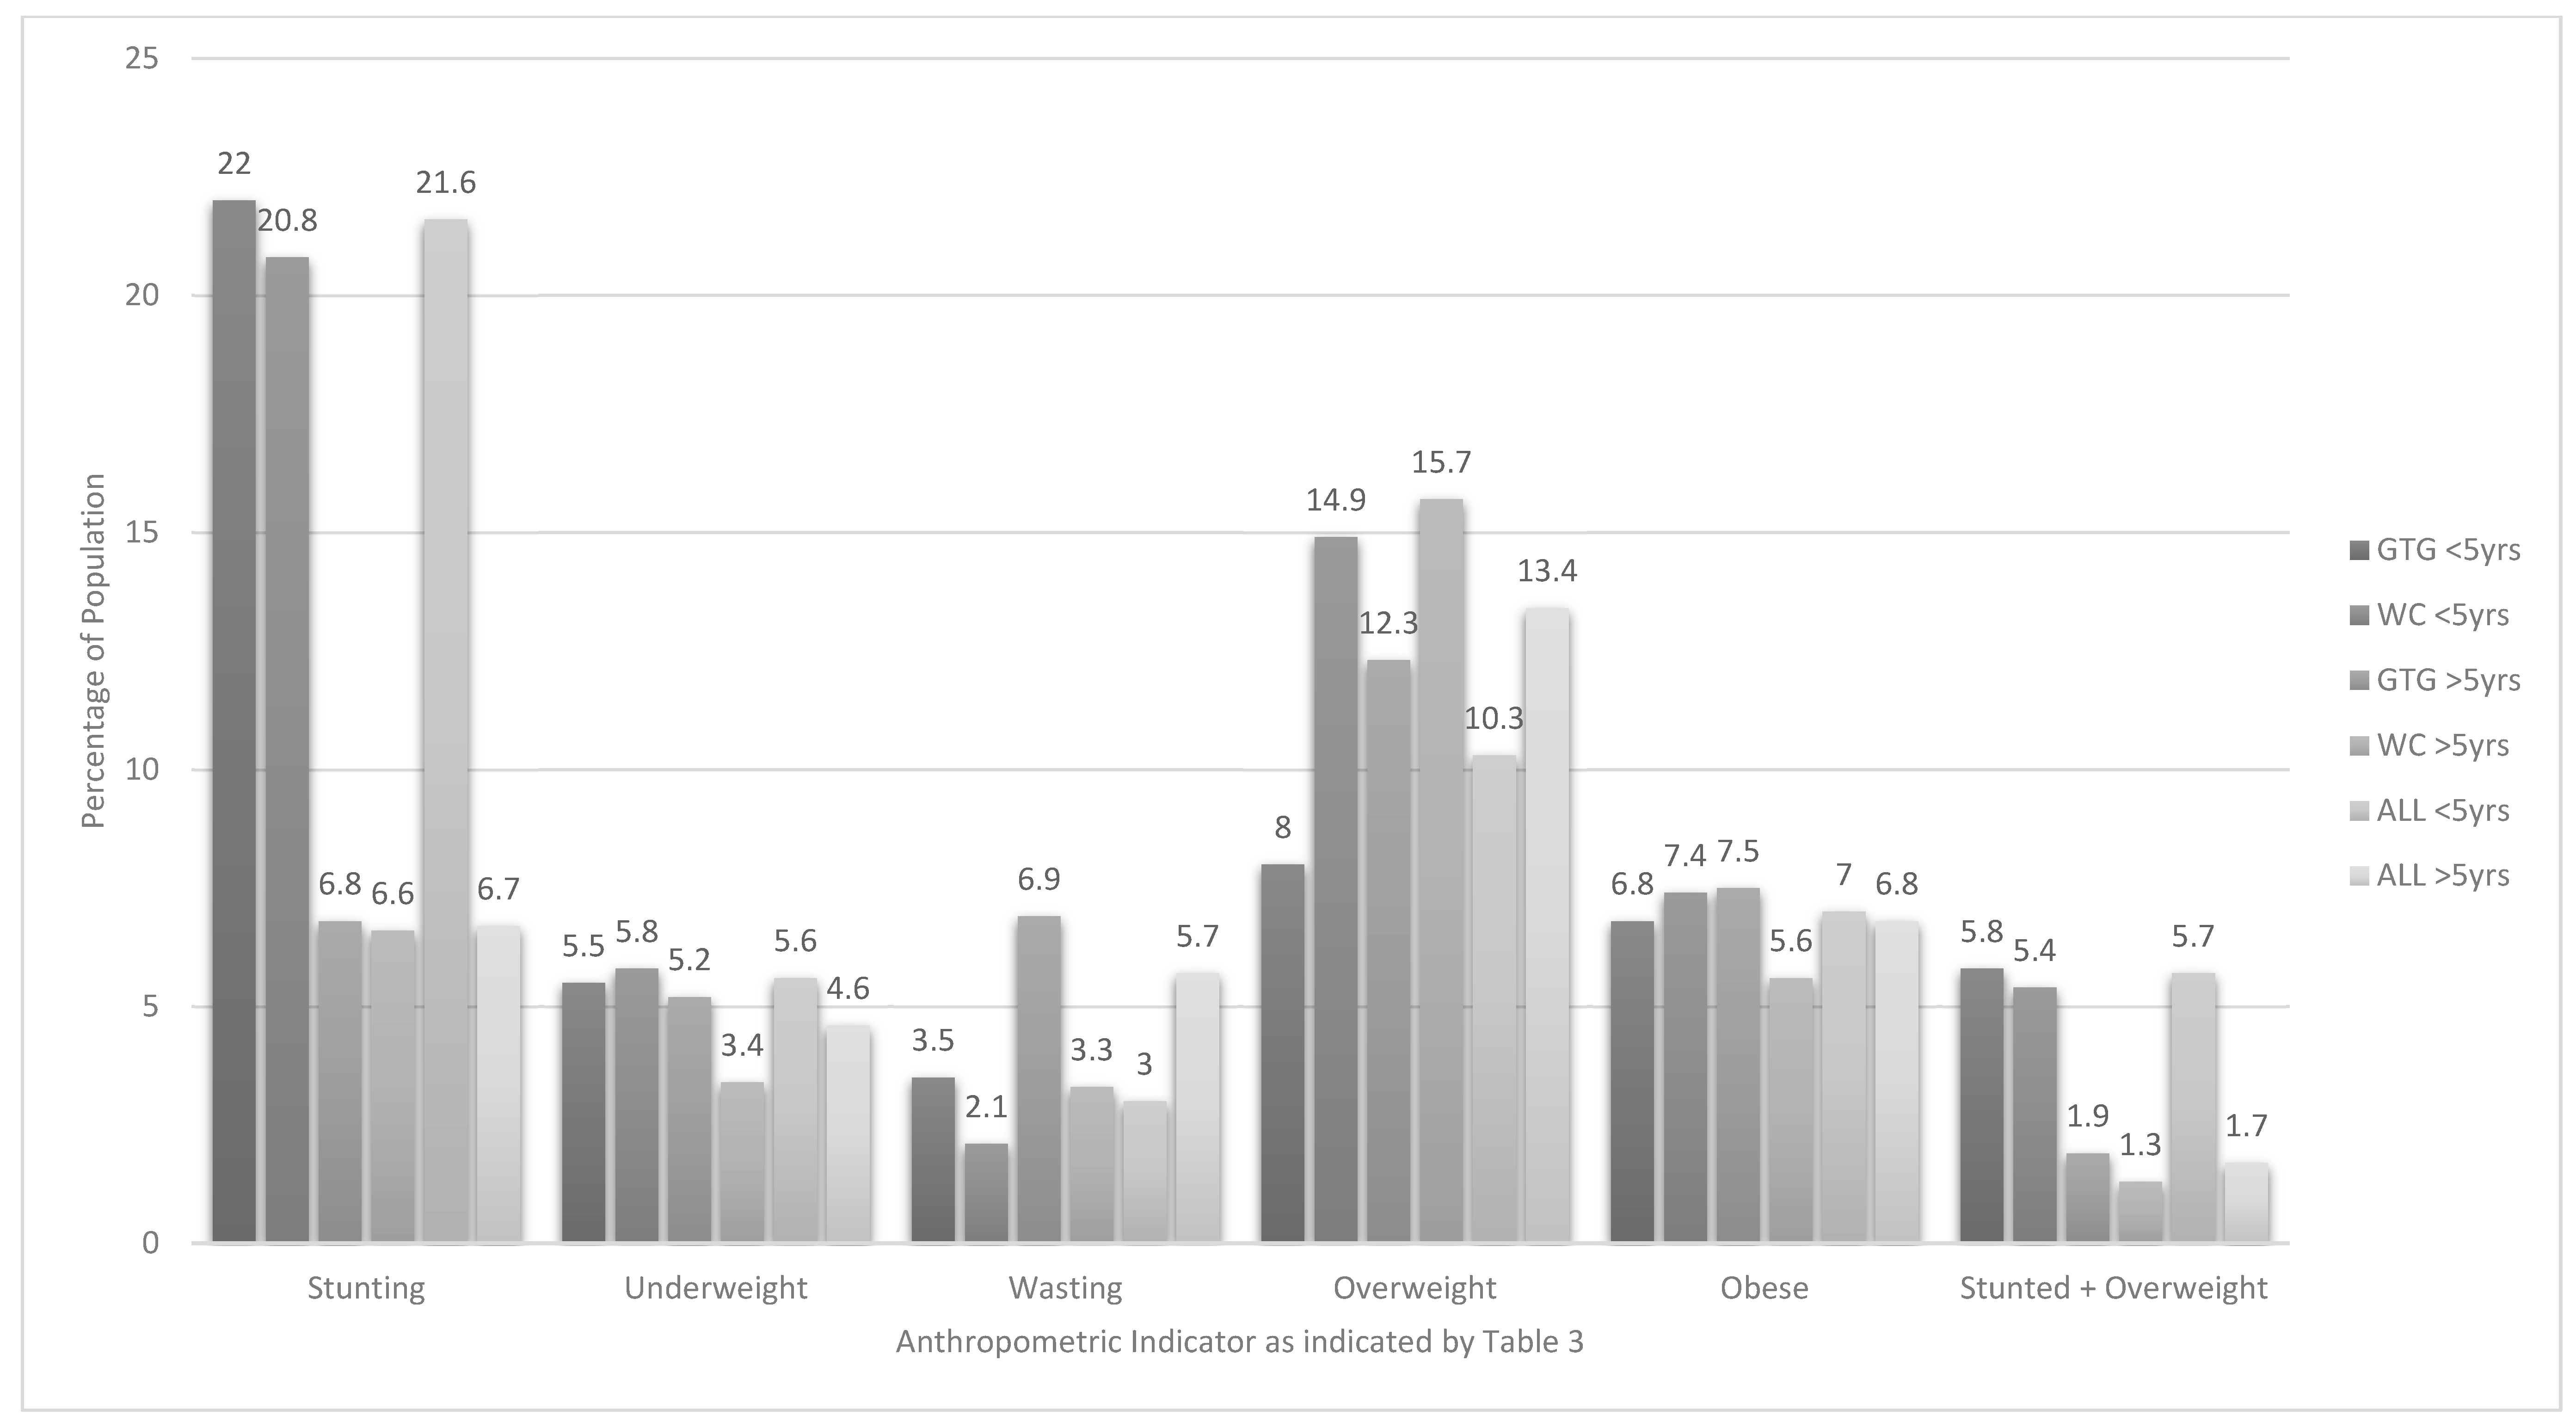
| HAZ < −2 SD | Stunted | 20.4 (13.2–27.7) | 34.5 (27.3–41.7) | 30.0 (18.8–41.2) | p > 0.05 | 22.0 (15.7–28.2) | 21.4 (10.5–32.4) | 11.4 (1.7–21.1) | 23.2 (7.6–38.8) | p > 0.05 | 20.8 (11.6–30.0) | 21.6 (16.5–26.7) |
| HAZ < −3 SD | Severely stunted | 7.7 (1.7–13.6) | 11.5 (5.8–17.2) | 12.2 (3.0–21.5) | p > 0.05 | 8.1 (3.0–13.2) | 4.3 (0.7–7.9) | 5.1 (0.0–11.1) | 6.1 (0.0–12.5) | p > 0.05 | 4.5 (1.4–7.5) | 6.9 (3.4–10.5) |
| Weight-for-age | ||||||||||||
| WAZ < −2 SD | Underweight | 5.1 (0.4–9.8) | 8.0 (0.0–16.9) | 12.2 (7.4–17.0_ | p > 0.05 | 5.5 (1.4–9.7) | 5.7 (1.2–10.2) | 1.3 (0.0–4.1) | 12.2 (1.8–22.6) | p > 0.05 | 5.8 (2.0–9.6) | 5.6 (2.6–8.6) |
| WAZ < −3 SD | Severely underweight | 0.5 (0.0–1.6) | 2.3 (0.0–5.6) | - | p > 0.05 | 0.7 (0.0–1.6) | 1.4 (0.0–3.4) | - | - | p > 0.05 | 1.2 (0.0–2.9) | 0.9 (0.0–1.7) |
| BMI-for-age | ||||||||||||
| BAZ < −2 SD | Wasted | 3.1 (0.0–6.5) | 6.9 (3.2–10.6) | 4.4 (0.0–9.9) | p > 0.05 | 3.5 (0.5–6.4) | 2.1 (0.0–5.5) | - | 3.7 (0.0–7.6) | p > 0.05 | 2.1 (0.0–4.9) | 3.0 (0.8–5.2) |
| BAZ < −3 SD | Severely wasted | 1.0 (0.0–2.4) | 3.4 (0.0–7.2) | 1.1 (0.0–3.6) | p > 0.05 | 1.3 (0–2.5) | 0.7 (0.0–2.2) | - | - | p > 0.05 | 0.6 (0.0–1.9) | 1.0 (0.1–2.0) |
| BAZ > +1 SD; ≤ + 2 | At risk of overweight | 19.4 (14.1–24.7) | 20.7 (8.1–33.3) | 27.8 (16.7–38.8) | p > 0.05 | 19.7 (15.0–24.4) | 21.4 (11.6–31.2) | 29.1 (17.2–41.0) | 20.7 (10.7–30.8) | p > 0.05 | 22.0 (13.8–30.1) | 20.4 (16.3–24.5) |
| BAZ > +2 SD; ≤ +3 SD | Overweight | 7.7 (3.8–11.5) | 11.5 (4.6–18.4) | 8.9 (2.7–15.0) | p > 0.05 | 8.0# (4.7–11.4) | 15.7 (8.6–22.8) | 8.9 (2.3–15.4) | 11.0 (1.3–22.6) | p > 0.05 | 14.9 (9.0–20.9) | 10.3 (7.3–13.3) |
| BAZ > +3 SD; | Obese | 6.6 (3.4–9.9) | 8.0 (2.8–13.3) | 8.9 (2.5–15.3) | p > 0.05 | 6.8 (4.0–9.6) | 7.1 (3.9–10.4) | 12.7 (3.6–21.7) | 4.9 (1.2–8.6) | p > 0.05 | 7.4 (4.7–10.2) | 7.0 (4.9–9.1) |
| Height-for-age and BMI-for-age (combined) | ||||||||||||
| HAZ < −2 SD and BAZ > +2 SD | Stunted & overweight | 5.6 (3.0–8.2) | 6.9 (0.0–13.9) | 8.9 (4.0–13.8) | p > 0.05 | 5.8 (3.5–8.2) | 5.7 (1.0–10.4) | 2.5 (0.0–8.2) | 4.9 (0.0–11.0) | p > 0.05 | 5.4 (1.5–9.4) | 5.7 (3.7–7.7) |
| Mid-upper arm circumference | ||||||||||||
| MUACZ < −2 SD | Moderate undernutrition | 3.1 (0.8–5.3) | - | 3.3 (0.0–7.0) | p > 0.05 | 2.8 (0.9–4.7) | 2.2 (0.0–4.8) | 1.3 (0.0–4.4) | 6.3 (0.0–13.9) | p > 0.05 | 2.4 (0.1–4.6) | 2.7 (1.2–4.1) |
| MUACZ < −3 SD | Severe undernutrition | 1.5 (0.0–3.3) | - | 2.2 (0.0–5.5) | p > 0.05 | 1.4 (0.0–2.9) | 1.4 (0.0–3.7) | - | 2.5 (0.0–7.6) | p > 0.05 | 1.4 (0.0–3.3) | 1.4 (0.2–2.6) |
| Sample size | 5–<10 years | N = 196 | N = 71 | N = 83 | N = 350 | N = 133 | N = 70 | N = 73 | N = 276 | N = 626 | ||
| Height-for-age | ||||||||||||
| HAZ < −2 SD | Stunted | 6.6 (3.0–10.3) | 7.0 (0.0–15.5) | 12.0 (4.4–19.7) | p > 0.05 | 6.8 (3.6–10.0) | 6.0 (2.2–9.9) | 5.7 (0.7–10.8) | 15.1 (2.5–27.6) | p > 0.05 | 6.6 (3.2–10.0) | 6.7 (4.4–9.1) |
| HAZ < −3 SD | Severely stunted | 2.6 (0.0–5.6) | 1.4 (0.0–4.5) | 3.6 (0.0–9.2) | p > 0.05 | 2.5 (0.0–5.2) | 1.5 (0.0–3.7) | - | - | p > 0.05 | 1.3 (0.0–3.1) | 2.1 (0.2–3.9) |
| Weight-for-age | ||||||||||||
| WAZ < −2 SD | Underweight | 5.1 (1.8–8.4) | 5.6 (0.6–10.7) | 6.0 (0.0–12.0) | p > 0.05 | 5.2 (2.2–8.1) | 3.0 (0.0–6.7) | 7.1 (0.0–14.4) | 5.5 (0.4–10.5) | p > 0.05 | 3.4 (0.2–6.6) | 4.6 (2.4–6.8) |
| WAZ < −3 SD | Severely underweight | 1.5 (1.8–8.4) | 4.2 (0.0–9.2) | - | p > 0.05 | 1.7 (0.0–3.8) | - | 1.4 (0.0–4.7) | 1.4 (0.0–4.5) | p > 0.05 | 0.2 (0.0–0.4) | 1.2 (0.0–2.5) |
| BMI-for-age | ||||||||||||
| BAZ < −2 SD | Wasted | 7.1 (2.8–11.5) | 5.6 (0.2–11.1 | 2.4 (0.0–6.1) | p > 0.05 | 6.9 (3.0–10.8) | 3.0 (0.1–5.9) | 4.3 (0.0–9.0) | 5.5 (0.0–12.4) | p > 0.05 | 3.3 (0.8–57) | 5.7 (3.0–8.3) |
| BAZ < −3 SD | Severely wasted | 2.6 (0.0–6.0) | 2.8 (0.0–7.1) | 1.2 (0.0–3.9) | p > 0.05 | 2.5 (0.0–5.5) | 1.5 (0.0–3.7) | 1.4 (0.0–4.7) | - | p > 0.05 | 1.4 (0.0–3.2) | 2.2 (0.1–4.2) |
| BAZ > +1 SD; ≤ + 2 | Overweight | 12.2 (7.2–17.2) | 12.7 (3.8–21.5) | 12.0 (4.1–20.0) | p > 0.05 | 12.3 (7.9–16.7) | 16.5 (10.2–22.9) | 14.3 (3.5–25.1) | 6.8 (2.5–11.2) | p > 0.05 | 15.7 (10.4–21.1) | 13.4 (10.1–16.8) |
| BAZ > +2 SD | Obese | 8.2 (3.6–12.7) | 1.4 (0.0–4.6) | 2.4 (0.0–5.9) | p > 0.05 | 7.5 (3.5–11.4) | 5.3 (1.0–9.5) | 7.1 (1.7–12.6) | 8.2 (1.1–15.4) | p > 0.05 | 5.6 (1.9–9.2) | 6.8 (4.0–9.7) |
| Height-for-age and BMI-for-age (combined) | ||||||||||||
| HAZ < −2 SD and BAZ > +1 SD | Stunted & overweight | 2.0 (0.0–4.0) | - | 4.8 (0.0–10.6) | p > 0.05 | 1.9 (0.2–3.7) | 1.5 (0.0–3.7) | - | - | p > 0.05 | 1.3 (0.0–3.2) | 1.7 (0.4–3.0) |
| Parameter | Category | Gauteng and Western Cape 2018 (n = 1300) % (95% CI) | ||||||||
|---|---|---|---|---|---|---|---|---|---|---|
| Age Group | 1 year 12–<24 Mths | 2 years 24–<36 Mths | 3 years 36–<48 Mths | 4 years 48–<60 Mths | 5 years 60–<72 Mths | 6 years 72–<84 Mths | 7 years 84–<96 Mths | 8 years 96–<108 Mths | 9 years 108–<120 Mths | |
| Sample size | Description | N = 144 | N = 175 | N= 197 | N=158 | N = 152 | N = 152 | N = 126 | N = 121 | N = 75 |
| Height-for-age | ||||||||||
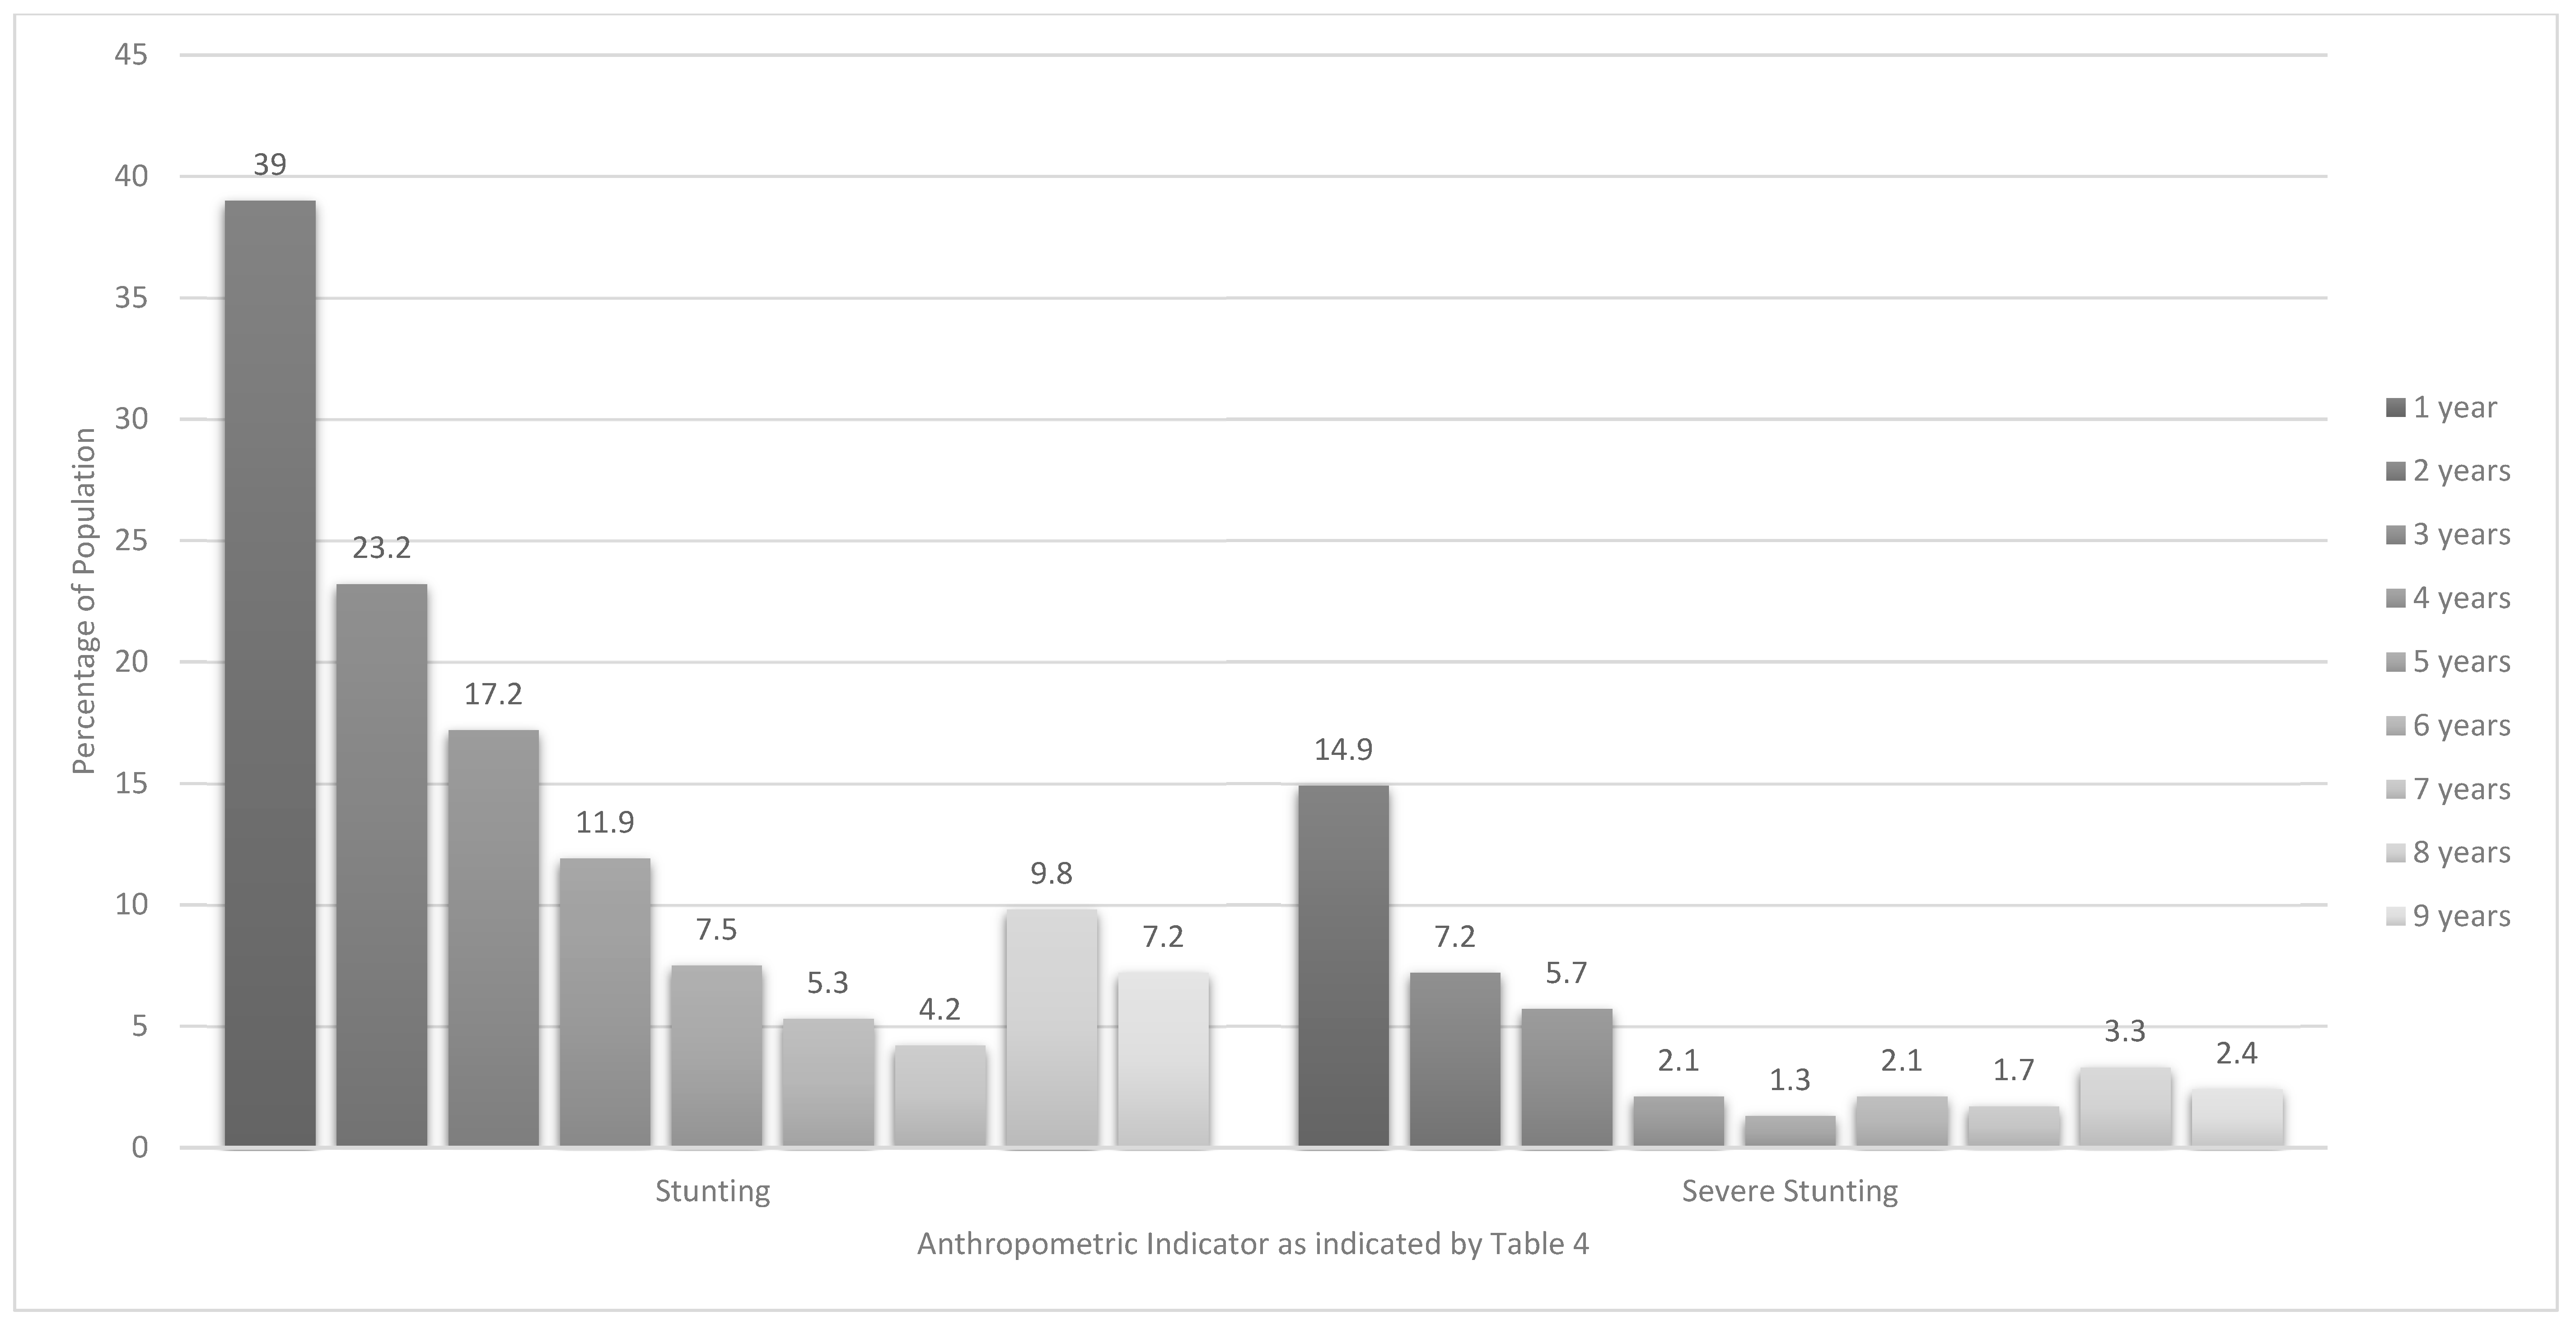
| HAZ < −2 SD | Stunted | 39.0 (27.2–50.9) | 23.2 (14.0–32.5) | 17.2 (9.7–24.7) | 11.9 (5.0–18.8) | 7.5 (1.7–13.3) | 5.3 c (1.3–9.4) | 4.2 (0.0–8.7) | 9.8 (3.4–16.2) | 7.2 (0.0–14.6) |
| HAZ < −3 SD | Severely stunted | 14.9 (7.8–22.1) | 7.2 (1.9–12.6) | 5.7 1 (0.6–10.8) | 2.1 (0.0–4.6) | 1.3 (0.0–3.2) | 2.1 (0.0–5.0) | 1.7 (0.0–4.9) | 3.3 (0.0–7.5) | 2.4 (0.0–7.1) |
| BMI-for-age | ||||||||||
| BAZ < −2 SD | Wasted | 1.5 (0.0–3.8) | 5.8 (0.0–11.7) | 1.8 (0.0–4.2) | 2.6 (0.0–5.2) | 4.0 (0.2–7.8) | 9.8 (1.9–17.6) | 1.8 (0.0–4.3) | 6.9 (1.0–12.9) | 4.7 (0.0–10.9) |
| BAZ < −3 SD | Severely wasted | 1.4 (0.0–3.7) | 1.4 (0.0–3.8) | 1.0 (0.0–3.1) | 0.4 (0.0–1.0) | 0.3 (0.0–0.9) | 4.9 (0.0–12.1) | 1.3 (0.0–3.8) | 3.2 d (0.0–7.3) | - |
| BAZ > +1 SD; ≤ +2 | At risk of overweight (1–<5 years) | 30.6 (22.7–38.5) | 23.3 (15.0–31.6) | 19.8 (11.6–28.1) | 10.5 (4.0–17.0) | |||||
| BAZ > +1 SD; ≤+2 | Overweight (5–<10 years) | 17.7 (8.9–26.6) | 10.1 (3.9–16.4) | 13.2 (5.8–20.6) | 12.3 (5.1–19.4) | 13.663 (3.9–23.3) | ||||
| BAZ >+2 SD, ≤3 | Overweight (1–<5 years) | 23.3 a (15.1–31.5) | 11.2 (4.7–17.7) | 6.6 2 (2.5–10.6) | 3.9 (0.5–7.3) | - | ||||
| BAZ >+2 SD | Obese (5–<10 years) | 6.4 (1.9–11.0) | 7.6 (2.8–12.3) | 2.0 (0.0–5.2) | 8.2 (0.8–15.6) | 11.2 e (1.8–20.7) | ||||
| BAZ > +3 SD; | Obese (1–<5 years) | 14.2 (7.1–21.3) | 9.1 (3.1–15.0) | 3.2 (0.2–6.1) | 4.0 (0.4–7.5) | |||||
| Height-for-age and BMI-for age combined | ||||||||||
| HAZ < −2 SD and BAZ > +2 SD | Stunted & overweight (1–<5 years) | 19.2 b (11.1–27.3) | 5.8 (1.6–10.0) | 1.7 (0.0–3.7) | 0.1 (0.0–0.2) | |||||
| HAZ < −2 SD and BAZ > +1 SD | Stunted & overweight (5–<10 years) | 2.2 (0.0–5.1) | 1.3 (0.0–3.6) | 0.2 (0.0–0.5) | 3.2 (0.0–7.4) | 1.7 (0.0–5.3) | ||||
| Children 1–<10 years Stunted N = 1300 (n = 206) Odds Ratio (95% CI) | Children 1–<10 years At Risk of Overweight/Overweight/Obese (BAZ > +1 SD) N = 1300 (n = 391) Odds Ratio (95% CI) | Children 1–<10 years Stunted & Overweight (HAZ < −2 SD & BAZ > +2 SD for 1-< 5 year olds or >=1 SD for 5-<10 year olds) N = 1300 (n = 86) Odds Ratio (95% CI) | |
|---|---|---|---|
| Who mostly looks after the child | |||
| Mother | Ref | Ref | Ref |
| Father | 1.20 (0.53–2.44) | 0.79 (0.40–1.47) | 1.78 (0.61–4.26) |
| Grandparent | 1.08 (0.68–1.68) | 1.02 (0.72–1.44) | 0.99 (0.47–1.90) |
| Other (sibling, aunt, uncle, etc.) | 1.94 (0.42–6.55) | 1.07 (0.28–3.39) | 3.37 (0.54–12.91) |
| Age in years | N = 1300 | ||
| 1–<5-years | 3.77 (2.56–5.68) *** | 2.38 (1.81–3.14) *** | 5.97 (3.10–12.78) *** |
| 5–<10-years | Ref | Ref | Ref |
| Gender | |||
| Male | Ref | Ref | Ref |
| Female | 0.90 (0.64–1.28) | 0.93 (0.71–1.21) | 1.00 (0.60–1.67) |
| Head of household | |||
| Father | Ref | Ref | Ref |
| Mother | 0.97 (0.54–1.66) | 0.81 (0.53–1.22) | 1.21 (0.54–2.51) |
| Grandmother | 1.32 (0.84–2.06) | 0.88 (0.62–1.25) | 0.93 (0.45–1.86) |
| Grandfather | 1.49 (0.86–2.51) | 1.31 (0.87–1.98) | 1.22 (0.51–2.64) |
| Other (e.g., aunt, uncle, friend, cousin) | 1.56 (0.84–2.77) | 1.01 (0.62–1.63) | 1.86 (0.80–4.01) |
| Marital status of mother | |||
| Unmarried | Ref | Ref | Ref |
| Married | 0.71 (0.45–1.12) | 1.03 (0.75–1.42) | 1.04 (0.56–1.92) |
| Divorced/separated/widowed | 1.17 (0.47–2.57) | 0.66 (0.29–1.34) | 0.18 (0.00–1.32) |
| Living together | 1.38 (0.91–2.08) | 1.07 (0.77–1.50) | 1.09 (0.57–2.04) |
| Other | 1.14 (0.18–4.31) | 1.51 (0.45–4.59) | 3.01 (0.47–11.79) |
| Mother’s highest level of education | |||
| Less than grade 12 | Ref | Ref | Ref |
| Grade 12 | 0.72 (0.48–1.05) | 1.27 (0.94–1.71) | 1.18 (0.67–2.05) |
| Qualification after grade 12 | 0.38 (0.18–0.71) ** | 1.14 (0.76–1.70) | 0.59 (0.20–1.40) |
| Do not know | 0.47 (0.09–1.49) | 0.94 (0.37–2.15) | 1.36 (0.24–4.66) |
| Father’s highest level of education | |||
| Less than grade 12 | Ref | Ref | Ref |
| Grade 12 | 0.76 (0.48–1.20) | 1.21 (0.85–1.71) | 0.90 (0.45–1.80) |
| Qualification after grade 12 | 0.68 (0.35–1.25) | 1.29 (0.82–2.01) | 1.03 (0.41–2.39) |
| Do not know | 1.34 (0.87–2.07) | 1.23 (0.86–1.77) | 1.32 (0.69–2.58) |
| Mother’s employment status | |||
| Yes | Ref | Ref | Ref |
| No | 1.29 (0.88–1.93) | 1.03 (0.77–1.39) | 1.32 (0.75–2.47) |
| Don’t know/not applicable | 0.51 (0.01–3.50) | 0.17 (0.00–1.18) | 1.01 (0.01–8.65) |
| Father’s employment status (%) | |||
| Yes | Ref | Ref | Ref |
| No | 1.02 (0.66–1.55) | 0.93 (0.67–1.30) | 0.88 (0.43–1.64) |
| Don’t know/not applicable | 1.16 (0.62–2.04) | 0.97 (0.59–1.54) | 1.08 (0.41–2.41) |
| Wealth index quintiles | |||
| One | Ref | Ref | Ref |
| Two | 0.90 (0.55–1.48) | 0.79 (0.52–1.20) | 1.01 (0.46–2.23) |
| Three | 0.58 (0.33–1.00) | 0.63 (0.40–0.97) * | 0.67 (0.27–1.60) |
| Four | 0.53 (0.30–0.92) * | 0.80 (0.52–1.21) | 1.02 (0.46–2.53) |
| Five | 0.63 (0.37–1.07) | 1.25 (0.83–1.87) | 1.11 (0.51–2.43) |
| Ethnicity | |||
| Black African | Ref | Ref | Ref |
| Mixed ancestry | 1.41 (0.95–2.05) | 0.84 (0.61–1.15) | 0.90 (0.47–1.62) |
| Other | 0.27 (0.01–1.69) | 1.05 (0.34–2.87) | 0.63 (0.01–4.04) |
| Province | |||
| Gauteng | 1.07 (0.74–1.56) | 0.77 (0.59–1.02) | 1.17 (0.68–2.09) |
| Western Cape | Ref | Ref | Ref |
| Type of residence | |||
| Rural | Ref | Ref | Ref |
| Urban formal | 0.61 (0.29–1.42) | 1.07 (0.54–2.23) | 0.60 (0.23–2.14) |
| Urban informal | 0.90 (0.36–2.38) | 1.18 (0.53–2.77) | 0.71 (0.19–3.04) |
| Mother’s BMI | |||
| Underweight/normal weight | Ref | Ref | Ref |
| Overweight | 0.84 (0.55–1.27) | 0.99 (0.69–1.40) | 0.87 (0.46–1.61) |
| Obese | 0.42 (0.28–0.64) *** | 1.16 (0.85–1.58) | 0.55 (0.30–1.01) |
| Hunger scale | |||
| Total score=0: No risk | Ref | Ref | Ref |
| 1–4: At risk of hunger | 1.03 (0.66–1.57) | 0.87 (0.63–1.21) | 0.92 (0.48–1.68) |
| 5–8: Food shortage in house | 1.34 (0.87–2.04) | 0.74 (0.52–1.05) | 0.82 (0.39–1.57) |
| 1–<10 years Stunted (HAZ < −2 SD) N = 1300 (n = 206) OR (95% CI) | 1–<10 years At risk of Overweight/Overweight/Obese (BAZ > +1 SD) N = 1300 (n = 391) OR (95% CI) | 1–<10 years Stunted & Overweight (HAZ < −2 SD & BAZ > +2 SD for 1-< 5 year olds or >=1 SD for 5-<10 year olds) N = 1300 (n = 86) OR (95% CI) | |
|---|---|---|---|
| Age in years | |||
| 1–<5-years | 3.73 (2.52–5.66) | 2.39 (1.81–3.16) *** | 5.97 (3.10–12.78) *** |
| 5–<10-years | Ref | Ref | Ref |
| Mother’s highest level of education | |||
| Less than grade 12 | Ref | ||
| Grade 12 | 0.68 (0.44–1.03) | ||
| Qualification after grade 12 | 0.34 (0.16–0.68) ** | ||
| Do not know | 0.68 (0.13–2.29) | ||
| Wealth index quintiles | |||
| One | Ref | Ref | |
| Two | 1.09 (0.65–1.83) | 0.80 (0.52–1.23) | |
| Three | 0.66 (0.37–1.16) | 0.62 (0.40–0.97) * | |
| Four | 0.79 (0.43–1.41) | 0.83 (0.54–1.27) | |
| Five | 1.02 (0.56–1.84) | 1.28 (0.85–1.94) | |
| Mother’s BMI | |||
| Underweight or Normal weight | Ref | ||
| Overweight | 0.86 (0.56–1.33) | ||
| Obese | 0.46 (0.30–0.71) ** |
| Indicator and Cut-Offs | 1993 SAVACG N = 10819 6–71 Mths Olds [13] | NFCS 1999 N = 2894 1–9 Years Olds [15] | 2003 SAHDS N = 1159 0–<5 Years Olds [29] | 2005 NFCS- FB−1 N = 1099 1–<5 Years Olds [29] | 2008 NIDS N = 4268 6 Mths−9 Years Olds [30] | 2012 SANHANES N = 1416 <5 Years Olds [29] | 2016 SADHS N = 1416 6 mnths−5 Years Olds [7] | 2018 PDIS: Current Study N = 1300 1–9 Years Olds | ||||||
|---|---|---|---|---|---|---|---|---|---|---|---|---|---|---|
| Age group (years except if otherwise indicated) | 12–23 mths N = 2027 | 6–71 mths N = 10819 | 1–3 y | 4–6 y | 7–9 y | 0–<5 y | 1–<5 y | 6 mths−4 y | 5–9 y | 1–< 5 y | <5 y | 1 y N = 144 | 1–<5 y N = 674 | 5<10 y N = 626 |
| Stunted, underweight or wasted | ||||||||||||||
| Stunted (all): HAZ < −2 SD (%) | 23.4 | 16.1 | 24.4 | 19.7 | 11.3 | 33.4 | 26.4 | 24.9 | 12.2 | 26.5 | 27.4 | 39.0 | 21.6 | 6.7 |
| Underweight (all): WAZ < −2 SD (%) | 9.0 | 9.3 | 11.4 | 8.0 | 6.4 | 9.9 | 6.3 | 6.2 | 5.9 | 1.0 | 5.6 | 4.6 | ||
| Wasted < 5 y olds: WHZ < −2 SD (%) | 3.9 | 2.6 | 3.4 | 3.3 | 3.2 | 7.5 | 6.0 | 2.9 | 2.5 | |||||
| At risk of overweight, overweight or obese | ||||||||||||||
| At risk overweight < 5 y olds; or overweight 5–9 y olds: WHZ > 1; ≤2 SD (%) | 13.4 | 13.4 | 9.5 | 20.1 | 16.6 | 22.8 | ||||||||
| Overweight < 5 y olds: WHZ > 2; ≤3 SD (%) | 11.3 | 6.8 | 10.7 | |||||||||||
| Overweight/obese < 5 olds; or Obese 5–9 y olds: WHZ > 2 SD (%) | 7.4 | 5.9 | 6.5 | 13.3 | ||||||||||
| Obese < 5 y olds WHZ ≥ 3 % | 7.0 | 1.6 | 3.5 | |||||||||||
| Wasting (All): BAZ <−2 SD (%) | 7.1 | 6.3 | 2.6 | 1.5 | 3.0 | 5.7 | ||||||||
| At risk overweight < 5 y olds: BAZ > 1; ≤2 SD (%) | 20.7 | 7.6 | 24.9 | 30.6 | 20.4 | |||||||||
| Overweight for <5 y olds: BAZ > 2; ≤3 SD (%) | 12.0 | 10.2 | 16.1 | 12.0 | 23.3 | 10.3 | ||||||||
| Obese < 5 y olds BAZ ≥ 3 (%) | 8.5 | 2.6 | 4.8 | 4.0 | 14.2 | 7.0 | ||||||||
| Overweight for 5–9 y olds: BAZ > 1; ≤2 SD (%) | 18.2 | 13.4 | ||||||||||||
| Obese 5–9 y olds BAZ > 2 (%) | 7.5 | 6.8 | ||||||||||||
| Overweight IOTF8 BMI ≥ 25; <30 kg/m2 (%) | 16.0 | 12.0 | 6.5 | |||||||||||
| Obese IOTF8 ≥30 kg/m2 (%) | 6.1 | 2.5 | 1.1 | |||||||||||
© 2019 by the authors. Licensee MDPI, Basel, Switzerland. This article is an open access article distributed under the terms and conditions of the Creative Commons Attribution (CC BY) license (http://creativecommons.org/licenses/by/4.0/).
Share and Cite
Senekal, M.; Nel, J.H.; Malczyk, S.; Drummond, L.; Harbron, J.; Steyn, N.P. Provincial Dietary Intake Study (PDIS): Prevalence and Sociodemographic Determinants of the Double Burden of Malnutrition in A Representative Sample of 1 to Under 10-Year-Old Children from Two Urbanized and Economically Active Provinces in South Africa. Int. J. Environ. Res. Public Health 2019, 16, 3334. https://0-doi-org.brum.beds.ac.uk/10.3390/ijerph16183334
Senekal M, Nel JH, Malczyk S, Drummond L, Harbron J, Steyn NP. Provincial Dietary Intake Study (PDIS): Prevalence and Sociodemographic Determinants of the Double Burden of Malnutrition in A Representative Sample of 1 to Under 10-Year-Old Children from Two Urbanized and Economically Active Provinces in South Africa. International Journal of Environmental Research and Public Health. 2019; 16(18):3334. https://0-doi-org.brum.beds.ac.uk/10.3390/ijerph16183334
Chicago/Turabian StyleSenekal, Marjanne, Johanna H Nel, Sonia Malczyk, Linda Drummond, Janetta Harbron, and Nelia P Steyn. 2019. "Provincial Dietary Intake Study (PDIS): Prevalence and Sociodemographic Determinants of the Double Burden of Malnutrition in A Representative Sample of 1 to Under 10-Year-Old Children from Two Urbanized and Economically Active Provinces in South Africa" International Journal of Environmental Research and Public Health 16, no. 18: 3334. https://0-doi-org.brum.beds.ac.uk/10.3390/ijerph16183334