Influence of Skull Fracture on Traumatic Brain Injury Risk Induced by Blunt Impact

Abstract
:1. Introduction
2. Methods
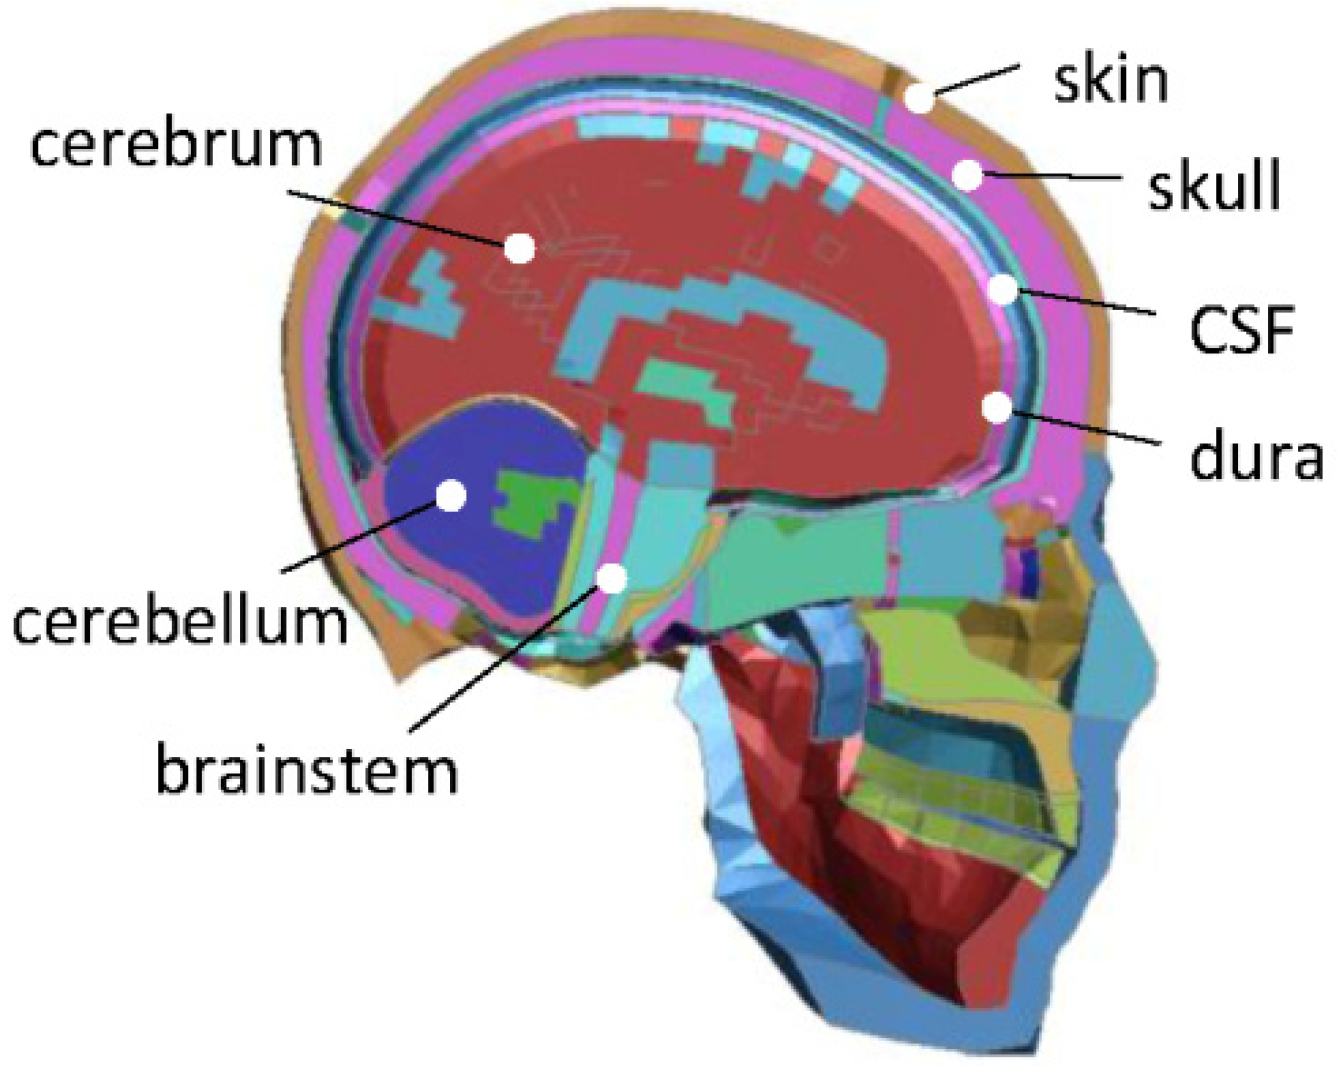
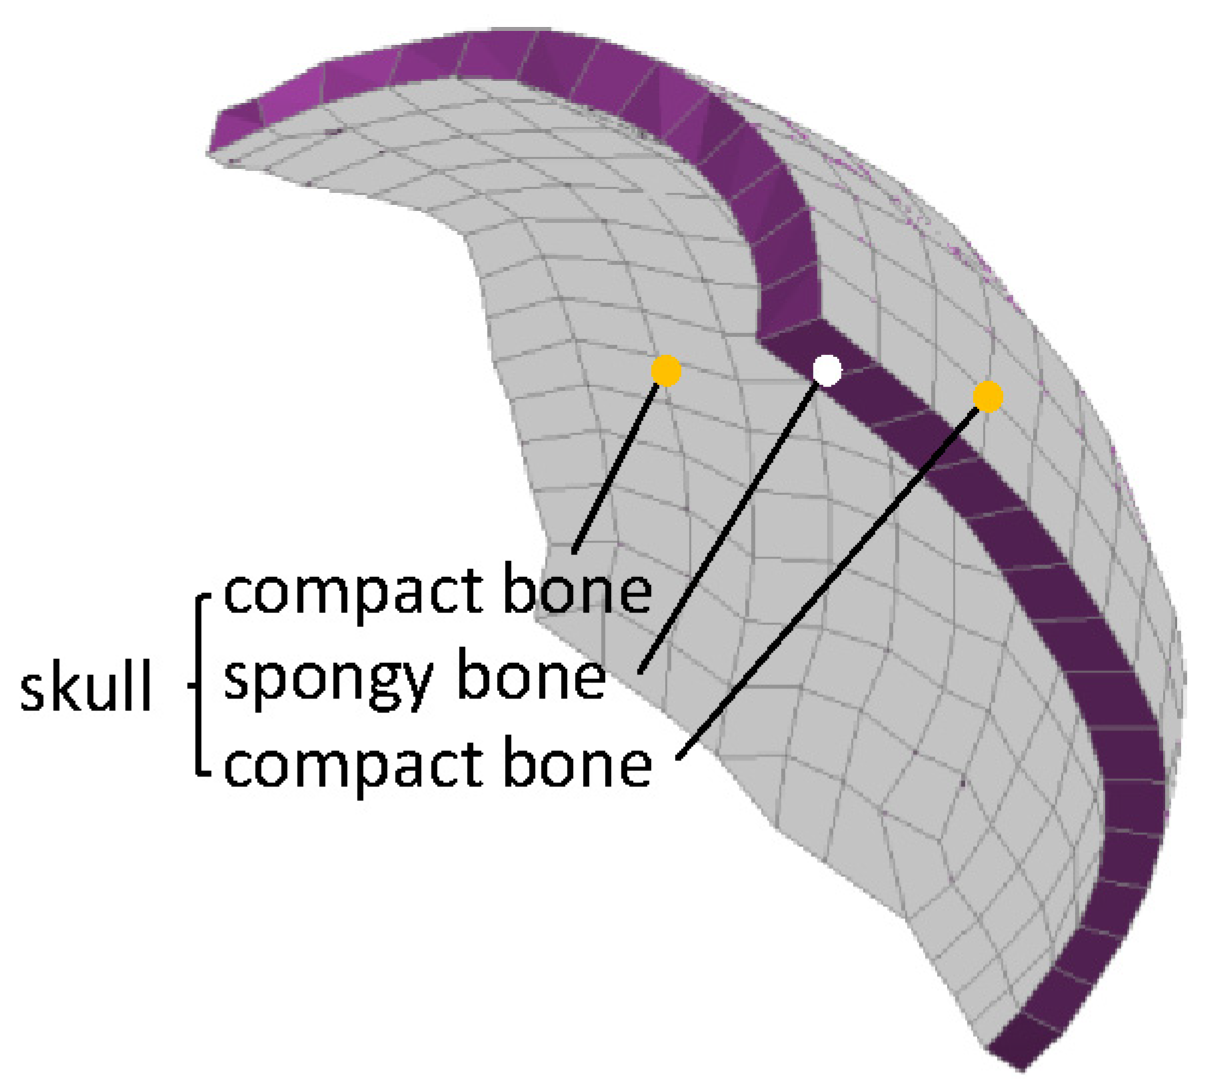
2.1. Head FE Model
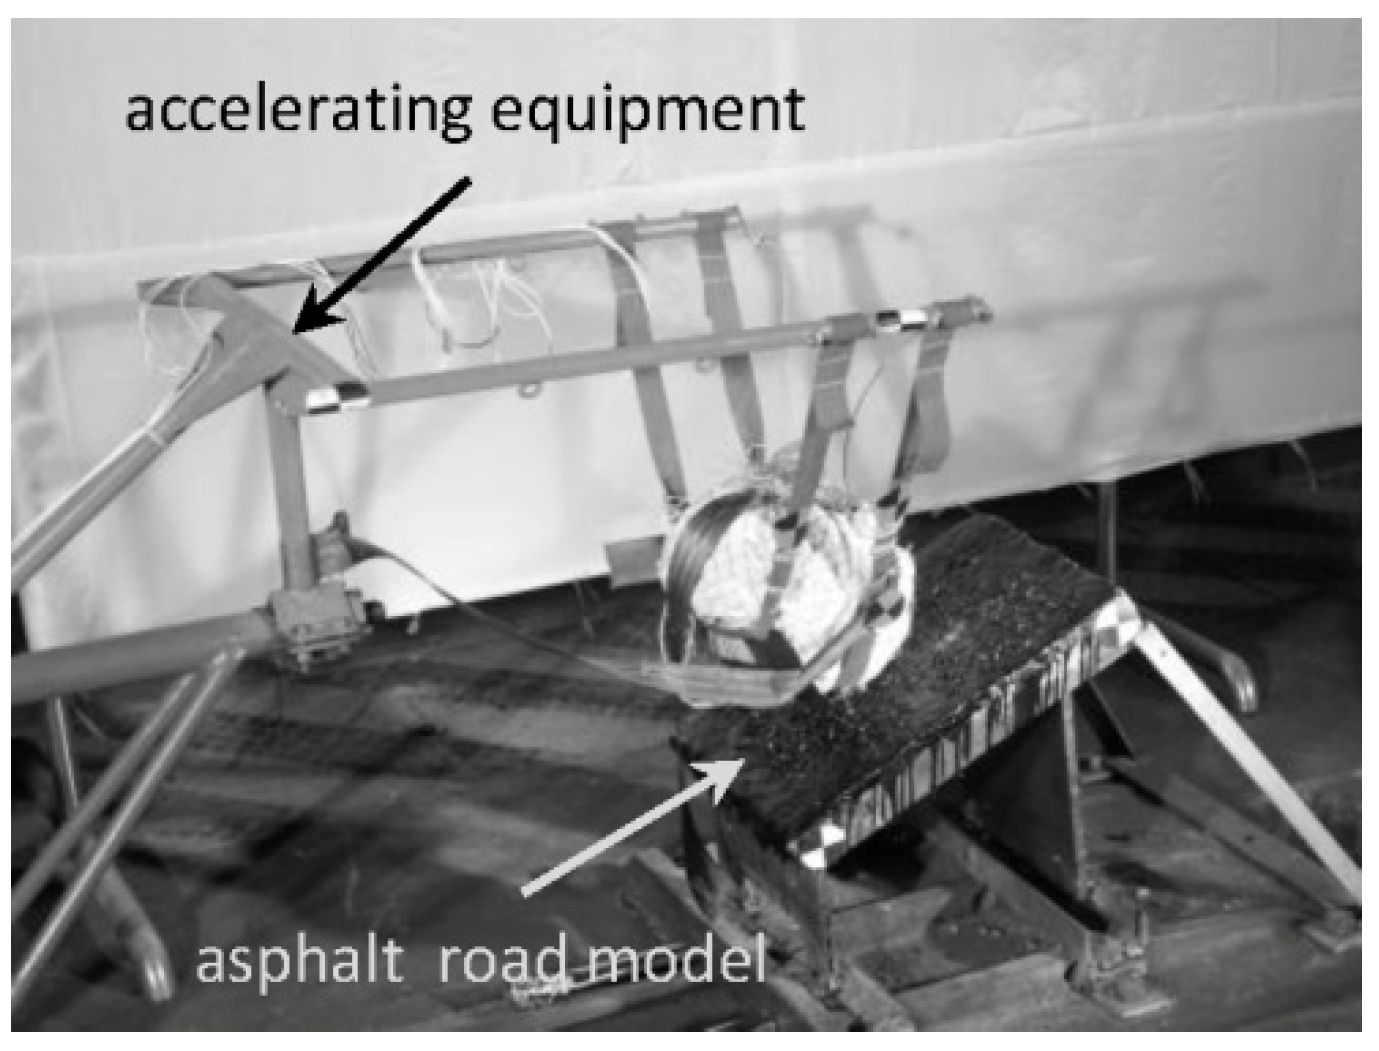
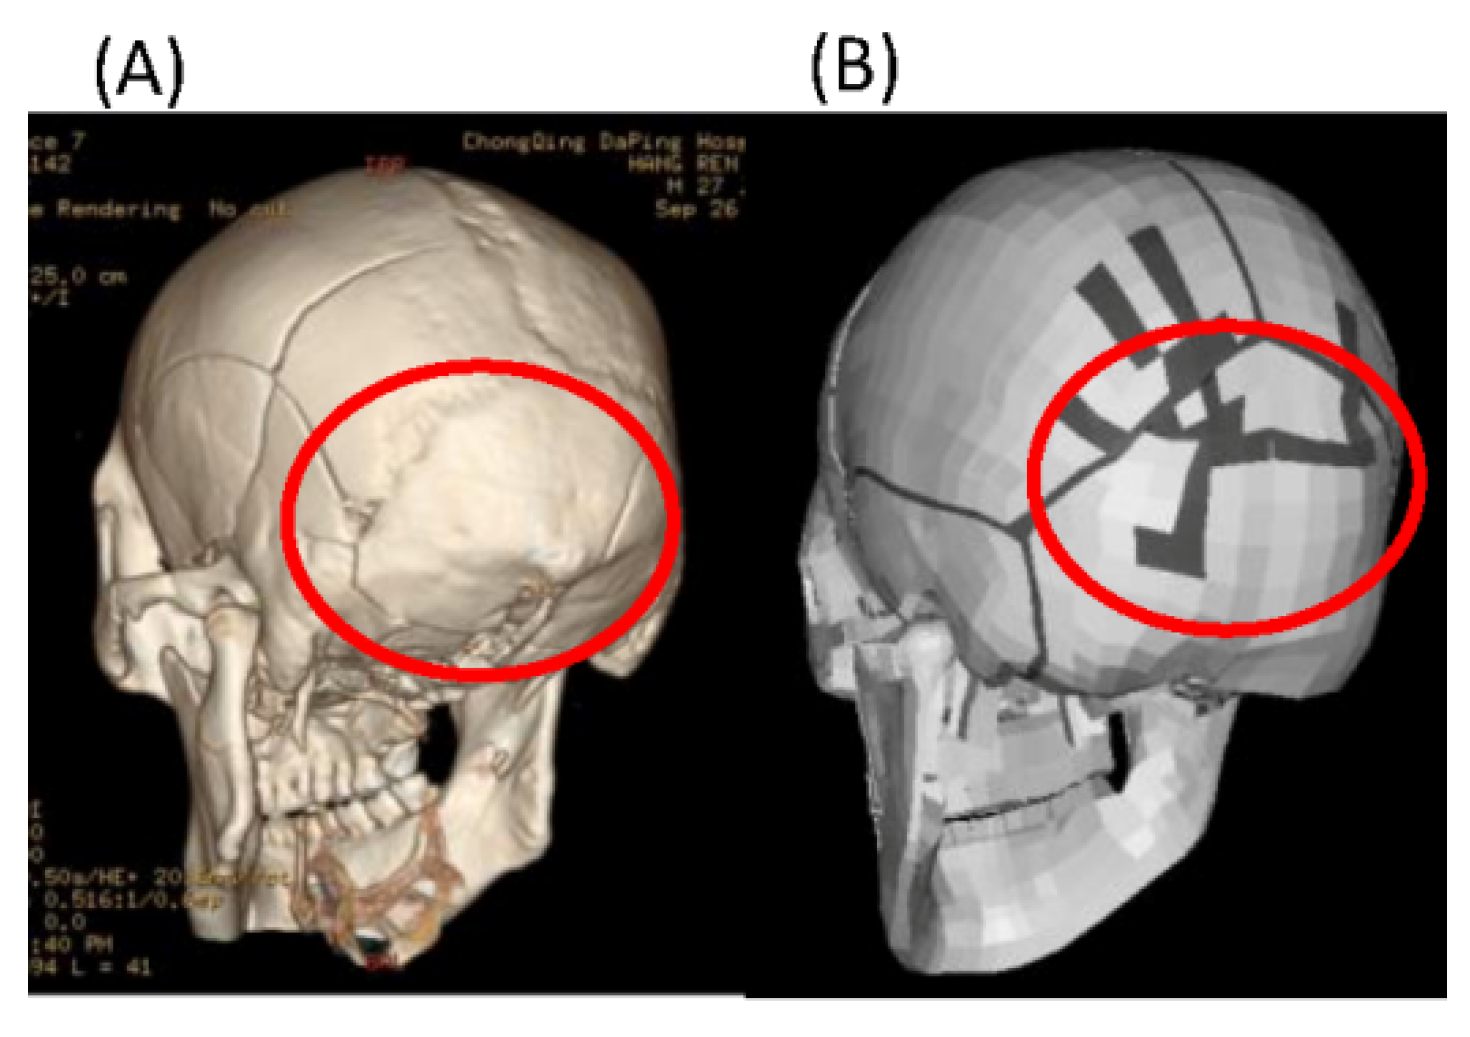
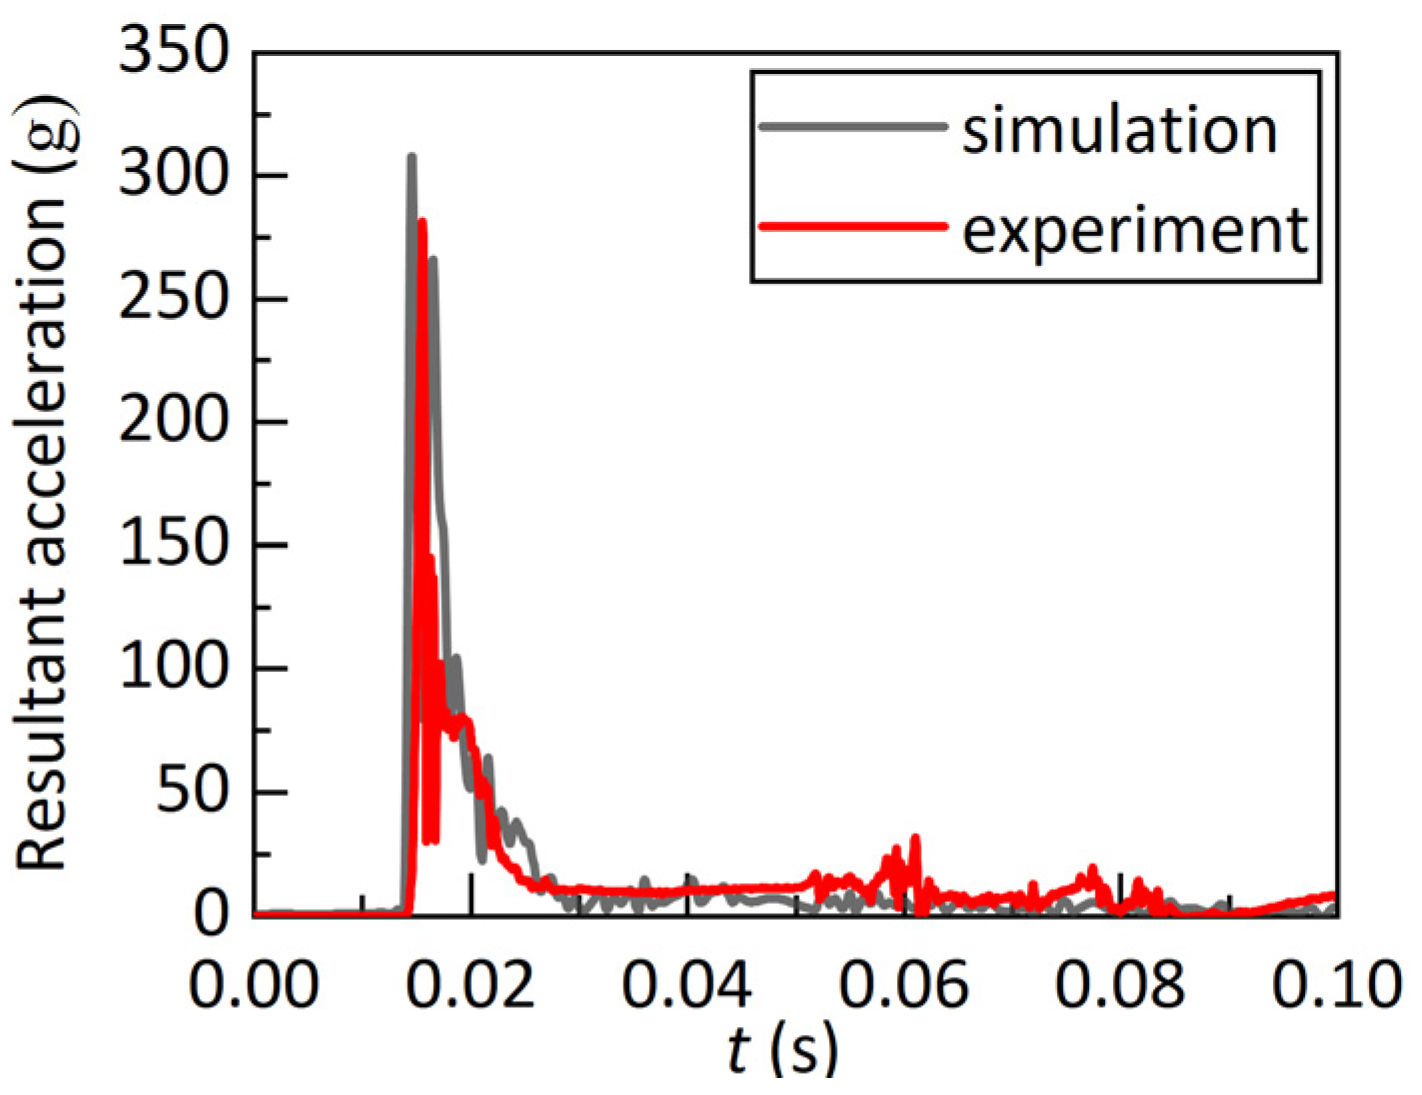
2.2. Skull Fracture Prediction Performance Validation
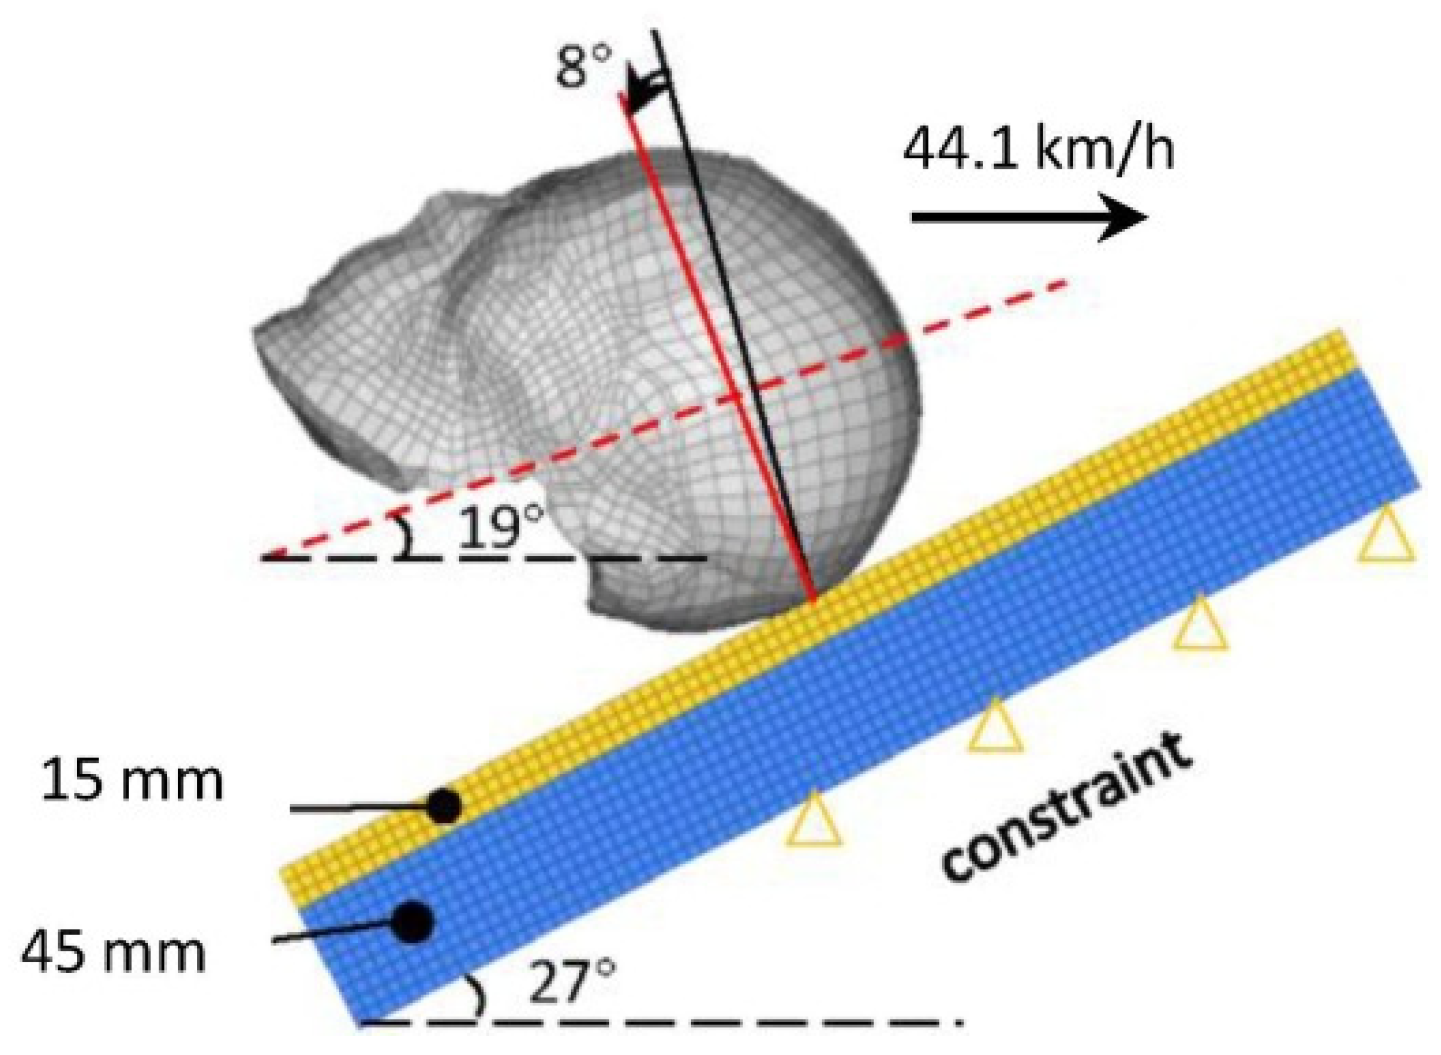
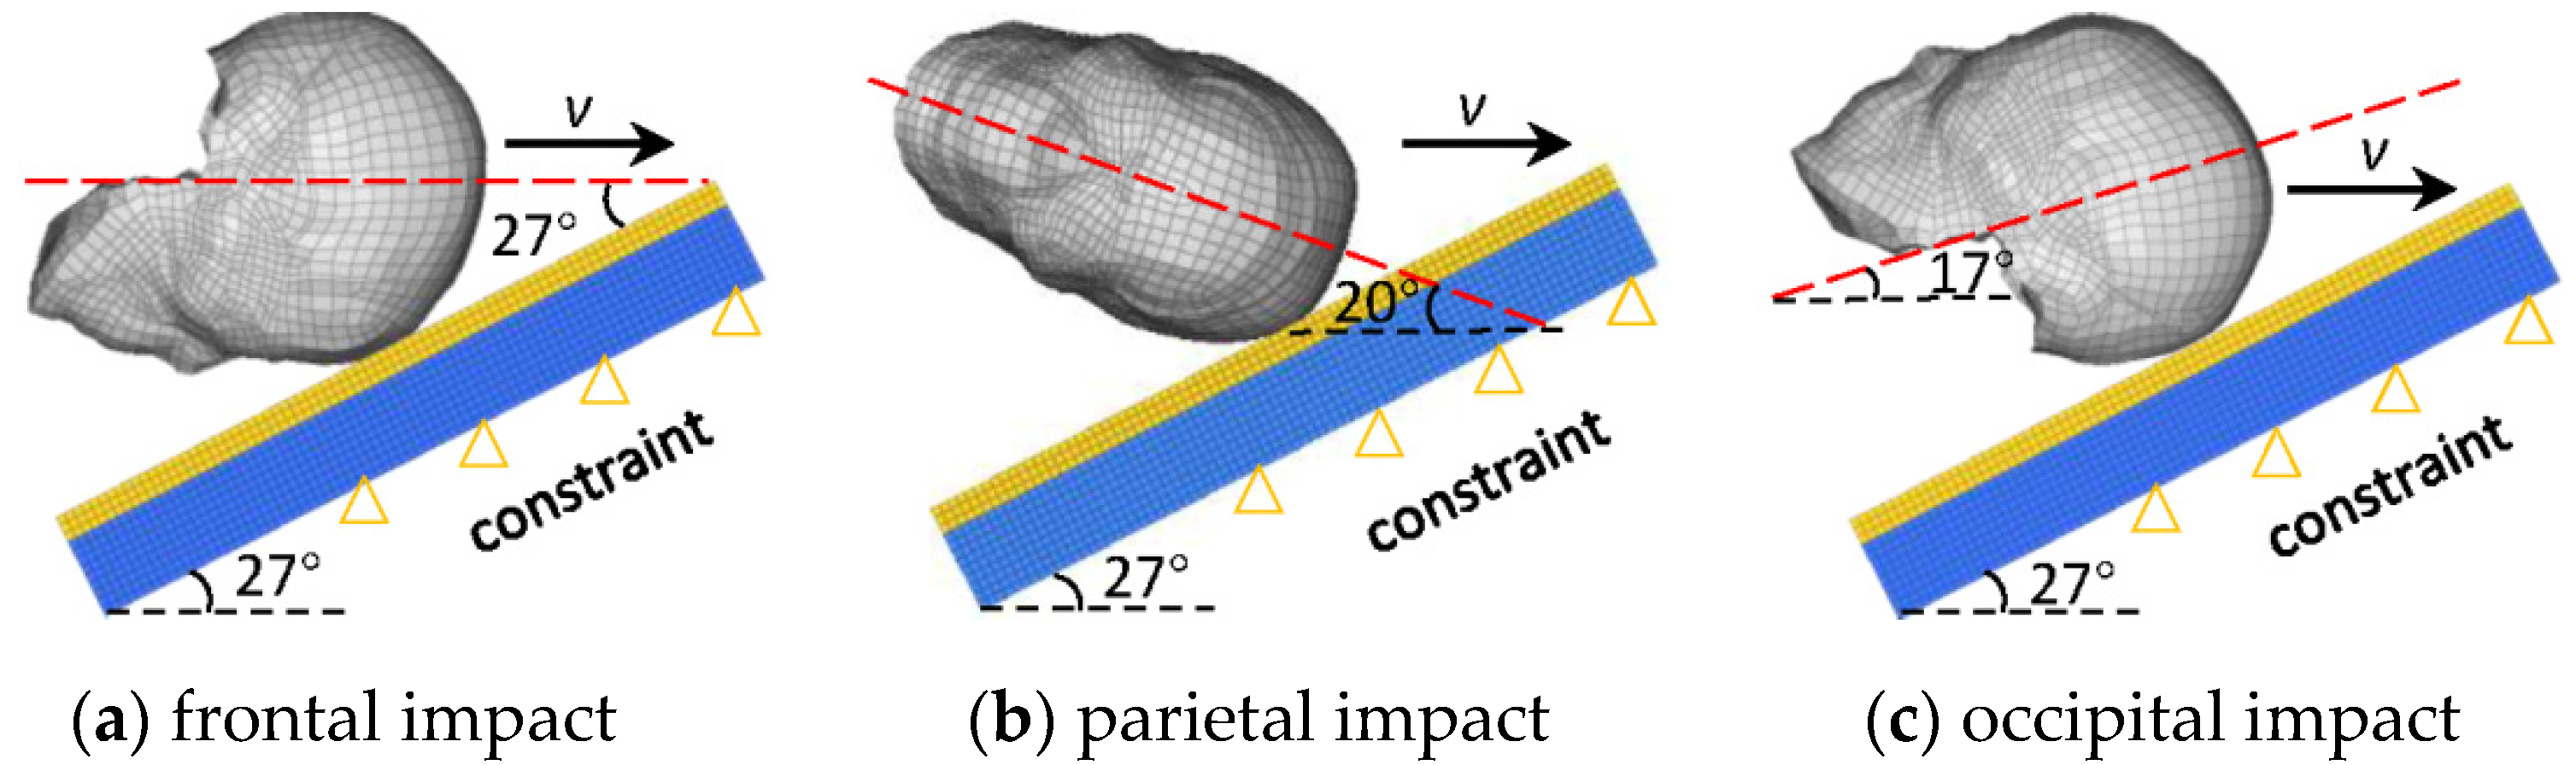
2.3. Head–Ground Impact Simulation Matrix
2.4. Intracranial Dynamic Response and Data Analysis
2.4.1. Intracranial Dynamic Responses
2.4.2. Data Analysis
3. Results
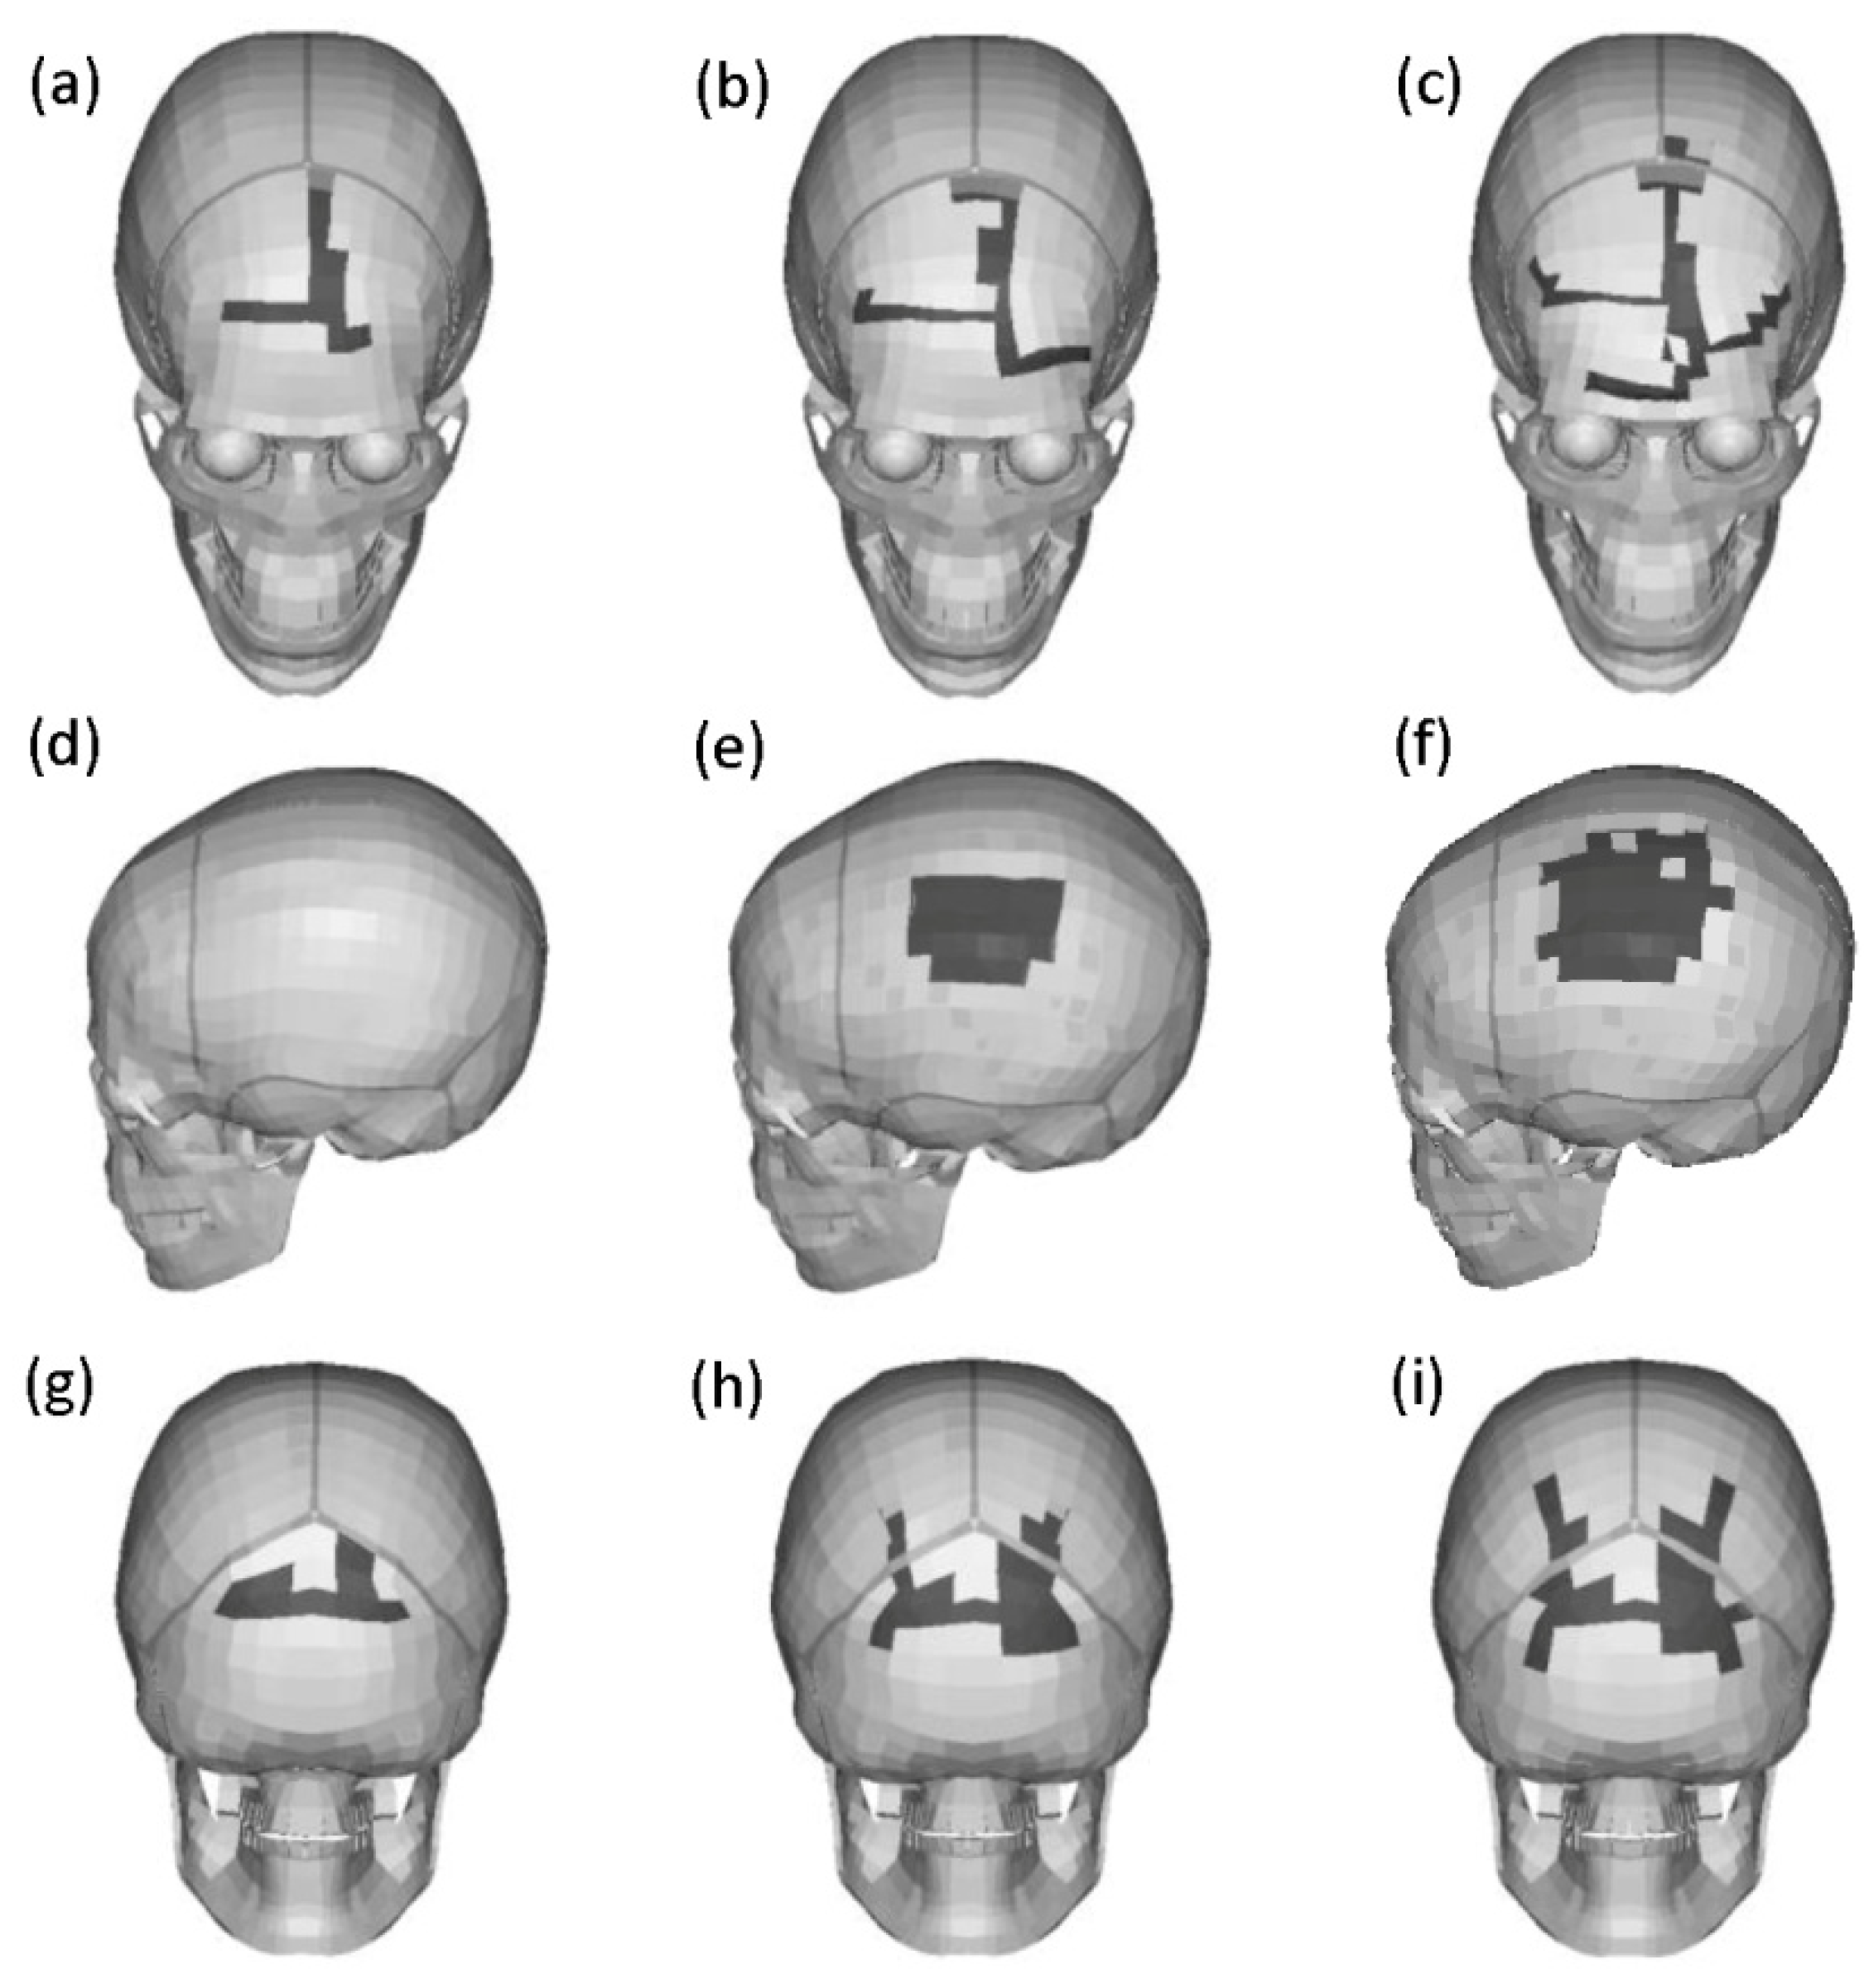
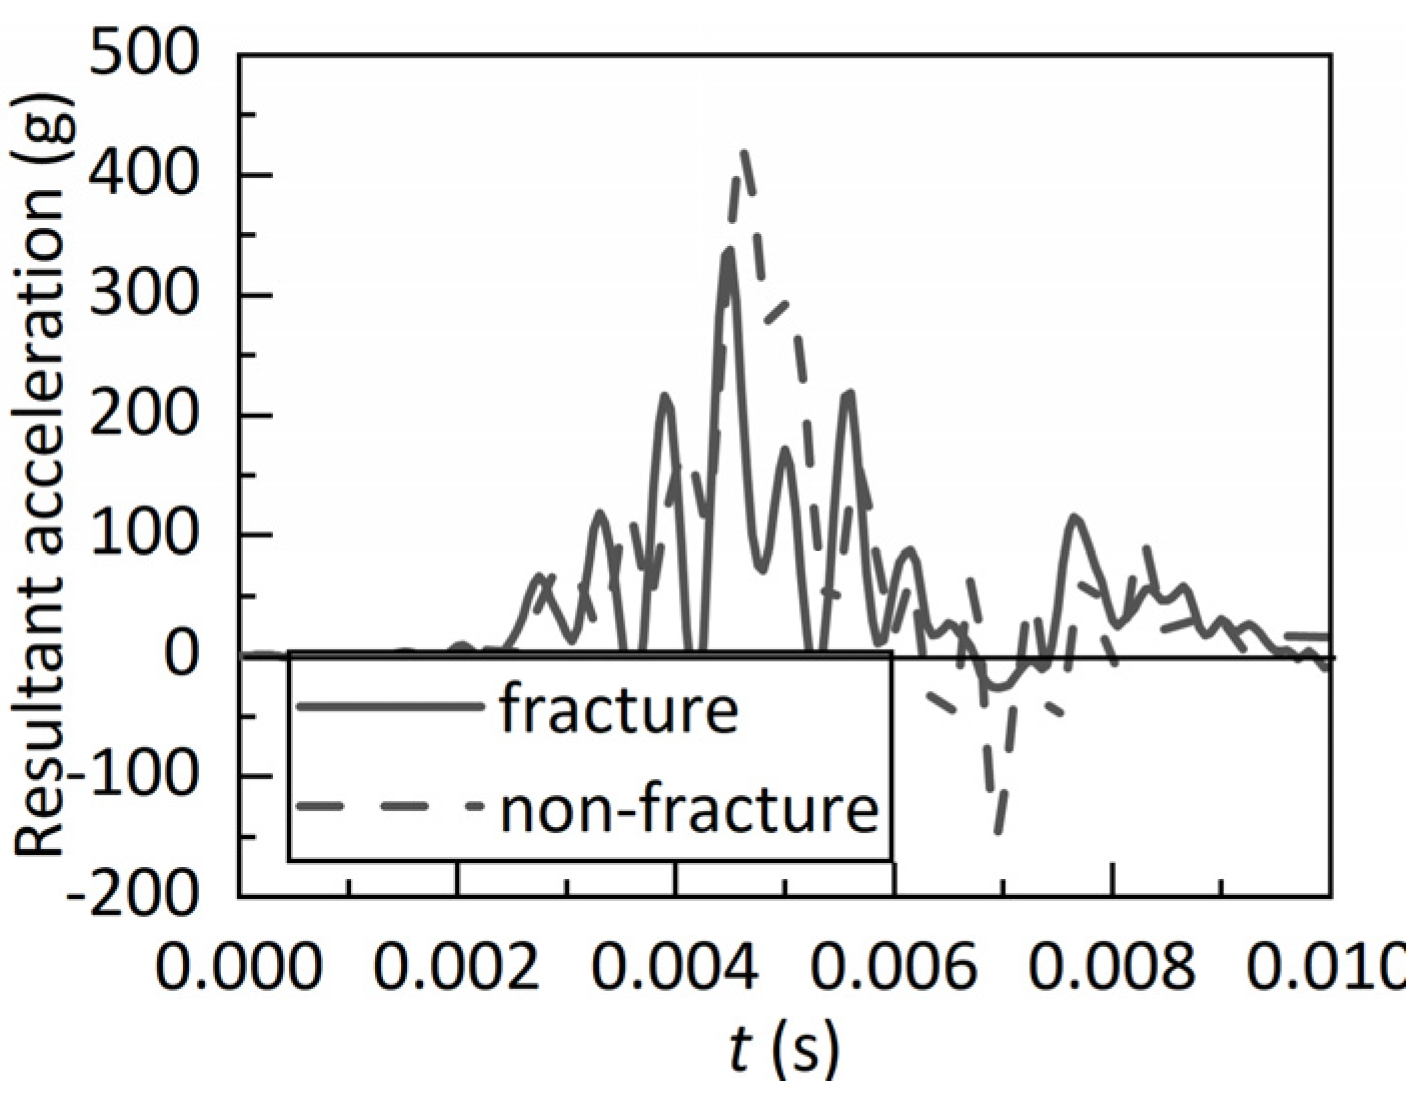
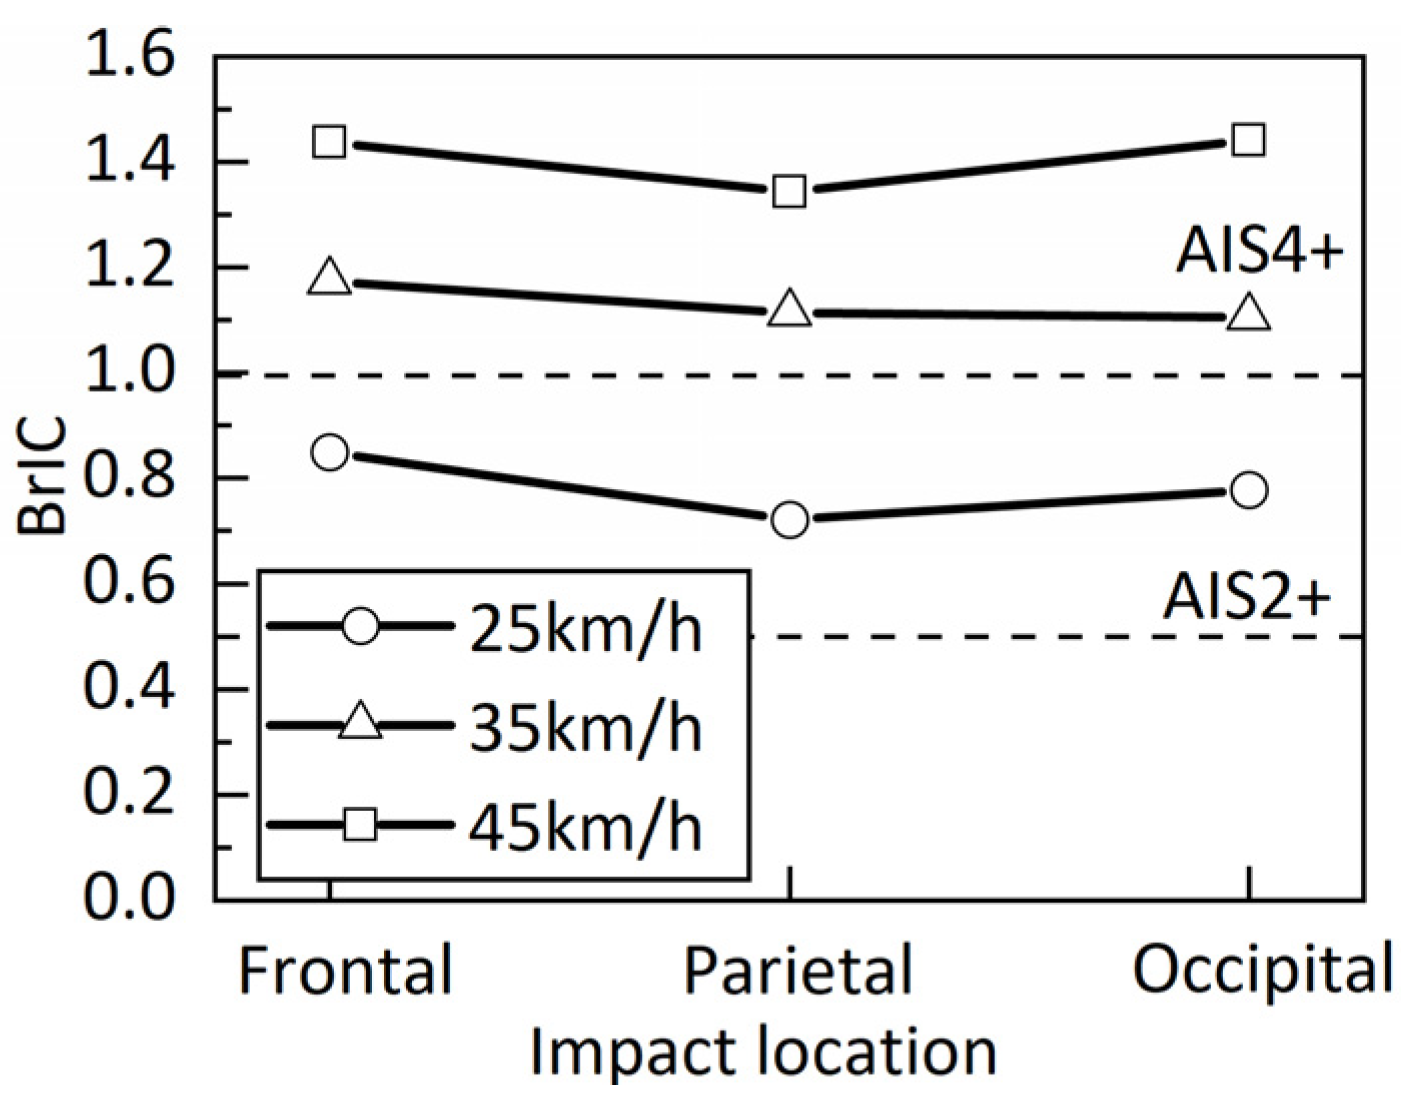
3.1. Skull Fractures and Head Kinematic Responses
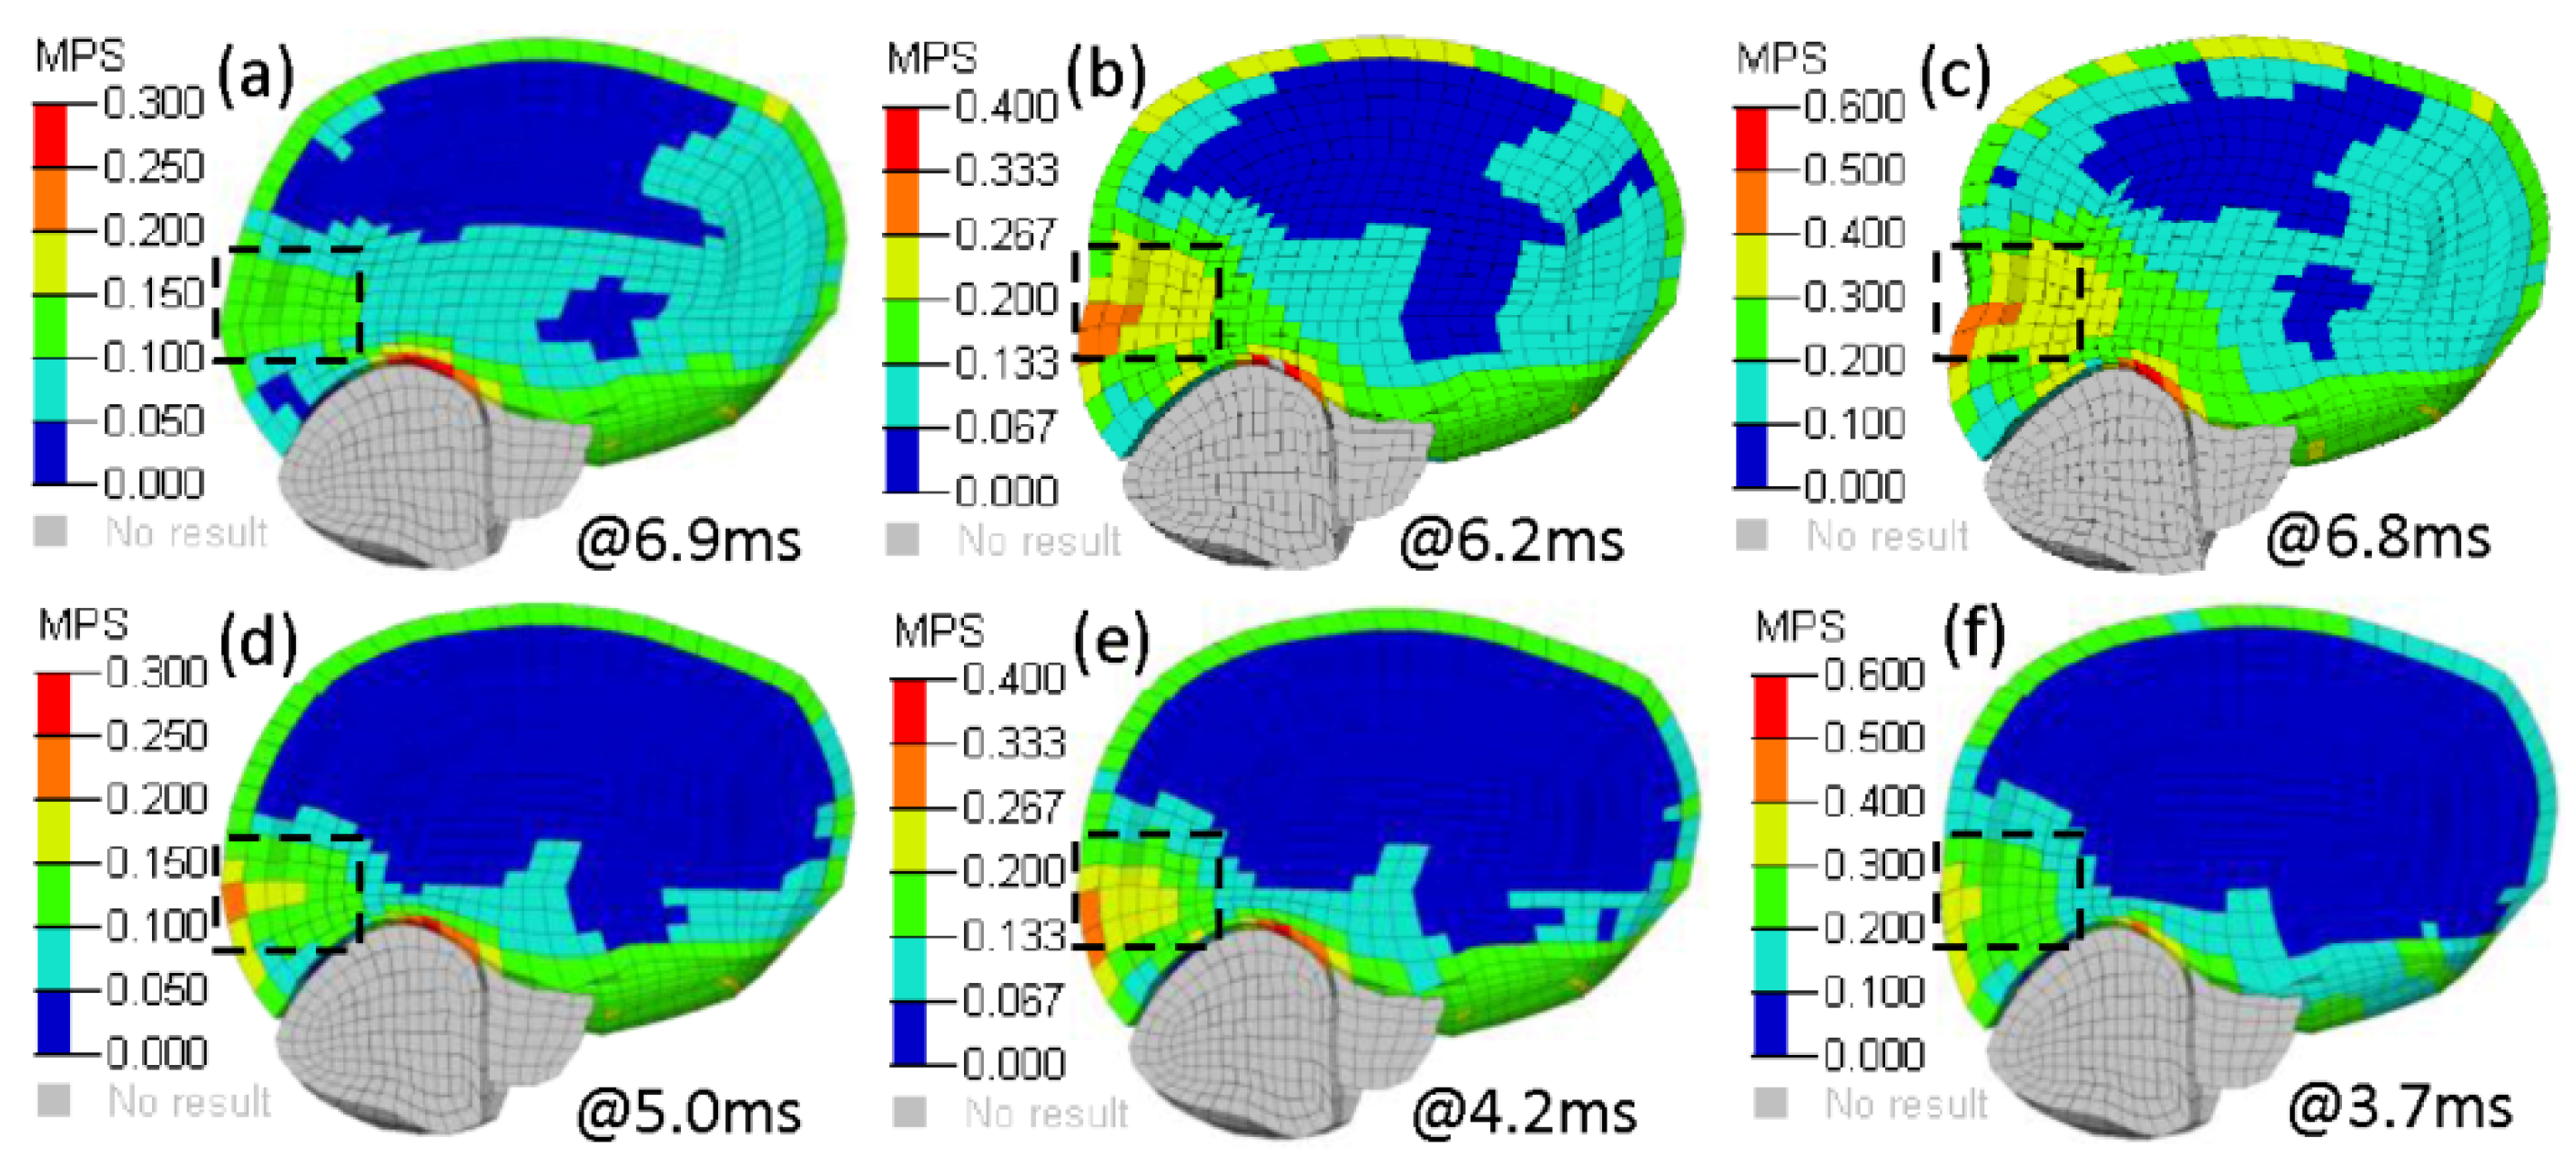
3.2. Strain Responses of Brain Tissue
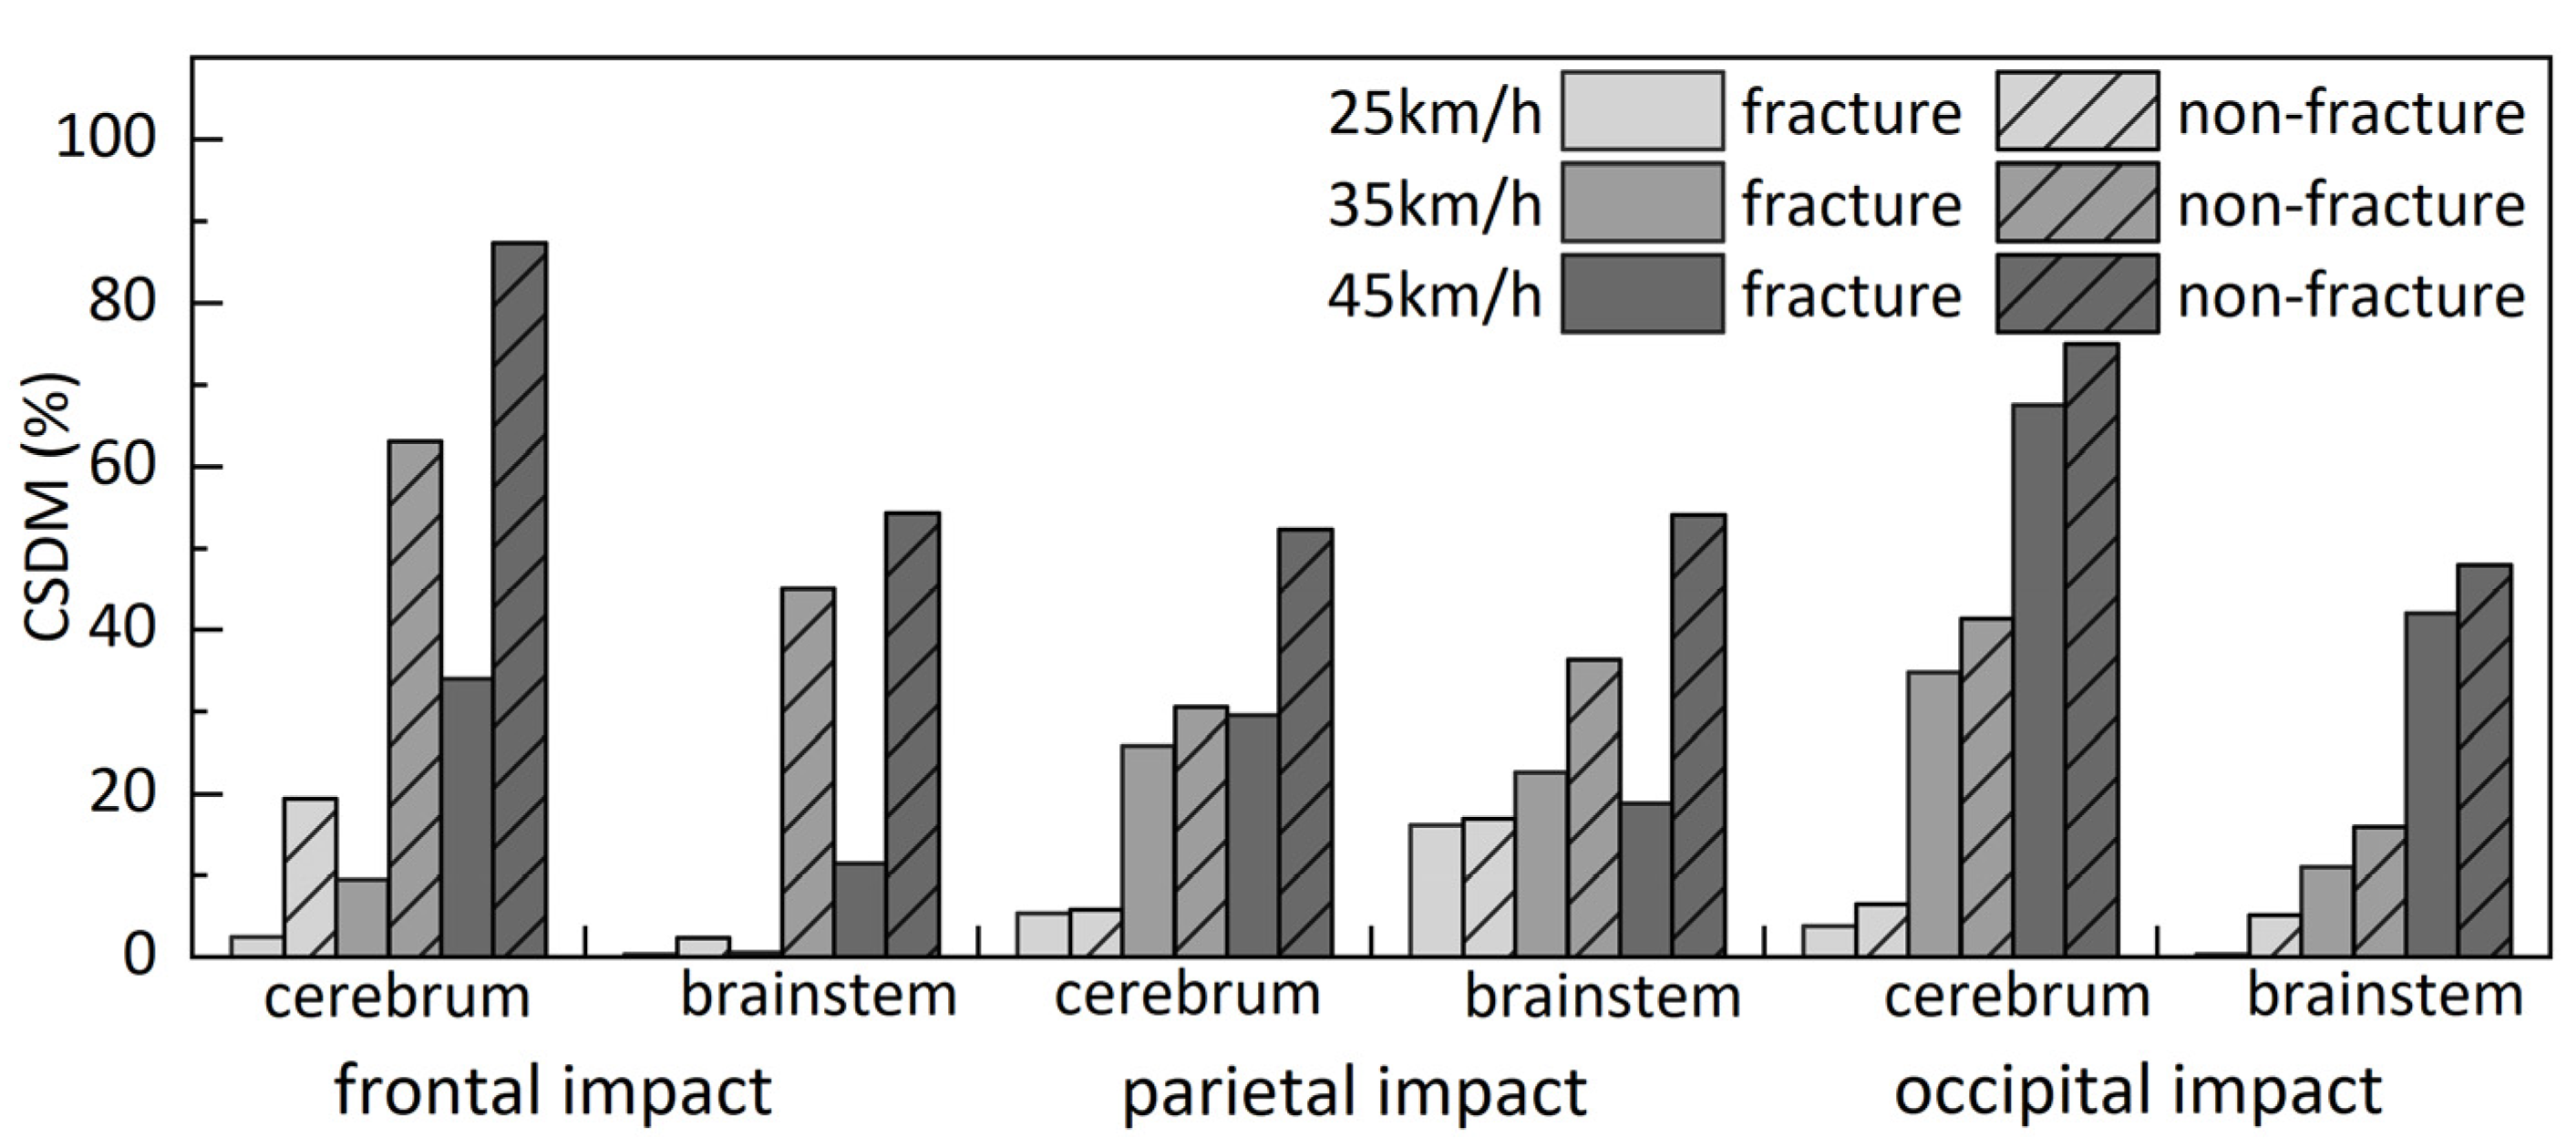
3.3. CSDM
4. Discussion
5. Conclusions
Author Contributions
Funding
Acknowledgments
Conflicts of Interest
References
- World Health Organization. Global Status Report on Road Safety. Available online: https://www.who.int/violence_injury_prevention/road_safety_status/2015/en/ (accessed on 20 December 2019).
- The Ministry of Public Security of the People’s Republic of China. Annual Report on Road Traffic Accidents of the People’s Republic of China (2017); The Ministry of Public Security of the People’s Republic of China: Beijing, China, 2018.
- Yavuz, M.S.; Aşırdizer, M.; Cetin, G.; Balci, Y.G.; Altınkök, M. The Correlation Between Skull Fractures and Intracranial Lesions Due To Traffic Accidents. Am. J. Forensic Med. Pathol. 2003, 24, 339–345. [Google Scholar] [CrossRef] [PubMed]
- Coronado, V.G.; Xu, L.; Basavaraju, S.V.; McGuire, L.C.; Wald, M.M.; Faul, M.; Guzman, B.R.; Hemphill, J.D. Surveillance for Traumatic Brain Injury-Related Deaths-United States, 1997–2007; Morbidity and Mortality Weekly Report; Centers for Disease Control and Prevention: Washington, DC, USA, 2011; Volume 60, pp. 1–32. [Google Scholar]
- Shang, S.; Otte, D.; Li, G.; Simms, C. Detailed assessment of pedestrian ground contact injuries observed from in-depth accident data. Accid. Anal. Prev. 2018, 110, 9–17. [Google Scholar] [CrossRef]
- Ahmad, S.; Afzal, A.; Rehman, L.; Javed, F. Impact of depressed skull fracture surgery on outcome of head injury patients. Pak. J. Med. Sci. 2018, 34, 130–134. [Google Scholar] [CrossRef] [PubMed]
- Faul, M.; Coronado, V. Epidemiology of traumatic brain injury. Handb. Clinic. Neurol. 2015, 127, 3–13. [Google Scholar] [CrossRef]
- Sahoo, D.; Deck, C.; Yoganandan, N.; Willinger, R. Development of skull fracture criterion based on real-world head trauma simulations using finite element head model. J. Mech. Behav. Biomed. Mater. 2016, 57, 24–41. [Google Scholar] [CrossRef] [PubMed]
- Huang, J.; Peng, Y.; Yang, J.; Otte, D.; Wang, B. A study on correlation of pedestrian head injuries with physical parameters using in-depth traffic accident data and mathematical models. Accid. Anal. Prev. 2018, 119, 91–103. [Google Scholar] [CrossRef] [PubMed]
- Yellinek, S.; Cohen, A.; Merkin, V.; Shelef, I.; Benifla, M. Clinical significance of skull base fracture in patients after traumatic brain injury. J. Clin. Neurosci. 2016, 25, 111–115. [Google Scholar] [CrossRef]
- Adams, J.H.; Doyle, D.; Ford, I.; Gennarelli, T.A.; Graham, D.I.; McLellan, D.R. Diffuse axonal injury in head injury: Definition, diagnosis and grading. Histopathology 1989, 15, 49–59. [Google Scholar] [CrossRef]
- Wang, Y.; Yuan, H. Diffuse Axonal Injury caused by traffic accidents in diagnosis and treatment of 46 cases. China Pract. Med. 2010, 5, 60–62. (In Chinese) [Google Scholar]
- Jacobo, A.-M.; Mikami, K.; Lindkvist, M.; Davidsson, J.; Schick, S. Accident analysis to support the development of strategies for the prevention of brain injuries in car crashes. Accid. Anal. Prev. 2018, 117, 98–105. [Google Scholar] [CrossRef]
- Carson, H.J. Brain trauma in head injuries presenting with and without concurrent skull fractures. J. Forensic Leg. Med. 2009, 16, 115–120. [Google Scholar] [CrossRef] [PubMed]
- Wood, R.L.; Eames, R. Application of behavior modification in the rehabilitation of traumatically brain-injured patients. In Applications of Conditioning Theory, 1st ed.; Davey, G., Ed.; Routledge: London, UK, 1981; pp. 81–101. [Google Scholar]
- Toyota Central R&D Laboratories. Toyota Motor Corporation Documentation: Total Human Model for Safety (THUMS); Toyota Central R&D Laboratories: Nagakute, Japan, 2011; pp. 26–29. [Google Scholar]
- Watanabe, R.; Miyazaki, H.; Kitagawa, Y.; Yasuki, T. Research of collision speed dependency of pedestrian head and chest injuries using human FE model (THUMS version 4). Accid. Reconstr. J. 2012, 22, 11–43. [Google Scholar]
- Wang, F.; Han, Y.; Wang, B.; Peng, Q.; Huang, X.; Miller, K.; Wittek, A. Prediction of brain deformations and risk of traumatic brain injury due to closed-head impact: Quantitative analysis of the effects of boundary conditions and brain tissue constitutive model. Biomech. Model. Mechanobiol. 2018, 17, 1165–1185. [Google Scholar] [CrossRef] [PubMed]
- Ren, L.; Wang, D.; Jiang, C.; Hu, Y. Influence of Foramen Magnum Boundary Condition on Intracranial Dynamic Response Under Forehead Impact Using Human Body Finite Element Model. Int. J. Comput. Methods 2019. [Google Scholar] [CrossRef]
- Yu, C.; Wang, F.; Wang, B.; Li, G.; Li, F. A Computational Biomechanics Human Body Model Coupling Finite Element and Multibody Segments for Assessment of Head/Brain Injuries in Car-To-Pedestrian Collisions. Int. J. Environ. Res. Public Health 2020, 17, 492. [Google Scholar] [CrossRef] [Green Version]
- Wang, F.; Yu, C.; Wang, B.; Li, G.; Miller, K.; Wittek, A. Prediction of pedestrian brain injury due to vehicle impact using computational biomechanics models: Are head-only models sufficient? Inj. Prev. 2019, 21, 102–107. [Google Scholar] [CrossRef]
- Kimpara, H.; Nakahira, Y.; Iwamoto, M.; Miki, K.; Ichihara, K.; Kawano, S.; Taguchi, T. Investigation of anteroposterior head-neck responses during severe frontal impacts using a brain-spinal cord complex FE model. Stapp Car Crash J. 2006, 50, 509–544. [Google Scholar] [CrossRef]
- Wood, J.L. Dynamic response of human cranial bone. J. Biomech. 1971, 4, 1–12. [Google Scholar] [CrossRef]
- Li, Z.; Kindig, M.W.; Kerrigan, J.; Untaroiu, C.; Subit, D.; Crandall, J.R.; Kent, R.W. Rib fractures under anterior–posterior dynamic loads: Experimental and finite-element study. J. Biomech. 2010, 43, 228–234. [Google Scholar] [CrossRef]
- Frida, A. Finite Element Modeling of Skull Fractures-material Model Improvements of the Skull Bone in the KTH FE Head Model. Master’s Thesis, KTH Royal Institute of Technology, Stockholm, Sweden, 2016. [Google Scholar]
- Cheng, Y. Head Injury Causation in Car Rollover Crashes. Ph.D. Thesis, The University of Birmingham, Birmingham, UK, 2008. [Google Scholar]
- Highway Planning and Design Institute of the Ministry of Transport. Specifications for Design Highway Asphalt Pavement; China Communications Press: Beijing, China, 1997. (In Chinese) [Google Scholar]
- Grünert, J.; Hardy, R.; Neal-Sturgess, C.; Joonekindt, S.; Yang, J.; Yao, J.; Baumgartner, D.; Guerra, L.; Martinez, L. Assessment of the Relevance of the Secondary (Ground) Impact and Its Influence on Jnjuries; APROSYS Document AP-SP32-010R, Deliverable D3.2.4; Nederlandse Organisation for Applied Scientific Research(TNO): Helmond, The Netherlands, 2007; pp. 14–15. [Google Scholar]
- Simms, C.; Wood, D.P. Effects of pre-impact pedestrian position and motion on kinematics and injuries from vehicle and ground contact. Int. J. Crashworthiness 2006, 11, 345–355. [Google Scholar] [CrossRef]
- Xu, J.; Shang, S.; Qi, H.; Yu, G.; Wang, Y.; Chen, P. Simulative investigation on head injuries of electric self-balancing scooter riders subject to ground impact. Accid. Anal. Prev. 2016, 89, 128–141. [Google Scholar] [CrossRef] [PubMed]
- Takhounts, E.G.; Craig, M.J.; Moorhouse, K.; McFadden, J.; Hasija, V. Development of brain injury criteria (BrIC). Stapp Car Crash J. 2013, 57, 243–266. [Google Scholar] [PubMed]
- Mao, H.; Zhang, L.; Yang, K.H.; King, A.I. Application of a finite element model of the brain to study traumatic brain injury mechanisms in the rat. Stapp Car Crash J. 2006, 50, 583–600. [Google Scholar] [PubMed]
- Mao, H.; Yang, K.H. Investigation of brain contusion mechanism and threshold by combining finite element analysis with in vivo histology data. Int. J. Numer. Methods Biomed. Eng. 2010, 27, 357–366. [Google Scholar] [CrossRef]
- Takhounts, E.G.; Ridella, S.A.; Hasija, V.; Tannous, R.E.; Campbell, J.; Malone, D.; Danelson, K.; Stitzel, J.; Rowson, S.; Duma, S. Investigation of traumatic brain injuries using the next generation of simulated injury monitor (SIMon) finite element head model. Stapp Car Crash J. 2008, 52, 402–432. [Google Scholar] [CrossRef]
- Ren, L.; Baumgartner, D.; Yang, J.; Davidsson, J.; Willinger, R. Investigation of diffuse axonal injury induced by rotational acceleration via numerical reconstructions of in vivo rat head impact experiments. Int. J. Crashworthiness 2015, 20, 602–612. [Google Scholar] [CrossRef]
- Takhounts, E.G.; Eppinger, R.H.; Campbell, J.; Tannous, R.E.; Power, E.D.; Shook, L.S. On the Development of the SIMon Finite Element Head Model. Stapp Car Crash J. 2003, 47, 107–133. [Google Scholar] [CrossRef] [Green Version]
- Sahoo, D.; Deck, C.; Yoganandan, N.; Willinger, R. Anisotropic composite human skull model and skull fracture validation against temporo-parietal skull fracture. J. Mech. Behav. Biomed. Mater. 2013, 28, 340–353. [Google Scholar] [CrossRef]
- Mao, H.; Zhang, L.; Jiang, B.; Genthikatti, V.V.; Jin, X.; Zhu, F.; Makwana, R.; Gill, A.; Jandir, G.; Singh, A.; et al. Development of a Finite Element Human Head Model Partially Validated With Thirty Five Experimental Cases. J. Biomech. Eng. 2013, 135, 111002–111015. [Google Scholar] [CrossRef]
- Van Lierde, C.; Depreitere, B.; Sloten, J.V.; Van Auderkercke, R.; Van Der Perre, G.; Goffin, J. Skull biomechanics: The energy absorbability of the human skull frontal bone during fracture under quasi-static loading. J. Appl. Biomater. Biomech. 2003, 1, 194–199. [Google Scholar]
- Kleiven, S. Why Most Traumatic Brain Injuries are Not Caused by Linear Acceleration but Skull Fractures are. Front. Bioeng. Biotechnol. 2013, 1. [Google Scholar] [CrossRef] [PubMed] [Green Version]


| Structure | Density/ (kg/m3) | Elasticity Modulus (MPa) | Poisson’s Ratio | Material Model |
|---|---|---|---|---|
| asphalt | 1600 | 5400 | 0.35 | linear elastic |
| roadbed | 1600 | 9300 | 0.35 | linear elastic |
© 2020 by the authors. Licensee MDPI, Basel, Switzerland. This article is an open access article distributed under the terms and conditions of the Creative Commons Attribution (CC BY) license (http://creativecommons.org/licenses/by/4.0/).
Share and Cite
Ren, L.; Wang, D.; Liu, X.; Yu, H.; Jiang, C.; Hu, Y. Influence of Skull Fracture on Traumatic Brain Injury Risk Induced by Blunt Impact. Int. J. Environ. Res. Public Health 2020, 17, 2392. https://0-doi-org.brum.beds.ac.uk/10.3390/ijerph17072392
Ren L, Wang D, Liu X, Yu H, Jiang C, Hu Y. Influence of Skull Fracture on Traumatic Brain Injury Risk Induced by Blunt Impact. International Journal of Environmental Research and Public Health. 2020; 17(7):2392. https://0-doi-org.brum.beds.ac.uk/10.3390/ijerph17072392
Chicago/Turabian StyleRen, Lihai, Dangdang Wang, Xi Liu, Huili Yu, Chengyue Jiang, and Yuanzhi Hu. 2020. "Influence of Skull Fracture on Traumatic Brain Injury Risk Induced by Blunt Impact" International Journal of Environmental Research and Public Health 17, no. 7: 2392. https://0-doi-org.brum.beds.ac.uk/10.3390/ijerph17072392