1. Introduction
Depression is a common mental health disorder worldwide. It significantly affects physical health and daily life including declining physical function and quality of life, falling tired or distracted, and having sleeping or eating problems. To estimate, until 2017, around 4.4% of the population worldwide (with more than 300 million) were affected by depression [
1].
Previous studies have shown that females, young adults, low level of education, without a spouse, low income, health illness, and lack of social and physical activity are the potential risk factors of being depressed [
2,
3]. Other research has provided evidence of the relationships between social-ecological environments and health outcomes [
4,
5]. For example, population density, economic deprivation, neighborhood violence, crime, and safety are highly correlated to depression [
6,
7]. Thus, multi-level analyses are often suggested to explore the effects of environmental features on depression symptoms [
8,
9].
However, most of the previous studies exploring factors associated with depression in Taiwan have focused more on individual characteristics and indicated that females, unemployment, low education level, and poor health were the risk factors of depression [
10,
11,
12]. Scarce studies have examined the relationships between social-economic environments and depression. Only two recent studies by Liu et al. (2020) and Liu (2021) were found to investigate the effects of social-economic environments on health, where their outcome variables were dementia and mortality, while the social-economic indicators differed from a case to another [
13,
14].
In fact, the social-economic environments vary in different countries, and the impacts on mental health are inconsistent [
15,
16,
17]. Behanova et al. (2013) examined the association between the neighborhood unemployment rates and mental health problems by a direct comparison of a Central and a Western European country, Slovakia and the Netherlands, respectively. Both countries showed a similar prevalence of mental health problems (39.3% vs. 39.2%, respectively). However, results showed that a gradient relationship of area unemployment and mental health problem was observed in the Netherlands, instead of a smooth pattern in Slovakia. In addition, the difference between Slovakia and the Netherlands cannot be interpreted by individual-level socioeconomic characteristics. A possible explanation for the result may be that both countries are at different stages of economic development. Slovakia has been transformed from a formerly centrally planned economy into a market economy and joined the European Union in 2004. The Netherlands is one of the founding members of the European Union and its GDP was the top 17th in the world in 2019. Furthermore, the unemployment rate in the Netherlands (5.3%) was lower than in Slovakia (14%) [
15]. Hence, economic growth situation and operate strategies in different countries impact differently on mental health.
Taiwan is a small economy that used to be known as one of the four Asian tigers with different social and economic environments from Western countries. Minimal studies have explored the associations between social-economic environments and depression in Taiwan. The purpose of the study was to use multi-level analysis to examine the effects of the social-economic features on depressive symptoms among Taiwanese adults.
2. Materials and Methods
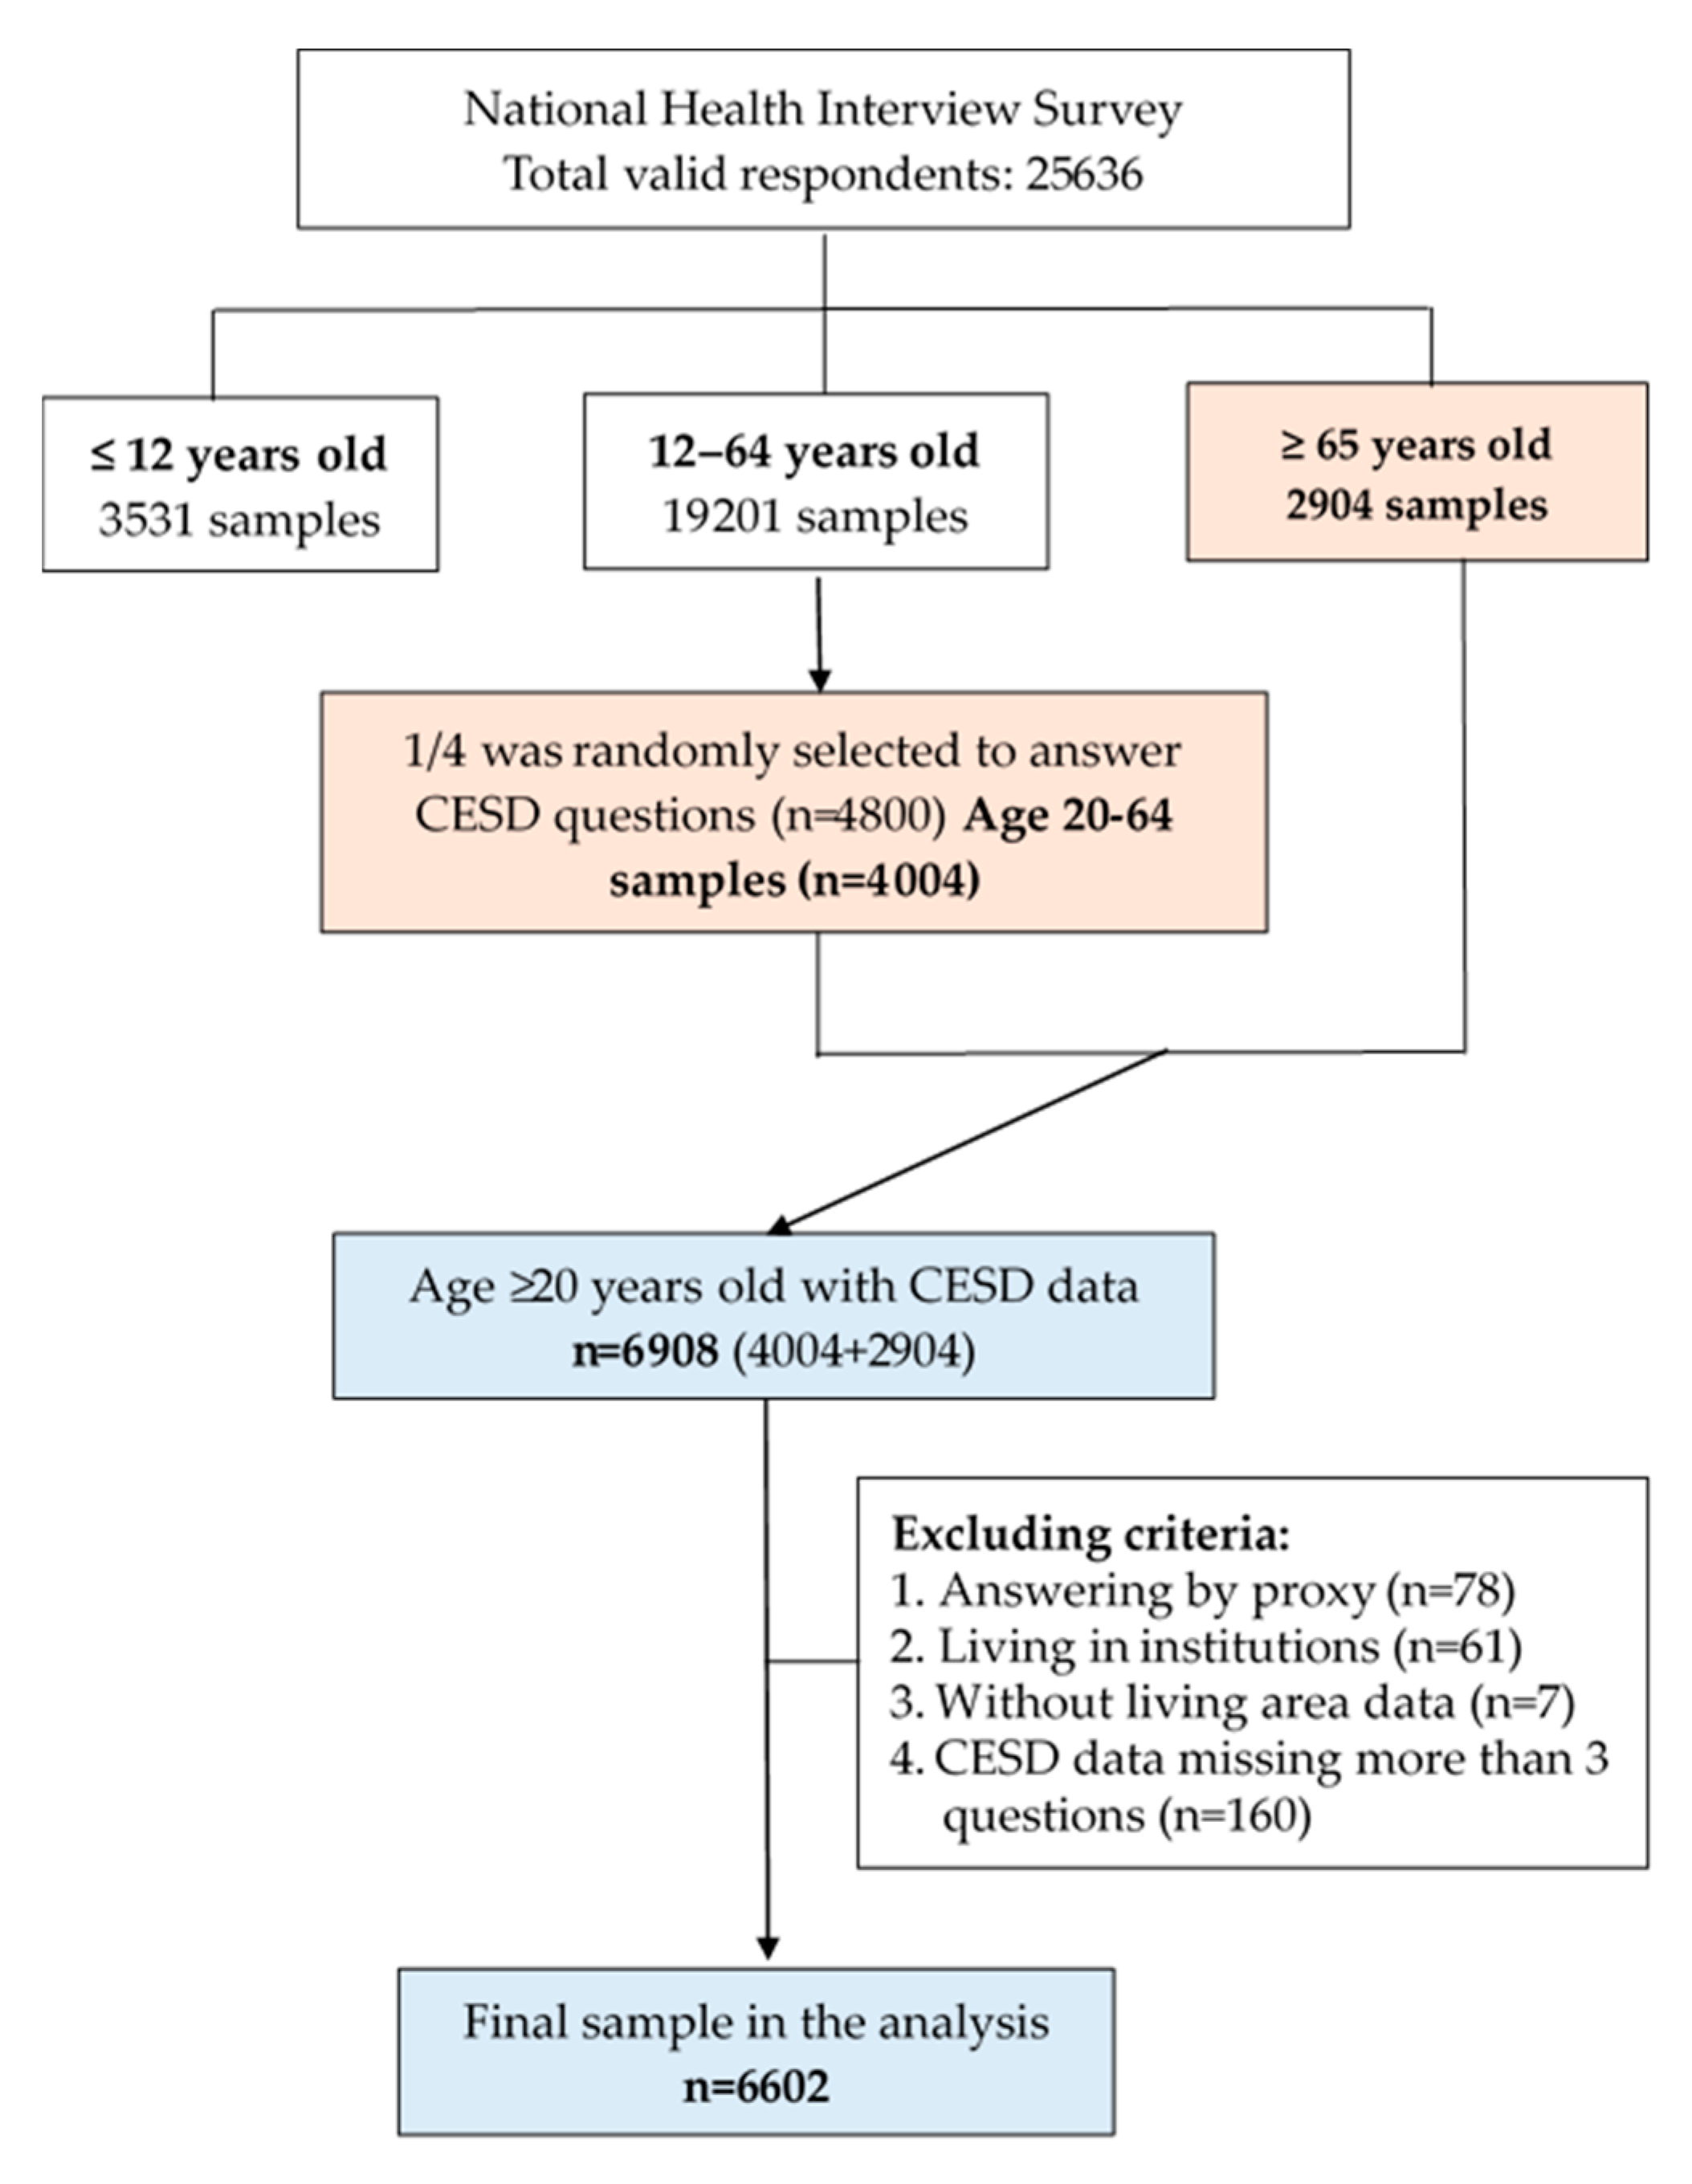
Two nationwide datasets including the 2009 National Health Interview Survey (NHIS) and the Age-Friendly Environment database-city/county level were used with a multi-level design in this cross-sectional study. The 2009 NHIS is a representative survey of each county and municipality in Taiwan using multi-stage stratified systematic sampling methods with a probability proportional to population size. A total of 25,636 participants (response rate of 83.96%) were interviewed, covering questions including demographic characteristics, health status, health services utilization, health literacy, and lifestyles, and was divided into three age groups: under 12 years (3531 samples), 12–64 years (19,201 samples), and over 65 years of age (2904 samples).
Figure 1 presents the procedure of participant enrollment. Since four additional module questionnaires were added in the age group of 12–64, only one-quarter of the participants were randomly selected to answer one module questionnaire. Hence, 4404 adults aged 20–64 years old answered the Chinese version of the Center for Epidemiological Studies Depression Scale (CESD). Thus, a total of 6908 adults aged 20 years and older were initially recruited in the study, and 6602 adults ≥ aged 20 years were finally included in the analysis after excluding those living in institutions (
n = 61), not self-reported (
n = 78), without living area data (
n = 7), and missing more than three questions of CESD (
n = 160).
2.1. Measurement
2.1.1. Outcome Variable: Depressive Symptoms
This study used a 10-item Chinese version of the CESD abbreviated from the original English version to measure depressive symptoms [
18,
19]. This scale has been tested with good validity and reliability in the Taiwan Longitudinal Study on Aging [
20] and implemented in other studies [
21,
22]. The severity of each item was scored from 0 (rarely or none of the time) to 3 (most or all of the time). The total score ranges from 0 to 30, and a recommend cutoff of ≥10 is suggested to detect depressive symptoms [
20,
23]. Accordingly, both the continuous (CESD score) and dichotomous (depression yes/no) outcomes of the CESD scale were adopted in this study.
2.1.2. Study Variables: Social and Economic Environments
Variables of the social-economic environments were obtained from the Age-Friendly Environment Dataset at the city-county level in Taiwan [
24]. All indicators in this dataset were collected from the open-access data and national surveys from governments.
First of all, eight environmental factors at the ecological level in the same year of NHIS were examined in the analysis. Namely, social factors included population density (persons/km2), divorce rate (%), crime rate (events per 100,000 persons), and educational level (% of college and above). Economic factors consisted of the unemployment rate (%), per capita disposable income (NT$), per capita government expenditures (NT$), and the percentage of low-income households (%).
Then, the Spearman correlation and the variance inflation factor (VIF) were assessed to prevent multicollinearity before performing multi-level regression models. Here, we found that educational level showed a high correlation (coefficient > 0.7) with other variables including population density, crime rate, and per capita disposable income. In addition, the VIF of the low-income households (%) was greater than 4 in the models. Thus, we deleted these two ecological variables in the analysis.
Finally, only six social-economic factors were examined in this study including three social environments (population density, divorce rate, and crime rate) and three economic factors (unemployment rate, per capita disposable income, and per capita government expenditures). As the skewness still appeared after using several transformation methods, we thus categorized the study variables into groups to lower the misclassification for normality. Thus, all study variables were divided by tertiles (low, medium, and high) and the lowest served as the reference group [
13].
2.1.3. Control Variables
Control variables at the individual level in this study included gender, age (20–44, 45–64, and ≥65 years), spouse (yes/no), level of education (≤6 years, 7–9 years, and ≥10 years), employment status (yes/no), religion (yes/no), smoking (yes/no), alcohol consumption (yes/no), physical activity (yes/no), and self-rated health (good/fair/bad). Furthermore, we used the question “have you engaged in physical activity in the past two weeks?” to define whether adults engage in physical activity and a question, “have you drunk alcohol in the past seven days?” to define alcohol consumption. Self-rated health was measured by the question “In general, how would you rate your health today?” with choices from “(5) very good” to “(1) very bad”, and was then grouped into three levels as good, fair, and bad in the analysis.
2.2. Statistical Analysis
All variables were merged together for the individual and ecological data. The analysis was performed using SAS 9.4 software (SAS Institute, Cary, NC, USA). Statistical methods included descriptive analysis, bivariate analysis (Chi-square test and t-test), and multi-level analysis.
Two different models were built to examine the relationships between social-economic environments and depression. First, for the continuous outcome (CESD score), two levels of random intercept
linear regression models were conducted to detect the effect of individual factors and social-economic features on the CESD score with the regression coefficient (β). A
p-value of <0.05 was recognized as statistically significant. The SAS procedure MIXED was performed for multi-level regression models (individual at level 1 nested within townships at level 2) [
25].
Second, for the dichotomous outcome (CESD ≥ 10), two levels of random intercept
logistic regression models were conducted to examine the effect of individual and environmental factors on the risk of being depressed with the odds ratios (OR) and 95% confidence intervals (CI) by the SAS procedure GLIMMIX for the categorical outcome procedure [
26]. In addition, stratified analyses were also performed to detect the difference in gender and age groups.
3. Results
3.1. Characteristics of Participants
Table 1 shows the characteristics of participants in the study. The mean age of respondents was 53.94 ± 19.29, the mean score of CESD was 5.11 ± 4.32, and 15.1% showed depressive symptoms (CESD ≥ 10). Except for religion and alcohol consumption, all other variables were significantly related to a higher CESD score including being female, younger group (20–44 years old), less than six years of education, without a spouse, unemployed, a smoker, not engaging in physical activity, and with bad self-rated health. These variables were also found to be significantly related to depressive symptoms defined as CESD score ≥10.
3.2. Social-Economic Environments in Cities and Counties (n = 23)
Table 2 lists the descriptive statistics of the social-economic environments in the 23 cities and counties in Taiwan. The mean, standard deviation, min, max, and median of the six indicators are shown in the table. For example, the population density differed significantly from min 66.1 to the max 9947.8. The divorce rates were from 4.5% to 9.4%, and the mean unemployment rate was 5.8%, ranging from 5.7%~6.0%.
3.3. Multi-Level Analysis by Gender
Table 3 summarizes the results of the multi-level analysis stratified by gender. In the continuous outcome model (CESD score), only the unemployment rate illustrates a dose-response relationship in males. In contrast, population density in the medium group was significantly associated with a higher CESD score for females. In the cutoff model (CESD ≥ 10), the results showed that male adults living in cities/counties with an unemployment rate in both medium and high groups (OR = 1.78, 2.34; 95% CI = 1.13–2.81, 1.42–3.86, respectively) and per capita government expenditures in the high group (OR = 1.75; 95% CI = 1.21–2.53) had higher chance of being depressed compared with those in the low group. Nevertheless, female adults living in cities/counties with a population density in the medium group (OR = 1.54, 95% CI = 1.08–2.21) and divorce rate in both the medium and high groups had a higher risk of being depressed (OR = 1.95, 1.53; 95% CI = 1.14–3.36, 1.00–2.34, respectively) compared with those in the low group.
3.4. Multi-Level Analysis by Age Groups
Table 4 exhibits the ecological factors associated with the depressive symptoms by age group after controlling all individual factors. In the continuous outcome model (CESD score), the results showed that for young adults aged 20–44 years, the unemployment rate and per capita government expenditures were positively related to higher CESD scores. However, none of the six social-economic environments at the ecological level were significant for middle-aged (45–64 years) and older adults (≥65 years).
In the cutoff model (CESD ≥ 10), similarly, young adults aged 20–44 years living in areas with the unemployment rate in the medium and high groups (OR = 1.70, 1.73; 95% CI = 1.11–2.62, 1.05–2.84, respectively) and per capita government expenditures in the high group (OR = 1.57; 95%CI = 1.10–2.26) had a higher chance to be depressed, compared with those in the low group. However, the results were significantly different in the other two age groups. For example, adults aged 45–64 years living in cities/counties with the divorce rate in the medium group had 3.27 times (OR = 3.27, 95% CI = 1.03–10.42) as many chances of being depressed compared with those in the low group. Nevertheless, opportunities of being depressive for older adults aged 65 years and above were related to population density in the medium group (OR = 1.87, 95% CI = 1.18–2.96) and divorce rate in both medium and high groups (OR = 2.58, 1.77, 95% CI = 1.27–5.24, 1.02–3.06, respectively).
4. Discussion
This study found that two social factors (population density, divorce rate) and two economic features (unemployment rate, per capita government expenditures) were significantly associated with depressive symptoms among Taiwanese adults. However, the effects of these factors were different by gender and age groups. For gender difference, the population density and divorce rates were significantly associated with females, while the unemployment rate and government expenditures were positively related to males. For age-group differences, economic factors such as the unemployment rate were crucial for the young generation (aged 20–44 years). In contrast, social factors such as divorce rate and population density were more notable for middle-aged (aged 45–64 years) and older generations (aged 65 years and over).
4.1. Social Environments
This study examined three social factors including population density, divorce rate, and crime rate in the analysis. Only the crime rate was not associated with depressive symptoms in the study, which is not consistent with past studies. For example, a study from the United Kingdom (UK) indicated that the crime rate was related to mental distress for residents aged 50 and above, and the effect was more substantial for females [
27]. They also indicated that property crime primarily caused considerable mental distress for residents. However, the crime rate in Taiwan is much lower than that in other Western countries, so the crime rate may not be a risk factor of being depressed among adults in Taiwan.
In this study, the population density in the medium group played a critical role in increasing CESD score and being depressed, especially for female and older adults aged 65 years and over. Associations of depressive symptoms and urban–rural living environments have been examined in several previous studies, although the result is not consistent. The influences of population density on mental health are complicated and nonlinear because they would interact with other physical and social-economic environments [
28,
29]. For instance, a study from the UK indicated that people older than 75 years living in the highest population density and intermediate-lower density areas were related to the high opportunity of depression compared with the lowest density areas [
29].
The divorce rate was also found here to be a risk factor of being depressed, especially for females and adults aged 45 years and over. A longitudinal study using community-based data from the New Haven Epidemiologic Catchment Area program on respondents aged 18–60 years found that the prevalence of major depression was 3.7 times higher among married females than among their male counterparts [
30]. However, another study found that the depression effect in males was more sensitive to divorce or separation and work problems, but females were more sensitive to getting along with people [
31].
4.2. Economic Environments
We examined three economic factors at the ecological level in this study: unemployment rate, per capita disposable income, and per capita government expenditures. Only disposable income was not associated with depressive symptoms, regardless of continuous or dichotomous outcomes. However, the unemployment rate and per capita government expenditures were the critical factors of depressive symptoms, especially for males and young adults (20–44 years). Such findings were not consistent with previous studies [
15,
16,
17].
For example, a study from Behanova et al. (2013) comparing urban-area unemployment on mental health in Slovak and Dutch cities showed different results [
15]. For instance, a gradient relationship between the area unemployment rate and mental health problems was observed in the Netherlands but absent in Slovakia. The finding in the Netherlands is similar to our study, showing that the effect of unemployment was more significant for males. Traditionally, males and young adults (aged 20–44 years) are the primary support for a family’s financial security, thus being more sensitive to the pressure of the employment situation.
Another nationwide cross-sectional study in Korea conducted by Lee and Park (2015) found that living in a higher mean income of communities would increase the risk of being depressed compared with people in the lowest level, even by gender and age [
8]. However, no association was found between city-level median income and mental disorders in China [
32], which is similar to our results. Other studies that used indicators of income inequality such as the GINI index or GINI coefficients also expressed inconclusive results [
33,
34]. These inconsistent results may vary with variable definitions or measurements at different levels and other contexture factors such as economic growth. Hence, research about the above factors is warranted in the future.
One unanticipated finding was that government expenditure in the high group significantly increased the risk of being depressed than in the low group, especially in males and young adults (aged 20–44 years). Little research has examined the association between government expenditures and mental health. A recent study from Reeves et al. (2016) in the United Kingdom exploring the relationship between government housing benefit and depression symptoms in low-income households revealed that reducing housing support to low-income people in rental houses would increase the prevalence of depressive symptoms [
35]. Similarly, Matsubayashi et al. (2020) found that decreasing local government spending would worsen the suicide rate in Japan, especially for males, when the unemployment rate increased [
36]. However, “government expenditure” is an aggregated indicator covering expenditures in various categories and items such as infrastructure building, repairing, environmental protection, social welfare, and related activities. Hence, it would face a challenge with the aging population.
4.3. Gender and Age Difference
Gender and age were found significantly different in this study. The divorce rate was crucial to depressive symptoms for females and older adults. A possible explanation for the result may be from the pressure of discrimination and insecurity [
37,
38]. To a certain extent, economic, and life stability is secure from marital relationships for females and older adults. In addition, both categories are usually vulnerable in social-economic status and the labor market. Thus, the stress of living in disadvantaged areas, along with their actual difficult life situation (such as divorce, with children, work–life unbalance) and fewer economic choices or low salary, would create an opportunity for mental illness such as depression [
37,
38].
In contrast, the economic environment is a significant factor for depressive symptoms of males and young adults. These results also appear in previous studies [
8,
39]. A possible explanation might be that males traditionally play a fundamental role in household finances. Hence, regional economic phenomenon and prosperity would affect their employment pressure, investment, and financial situation. In addition, young adults also faced the pressure of the economic boom and the choices of career or industry involvement. Accordingly, they are susceptible to local economic factors.
4.4. Contributions and Limitations
In Asia, little research has explored the effects of social-economic environments on depressive symptoms. Using Taiwan as an example, we linked a nationally representative survey and social-economic data at the city-county level, providing better evidence than previous studies. We found that the association between social-economic environments and depression was different by gender and age.
However, there were some limitations in the study. First, this was a cross-sectional study that only examined the association between social-economic environments and depressive symptoms, but could not explain the causation of related factors. Further longitudinal research is needed to confirm the causality in the future. Second, social-economic factors in this study were mainly obtained from the open governmental data. Some indicators do not provide detailed information, so the relationships need to be clarified in future studies.
5. Conclusions
This study provides preliminary evidence that the social-ecological features are associated with depressive symptoms in community-dwelling adults. The effects of social-economic environments on depressive symptoms varied across different gender and age groups. The economic environments were critical for male and young adults aged 20–44 years old, whereas the social environments were significant for females and middle-aged and older adults. Hence, intervention efforts to improve depressive symptoms should integrate a social-ecological approach into the effects in different gender and age groups.
Author Contributions
Conceptualization, S.C.H. and Y.-H.T.; Methodology, S.C.H., Y.-H.T. and N.-C.H.; Validation, S.C.H., W.-C.H. and N.-C.H.; Formal analysis, Y.-H.T. and S.C.H.; Resources, S.C.H., D.-C.L. and N.-C.H.; Data curation, Y.-H.T., W.-C.H. and N.-C.H.; Writing—original draft preparation, Y.-H.T. and N.-C.H.; Writing—review and editing, S.C.H. and D.-C.L.; Visualization, W.-C.H. and N.-C.H.; Supervision, S.C.H., D.-C.L. and N.-C.H.; Project administration, N.-C.H. and S.C.H.; Funding acquisition, S.C.H. All authors have read and agreed to the published version of the manuscript.
Funding
This research was funded by the Health Promotion Administration, Ministry of Health and Welfare, Taiwan (grant no.: MOHW107-HPA-M-114-144703) and the Ministry of Science and Technology, Taiwan (grant no.: MOST 107-2635-B-006-002).
Institutional Review Board Statement
Procedures performed in the study were in accordance with the ethical standards of the Institutional Review Board, National Cheng Kung University Hospital by Human Study Approval (IRB No: B-ER-104-087).
Informed Consent Statement
Informed consent was obtained from all subjects involved in the study.
Data Availability Statement
The individual-level data presented in this study can be obtained from the Data Science Center, Ministry of Health and Welfare, Taiwan with the permission from the Health Promotion Administration, Ministry of Health and Welfare in Taiwan. The ecological-level data presented in this study are available on request from the corresponding author.
Acknowledgments
We are grateful to the Health and Welfare Data Science Center, Ministry of Health and Welfare, Taiwan for providing the nationwide datasets, the 2009 National Health Interview Survey, and administrative support.
Conflicts of Interest
The authors declare no conflict of interest.
References
- World Health Organization. Depression and Other Common Mental Disorders: Global Health Estimates; World Health Organization: Geneva, Switzerland, 2017. [Google Scholar]
- Meng, X.; D’Arcy, C. The projected effect of risk factor reduction on major depression incidence: A 16-year longitudinal Canadian cohort of the National Population Health Survey. J. Affect. Disord. 2014, 158, 56–61. [Google Scholar] [CrossRef]
- Meng, X.; Brunet, A.; Turecki, G.; Liu, A.; D’Arcy, C.; Caron, J. Risk factor modifications and depression incidence: A 4-year longitudinal Canadian cohort of the Montreal Catchment Area Study. BMJ Open 2017, 7. [Google Scholar] [CrossRef] [Green Version]
- Golden, S.D.; McLeroy, K.R.; Green, L.W.; Earp, J.A.L.; Lieberman, L.D. Upending the Social Ecological Model to Guide Health Promotion Efforts toward Policy and Environmental Change. Health Educ. Behav. 2015, 42, 8S–14S. [Google Scholar] [CrossRef] [Green Version]
- Sallis, J.F.; Owen, N.; Fisher, E. Ecological models of health behavior. In Health Behavior: Theory, Research, and Practice; Jossey-Bass: San Francisco, CA, USA, 2015; Volume 5, pp. 43–64. [Google Scholar]
- Miles, R.; Coutts, C.; Mohamadi, A. Neighborhood urban form, social environment, and depression. J. Urban Health Bull. N. Y. Acad. Med. 2012, 89, 1–18. [Google Scholar] [CrossRef] [Green Version]
- Wilson-Genderson, M.; Pruchno, R. Effects of neighborhood violence and perceptions of neighborhood safety on depressive symptoms of older adults. Soc. Sci. Med. 2013, 85, 43–49. [Google Scholar] [CrossRef]
- Lee, E.W.; Park, J.H. Individual and socioeconomic contextual effects on depressive symptom in Korea: Multi-level analysis of cross-sectional nationwide survey. J. Korean Med. Sci. 2015, 30, 186–193. [Google Scholar] [CrossRef] [PubMed] [Green Version]
- Schüle, S.A.; Bolte, G. Interactive and Independent Associations between the Socioeconomic and Objective Built Environment on the Neighbourhood Level and Individual Health: A Systematic Review of Multilevel Studies. PLoS ONE 2015, 10, e0123456. [Google Scholar] [CrossRef] [PubMed]
- Fu, T.S.; Lee, C.S.; Gunnell, D.; Lee, W.C.; Cheng, A.T. Changing trends in the prevalence of common mental disorders in Taiwan: A 20-year repeated cross-sectional survey. Lancet 2013, 381, 235–241. [Google Scholar] [CrossRef]
- Tsai, Y.F.; Yeh, S.H.; Tsai, H.H. Prevalence and risk factors for depressive symptoms among community-dwelling elders in Taiwan. Int. J. Geriatr. Psychiatry 2005, 20, 1097–1102. [Google Scholar] [CrossRef]
- Tsai, C.S.; Wu, C.L.; Hung, T.H.; Chou, S.Y.; Su, J.A. Incidence and risk factors of poststroke depression in patients with acute ischemic stroke: A 1-year prospective study in Taiwan. Biomed. J. 2016, 39, 195–200. [Google Scholar] [CrossRef] [PubMed] [Green Version]
- Liu, C.-C.; Sun, Y.; Kung, S.-F.; Kuo, H.-W.; Huang, N.-C.; Li, C.-Y.; Hu, S.C. Effects of physical and social environments on the risk of dementia among Taiwanese older adults: A population-based case-control study. BMC Geriatr. 2020, 20, 226. [Google Scholar] [CrossRef]
- Liu, Y.-T. Associations between socioeconomic development and mortality—A small area panel data analysis in Taiwan, 2000–2015. J. Public Health 2021, 29, 145–157. [Google Scholar] [CrossRef]
- Behanova, M.; Nagyova, I.; Katreniakova, Z.; van Ameijden, E.J.; van Dijk, J.P.; Reijneveld, S.A. The effect of urban-area unemployment on the mental health of citizens differs between Slovak and Dutch cities. Health Place 2013, 24, 210–215. [Google Scholar] [CrossRef]
- Galea, S.; Ahern, J.; Nandi, A.; Tracy, M.; Beard, J.; Vlahov, D. Urban Neighborhood Poverty and the Incidence of Depression in a Population-Based Cohort Study. Ann. Epidemiol. 2007, 17, 171–179. [Google Scholar] [CrossRef] [PubMed] [Green Version]
- Ross, C.E. Neighborhood Disadvantage and Adult Depression. J. Health Soc. Behav. 2000, 41, 177–187. [Google Scholar] [CrossRef]
- Boey, K.W. Cross-validation of a short form of the CES-D in Chinese elderly. Int. J. Geriatr. Psychiatry 1999, 14, 608–617. [Google Scholar] [CrossRef]
- Kohout, F.J.; Berkman, L.F.; Evans, D.A.; Cornoni-Huntley, J. Two shorter forms of the CES-D (Center for Epidemiological Studies Depression) depression symptoms index. J. Aging Health 1993, 5, 179–193. [Google Scholar] [CrossRef] [PubMed]
- Lee, K.-L.; Ou, Y.-L.; Chen, S.-H.; Weng, L.-J. The psychometric properties of a short form of the CES-D used in the Taiwan longitudinal study on aging. J. Ment. Health 2009, 22, 383–410. [Google Scholar]
- Chiu, C.-J.; Tseng, Y.-H.; Hsu, Y.-C.; Wu, S.-T. Depressive symptom trajectories in the first 10 years of diabetes diagnosis: Antecedent factors and link with future disability in Taiwan. Soc. Psychiatry Psychiatr. Epidemiol. 2017, 52, 829–836. [Google Scholar] [CrossRef]
- Huang, N.-C.; Kung, S.-F.; Hu, S.C. Exploring the role of built environments and depressive symptoms in community-dwelling older adults: A case of Taiwan. Aging Ment. Heal. 2021, 25, 1049–1059. [Google Scholar] [CrossRef]
- Chang, K.-F.; Weng, L.-J. Screening for depressive symptoms among older adults in Taiwan: Cutoff of a short form of the Center for Epidemiologic Studies Depression Scale. Health 2013, 5, 7. [Google Scholar] [CrossRef] [Green Version]
- Hu, S.C.; Lin, W.-Y.; Huang, Y.-R.; Huang, N.-C.; Wang, Y.-W. The Establishment and Application of Age-friendly Environment Dataset at City-county Level in Taiwan. J. Health Sci. 2018, special issue, 50–70. [Google Scholar]
- Bell, B.A.; Ene, M.; Schoeneberger, J. A Multi-Level Model Primer Using SAS PROC MIXED; SAS Global Forum: San Francisco, CA, USA, 2013; Volume 433, pp. 1–19. [Google Scholar]
- Ene, M.; Leighton, E.A.; Blue, G.L.; Bell, B.A. Multi-Level Models for Categorical Data Using SAS® PROC GLIMMIX: The Basics; SAS Global Forum: Denver, CO, USA, 2015. [Google Scholar]
- Dustmann, C.; Fasani, F. The Effect of Local Area Crime on Mental Health. Econ. J. 2016, 126, 978–1017. [Google Scholar] [CrossRef] [Green Version]
- Barnett, S.; Roderick, P.; Martin, D.; Diamond, I. A multi-level analysis of the effects of rurality and social deprivation on premature limiting long term illness. J. Epidemiol. Community Health 2001, 55, 44–51. [Google Scholar] [CrossRef] [Green Version]
- Walters, K.; Breeze, E.; Wilkinson, P.; Price, G.M.; Bulpitt, C.J.; Fletcher, A. Local Area Deprivation and Urban–Rural Differences in Anxiety and Depression Among People Older Than 75 Years in Britain. Am. J. Public Health 2004, 94, 1768–1774. [Google Scholar] [CrossRef] [PubMed]
- Bruce, M.L.; Kim, K.M. Differences in the effects of divorce on major depression in men and women. Am. J. Psychiatry 1992, 149, 914–917. [Google Scholar] [CrossRef] [PubMed]
- Kendler, K.S.; Thornton, L.M.; Prescott, C.A. Gender differences in the rates of exposure to stressful life events and sensitivity to their depressogenic effects. Am. J. Psychiatry 2001, 158, 587–593. [Google Scholar] [CrossRef]
- Chiavegatto Filho, A.D.P.; Sampson, L.; Martins, S.S.; Yu, S.; Huang, Y.; He, Y.; Lee, S.; Hu, C.; Zaslavsky, A.; Kessler, R.C.; et al. Neighbourhood characteristics and mental disorders in three Chinese cities: Multi-level models from the World Mental Health Surveys. BMJ Open 2017, 7, e017679. [Google Scholar] [CrossRef] [Green Version]
- Pickett, K.E.; James, O.W.; Wilkinson, R.G. Income inequality and the prevalence of mental illness: A preliminary international analysis. J. Epidemiol. Community Health 2006, 60, 646–647. [Google Scholar] [CrossRef] [PubMed] [Green Version]
- Rai, D.; Zitko, P.; Jones, K.; Lynch, J.; Araya, R. Country- and individual-level socioeconomic determinants of depression: Multi-level cross-national comparison. Br. J. Psychiatry J. Ment. Sci. 2013, 202, 195–203. [Google Scholar] [CrossRef]
- Reeves, A.; Clair, A.; McKee, M.; Stuckler, D. Reductions in the United Kingdom’s Government Housing Benefit and Symptoms of Depression in Low-Income Households. Am. J. Epidemiol. 2016, 184, 421–429. [Google Scholar] [CrossRef] [Green Version]
- Matsubayashi, T.; Sekijima, K.; Ueda, M. Government spending, recession, and suicide: Evidence from Japan. BMC Public Health 2020, 20, 243. [Google Scholar] [CrossRef] [PubMed] [Green Version]
- Belle, D.; Doucet, J. Poverty, inequality, and discrimination as sources of depression among US women. Psychol. Women Q. 2003, 27, 101–113. [Google Scholar] [CrossRef]
- Chonody, J.M.; Siebert, D.C. Gender Differences in Depression:A Theoretical Examination of Power. Affilia 2008, 23, 338–348. [Google Scholar] [CrossRef]
- Barnett, A.; Zhang, C.J.; Johnston, J.M.; Cerin, E. Relationships between the neighborhood environment and depression in older adults: A systematic review and meta-analysis. Int. Psychogeriatr. 2018, 30, 1153–1176. [Google Scholar] [CrossRef]
| Publisher’s Note: MDPI stays neutral with regard to jurisdictional claims in published maps and institutional affiliations. |
© 2021 by the authors. Licensee MDPI, Basel, Switzerland. This article is an open access article distributed under the terms and conditions of the Creative Commons Attribution (CC BY) license (https://creativecommons.org/licenses/by/4.0/).


