1. Introduction
A persistent public health crisis of opioid-related overdose mortality has been unfolding across Canada since the early 2000s. Concretely, the annual total number (population rate per 100,000) of opioid-related poisoning fatalities in Canada increased from 2825 (7.8) in 2016 to 3831 (10.2) in 2019 [
1,
2,
3]. Opioid-related fatalities occurring primarily in young- and middle-aged persons have slowed increases in population life expectancy [
4]. Opioid-related mortality rates and and related dynamics in Canada have been similar to those observed in the United States [
4,
5].
However, there have been notable changes in the origins and pharmacological profiles of the opioids contributing to overdose mortality. While the majority of deaths in North America were related to pharmaceutical opioids a decade ago, these became gradually replaced by illicit/synthetic opioids (e.g., fentanyl/analogues, heroin) over the past decade. To illustrate: The contribution of fentanyl-type opioids to opioid-related mortality in Ontario, Canada’s most populous province, increased from 27% (2014) to 76% in 2019 [
6,
7]. Nationally, the proportion of non-fentanyl fatalities among total opioid-related fatalities fell from 55% in 2016 to 38% in 2019, with contributions to opioid mortality totals, however, varying substantially between provinces (ranges: 37–89% [2016]; 30–100% [2019]) [
3]. This is similar to the US, where the contribution of synthetic/illicit opioids to opioid-related deaths increased from 14% in 2010 to about 65% in 2018 [
1,
8].
Recent studies have documented the notably amplified individual–behavioural and pharmacological overdose risk dynamics of illicit/synthetic opioids [
9,
10,
11]. Questions, however, remain concerning their sudden proliferation and regionally varying contributions to opioid mortality. Select analyses have characterized the recent, marked proliferation of illicit/synthetic opioids as an independent supply “wave”, whereas others have viewed this as a more dynamic phenomenon in response to reductions in medical opioid dispensing and availability for nonmedical diversion/use, resulting in possible supply shifts or gaps that were increasingly filled by illicit/synthetic opioids [
12,
13]. Depending on measures used, and while with substantial interprovincial variations, population-level opioid dispensing decreased by up to 50% in Canadian jurisdictions post-2012, similar to overall developments in the US [
14,
15,
16,
17,
18]. These reductions followed lengthy periods of steep increases in medical opioid availability, and the implementation of multiple system-level interventions (e.g., opioid formulary restrictions, intensified prescription monitoring, revised prescription guidelines, law enforcement) occurring across multiple years post-2010 that aimed to reduce opioid availability and harms (e.g., mortality, morbidity) [
19,
20,
21,
22]. These intervention efforts gradually restricted medical opioid flow and supply, and so likely facilitated increasing exposure to alternative illicit/synthetic opioid products by nonmedical opioid users. The proliferating illicit/synthetic opioid products (e.g., fentanyl, fentanyl analogues) have been well-documented to feature high potency/toxicity properties with consequentially elevated overdose and related fatality risks [
23,
24,
25].
Based on possible relationship dynamics between prescription opioid availability and opioid-related mortality, recent exploratory data found the extent of decreases in opioid dispensing were associated with changes in overall levels of opioid-related mortality across the Canadian provinces [
26]. Complementing these analyses, based on recent data characterizing opioid mortality profiles, the present study explored potential relationships between changes in opioid dispensing and the specific contributions of illicit/synthetic opioids to opioid-related overdose mortality in Canada.
2. Materials and Methods
The specific aim of the study was to assess possible associations between relative changes in medical opioid dispensing and corresponding relative contributions of illicit/synthetic (fentanyl) opioids to total opioid fatalities (2016–2019) across the ten Canadian provinces.
Data used for analyses came from two sources. First, medical opioid dispensing data were derived from previously utilized information on community-based dispensing of prescription opioids from a commercially operated, representative pan-Canadian panel of about 6000 community-based retail pharmacies (compiled by IQVIA, a global health analytics company) capturing the majority of opioid dispensing in Canada [
16,
27]. With this panel, the dispensing totals for prescription-type medications in Canada are estimated through geospatial projection methodology, as examined by other drug utilization analyses [
28,
29]. Original dispensing information included summary totals by opioid formulation, strength, and dose, for each of the ten provinces. Based on standard classifications, “strong opioids” (i.e., excluding “weak” opioids, e.g., codeine, as well as methadone due to inconsistent dispensing) were converted into annual defined daily doses/1000 population/day (DDD/1000/day) province-based values for the years 2011–2018 [
30,
31]. Two a-priori measures were derived for analyses from these opioid dispensing rates. The first was the difference in annual, province-based opioid dispensing (in DDD/1000/day) between 2011 and 2018; the second was the difference between the respective “peak-year” (i.e., highest year) of opioid dispensing (anywhere between 2011 and 2017) and 2018 for each province. The rationale for these two measures was that (a) main opioid control interventions to reduce opioid availability were implemented in 2012 and years following (i.e., with 2011 as the last pre-intervention year), and (b) opioid dispensing changes have varied, e.g., in terms of timing, by province [
16,
19].
Second, opioid-related fatality (“apparent opioid toxicity deaths”) data for Canada came from recent federal surveillance reports on opioid-related harms [
3]. National opioid-related mortality data are based on analyses by provincial coroner services, for which specific methodologies may differ, yet data are federally combined and reported for surveillance purposes [
3]. Provincial totals and (crude) population rates of annual (accidental) opioid-related fatalities for the years 2016 to 2019 (the only full years for which such data were available) were extracted. For the mortality indicator of interest, we used the annual proportion (%) of opioid-related fatalities involving “fentanyl” among total opioid-related deaths by province (2016–2019). Given intra-provincial variation in the values yet in the absence of trend-analyses, the respective average percentage values of the provincial fentanyl contribution rates to opioid deaths were calculated and used as a proxy for analyses.
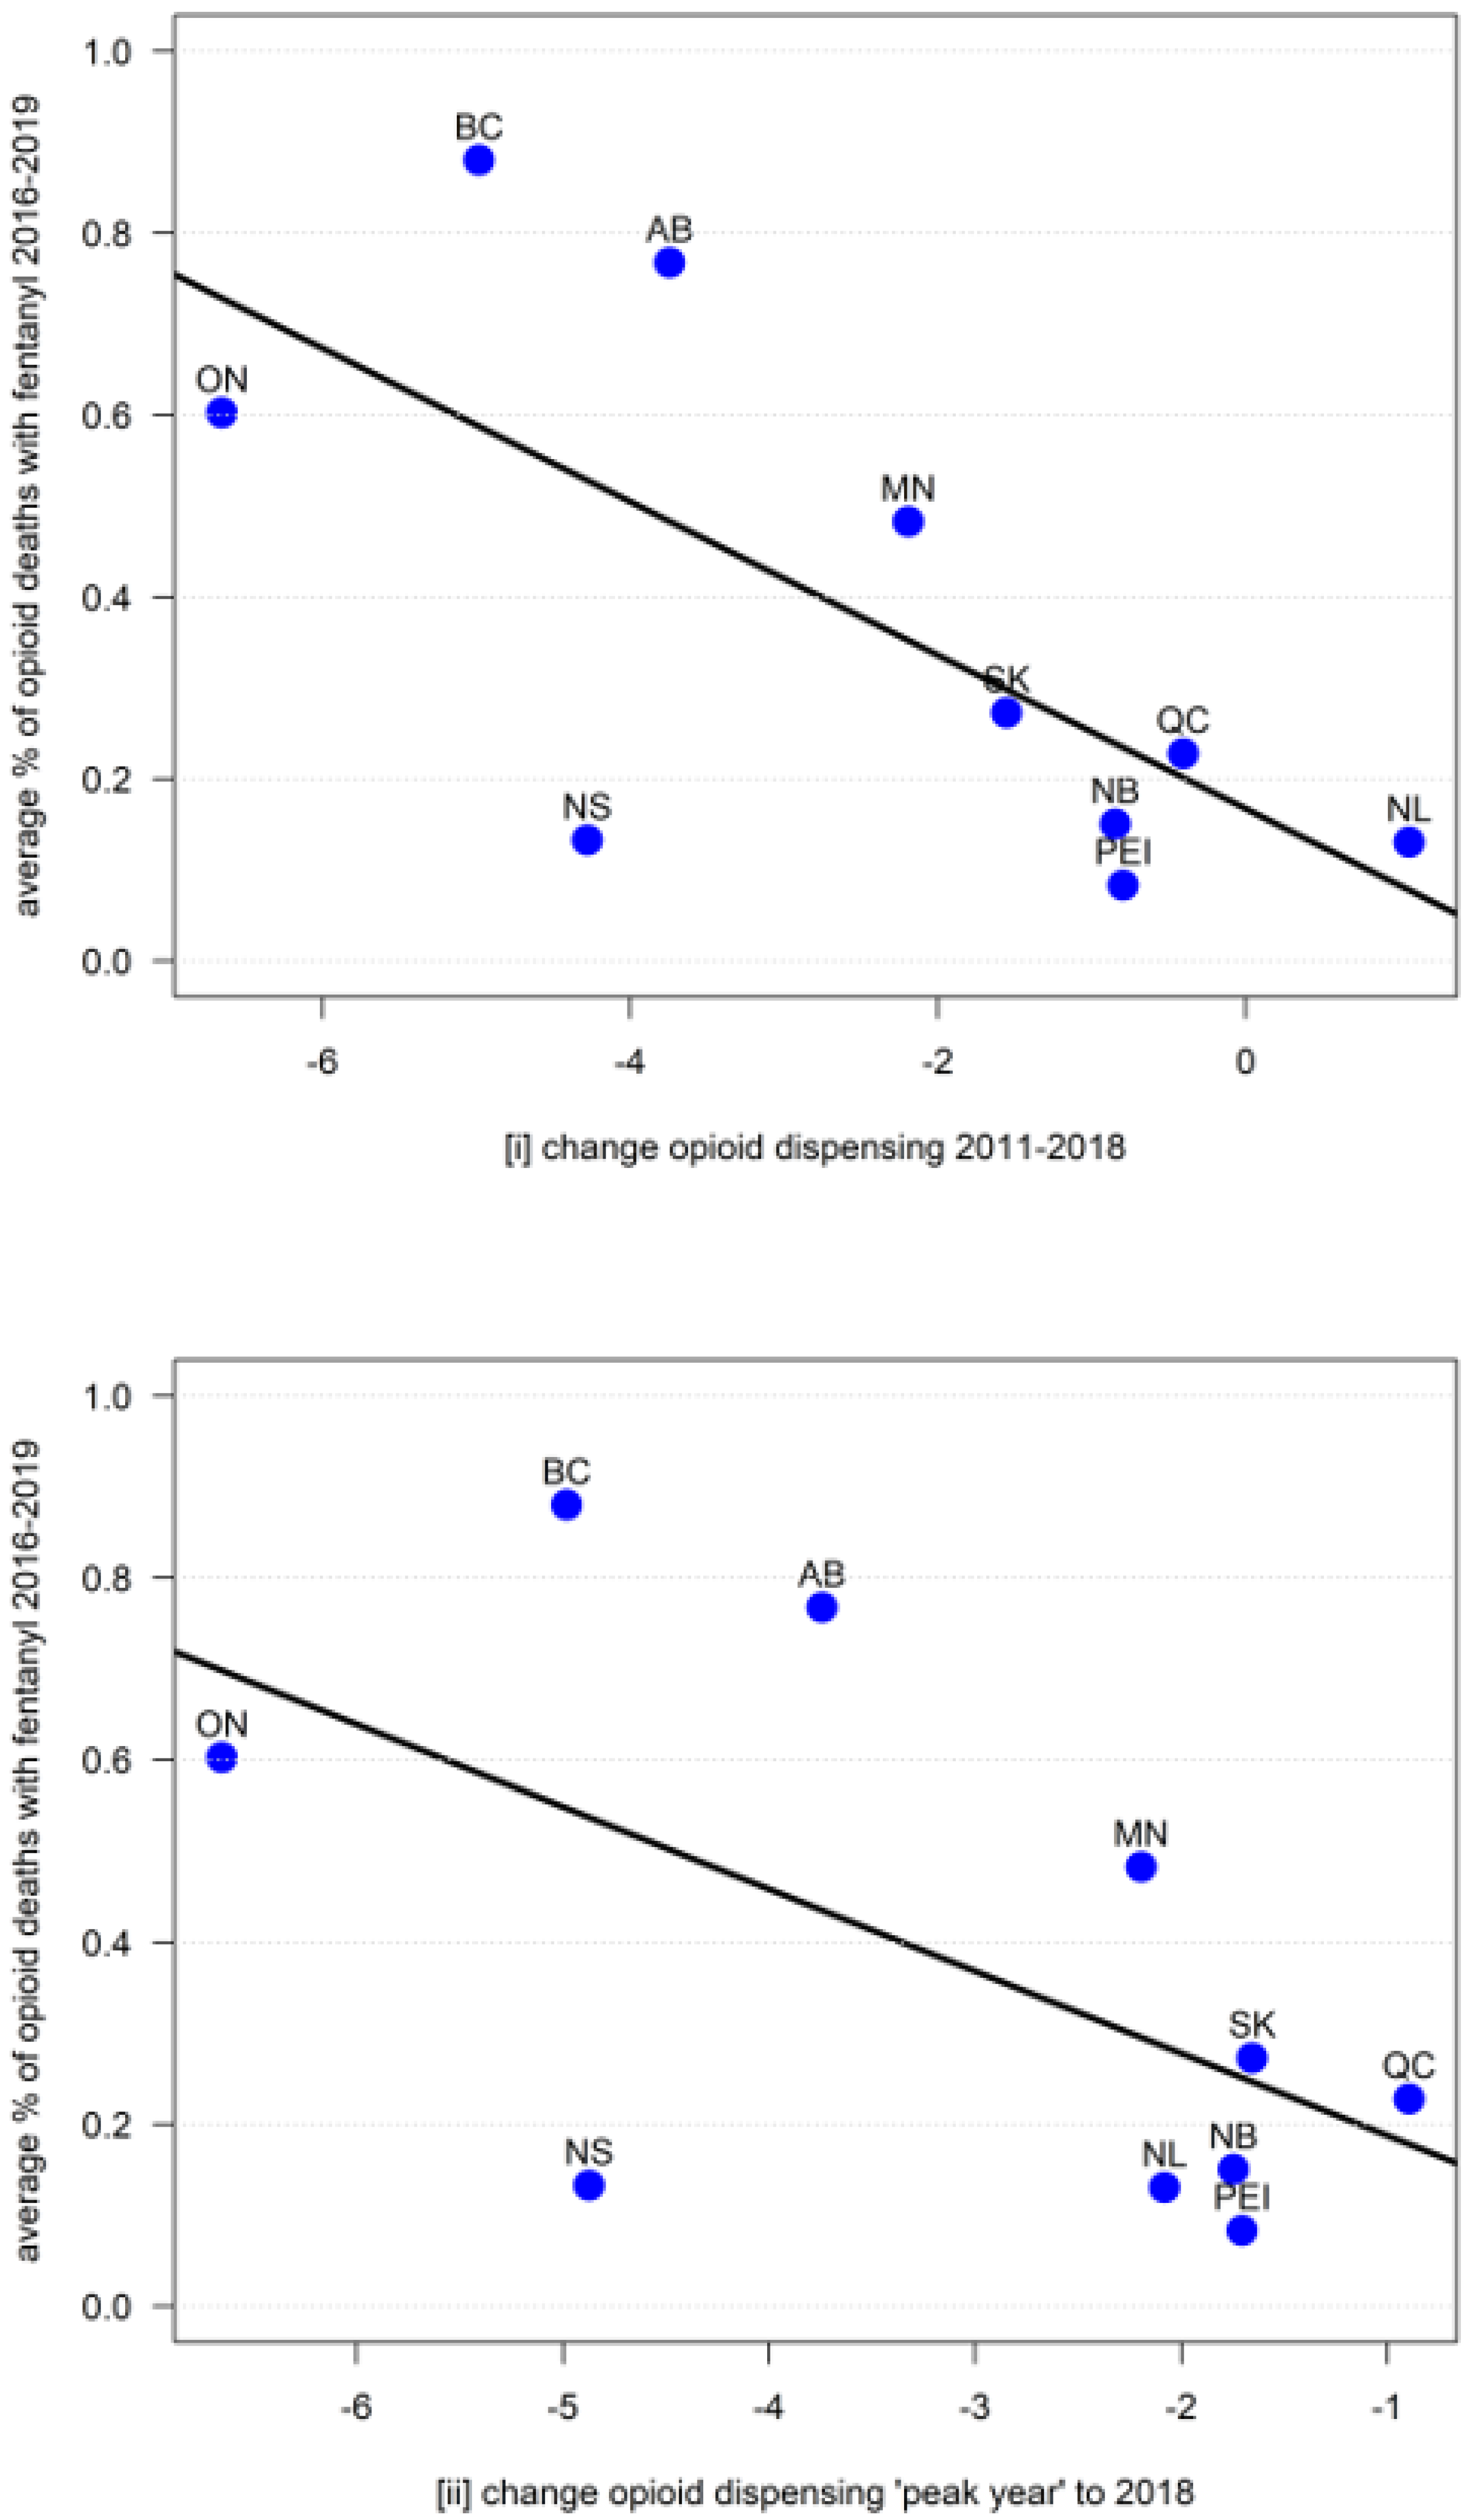
To examine possible associations between the two above-defined measures, we computed the Pearson product moment correlations between the two sets of province-based changes in opioid dispensing ((i) 2011–2018, and (ii) “peak-year” to 2018) and the corresponding provincial average rates of fentanyl-related fatalities (2016–2019). These two approaches for analyses took into account the general timepoints of interventions to reduce medical opioid dispensing (2012), yet furthermore the interprovincial variations in opioid dispensing patterns, including varying timing of “peak-years” and subsequent declines. Statistical significance was set at
p < 0.05. Correlation statistics were reported, and scatterplots of the correlations generated, with analyses computed using the statistical packages in R [
32]. No ethics review was required for the present study due to the anonymous, depersonalized population-level data used for analysis.
3. Results
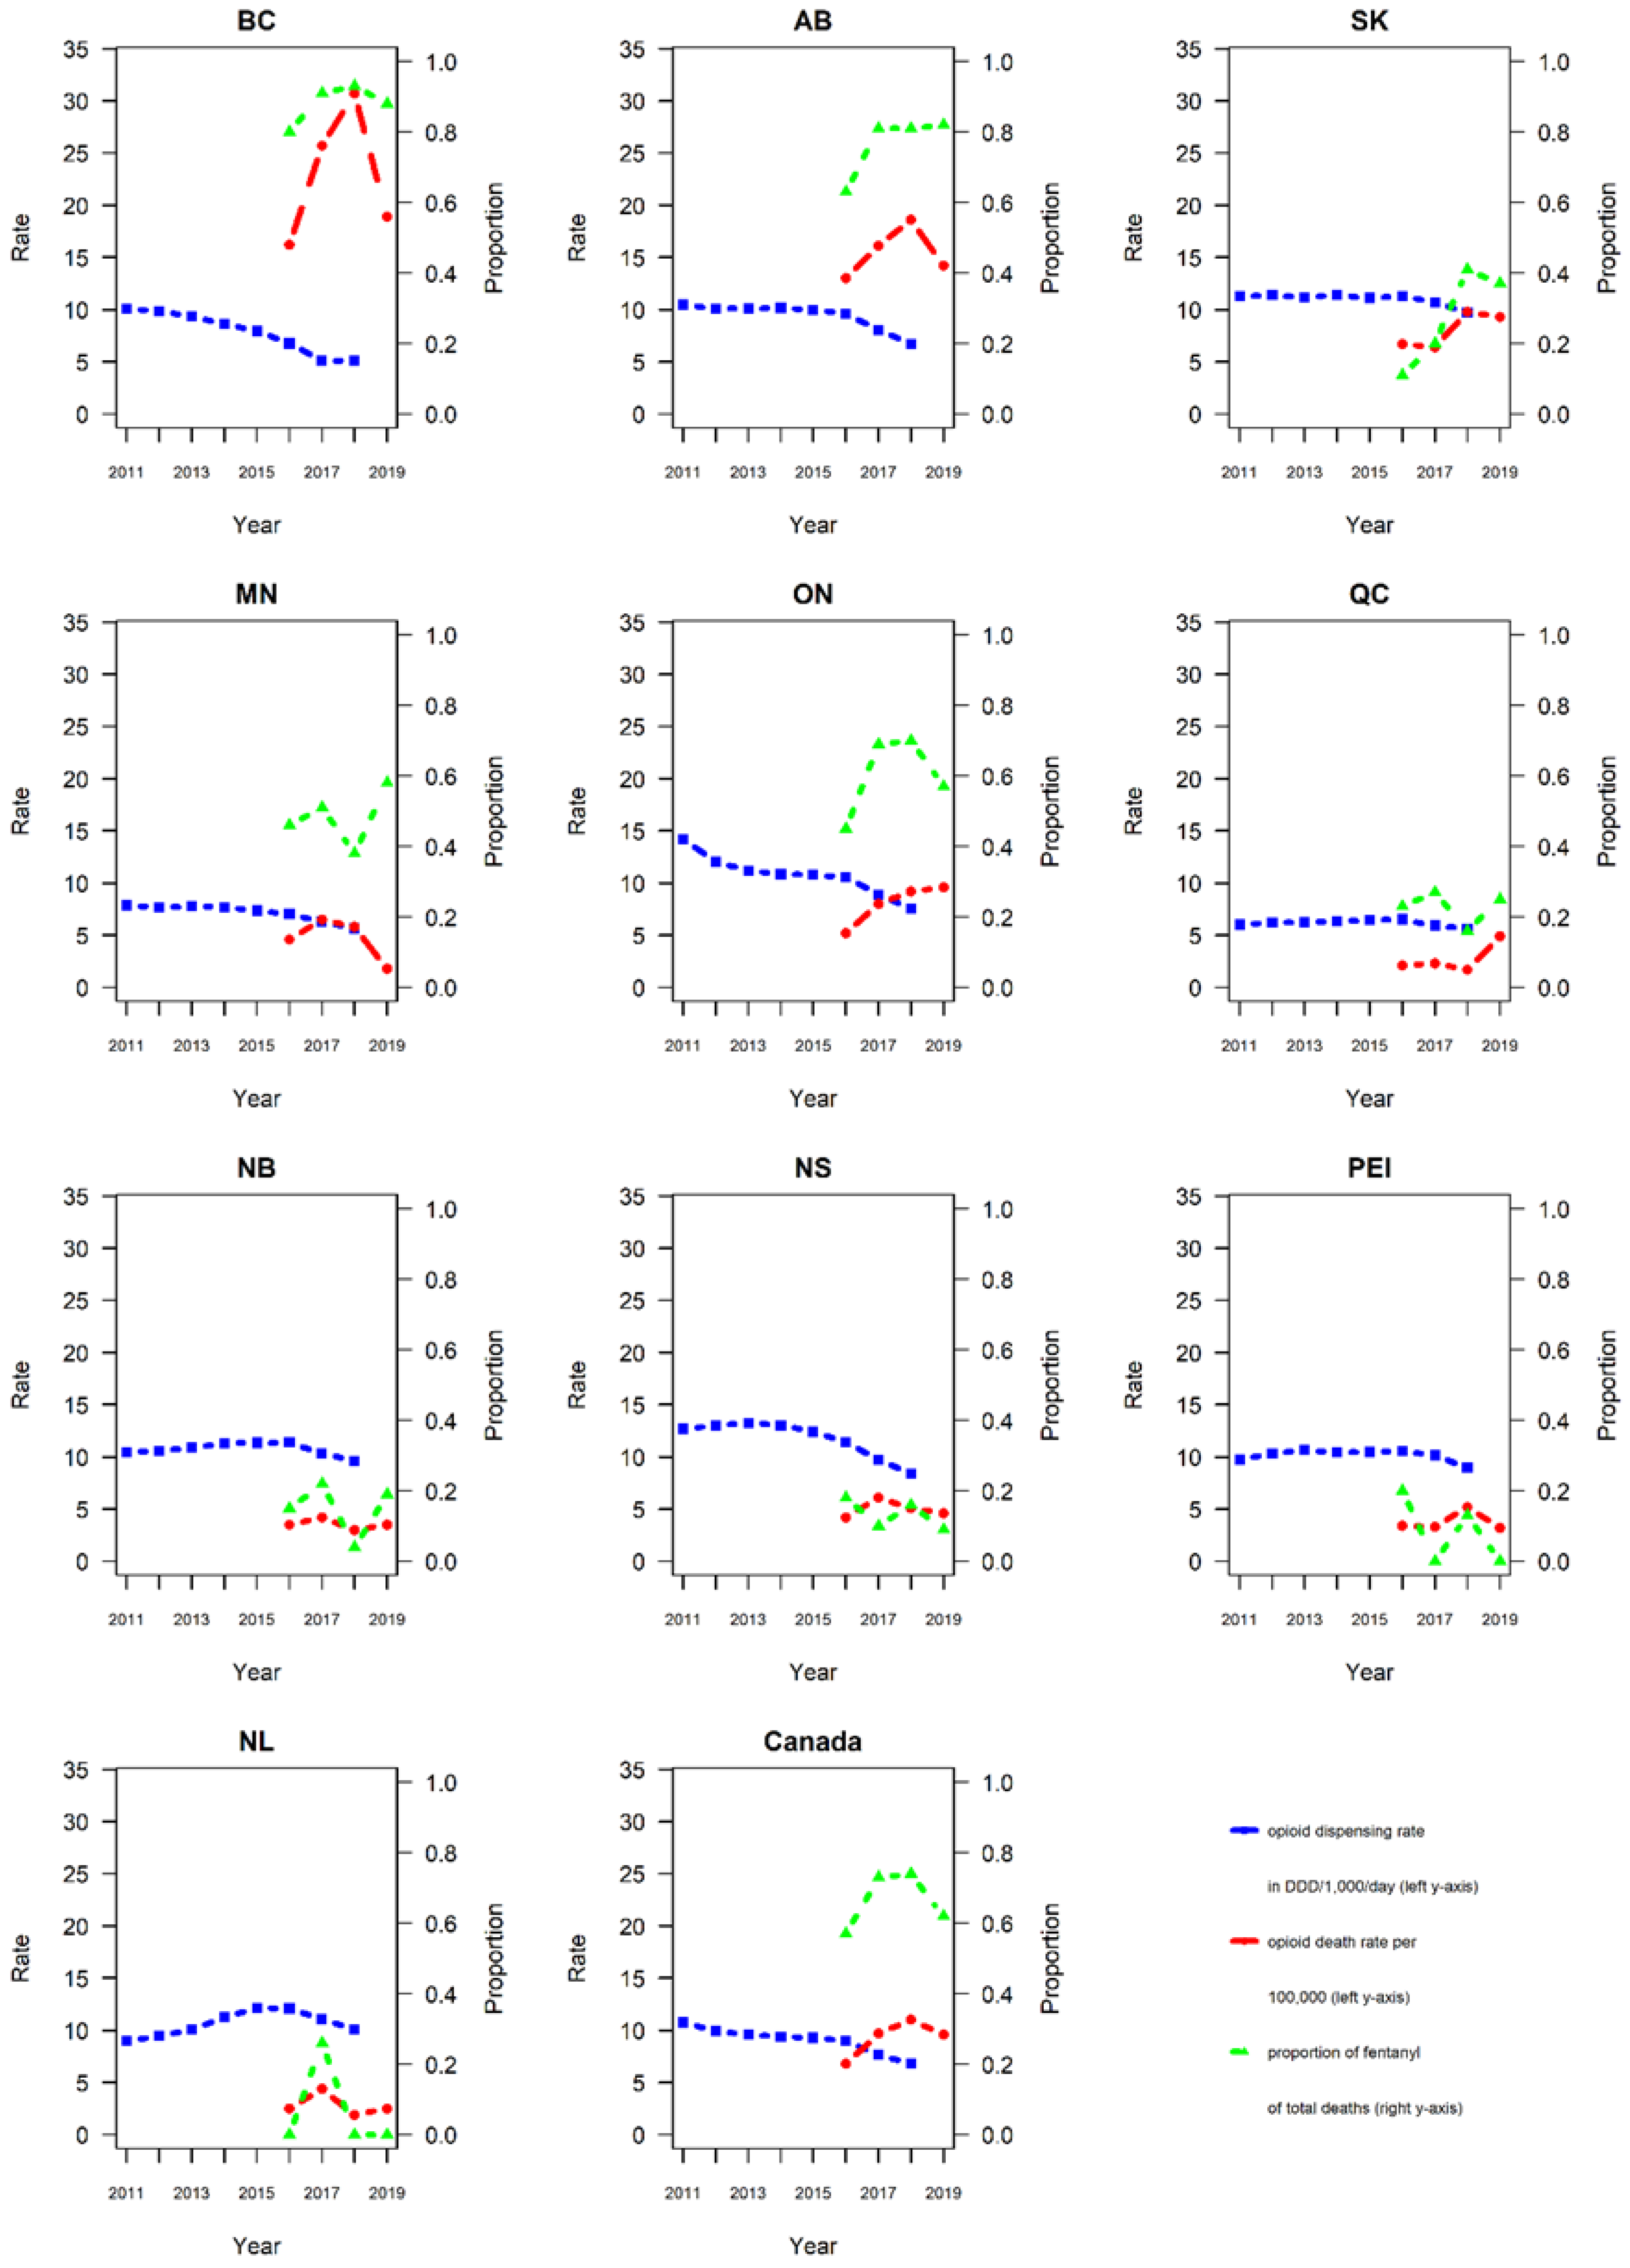
Data on annual opioid dispensing rates, total opioid-related mortality, and relative contributions of fentanyl to opioid-related deaths, by province and Canada total, for the respective data periods are presented in
Table 1 and visualized in
Figure 1.
Table 1 also includes information for the provincial acronyms.
In 2011, ON had the highest rate in strong opioid dispensing (14.2 DDD/1000/day), while QC had the lowest rate (6.0 DDD/1000/day). Regarding changes in opioid dispensing, ON had the largest reduction (−6.7 DDD/1000/day), whereas NL had the smallest reduction (+1.1 DDD/1000/day increase) between 2011 and 2018; for the “peak year” to 2018 measure, ON had the largest reduction (−6.7 DDD,1000/day), whereas QC had the smallest reduction (−0.9 DDD/1000/day).
Provincial opioid-related fatality rates ranged from 2.1/100,000 in QC to 16.2/100,000 in BC in 2016; corresponding rates ranged from 1.8/100,000 in MB to 18.8/100,000 in BC in 2019. All but one province (MN) reported either stable or increasing overall opioid-related mortality levels between 2016 and 2019.
Province-based percentages of fentanyl-related fatalities among total opioid-related mortality varied. PE had the smallest average percentage (8%; annual range 0–20%); BC had the highest percentage (88%; 80–93%) of fentanyl-related fatalities among total opioid-related fatalities between 2016 and 2019. Three provinces (BC, AB, ON) had an average rate of fentanyl-related mortality >50%, five provinces (QC, NB, NS, PEI, NL) had an average rate <25%.
The Pearson’s product moment correlation between (i) the provincial changes in opioid dispensing (2011–2018) and the average percentage of fentanyl of the opioid-related fatality total (2016–2019) was −0.70 (
t = 2.75, df = 8,
p = 0.03); the corresponding correlation between (ii) the province-based changes in opioid dispensing (peak year to 2018) and the average percentage of fentanyl of the opioid-related fatality total (2016–2019) was −0.59 (
t = −2.06, df = 8,
p = 0.07), indicating significant and near-significant results, respectively (see
Figure 2 for corresponding scatterplots).
4. Discussion
We presented evidence of (near-)significant correlations between the rates of decreases of medical opioid dispensing (in DDD/1000/day) post-2010 and the relative contributions of fentanyl to total opioid-related fatalities (2016–2019) in the Canadian provinces.
Opioid dispensing reductions considerably varied across provinces, from no/minimal decreases to reductions up to 50% [
15,
17]. Similarly, contribution rates of fentanyl to total opioid-related mortality varied: while half of the provinces indicated consistently minor (<25%) average contribution rates, three reported substantive (>50%) majority rates. The provinces with the highest relative fentanyl contributions to mortality showed the largest reductions in opioid dispensing. Hence, our results suggest that the larger the reductions in medical opioid dispensing, the higher the contribution of fentanyl to the opioid-related fatality total in a province. The strength and consistency of the correlations are notable, given the small number of datapoints (10 data pairs/provinces) available for analyses. These results complement findings of previous examinations that found provincial levels of reductions in medical opioid dispensing to be associated with changes in overall opioid mortality levels [
19,
26]. While exploratory in nature, the present findings may support the possibility that recent reductions in medical opioid dispensing, following various system-level interventions to reduce opioid-related harms, may have led to supply shifts or gaps in opioid availability, especially for nonmedical use, resulting in increased illicit/synthetic opioid exposure and related overdose fatalities across Canada.
Illicit/synthetic opioid products (i.e., fentanyl and fentanyl analogues) increasingly proliferated in the nonmedical opioid supply, and came to make growing contributions to opioid-related mortality in Canada over the past decade, similar to US experiences [
6,
8,
12,
25,
33]. Decreasing supply of medical opioids—and correspondingly reduced availability for nonmedical opioid use—may have led (existing or new) nonmedical opioid users to increasingly resort to and rely on illicit/synthetic products (fentanyl or others) as are documented to be highly potent, and toxic towards elevated risk for overdose (death) [
10,
11,
34]. This aligns with individual-level observations of transitions from prescription to illicit/synthetic opioid use, and increased overdose risk, for different user populations [
35,
36,
37]. Other data have documented increasingly restrictive opioid control environments to facilitate a “drying up” of medical opioid supply, pushing nonmedical opioid users into growing use of, and exposure to, risky, illicit/synthetic (e.g., fentanyl) opioids [
38,
39].
On this basis, policy efforts to restrict high levels of medical opioid availability may have exceeded efforts to reduce population-level demand for nonmedical use, increasing discrepancies between opioid-related supply and demand [
40]. Increases in illicit/synthetic opioid use and related fatalities may have occurred as an unintended adverse consequence of these dynamics [
6,
26,
41]. Similar adverse “substitution effects” from supply control efforts towards more hazardous substance types have been documented elsewhere [
42].
For methodological limitations, while DDD are a generally good measure for comparative opioid consumption estimates, their accuracy is limited [
17,
43]. Community-based opioid dispensing data do not include dispensing from other sources (e.g., hospitals, Internet) which, however, involve relatively minor amounts. The federal opioid mortality data examined is based on provincial coroners’ toxicological analyses, involving possibly different analytical standards and practices. Not all fentanyl identified in toxicological analyses is necessarily illicit/synthetic; illicit/synthetic opioids other than fentanyl or fentanyl analogues secondarily contribute to opioid fatalities [
3,
44]. Differential patterns of fentanyl contributions to opioid mortality could be influenced by different factors, for example, regional/geographic, economic effects, or the direct or indirect impact of interventions targeting opioid use and related risk (e.g., prevention or treatment measures) [
45].
5. Conclusions
In sum, this study presented additional exploratory evidence that the extent of medical opioid dispensing reductions appears to (negatively) correlate with relative contributions of fentanyl to total opioid fatalities across Canada. These dynamics have translated into overall adverse effects for public health, involving substantial increases in the total of opioid-related deaths in Canada, especially including the larger provinces comprising >80% of the population. Emerging opioid supply shifts from pharmaceutical-grade opioids towards illicit/toxic opioids may have reduced select harm outcomes related to medical opioids (e.g., iatrogenic addiction), yet may have facilitated increasing fentanyl-related mortality for distinct policy trade-offs. Given the present study’s exploratory nature, these overall dynamics should be further examined through other or expanded data (e.g., considering possible covariates) and/or methodological approaches. Given the limited understanding of the opioid crisis’ supply dynamics, especially on health outcomes [
12], our findings warrant consideration for ongoing public health-oriented interventions and policy development. As long as substantive demand for nonmedical opioid use exists amidst an extensive supply of illicit/synthetic opioids, expanding needs-based opioid pharmacotherapy options and “safer supply” interventions for at-risk users form crucial measures towards reducing excessive opioid mortality alongside other interventions [
46,
47,
48].
Author Contributions
B.F. conceptualized the study and led the initial and subsequent revision drafts of the paper. W.J. lead the development of the analyses plan and conducted the statistical analyses. All authors (W.J., R.K., M.-H.L., and B.F.) contributed to methodological configurations, review and interpretation of data and results, and provided substantial intellectual contributions to the content of iterative drafts and the final paper. All authors have read and agreed to the published version of the manuscript.
Funding
This study was in part supported by research funding from the Canadian Institutes of Health Research (CIHR), specifically grant #SAF-94814. Dr. Fischer acknowledges research support from the Hugh Green Foundation Chair in Addiction Research, Faculty of Medical and Health Sciences, University of Auckland, New Zealand. Neither funder entities nor providers of data mentioned had any involvement in or influence over the study design, analyses, reporting or interpretation of the data.
Institutional Review Board Statement
Not required.
Informed Consent Statement
Not applicable.
Data Availability Statement
The datasets analysed for the present study was based on information from a commercial database (IQVIA Canada’s Compuscript) on medical pharmaceutical (including opioid) prescriptions in Canada, available on request and under license from the source. National opioid-related mortality data used is publicly available from the Public Health Agency of Canada through its public surveillance and information database (Available online:
https://health-infobase.canada.ca/substance-related-harms/opioids-stimulants/, accessed on 24 June 2021).
Acknowledgments
The authors thank Lenka Vojtila-Valenzuela for her skilled assistance in the manuscript preparation and submission.
Conflicts of Interest
The authors declare no conflict of interest.
References
- Wilson, N.; Kariisa, M.; Seth, P.; Smith, H.; Davis, N.L. Drug and opioid-involved overdose deaths—United States, 2017–2018. Morb. Mortal. Wkly. Rep. 2020, 69, 290–297. [Google Scholar] [CrossRef] [Green Version]
- Vojtila, L.; Pang, M.; Goldman, B.; Kurdyak, P.; Fischer, B. Non-medical opioid use, harms, and interventions in Canada—A 10-year update on an unprecedented substance use-related public health crisis. Drugs Educ. Prev. Policy 2019, 27, 118–122. [Google Scholar] [CrossRef]
- PHAC. Apparent Opioid and Stimulant Toxicity Deaths; Public Health Agency of Canada: Ottawa, ON, Canada, 2020.
- Ye, X.; Sutherland, J.; Henry, B.; Tyndall, M.; Kendall, P.R.W. Impact of drug overdose-related deaths on life expectancy at birth in British Columbia. Heal. Promot. Chronic Dis. Prev. Can. 2018, 38, 248–251. [Google Scholar] [CrossRef]
- Woolf, S.H.; Schoomaker, H. Life expectancy and mortality rates in the United States, 1959–2017. JAMA 2019, 322, 1996–2016. [Google Scholar] [CrossRef]
- Gomes, T.; Khuu, W.; Martins, D.; Tadrous, M.; Mamdani, M.M.; Paterson, J.M.; Juurlink, D.N. Contributions of prescribed and non-prescribed opioids to opioid related deaths: Population based cohort study in Ontario, Canada. BMJ 2018, 362, k3207. [Google Scholar] [CrossRef] [PubMed] [Green Version]
- PHO. Interactive Opioid Tool: Opioid-Related Morbidity and Mortality in Ontario. 2021. Available online: https://www.publichealthontario.ca/en/data-and-analysis/substance-use/interactive-opioid-tool (accessed on 24 June 2021).
- Jones, C.M.; Einstein, E.B.; Compton, W.M. Changes in synthetic opioid involvement in drug overdose deaths in the United States, 2010–2016. JAMA 2018, 319, 1819–1821. [Google Scholar] [CrossRef] [Green Version]
- Roxburgh, A.; Hall, W.D.; Gisev, N.; Degenhardt, L. Characteristics and circumstances of heroin and pharmaceutical opioid overdose deaths: Comparison across opioids. Drug Alcohol Depend. 2019, 205, 107533. [Google Scholar] [CrossRef]
- Latkin, C.A.; Dayton, L.; Davey-Rothwell, M.A.; Tobin, K.E. Fentanyl and drug overdose: Perceptions of fentanyl risk, overdose risk behaviors, and opportunities for intervention among people who use opioids in Baltimore, USA. Subst. Use Misuse 2019, 54, 998–1006. [Google Scholar] [CrossRef]
- Brar, R.; Grant, C.; DeBeck, K.; Milloy, M.-J.; Fairbairn, N.; Wood, E.; Kerr, T.; Hayashi, K. Changes in drug use behaviors coinciding with the emergence of illicit fentanyl among people who use drugs in Vancouver, Canada. Am. J. Drug Alcohol Abus. 2020, 46, 625–631. [Google Scholar] [CrossRef] [PubMed]
- Fischer, B.; Pang, M.; Jones, W. The opioid mortality epidemic in North America: Do we understand the supply side dynamics of this unprecedented crisis? Subst. Abus. Treat Prev. Policy 2020, 15, 14. [Google Scholar] [CrossRef]
- Ciccarone, D. The triple wave epidemic: Supply and demand drivers of the US opioid overdose crisis. Int. J. Drug Policy 2019, 71, 183–188. [Google Scholar] [CrossRef]
- Bohnert, A.S.B.; Guy, G.P., Jr.; Losby, J.L. Opioid prescribing in the United States before and after the centers for disease control and prevention’s 2016 opioid uideline. Ann. Intern. Med. 2018, 169, 367–375. [Google Scholar] [CrossRef]
- CIHI. Opioid Prescribing in Canada: How Are Practices Changing? Report No.: 978-1-77109-819-9; CIHI: Ottawa, ON, Canada, 2019. [Google Scholar]
- Fischer, B.; Jones, W.; Vojtila, L.; Kurdyak, P. Patterns, changes, and trends in prescription opioid dispensing in Canada, 2005–2016. Pain Physician 2018, 21, 219–228. [Google Scholar] [CrossRef]
- Jones, W.; Vojtila, L.; Kurdyak, P.; Fischer, B. Prescription opioid dispensing in Canada: An update on recent developments to 2018. J. Pharm. Policy Pract. 2020, 13, 68. [Google Scholar] [CrossRef]
- Schieber, L.Z.; Guy, G.P.; Seth, P.; Losby, J.L. Variation in adult outpatient opioid prescription dispensing by age and sex—United States, 2008–2018. Morb. Mortal. Wkly. Rep. 2020, 69, 298–302. [Google Scholar] [CrossRef] [Green Version]
- Fischer, B.; Rehm, J.; Tyndall, M. Effective Canadian policy to reduce harms from prescription opioids: Learning from past failures. Can. Med Assoc. J. 2016, 188, 1240–1244. [Google Scholar] [CrossRef] [Green Version]
- Gomes, T.; Juurlink, D.; Yao, Z.; Camacho, X.; Paterson, J.M.; Singh, S.; Dhalla, I.; Sproule, B.; Mamdani, M. Impact of legislation and a prescription monitoring program on the prevalence of potentially inappropriate prescriptions for monitored drugs in Ontario: A time series analysis. CMAJ Open 2014, 2, E256–E261. [Google Scholar] [CrossRef] [Green Version]
- Dowell, D.; Haegerich, T.M.; Chou, R. CDC Guideline for prescribing opioids for chronic pain—United States, 2016. JAMA 2016, 315, 1624–1645. [Google Scholar] [CrossRef] [Green Version]
- Pardo, B. Do more robust prescription drug monitoring programs reduce prescription opioid overdose? Addiction 2017, 112, 1773–1783. [Google Scholar] [CrossRef]
- Armenian, P.; Vo, K.T.; Barr-Walker, J.; Lynch, K.L. Fentanyl, fentanyl analogs and novel synthetic opioids: A comprehensive review. Neuropharmacology 2018, 134, 121–132. [Google Scholar] [CrossRef] [Green Version]
- Han, Y.; Yan, W.; Zheng, Y.; Khan, M.Z.; Yuan, K.; Lu, L. The rising crisis of illicit fentanyl use, overdose, and potential therapeutic strategies. Transl. Psychiatry 2019, 9, 1–9. [Google Scholar] [CrossRef] [Green Version]
- Baldwin, N.; Gray, R.; Goel, A.; Wood, E.; Buxton, J.A.; Rieb, L.M. Fentanyl and heroin contained in seized illicit drugs and overdose-related deaths in British Columbia, Canada: An observational analysis. Drug Alcohol Depend. 2018, 185, 322–327. [Google Scholar] [CrossRef]
- Fischer, B.; Jones, W.; Tyndall, M.; Kurdyak, P. Correlations between opioid mortality increases related to illicit/synthetic opioids and reductions of medical opioid dispensing—Exploratory analyses from Canada. BMC Public Health 2020, 20, 143. [Google Scholar] [CrossRef] [Green Version]
- IQVIA. Research Support 2019. Available online: https://www.iqvia.com/institute/research-support (accessed on 24 June 2021).
- CIHI. Pan-Canadian Trends in The Prescribing of Opioids and Benzodiazepines, 2012 to 2017; CIHI: Ottawa, ON, Canada, 2018. [Google Scholar]
- Schanzer, D.; Pogany, L.; Aho, J.; Tomas, K.; Gale-Rowe, M.; Kwong, J.C.; Janjua, N.Z.; Feld, J. Impact of availability of direct-acting antivirals for hepatitis C on Canadian hospitalization rates, 2012–2016. Can. Commun. Dis. Rep. 2018, 44, 150–156. [Google Scholar] [CrossRef]
- WHO. ATC/DDD Index. World Health Organization (WHO): Geneva, Switzerland, 2020. Available online: http://www.whocc.no/atc_ddd_index/ (accessed on 24 June 2021).
- Svendsen, K.; Borchgrevink, P.; Fredheim, O.; Hamunen, K.; Mellbye, A.; Dale, O. Choosing the unit of measurement counts: The use of oral morphine equivalents in studies of opioid consumption is a useful addition to defined daily doses. Palliat. Med. 2011, 25, 725–732. [Google Scholar] [CrossRef]
- R Core Team. R: A Language and Environment for Statistical Computing; R Foundation for Statistical Computing: Vienna, Austria, 2020. [Google Scholar]
- Scholl, L.; Seth, P.; Kariisa, M.; Wilson, N.; Baldwin, G. Drug and opioid-involved overdose deaths—United States, 2013–2017. Morb. Mortal. Wkly. Rep. 2018, 67, 1419–1427. [Google Scholar] [CrossRef]
- Solimini, R.; Pichini, S.; Pacifici, R.; Busardo, F.P.; Giorgetti, R. Pharmacotoxicology of non-fentanyl derived new synthetic opioids. Front. Pharmacol. 2018, 9, 654. [Google Scholar] [CrossRef] [Green Version]
- Moallef, S.; Nosova, E.; Milloy, M.J.; DeBeck, K.; Fairbairn, N.; Wood, E.; Kerr, T.; Hayashi, K. Knowledge of fentanyl and perceived risk of overdose among persons who use drugs in Vancouver, Canada. Public Health Rep. 2019, 134, 423–431. [Google Scholar] [CrossRef]
- Morales, K.B.; Park, J.N.; Glick, J.L.; Rouhani, S.; Green, T.C.; Sherman, S.G. Preference for drugs containing fentanyl from a cross-sectional survey of people who use illicit opioids in three United States cities. Drug Alcohol Depend. 2019, 204, 107547. [Google Scholar] [CrossRef]
- Fairbairn, N.; Coffin, P.O.; Walley, A.Y. Naloxone for heroin, prescription opioid, and illicitly made fentanyl overdoses: Challenges and innovations responding to a dynamic epidemic. Int. J. Drug Policy 2017, 46, 172–179. [Google Scholar] [CrossRef]
- Antoniou, T.; Ala-Leppilampi, K.; Shearer, D.; Parsons, J.A.; Tadrous, M.; Gomes, T. “Like being put on an ice floe and shoved away”: A qualitative study of the impacts of opioid-related policy changes on people who take opioids. Int. J. Drug Policy 2019, 66, 15–22. [Google Scholar] [CrossRef]
- Dassieu, L.; Kabore, J.L.; Choiniere, M.; Arruda, N.; Roy, E. Chronic pain management among people who use drugs: A health policy challenge in the context of the opioid crisis. Int. J. Drug Policy 2019, 71, 150–156. [Google Scholar] [CrossRef]
- Fischer, B.; Varatharajan, T.; Shield, K.; Rehm, J.; Jones, W. Crude estimates of prescription opioid-related misuse and use disorder populations towards informing intervention system need in Canada. Drug Alcohol Depend. 2018, 189, 76–79. [Google Scholar] [CrossRef]
- Payer, D.E.; Young, M.M.; Maloney-Hall, B.; Mill, C.; Leclerc, P.; Buxton, J. Adulterants, Contaminants and Co-Occurring Substances in Drugs on The Illegal Market in Canada: An Analysis of Data from Drug Seizures, Drug Checking and Urine Toxicology; Canadian Centre on Substance Use and Addiction: Ottawa, ON, USA, 2020. [Google Scholar]
- Babor, T.; Caulkins, J.; Fischer, B.; Foxcroft, D.; Humphreys, K.; Medina-Mora, M.E.; Obot, I.; Rehm, J.; Reuter, P.; Room, R.; et al. Drug Policy and The Public Good; Oxford University Press: Oxford, UK, 2018. [Google Scholar]
- Nielsen, S.; Gisev, N.; Bruno, R.; Hall, W.; Cohen, M.; Larance, B.; Campbell, G.; Shanahan, M.; Blyth, F.; Lintzeris, N.; et al. Defined daily doses (DDD) do not accurately reflect opioid doses used in contemporary chronic pain treatment. Pharmacoepidemiol. Drug Saf. 2017, 26, 587–591. [Google Scholar] [CrossRef]
- Fischer, B.; Vojtila, L.; Rehm, J. The ‘fentanyl epidemic’ in Canada—Some cautionary observations focusing on opioid-related mortality. Prev. Med. 2018, 107, 109–113. [Google Scholar] [CrossRef]
- Pardo, B.; Caulkins, J.P.; Kilmer, B.; Liccardo-Pacula, R.; Reuter, P.; Stein, B.D. The synthetic opioid surge in the United States: Insights from mortality and seizure data. RAND Corp. 2019. [Google Scholar] [CrossRef] [Green Version]
- Ivsins, A.; Boyd, J.; Mayer, S.; Collins, A.; Sutherland, C.; Kerr, T.; McNeil, R. Barriers and facilitators to a novel low-barrier hydromorphone distribution program in Vancouver, Canada: A qualitative study. Drug Alcohol Depend. 2020, 216, 108202. [Google Scholar] [CrossRef]
- Tyndall, M. Safer opioid distribution in response to the COVID-19 pandemic. Int. J. Drug Policy 2020, 83, 102880. [Google Scholar] [CrossRef] [PubMed]
- Fischer, B.; Lee, A.; Vojtila, L. ‘Safer opioid distribution’ as an essential public health intervention for the opioid mortality crisis—Considerations, options and examples towards broad-based implementation. Public Health Pract. 2020, 1, 100016. [Google Scholar] [CrossRef]
| Publisher’s Note: MDPI stays neutral with regard to jurisdictional claims in published maps and institutional affiliations. |
© 2021 by the authors. Licensee MDPI, Basel, Switzerland. This article is an open access article distributed under the terms and conditions of the Creative Commons Attribution (CC BY) license (https://creativecommons.org/licenses/by/4.0/).


