
How Is Work Ability Shaped in Groups of Shift and Non-Shift Workers? A Comprehensive Approach to Job Resources and Mediation Role of Emotions at Work


Abstract
:1. Introduction
1.1. The Theoretical Framework of the Current Research
1.2. Work Ability in Shift and Non-Shift Work
1.3. A Comprehensive Approach to Job Resources
1.4. Mediation Role of Positive and Negative Emotions at Work
2. Materials and Methods
2.1. Participants and Procedures
2.2. Measurement
2.3. Analytical Procedure
3. Results
4. Discussion
5. Conclusions
Author Contributions
Funding
Institutional Review Board Statement
Informed Consent Statement
Data Availability Statement
Conflicts of Interest
References
- Lee, A.; Myung, S.K.; Cho, J.J.; Jung, Y.J.; Yoon, J.L.; Kim, M.Y. Night Shift Work and Risk of Depression: Meta-Analysis of Observational Studies. J. Korean Med. Sci. 2017, 32, 1091–1096. [Google Scholar] [CrossRef] [PubMed]
- Rosenberg, K. Shift Work Adversely Affects Mental Health. Am. J. Nurs. 2020, 120, 67. [Google Scholar] [CrossRef] [PubMed]
- Torquati, L.; Mielke, G.I.; Brown, W.J.; Burton, N.W.; Kolbe-Alexander, T.L. Shift Work and Poor Mental Health: A Meta-Analysis of Longitudinal Studies. Am. J. Public Health 2019, 109, e13–e20. [Google Scholar] [CrossRef]
- Santos, A.E.; Araújo, L.F.; Griep, R.H.; Castro Moreno, C.R.; Chor, D.; Barreto, S.M.; Giatti, L. Shift Work, Job Strain, and Metabolic Syndrome: Cross-Sectional Analysis of ELSA-Brasil. Am. J. Ind. Med. 2018, 61, 911–918. [Google Scholar] [CrossRef]
- Souza, R.V.; Sarmento, R.A.; de Almeida, J.C.; Canuto, R. The Effect of Shift Work on Eating Habits: A Systematic Review. Scand. J. Work Environ. Health 2019, 45, 7–21. [Google Scholar] [CrossRef]
- Liu, Q.; Shi, J.; Duan, P.; Liu, B.; Li, T.; Wang, C.; Li, H.; Yang, T.; Gan, Y.; Wang, X.; et al. Is Shift Work Associated with a Higher Risk of Overweight or Obesity? A Systematic Review of Observational Studies with Meta-Analysis. Int. J. Epidemiol. 2018, 47, 1956–1971. [Google Scholar] [CrossRef] [Green Version]
- Sun, M.; Feng, W.; Wang, F.; Li, P.; Li, Z.; Li, M.; Tse, G.; Vlaanderen, J.; Vermeulen, R.; Tse, L.A. Meta-Analysis on Shift Work and Risks of Specific Obesity Types. Obes. Rev. 2018, 19, 28–40. [Google Scholar] [CrossRef]
- Brito, R.S.; Dias, C.; Filho, A.A.; Salles, C. Prevalence of Insomnia in Shift Workers: A Systematic Review. Sleep Sci. 2020, 8, 1–8. [Google Scholar] [CrossRef]
- Wei, T.; Li, C.; Heng, Y.; Gao, X.; Zhang, G.; Wang, H.; Zhao, X.; Meng, Z.; Zhang, Y.; Hou, H. Association between Night-Shift Work and Level of Melatonin: Systematic Review and Meta-Analysis. Sleep Med. 2020, 75, 502–509. [Google Scholar] [CrossRef] [PubMed]
- Cheng, M.; He, H.; Wang, D.; Xu, L.; Wang, B.; Ho, K.M.; Chen, W. Shift Work and Ischaemic Heart Disease: Meta-Analysis and Dose–Response Relationship. Occup. Med. 2019, 69, 182–188. [Google Scholar] [CrossRef] [PubMed]
- Torquati, L.; Mielke, G.I.; Brown, W.J.; Kolbe-Alexander, T. Shift Work and the Risk of Cardiovascular Disease. A Systematic Review and Meta-Analysis Including Dose-Response Relationship. Scand. J. Work Environ. Health 2018, 44, 229–238. [Google Scholar] [CrossRef] [Green Version]
- Wang, D.; Ruan, W.; Chen, Z.; Peng, Y.; Li, W. Shift Work and Risk of Cardiovascular Disease Morbidity and Mortality: A Dose-Response Meta-Analysis of Cohort Studies. Eur. J. Prev. Cardiol. 2018, 25, 1293–1302. [Google Scholar] [CrossRef]
- Li, M.; Huang, J.-T.; Tan, Y.; Yang, B.-P.; Tang, Z.-Y. Shift Work and Risk of Stroke: A Meta-Analysis. Int. J. Cardiol. 2016, 214, 370–373. [Google Scholar] [CrossRef]
- Liu, W.; Zhou, Z.; Dong, D.; Sun, L.; Zhang, G. Sex Differences in the Association between Night Shift Work and the Risk of Cancers: A Meta-Analysis of 57 Articles. Dis. Markers 2018, 2018, 7925219. [Google Scholar] [CrossRef] [PubMed]
- Szkiela, M.; Kusideł, E.; Makowiec-Dąbrowska, T.; Kaleta, D. Night Shift Work—A Risk Factor for Breast Cancer. Int. J. Environ. Res. Public Health 2020, 17, 659. [Google Scholar] [CrossRef] [PubMed] [Green Version]
- Manouchehri, E.; Taghipour, A.; Ghavami, V.; Ebadi, A.; Homaei, F.; Latifnejad Roudsari, R. Night-Shift Work Duration and Breast Cancer Risk: An Updated Systematic Review and Meta-Analysis. BMC Womens Health 2021, 21, 431–447. [Google Scholar] [CrossRef] [PubMed]
- Bakker, A.B.; Demerouti, E. Job demands-resources theory. In Wellbeing: A Complete Reference Guide. Work and Wellbeing, 1st ed.; Chen, P.Y., Cooper, C.L., Eds.; Wiley Blackwell: Chichester, UK, 2014; Volume 3, pp. 37–64. [Google Scholar] [CrossRef]
- Hobfoll, S.E. Conservation of Resources: A New Attempt at Conceptualizing Stress. Am. Psychol. 1989, 44, 513–524. [Google Scholar] [CrossRef] [PubMed]
- Fredrickson, B.L. What Good Are Positive Emotions? Rev. Gen. Psychol. 1998, 2, 300–319. [Google Scholar] [CrossRef]
- Fredrickson, B.L. The Role of Positive Emotions in Positive Psychology. Am. Psychol. 2001, 56, 218–226. [Google Scholar] [CrossRef]
- Hakanen, J.J.; Schaufeli, W.B.; Ahola, K. The Job Demands-Resources Model: A Three-Year Cross-Lagged Study of Burnout, Depression, Commitment, and Work Engagement. Work Stress 2008, 22, 224–241. [Google Scholar] [CrossRef]
- Sonnentag, S. Recovery, Work Engagement, and Proactive Behavior: A New Look at the Interface between Nonwork and Work. J. Appl. Psychol. 2003, 88, 518–528. [Google Scholar] [CrossRef] [Green Version]
- Airila, A.; Hakanen, J.; Punakallio, A.; Lusa, S.; Luukkonen, R. Is Work Engagement Related to Work Ability beyond Working Conditions and Lifestyle Factors? Int. Arch. Occup. Environ. Health 2012, 85, 915–925. [Google Scholar] [CrossRef]
- Airila, A.; Hakanen, J.J.; Schaufeli, W.B.; Luukkonen, R.; Punakallio, A.; Lusa, S. Are Job and Personal Resources Associated with Work Ability 10 Years Later? The Mediating Role of Work Engagement. Work Stress 2014, 28, 87–105. [Google Scholar] [CrossRef]
- McGonagle, A.K.; Barnes-Farrell, J.L.; Milia, L.D.; Fischer, F.M.; Hobbs, B.B.B.; Iskra-Golec, I.; Kaliterna, L.; Smith, L. Demands, Resources, and Work Ability: A Cross-National Examination of Health Care Workers. Eur. J. Work Organ. Psychol. 2014, 23, 830–846. [Google Scholar] [CrossRef]
- Pohjonen, T. Perceived Work Ability of Home Care Workers in Relation to Individual and Work-Related Factors in Different Age Groups. Occup. Med. 2001, 51, 209–217. [Google Scholar] [CrossRef] [Green Version]
- Stuer, D.; De Vos, A.; Van der Heijden, B.I.J.M.; Akkermans, J. A Sustainable Career Perspective of Work Ability: The Importance of Resources across the Lifespan. Int. J. Environ. Res. Public Health 2019, 16, 2572. [Google Scholar] [CrossRef] [PubMed] [Green Version]
- Hobfoll, S.E. The Influence of Culture, Community, and the Nested-Self in the Stress Process: Advancing Conservation of Resources Theory. Appl. Psychol. 2001, 50, 337–421. [Google Scholar] [CrossRef]
- Hakanen, J.J.; Perhoniemi, R.; Toppinen-Tanner, S. Positive Gain Spirals at Work: From Job Resources to Work Engagement, Personal Initiative and Work-Unit Innovativeness. J. Vocat. Behav. 2008, 73, 78–91. [Google Scholar] [CrossRef]
- Xanthopoulou, D.; Bakker, A.B.; Demerouti, E.; Schaufeli, W.B. The Role of Personal Resources in the Job Demands-Resources Model. Int. J. Stress Manag. 2007, 14, 121–141. [Google Scholar] [CrossRef] [Green Version]
- Berthelsen, H.; Hakanen, J.J.; Westerlund, H. Copenhagen Psychosocial Questionnaire—A Validation Study Using the Job Demand-Resources Model. PLoS ONE 2018, 13, e0196450. [Google Scholar] [CrossRef] [Green Version]
- Bakker, A.B.; Demerouti, E. The Job Demands-Resources Model: State of the Art. J. Manag. Psychol. 2007, 22, 309–328. [Google Scholar] [CrossRef] [Green Version]
- Fox, S.; Spector, P.E. Emotions in the Workplace: The Neglected Side of Organizational Life Introduction. Hum. Resour. Manag. Rev. 2002, 12, 167–171. [Google Scholar] [CrossRef]
- Diener, E.; Thapa, S.; Tay, L. Positive Emotions at Work. Annu. Rev. Organ. Psychol. Organ. Behav. 2020, 7, 451–477. [Google Scholar] [CrossRef] [Green Version]
- Ouweneel, E.; Le Blanc, P.M.; Schaufeli, W.B.; van Wijhe, C.I. Good Morning, Good Day: A Diary Study on Positive Emotions, Hope, and Work Engagement. Hum. Relat. 2012, 65, 1129–1154. [Google Scholar] [CrossRef] [Green Version]
- Spector, P.E.; Fox, S. An Emotion-Centered Model of Voluntary Work Behavior. Hum. Resour. Manag. Rev. 2002, 12, 269–292. [Google Scholar] [CrossRef]
- Bakker, A.B.; Derks, D. Positive occupational health psychology. In Occupational Health Psychology; Leka, S., Houdmont, J., Eds.; Wiley Blackwell: Chichester, UK, 2010; pp. 194–224. [Google Scholar]
- Robertson, I.; Cooper, C. Well-Being: Productivity and Happiness at Work; Palgrave Macmillan: London, UK, 2011. [Google Scholar]
- Schaufeli, W.; Salanova, M. Work Engagement. An Emerging Psychological Concept and Its Implications for Organizations. In Research in Social Issues in Management: Managing Social and Ethical Issues in Organizations; Information Age Publishing: Charlotte, NC, USA, 2007; Volume 5, pp. 135–177. [Google Scholar]
- Bakker, A.B.; Schaufeli, W.B. Positive Organizational Behavior: Engaged Employees in Flourishing Organizations. J. Organ. Behav. 2008, 29, 147–154. [Google Scholar] [CrossRef]
- Herzberg, F. Motivation-Hygiene Profiles: Pinpointing What Ails the Organization. Organ. Dyn. 1974, 3, 18–29. [Google Scholar] [CrossRef]
- Ilmarinen, J. Work Ability—A Comprehensive Concept for Occupational Health Research and Prevention. Scand. J. Work Environ. Health 2009, 35, 1–5. [Google Scholar] [CrossRef]
- Tuomi, K.; Ilmarinen, J.; Jahkola, A.; Katajarinne, L.; Tulkki, A. Work Ability Index, 2nd ed.; Finnish Institute of Occupational Health: Helsinki, Finland, 1998. [Google Scholar]
- Bugajska, J.; Makowiec-Dąbrowska, T. Work Ability Assessment: An Important Element of Workers Health Protection. In Individual and Occupational Determinants: Work Ability in People with Health Problems, 1st ed.; Bugajska, J., Makowiec-Dąbrowska, T., Kostka, T., Eds.; CRC Press: Boca Raton, FL, USA; Taylor & Francis Group: London, UK, 2021; pp. 3–6. [Google Scholar]
- Alavinia, S.M.; de Boer, A.G.E.M.; van Duivenbooden, J.C.; Frings-Dresen, M.H.W.; Burdorf, A. Determinants of Work Ability and Its Predictive Value for Disability. Occup. Med. 2009, 59, 32–37. [Google Scholar] [CrossRef] [Green Version]
- Bugajska, J.; Baka, Ł.; Kapica, Ł. Dynamics of Changes in Work Ability According to the Type of Work, Age and Gender of Employees—Results of Research. In Individual and Occupational Determinants: Work Ability in People with Health Problems, 1st ed.; Bugajska, J., Makowiec-Dąbrowska, T., Kostka, T., Eds.; CRC Press: Boca Raton, FL, USA; Taylor & Francis Group: London, UK, 2021; pp. 17–27. [Google Scholar]
- Sjögren, T.; Ojanen, M.; Leskinen, E.; Tmustalampi, S.; Mälkiä, E. Physical and Psychosocial Prerequisite of Functioning in Relation to Work Ability and General Subjective Well-Being among Office Workers. Scand. J. Work Environ. Health 2002, 28, 184–190. [Google Scholar] [CrossRef] [Green Version]
- Tuomi, K.; Eskelinen, L.; Toikkanen, J.; Jarvinen, E.; Ilmarinen, J.; Klockars, M. Work Load and Individual Factors Affecting Work Ability among Aging Municipal Workers. Scand. J. Work Environ. Health 1991, 17 (Suppl. 1), 128–134. [Google Scholar]
- Van den Berg, T.I.J.; Elders, L.A.M.; de Zwart, B.C.H.; Burdorf, A. The Effects of Work-Related and Individual Factors on the Work Ability Index: A Systematic Review. Occup. Environ. Med. 2009, 66, 211–220. [Google Scholar] [CrossRef] [PubMed] [Green Version]
- Camerino, D.; Conway, P.M.; Sartori, S.; Campanini, P.; Estryn-Béhar, M.; van der Heijden, B.I.J.M.; Costa, G. Factors Affecting Work Ability in Day and Shift-Working Nurses. Chronobiol. Int. 2008, 25, 425–442. [Google Scholar] [CrossRef] [PubMed]
- Costa, G. Some Considerations about Aging, Shift Work and Work Ability. Int. Congr. 2005, 1280, 67–72. [Google Scholar] [CrossRef]
- Fischer, F.M.; Notarnicola da Silva Borges, F.; Rotenberg, L.; do Rosario Dias de Oliveira Latorre, M.; Santos Soares, N.; Ferreira Santa Rosa, P.L.; Reis Teixeira, L.; Nagai, R.; Steluti, J.; Landsbergis, P. Work Ability of Health Care Shift Workers: What Matters? Chronobiol. Int. 2006, 23, 1165–1179. [Google Scholar] [CrossRef] [PubMed]
- Makowiec-Dąbrowska, T. Work Ability Index and Its Relationships to Factors Characterizing Work, Non-professional Loads and Individual Factors—Results of Research. In Individual and Occupational Determinants: Work Ability in People with Health Problems, 1st ed.; Bugajska, J., Makowiec-Dąbrowska, T., Kostka, T., Eds.; CRC Press: Boca Raton, FL, USA; Taylor & Francis Group: London, UK, 2021; pp. 29–71. [Google Scholar]
- Sorić, M.; Golubić, R.; Milosević, M.; Juras, K.; Mustajbegović, J. Shift Work, Quality of Life and Work Ability among Croatian Hospital Nurses. Coll. Antropol. 2013, 37, 379–384. [Google Scholar] [PubMed]
- Demerouti, E.; Nachreiner, F.; Schaufeli, W. The Job Demands–Resources Model of Burnout. J. Appl. Psychol. 2001, 86, 499–512. [Google Scholar] [CrossRef]
- Deci, E.L.; Ryan, R.M. Human Autonomy. In Efficacy, Agency, and Self-Esteem; Kernis, M.H., Ed.; The Springer Series in Social Clinical Psychology; Springer: Boston, MA, USA, 1995; pp. 31–49. [Google Scholar]
- Salanova, M.; Bakker, A.B.; Llorens, S. Flow at Work: Evidence for an Upward Spiral of Personal and Organizational Resources. J. Happiness Stud. 2006, 7, 1–22. [Google Scholar] [CrossRef] [Green Version]
- Clark, L.A.; Watson, D. Tripartite Model of Anxiety and Depression: Psychometric Evidence and Taxonomic Implications. J. Abnorm. Psychol. 1991, 100, 316–336. [Google Scholar] [CrossRef]
- Tellegen, A.; Watson, D.; Clark, L.A. On the Dimensional and Hierarchical Structure of Affect. Psychol. Sci. 1999, 10, 297–303. [Google Scholar] [CrossRef]
- Watson, D.; Clark, L.A.; Tellegen, A. Development and Validation of Brief Measures of Positive and Negative Affect: The PANAS Scales. J. Pers. Soc. Psychol. 1988, 54, 1063–1070. [Google Scholar] [CrossRef] [PubMed]
- Gray, E.K.; Watson, D. Emotion, mood, and temperament: Similarities, differences, and a synthesis. In Emotions at Work: Theory, Research and Applications for Management, 1st ed.; Payne, R.L., Cooper, C.L., Eds.; John Wiley & Sons Ltd.: Chichester, UK, 2001; pp. 21–43. [Google Scholar]
- Fredrickson, B.L.; Joiner, T. Positive Emotions Trigger Upward Spirals toward Emotional Well-Being. Psychol. Sci. 2002, 13, 172–175. [Google Scholar] [CrossRef] [PubMed]
- Fredrickson, B. The Value of Positive Emotions—The Emerging Science of Positive Psychology in Coming to Understand Why It’s Good to Feel Good. Am. Sci. 2003, 91, 330–335. [Google Scholar] [CrossRef]
- Schaufeli, W.; van Rhenen, W. Over de Rol van Positieve En Negatieve Emoties Bij Het Welbevinden van Managers: Een Studie Met de Job-Related Affective Well-Being Scale (JAWS) [About the Role of Positive and Negative Emotions in Managers’ Wellbeing: A Study Using the Job-Related Affective Well-Being Scale (JAWS)]. Gedrag Organ. 2006, 19, 323–344. [Google Scholar]
- Bono, J.E.; Foldes, H.J.; Vinson, G.; Muros, J.P. Workplace Emotions: The Role of Supervision and Leadership. J. Appl. Psychol. 2007, 92, 1357–1367. [Google Scholar] [CrossRef] [PubMed]
- Idris, M.A.; Dollard, M.F. Psychosocial Safety Climate, Work Conditions, and Emotions in the Workplace: A Malaysian Population-Based Work Stress Study. Int. J. Stress Manag. 2011, 18, 324–347. [Google Scholar] [CrossRef] [Green Version]
- Moreira-Fontán, E.; García-Señorán, M.; Conde-Rodríguez, Á.; González, A. Teachers’ ICT-Related Self-Efficacy, Job Resources, and Positive Emotions: Their Structural Relations with Autonomous Motivation and Work Engagement. Comput. Educ. 2019, 134, 63–77. [Google Scholar] [CrossRef]
- Xanthopoulou, D.; Bakker, A.B.; Demerouti, E.; Schaufeli, W.B. A Diary Study on the Happy Worker: How Job Resources Relate to Positive Emotions and Personal Resources. Eur. J. Work Organ. Psychol. 2012, 21, 489–517. [Google Scholar] [CrossRef] [Green Version]
- Fredrickson, B.L. The Broaden-and-Build Theory of Positive Emotions. Philos. Trans. R. Soc. B Biol. Sci. 2004, 359, 1367–1378. [Google Scholar] [CrossRef]
- Blanchflower, D.G.; Oswald, A.J.; Stewart-Brown, S. Is Psychological Well-Being Linked to the Consumption of Fruit and Vegetables? Soc. Indic. Res. 2013, 114, 785–801. [Google Scholar] [CrossRef] [Green Version]
- Davidson, K.W.; Mostofsky, E.; Whang, W. Don’t Worry, Be Happy: Positive Affect and Reduced 10-Year Incident Coronary Heart Disease: The Canadian Nova Scotia Health Survey. Eur. Heart J. 2010, 31, 1065–1070. [Google Scholar] [CrossRef] [PubMed]
- Wiese, C.; Chen, Z.; Tay, L.; Friedman, E.; Rector, J. The Role of Affect on Physical Health Over Time: A Cross-Lagged Panel Analysis Over 20 Years. Appl. Psychol. Health Well-Being 2018, 11, 202–222. [Google Scholar] [CrossRef]
- Fredrickson, B.L.; Levenson, R.W. Positive Emotions Speed Recovery from the Cardiovascular Sequelae of Negative Emotions. Cogn. Emot. 1998, 12, 191–220. [Google Scholar] [CrossRef] [PubMed] [Green Version]
- Miner, A.G.; Glomb, T.M.; Hulin, C. Experience Sampling Mood and Its Correlates at Work. J. Occup. Organ. Psychol. 2005, 78, 171–193. [Google Scholar] [CrossRef]
- Sirois, B.C.; Burg, M.M. Negative Emotion and Coronary Heart Disease: A Review. Behav. Modif. 2003, 27, 83–102. [Google Scholar] [CrossRef]
- Kunzmann, U.; Schilling, O.; Wrosch, C.; Siebert, J.; Katzorreck, M.; Wahl, H.-W.; Gerstorf, D. Negative Emotions and Chronic Physical Illness: A Lifespan Developmental Perspective. Health Psychol. 2019, 38, 949–959. [Google Scholar] [CrossRef]
- Baglioni, C.; Spiegelhalder, K.; Lombardo, C.; Riemann, D. Sleep and Emotions: A Focus on Insomnia. Sleep Med. Rev. 2010, 14, 227–238. [Google Scholar] [CrossRef]
- Butcher, J.N.; Hooley, J.M.; Nock, M.K.; Mineka, S. Abnormal Psychology, 17th ed.; Pearson Education Ltd.: Harlow, UK, 2017. [Google Scholar]
- Bakker, A.B.; de Vries, J.D. Job Demands–Resources Theory and Self-Regulation: New Explanations and Remedies for Job Burnout. Anxiety Stress Coping 2021, 34, 1–21. [Google Scholar] [CrossRef] [PubMed]
- Labour Code of 26 June 1974 (Dz.U. 1974 Nr 24 poz. 141), Poland. Available online: https://www.ilo.org/dyn/natlex/natlex4.detail?p_lang=en&p_isn=45181 (accessed on 7 July 2021).
- Knauth, P. Designing Better Shift Systems. Appl. Ergon. 1996, 27, 39–44. [Google Scholar] [CrossRef]
- Statistical Yearbook of the Republic of Poland; Statistics Poland: Warsaw, Poland, 2018. Available online: https://stat.gov.pl/obszary-tematyczne/roczniki-statystyczne/roczniki-statystyczne/rocznik-statystyczny-rzeczypospolitej-polskiej-2018,2,18.html (accessed on 18 June 2021).
- Employees Working Shifts as a Percentage of the Total of Employees, by Sex and Age (%). Eurostat: Luxembourg, 2021. Available online: https://appsso.eurostat.ec.europa.eu/nui/show.do?dataset=lfsa_ewp.shi&lang=en (accessed on 18 June 2021).
- McHugh, M.; French, D.D.; Kwasny, M.M.; Maechling, C.R.; Holl, J.L. The Impact of Shift Work and Long Work Hours on Employers’ Health Care Costs. J. Occup. Environ. Med. 2020, 62, 1006–1010. [Google Scholar] [CrossRef]
- Pokorski, J. Indeks Zdolności do Pracy—Polska Adaptacja [Work Ability Index—Polish Adaptation]; Wydawnictwo Uniwersytetu Jagiellońskiego: Kraków, Poland, 1998. [Google Scholar]
- Burke, M.J.; Brief, A.P.; George, J.M.; Roberson, L.; Webster, J. Measuring Affect at Work: Confirmatory Analyses of Competing Mood Structures with Conceptual Linkage to Cortical Regulatory Systems. J. Pers. Soc. Psychol. 1989, 57, 1091–1102. [Google Scholar] [CrossRef] [PubMed]
- Zalewska, A.M. Skala afektu w pracy—Wstępne wyniki prac nad adaptacją techniki [Job affect scale—Previous results of the technique adaptation research]. Stud. Psychol. 2002, 40, 173–192. [Google Scholar]
- Pejtersen, J.H.; Kristensen, T.S.; Borg, V.; Bjorner, J.B. The Second Version of the Copenhagen Psychosocial Questionnaire. Scand. J. Public Health 2010, 38, 8–24. [Google Scholar] [CrossRef] [PubMed]
- Baka, Ł. Kopenhaski Kwestionariusz Psychospołeczny (COPSOQ II). Podręcznik do Polskiej Wersji Narzędzia [Copenhagen Psychosocial Questionnaire (COPSOQ II). A Manual for the Polish Version of the Tool]; Centralny Instytut Ochrony Pracy—Państwowy Instytut Badawczy: Warszawa, Poland, 2019. [Google Scholar]
- Kline, R.B. Principles and Practice of Structural Equation Modeling, 4th ed.; Guilford Press: New York, NY, USA, 2016. [Google Scholar]
- Whittaker, T.A. Structural equation modeling. In Applied Multivariate Statistics for the Social Sciences, 6th ed.; Pituch, K.A., Stevens, J.P., Eds.; Routledge: New York, NY, USA, 2016; pp. 639–746. [Google Scholar]
- Hu, L.; Bentler, P.M. Evaluating model fit. In Structural Equation Modeling: Issues, Concepts, and Applications; Hoyle, R., Ed.; Sagem: Newbury Park, CA, USA, 1995; pp. 76–99. [Google Scholar]
- Byrne, B.M. Structural Equation Modeling with AMOS: Basic Concepts, Applications, and Programming, 2nd ed.; Routledge: New York, NY, USA, 2010. [Google Scholar]
- Tabachnick, B.G.; Fidell, L.S. Using Multivariate Statistics, 6th ed.; Pearson: Upper Saddle River, NJ, USA, 2013. [Google Scholar]
- Hu, L.; Bentler, P.M. Cutoff Criteria for Fit Indexes in Covariance Structure Analysis: Conventional Criteria versus New Alternatives. Struct. Equ. Modeling 1999, 6, 1–55. [Google Scholar] [CrossRef]
- Akaike, H. A new look at the statistical model identification. IEEE Trans. Automat. Contr. 1974, 19, 716–723. [Google Scholar] [CrossRef]
- Chou, C.P.; Bentler, P.M. Invariant standardized estimated parameter change for model modification in covariance structure analysis. Multivar. Behav. Res. 1993, 28, 97–110. [Google Scholar] [CrossRef]
- Lipovčan, L.K.; Prizmić-Larsen, Z.; Zganec, N. Quality of life, life satisfaction and happiness in shift- and non-shiftworkers. Rev. Saude Publica 2004, 38, 3–10. [Google Scholar] [CrossRef] [Green Version]
- Halbesleben, J.R.B. A meta-analysis of work engagement: Relationships with burnout, demands, resources, and consequences. In Work Engagement: A Handbook of Essential Theory and Research; Bakker, A.B., Leiter, M.P., Eds.; Psychology Press: Hove, UK; Taylor & Francis Group: New York, NY, USA, 2010; pp. 102–117. [Google Scholar]
- Dewa, C.S.; Loong, D.; Bonato, S.; Trojanowski, L. The Relationship between Physician Burnout and Quality of Healthcare in Terms of Safety and Acceptability: A Systematic Review. BMJ Open 2017, 7, e015141. [Google Scholar] [CrossRef]
- Hall, L.H.; Johnson, J.; Watt, I.; Tsipa, A.; O’Connor, D.B. Healthcare Staff Wellbeing, Burnout, and Patient Safety: A Systematic Review. PLoS ONE 2016, 11, e0159015. [Google Scholar] [CrossRef]
- Tse, J.L.M.; Flin, R.; Mearns, K. Bus Driver Well-Being Review: 50 Years of Research. Transp. Res. Part F Traffic Psychol. Behav. 2006, 9, 89–114. [Google Scholar] [CrossRef]
- Bowen, L.; Budden, S.L.; Smith, A.P. Factors Underpinning Unsafe Driving: A Systematic Literature Review of Car Drivers. Transp. Res. Part F Traffic Psychol. Behav. 2020, 72, 184–210. [Google Scholar] [CrossRef]
- Taris, T.W.; Schaufeli, W.B. Individual well-being and performance at work: A conceptual and theoretical overview. In Well-Being and Performance at Work. The Role of Context, 1st ed.; Van Veldhoven, M., Peccei, R., Eds.; Psychology Press: Hove, UK; Taylor & Francis Group: New York, NY, USA, 2014; pp. 1–20. Available online: https://www.wilmarschaufeli.nl/publications/Schaufeli/434.pdf (accessed on 10 May 2021).
- Oksanen, T.; Kouvonen, A.; Kivimäki, M.; Pentti, J.; Virtanen, M.; Linna, A.; Vahtera, J. Social Capital at Work as a Predictor of Employee Health: Multilevel Evidence from Work Units in Finland. Soc. Sci. Med. 2008, 66, 637–649. [Google Scholar] [CrossRef]
- Grant, A.M.; Parker, S.K. Redesigning Work Design Theories: The Rise of Relational and Proactive Perspectives. Acad. Manag. Ann. 2009, 3, 317–375. [Google Scholar] [CrossRef]
- Osterman, K.F. Students’ Need for Belonging in the School Community. Rev. Educ. Res. 2000, 70, 323–367. [Google Scholar] [CrossRef]
- Griffin, M.; Neal, A.; Parker, S. A New Model of Work Role Performance: Positive Behavior in Uncertain and Interdependent Contexts. Acad. Manag. J. 2007, 50, 327–347. [Google Scholar] [CrossRef] [Green Version]
- Mohrman, S.A.; Cohen, S.G.; Morhman, A.M., Jr. Designing Team-Based Organizations: New Forms for Knowledge Work; Jossey-Bass: San Francisco, CA, USA, 1995. [Google Scholar]
- Lindebaum, D.; Jordan, P.J. When It Can Be Good to Feel Bad and Bad to Feel Good: Exploring Asymmetries in Workplace Emotional Outcomes. Hum. Relat. 2014, 67, 1037–1050. [Google Scholar] [CrossRef]
- Knight, A.P.; Eisenkraft, N. Positive Is Usually Good, Negative Is Not Always Bad: The Effects of Group Affect on Social Integration and Task Performance. J. Appl. Psychol. 2015, 100, 1214–1227. [Google Scholar] [CrossRef] [PubMed]
- Lindebaum, D.; Geddes, D. The Place and Role of (Moral) Anger in Organizational Behavior Studies. J. Organ. Behav. 2016, 37, 738–757. [Google Scholar] [CrossRef] [PubMed] [Green Version]
- Leach, C.W.; Cidam, A. When Is Shame Linked to Constructive Approach Orientation? A Meta-Analysis. J. Pers. Soc. Psychol. 2015, 109, 983–1002. [Google Scholar] [CrossRef]
- Bartlett, M.Y.; DeSteno, D. Gratitude and Prosocial Behavior: Helping When It Costs You. Psychol. Sci. 2006, 17, 319–325. [Google Scholar] [CrossRef]
- Saksvik-Lehouillier, I.; Bjorvatn, B.; Hetland, H.; Sandal, G.; Pallesen, S. Individual Differences in Tolerance to Shift Work—A Systematic Review. Sleep Med. Rev. 2011, 15, 221–235. [Google Scholar] [CrossRef] [PubMed]
- Portela, L.F.; Luna, C.K.; Rotenberg, L.; Silva-Costa, A.; Toivane, S.; Araújo, T.; Härter Griep, R. Job Strain and Self-Reported Insomnia Symptoms among Nurses: What about the Influence of Emotional Demands and Social Support? Biomed. Res. Int. 2015, 8, 1–9. [Google Scholar] [CrossRef] [PubMed]
- Wang, H.; Dai, X.; Yao, Z.; Zhu, X.; Jiang, Y.; Li, J.; Han, B. The prevalence and risk factors for depressive symptoms in frontline nurses under COVID-19 pandemic based on a large cross-sectional study using the propensity score-matched method. BMC Psychiatry 2021, 152, 1–10. [Google Scholar] [CrossRef]
- Tement, S.; Pohl, N.; Horvat, M.; Musil, B.; Jakus, G.; Sodnik, J. Driving demands, stress reactivity and driving behavior: An interactional approach. Transp. Res. Part F Traffic Psychol. Behav. 2020, 69, 80–90. [Google Scholar] [CrossRef]
- Onate-Vega, D.; Oviedo-Trespalacios, O.; King, M.J. How drivers adapt their behaviour to changes in task complexity: The role of secondary task demands and road environment factors. Transp. Res. Part F Traffic Psychol. Behav. 2020, 71, 145–156. [Google Scholar] [CrossRef]
- Kim, H.; Jang, T.W.; Kim, H.R.; Lee, S. Evaluation for Fatigue and Accident Risk of Korean Commercial Bus Drivers. Tohoku J. Exp. Med. 2018, 246, 191–197. [Google Scholar] [CrossRef] [Green Version]
- Saurin, T.A.; Ferreira, C.B. The impacts of lean production on working conditions: A case study of a harvester assembly line in Brazil. Int. J. Ind. Ergon. 2009, 39, 403–412. [Google Scholar] [CrossRef]
- Wang, M.L.; Storey, E.; Cassidy, L.D.; Doney, B.; Conner, P.R.; Collins, J.J.; Carson, M.; Molenaar, D. Longitudinal and Cross-sectional Analyses of Lung Function in Toluene Diisocyanate Production Workers. J. Occup. Environ. Med. 2017, 59, 28–35. [Google Scholar] [CrossRef]
- Fiorillo, A.; Gorwood, P. The Consequences of the COVID-19 Pandemic on Mental Health and Implications for Clinical Practice. Eur. Psychiatry 2020, 63, e32. [Google Scholar] [CrossRef] [Green Version]
- Abdulah, D.M.; Musa, D.H. Insomnia and Stress of Physicians during COVID-19 Outbreak. Sleep Med. X 2020, 2, 1–7. [Google Scholar] [CrossRef]
- Liu, L.; Miller, H.J.; Scheff, J. The Impacts of COVID-19 Pandemic on Public Transit Demand in the United States. PLoS ONE 2020, 15, e0242476. [Google Scholar] [CrossRef] [PubMed]
- Shafi, M.; Liu, J.; Ren, W. Impact of COVID-19 Pandemic on Micro, Small, and Medium-Sized Enterprises Operating in Pakistan. Res. Glob. 2020, 2, 1–14. [Google Scholar] [CrossRef]


| Models | Χ2 | df | RMSEA | PClose | 90 LLCI | 90 ULCI | SRMR | TLI | GFI | CFI |
|---|---|---|---|---|---|---|---|---|---|---|
| (TR) first order | 341.646 | 57 | 0.082 | 0.000 | 0.074 | 0.091 | 0.0810 | 0.911 | 0.932 | 0.935 |
| (TR) second order | 353.977 | 59 | 0.082 | 0.000 | 0.074 | 0.091 | 0.0856 | 0.911 | 0.929 | 0.933 |
| (IR) first order | 148.483 | 22 | 0.089 | 0.000 | 0.076 | 0.103 | 0.0902 | 0.949 | 0.958 | 0.969 |
| (IR) second order | 148.483 | 22 | 0.089 | 0.000 | 0.076 | 0.103 | 0.0902 | 0.949 | 0.958 | 0.969 |
| (LR) first order | 614.326 | 154 | 0.064 | 0.000 | 0.059 | 0.070 | 0.0421 | 0.933 | 0.919 | 0.946 |
| (LR) second order | 762.444 | 161 | 0.072 | 0.000 | 0.067 | 0.077 | 0.0587 | 0.917 | 0.904 | 0.929 |
| (WA) first order | 68.193 | 13 | 0.077 | 0.006 | 0.060 | 0.096 | 0.0587 | 0.951 | 0.974 | 0.970 |
| (PA) first order | 89.631 | 24 | 0.063 | 0.057 | 0.049 | 0.077 | 0.0363 | 0.952 | 0.973 | 0.968 |
| (NA) first order | 213.813 | 33 | 0.087 | 0.000 | 0.076 | 0.098 | 0.0295 | 0.955 | 0.944 | 0.967 |
| Non-Shift | Shift | t | p | d-Cohen | |||||||
|---|---|---|---|---|---|---|---|---|---|---|---|
| M | SD | SKE | KUR | M | SD | SKE | KUR | ||||
| Age | 43.02 | 10.73 | 0.106 | −1.07 | 42.41 | 10.54 | 0.086 | −1.05 | 1.102 | 0.270 | 0.057 |
| (WA) Work ability index | 29.25 | 5.47 | −0.710 | 0.110 | 29.20 | 5.47 | −0.803 | 0.382 | 0.173 | 0.863 | 0.009 |
| (TR) Task resources | 55.52 | 13.76 | 0.213 | −0.346 | 56.68 | 14.64 | −0.246 | −0.082 | 1.598 | 0.110 | 0.082 |
| (IR) Interpersonal resources | 60.55 | 17.35 | 0.089 | −0.540 | 61.75 | 17.82 | −0.307 | −0.378 | 1.325 | 0.185 | 0.068 |
| (LR) Leadership resources | 60.75 | 15.02 | 0.157 | −0.605 | 59.36 | 15.10 | −0.024 | −0.017 | 1.787 | 0.074 | 0.092 |
| (PA) Positive affect | 43.89 | 7.37 | 0.173 | 0.644 | 43.72 | 8.64 | −0.008 | 0.186 | 0.413 | 0.680 | 0.021 |
| (NA) Negative affect | 28.49 | 11.27 | 0.125 | −1.017 | 26.96 | 11.42 | 0.510 | −0.297 | 2.628 | 0.009 | 0.135 |
| Non-Shift | Shift | |||
|---|---|---|---|---|
| Model 1 | Model 2 | Model 1 | Model 2 | |
| Chi-kwadrat | 2.084 | 5.498 | 6.551 | 8.341 |
| Chi-kwadrat (p) | 0.149 | 0.358 | 0.01 | 0.100 |
| Cmin/df | 2.084 | 1.100 | 6.551 | 2.085 |
| TLI | 0.986 | 0.998 | 0.946 | 0.989 |
| GFI | 0.999 | 0.997 | 0.997 | 0.996 |
| AGFI | 0.980 | 0.989 | 0.939 | 0.981 |
| ECVI | 0.058 | 0.052 | 0.062 | 0.057 |
| LO 90 | 0.057 | 0.051 | 0.056 | 0.051 |
| HI 90 | 0.070 | 0.066 | 0.078 | 0.073 |
| CAIC | 153.725 | 126.810 | 158.953 | 137.882 |
| AIC | 41.084 | 37.498 | 46.551 | 42.341 |
| RMSEA | 0.039 | 0.012 | 0.086 | 0.038 |
| PCLOSE | 0.462 | 0.923 | 0.117 | 0.653 |
| 90 LLCI | 0.000 | 0.000 | 0.033 | 0.000 |
| 90 ULCI | 0.115 | 0.054 | 0.154 | 0.075 |
| SRMR | 0.009 | 0.013 | 0.016 | 0.021 |
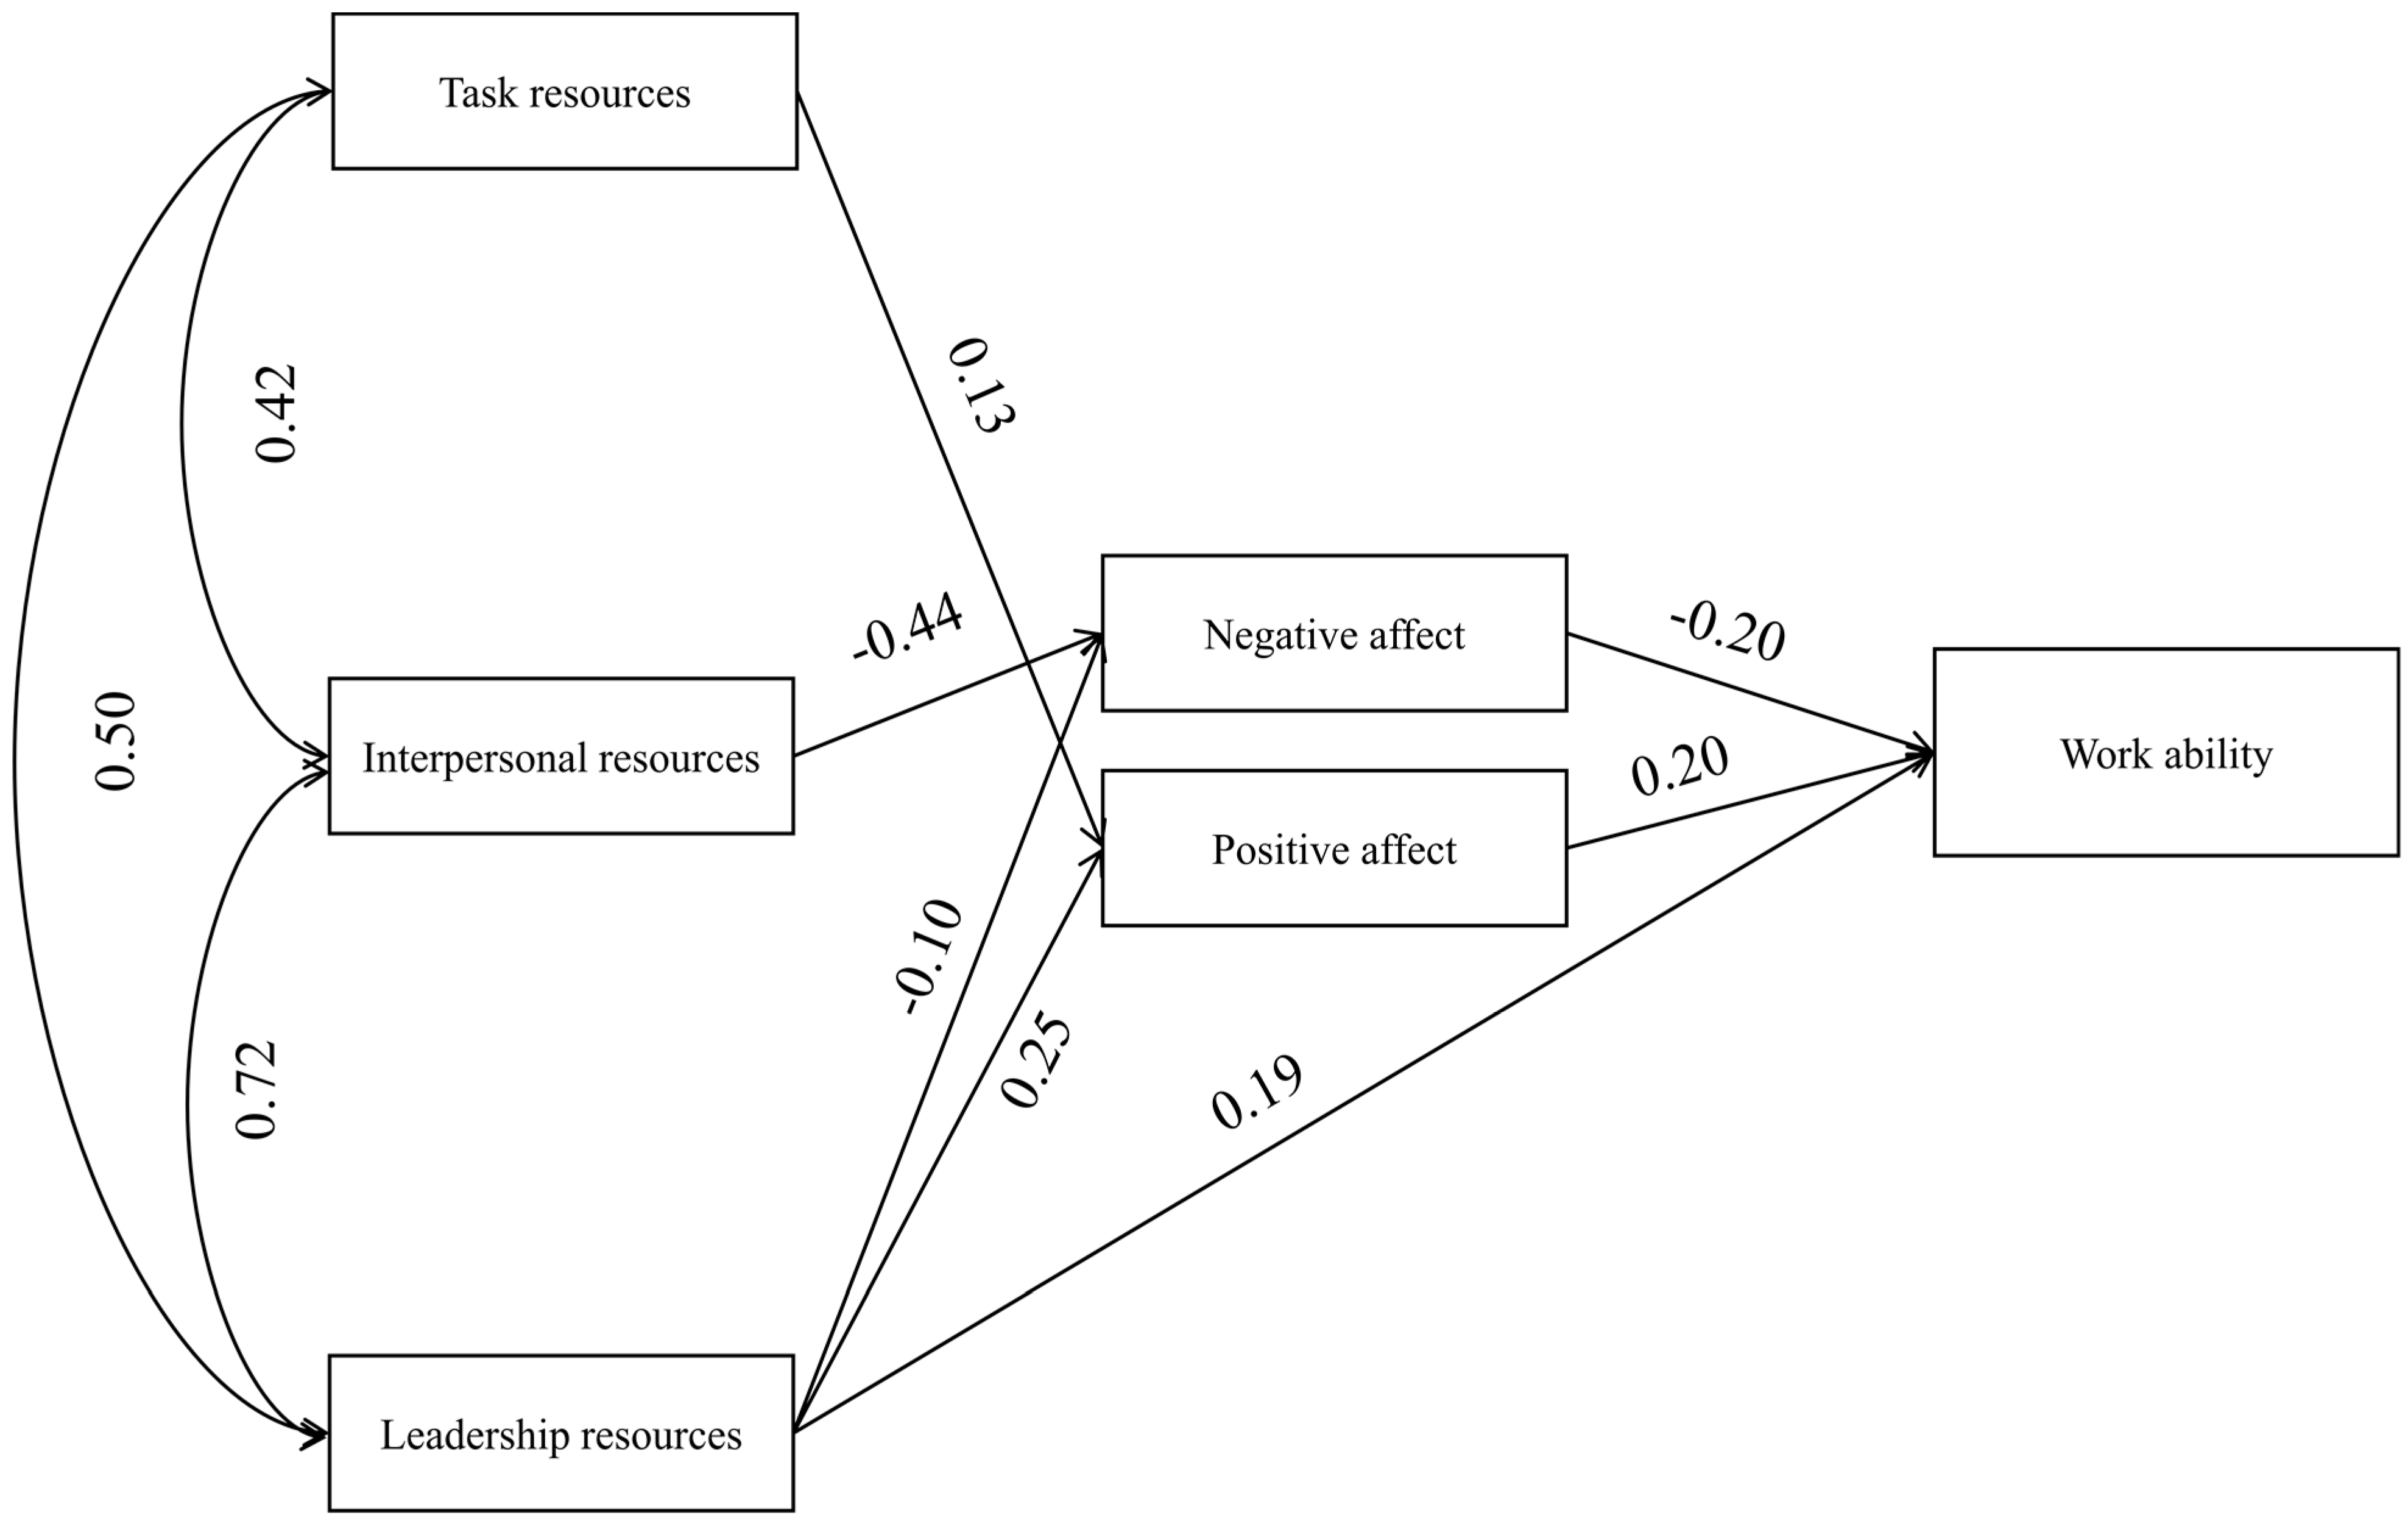
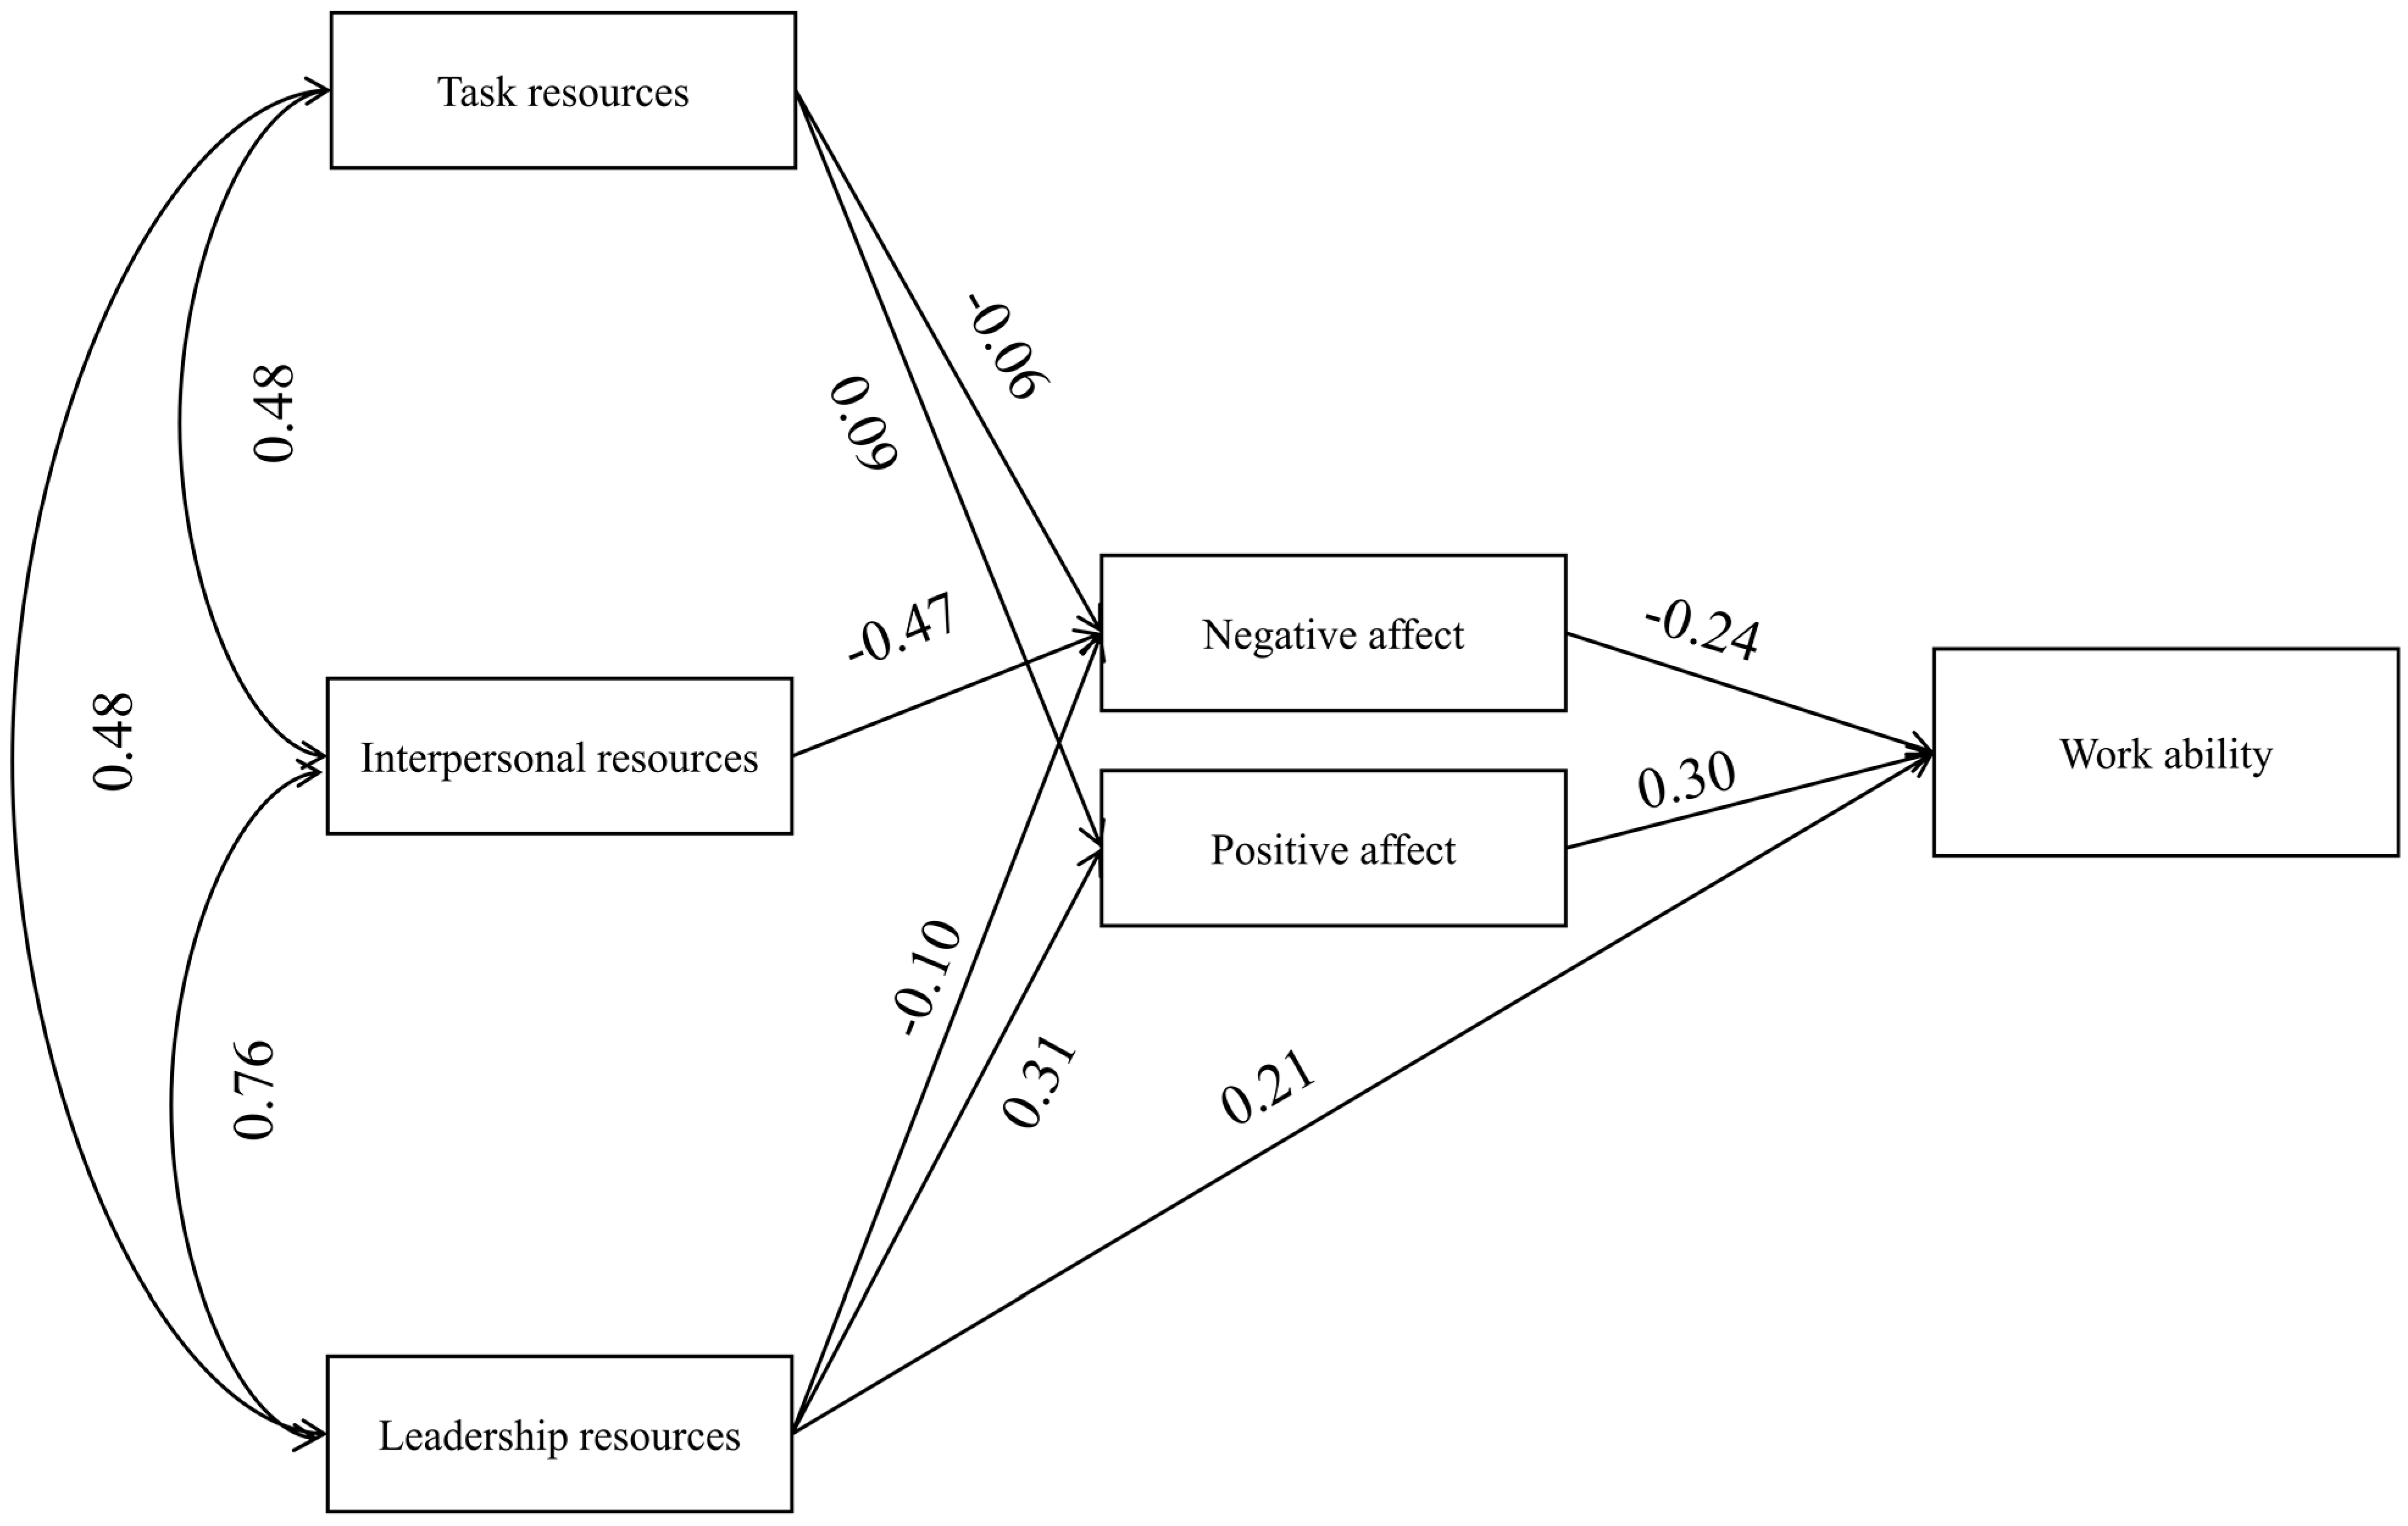
| Non-Shift | Shift | |||||||||
|---|---|---|---|---|---|---|---|---|---|---|
| Parameter | Estimate | 95% LLCI | 95% ULCI | p | Estimate | 95% LLCI | 95% ULCI | p | ||
| (PA) Positive affect | ← | (TR) Task resources | 0.134 | 0.036 | 0.222 | 0.003 | 0.087 | 0.006 | 0.163 | 0.033 |
| (NA) Negative affect | ← | (TR) Task resources | 0.007 1 | −0.067 1 | 0.081 1 | 0.844 1 | −0.064 | −0.134 | 0.004 | 0.065 |
| (NA) Negative affect | ← | (IR) Interpersonal resources | −0.441 | −0.529 | −0.347 | <0.001 | −0.472 | −0.562 | −0.383 | <0.001 |
| (PA) Positive affect | ← | (LR) Leadership resources | 0.247 | 0.166 | 0.337 | <0.001 | 0.307 | 0.226 | 0.384 | <0.001 |
| (NA) Negative affect | ← | (LR) Leadership resources | −0.101 | −0.193 | −0.008 | 0.032 | −0.097 | −0.185 | −0.007 | 0.035 |
| (WA) Work Ability Index | ← | (PA) Positive affect | 0.200 | 0.128 | 0.267 | <0.001 | 0.296 | 0.229 | 0.361 | <0.001 |
| (WA) Work Ability Index | ← | (NA) Negative affect | −0.204 | −0.283 | −0.122 | <0.001 | −0.243 | −0.323 | −0.168 | <0.001 |
| (WA) Work Ability Index | ← | (LR) Leadership resources | 0.186 | 0.106 | 0.264 | <0.001 | 0.212 | 0.143 | 0.279 | <0.001 |
Publisher’s Note: MDPI stays neutral with regard to jurisdictional claims in published maps and institutional affiliations. |
© 2021 by the authors. Licensee MDPI, Basel, Switzerland. This article is an open access article distributed under the terms and conditions of the Creative Commons Attribution (CC BY) license (https://creativecommons.org/licenses/by/4.0/).
Share and Cite
Baka, Ł.; Ścigała, D.; Kapica, Ł.; Najmiec, A.; Grala, K. How Is Work Ability Shaped in Groups of Shift and Non-Shift Workers? A Comprehensive Approach to Job Resources and Mediation Role of Emotions at Work. Int. J. Environ. Res. Public Health 2021, 18, 7730. https://0-doi-org.brum.beds.ac.uk/10.3390/ijerph18157730
Baka Ł, Ścigała D, Kapica Ł, Najmiec A, Grala K. How Is Work Ability Shaped in Groups of Shift and Non-Shift Workers? A Comprehensive Approach to Job Resources and Mediation Role of Emotions at Work. International Journal of Environmental Research and Public Health. 2021; 18(15):7730. https://0-doi-org.brum.beds.ac.uk/10.3390/ijerph18157730
Chicago/Turabian StyleBaka, Łukasz, Dawid Ścigała, Łukasz Kapica, Andrzej Najmiec, and Krzysztof Grala. 2021. "How Is Work Ability Shaped in Groups of Shift and Non-Shift Workers? A Comprehensive Approach to Job Resources and Mediation Role of Emotions at Work" International Journal of Environmental Research and Public Health 18, no. 15: 7730. https://0-doi-org.brum.beds.ac.uk/10.3390/ijerph18157730