
The Effect of an Active Plant-Based System on Perceived Air Pollution


Abstract
:1. Introduction
2. Materials and Methods
2.1. General
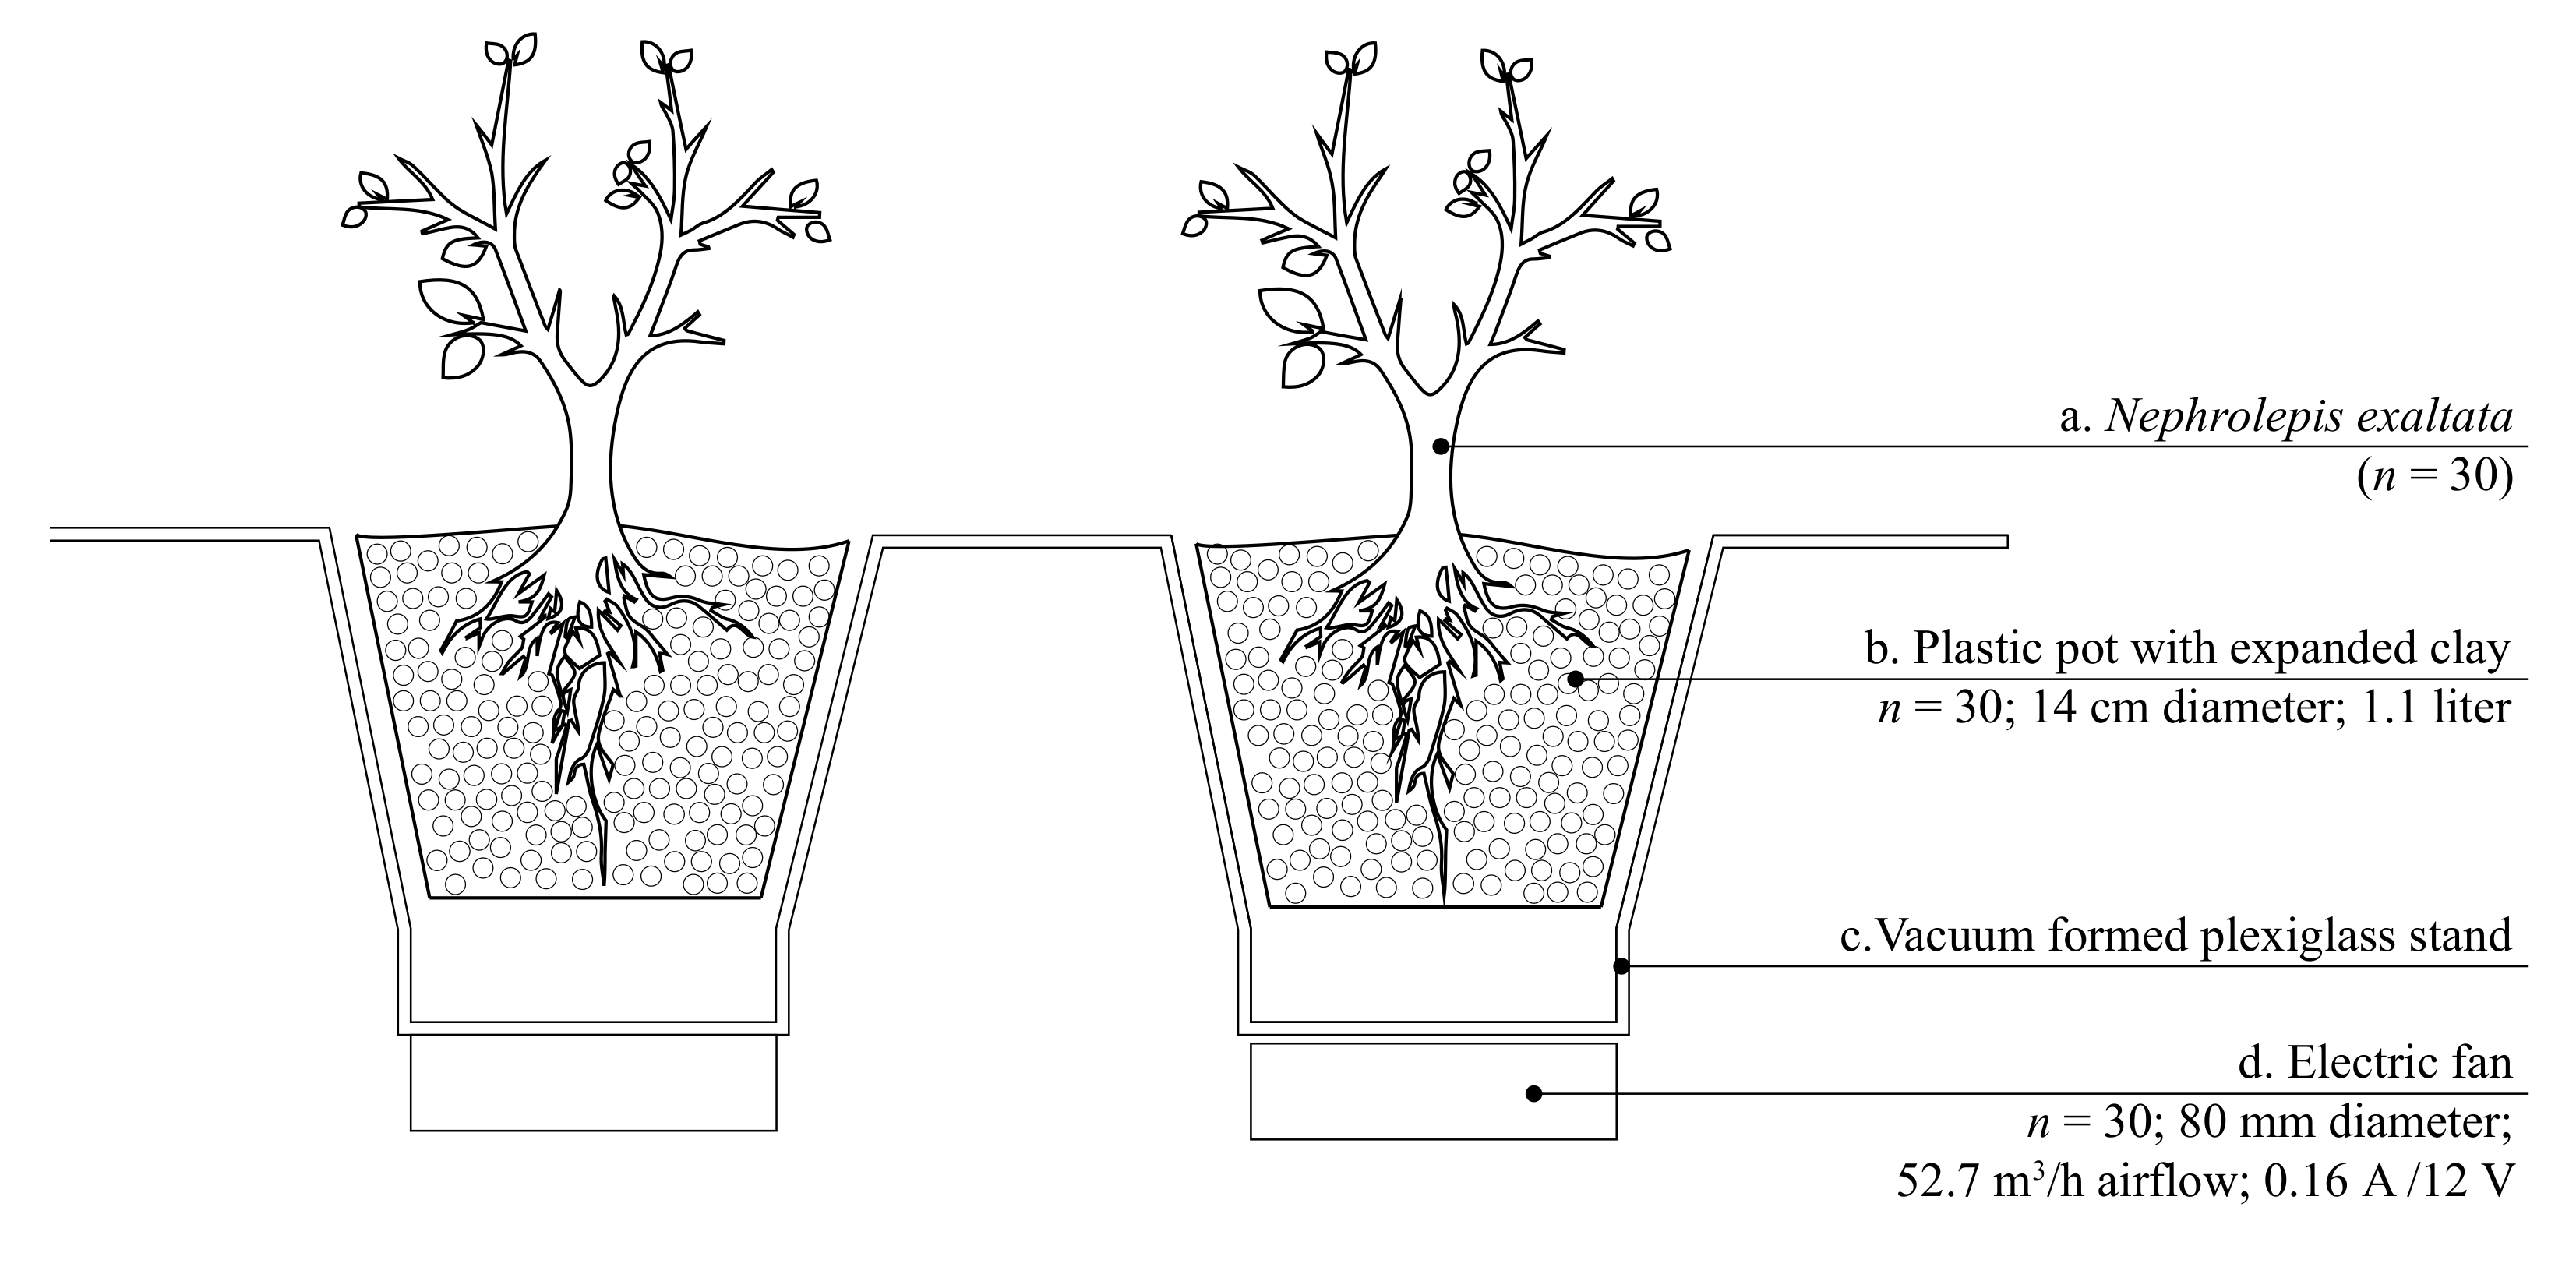
2.2. Active Plant-Based System
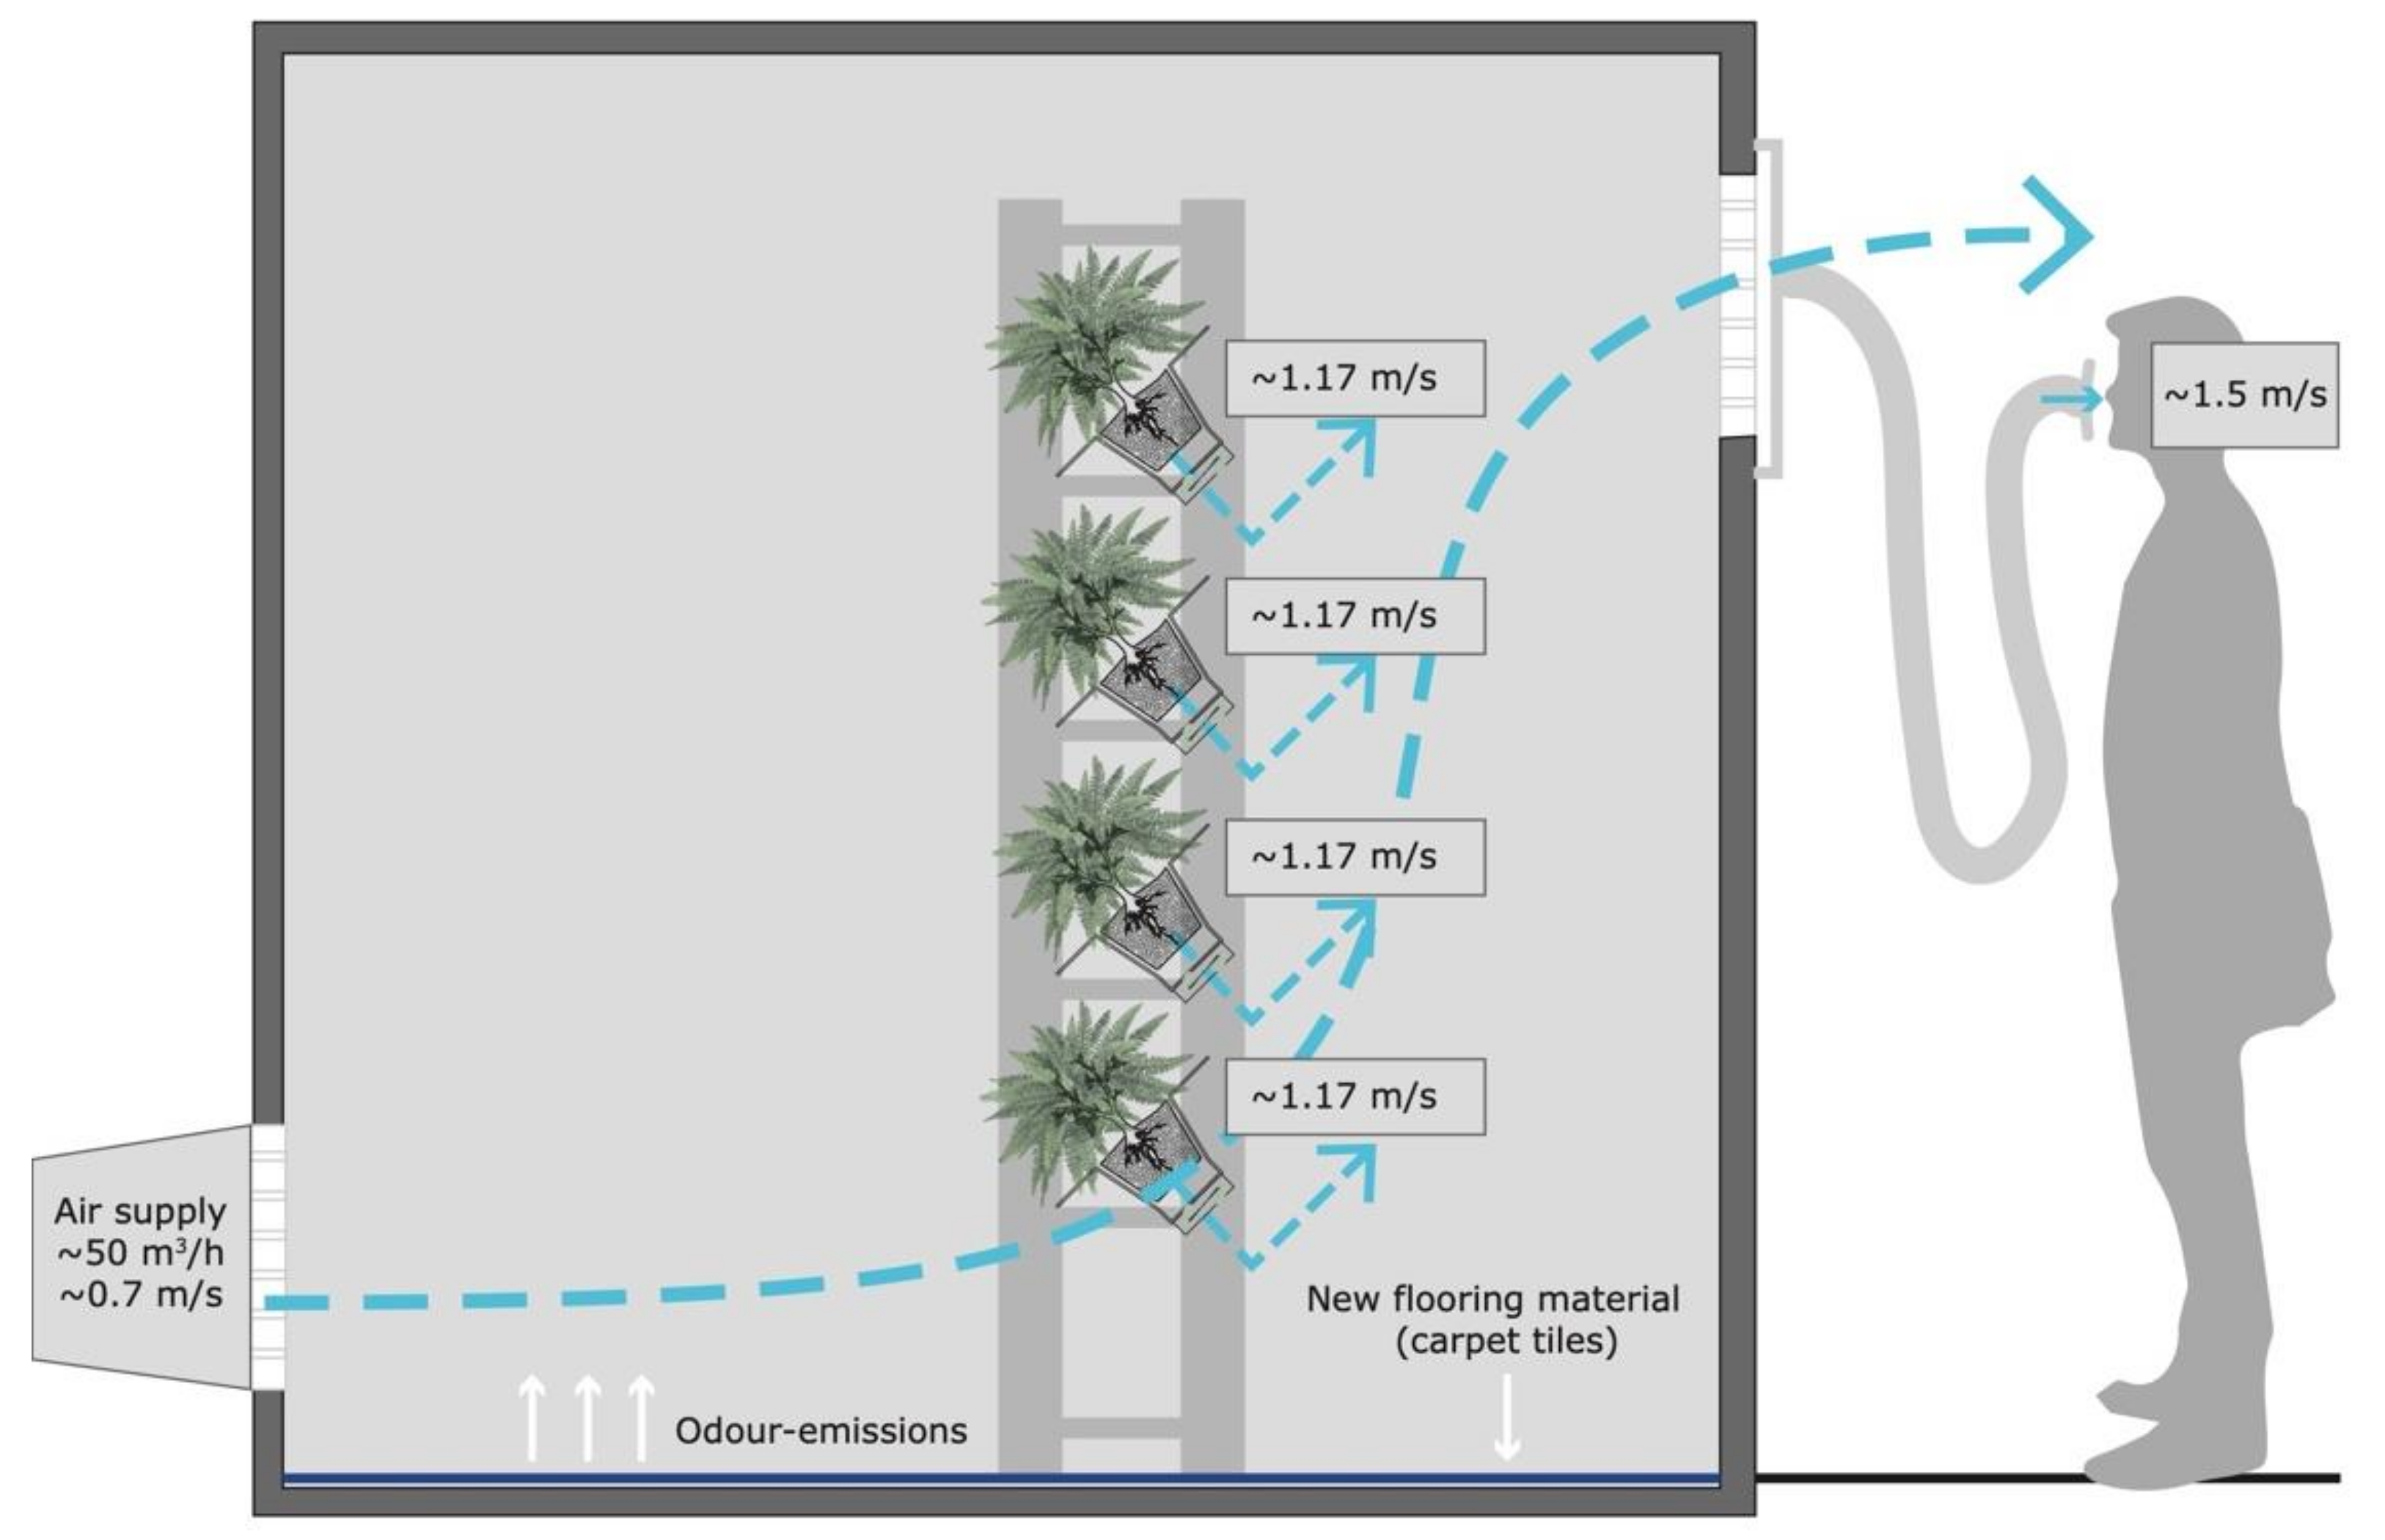
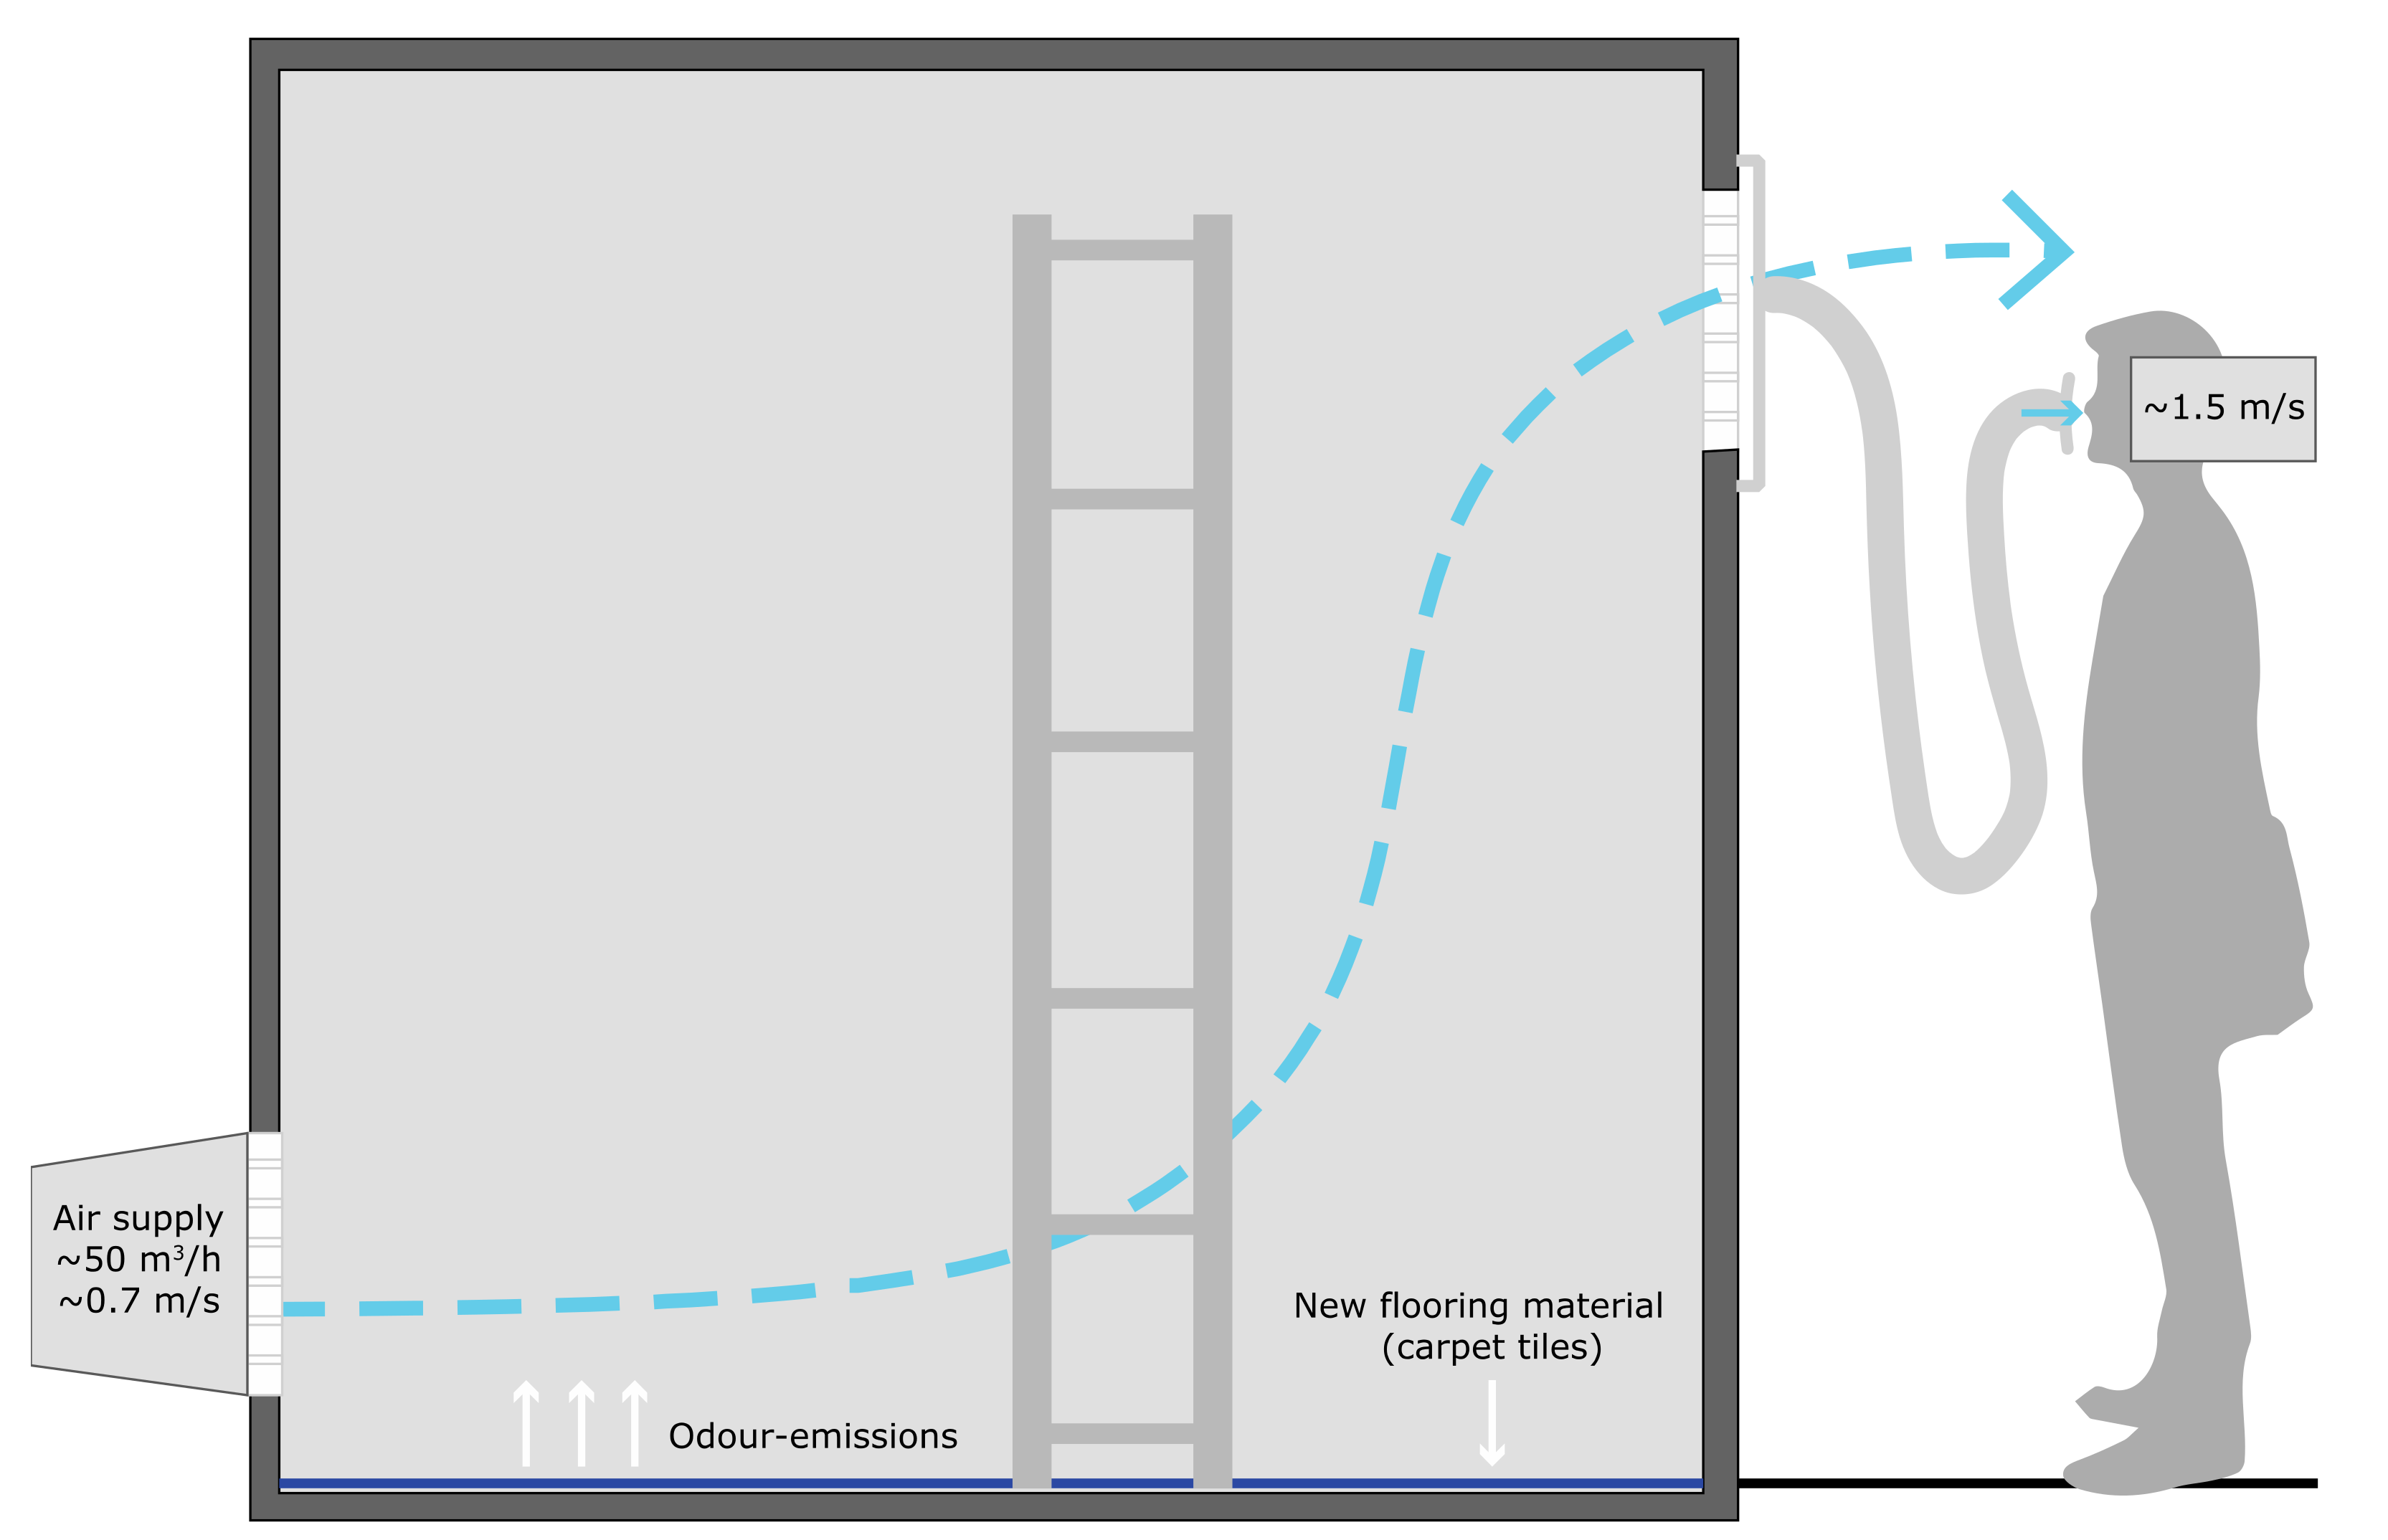
2.3. The SenseLab and the Test Chambers
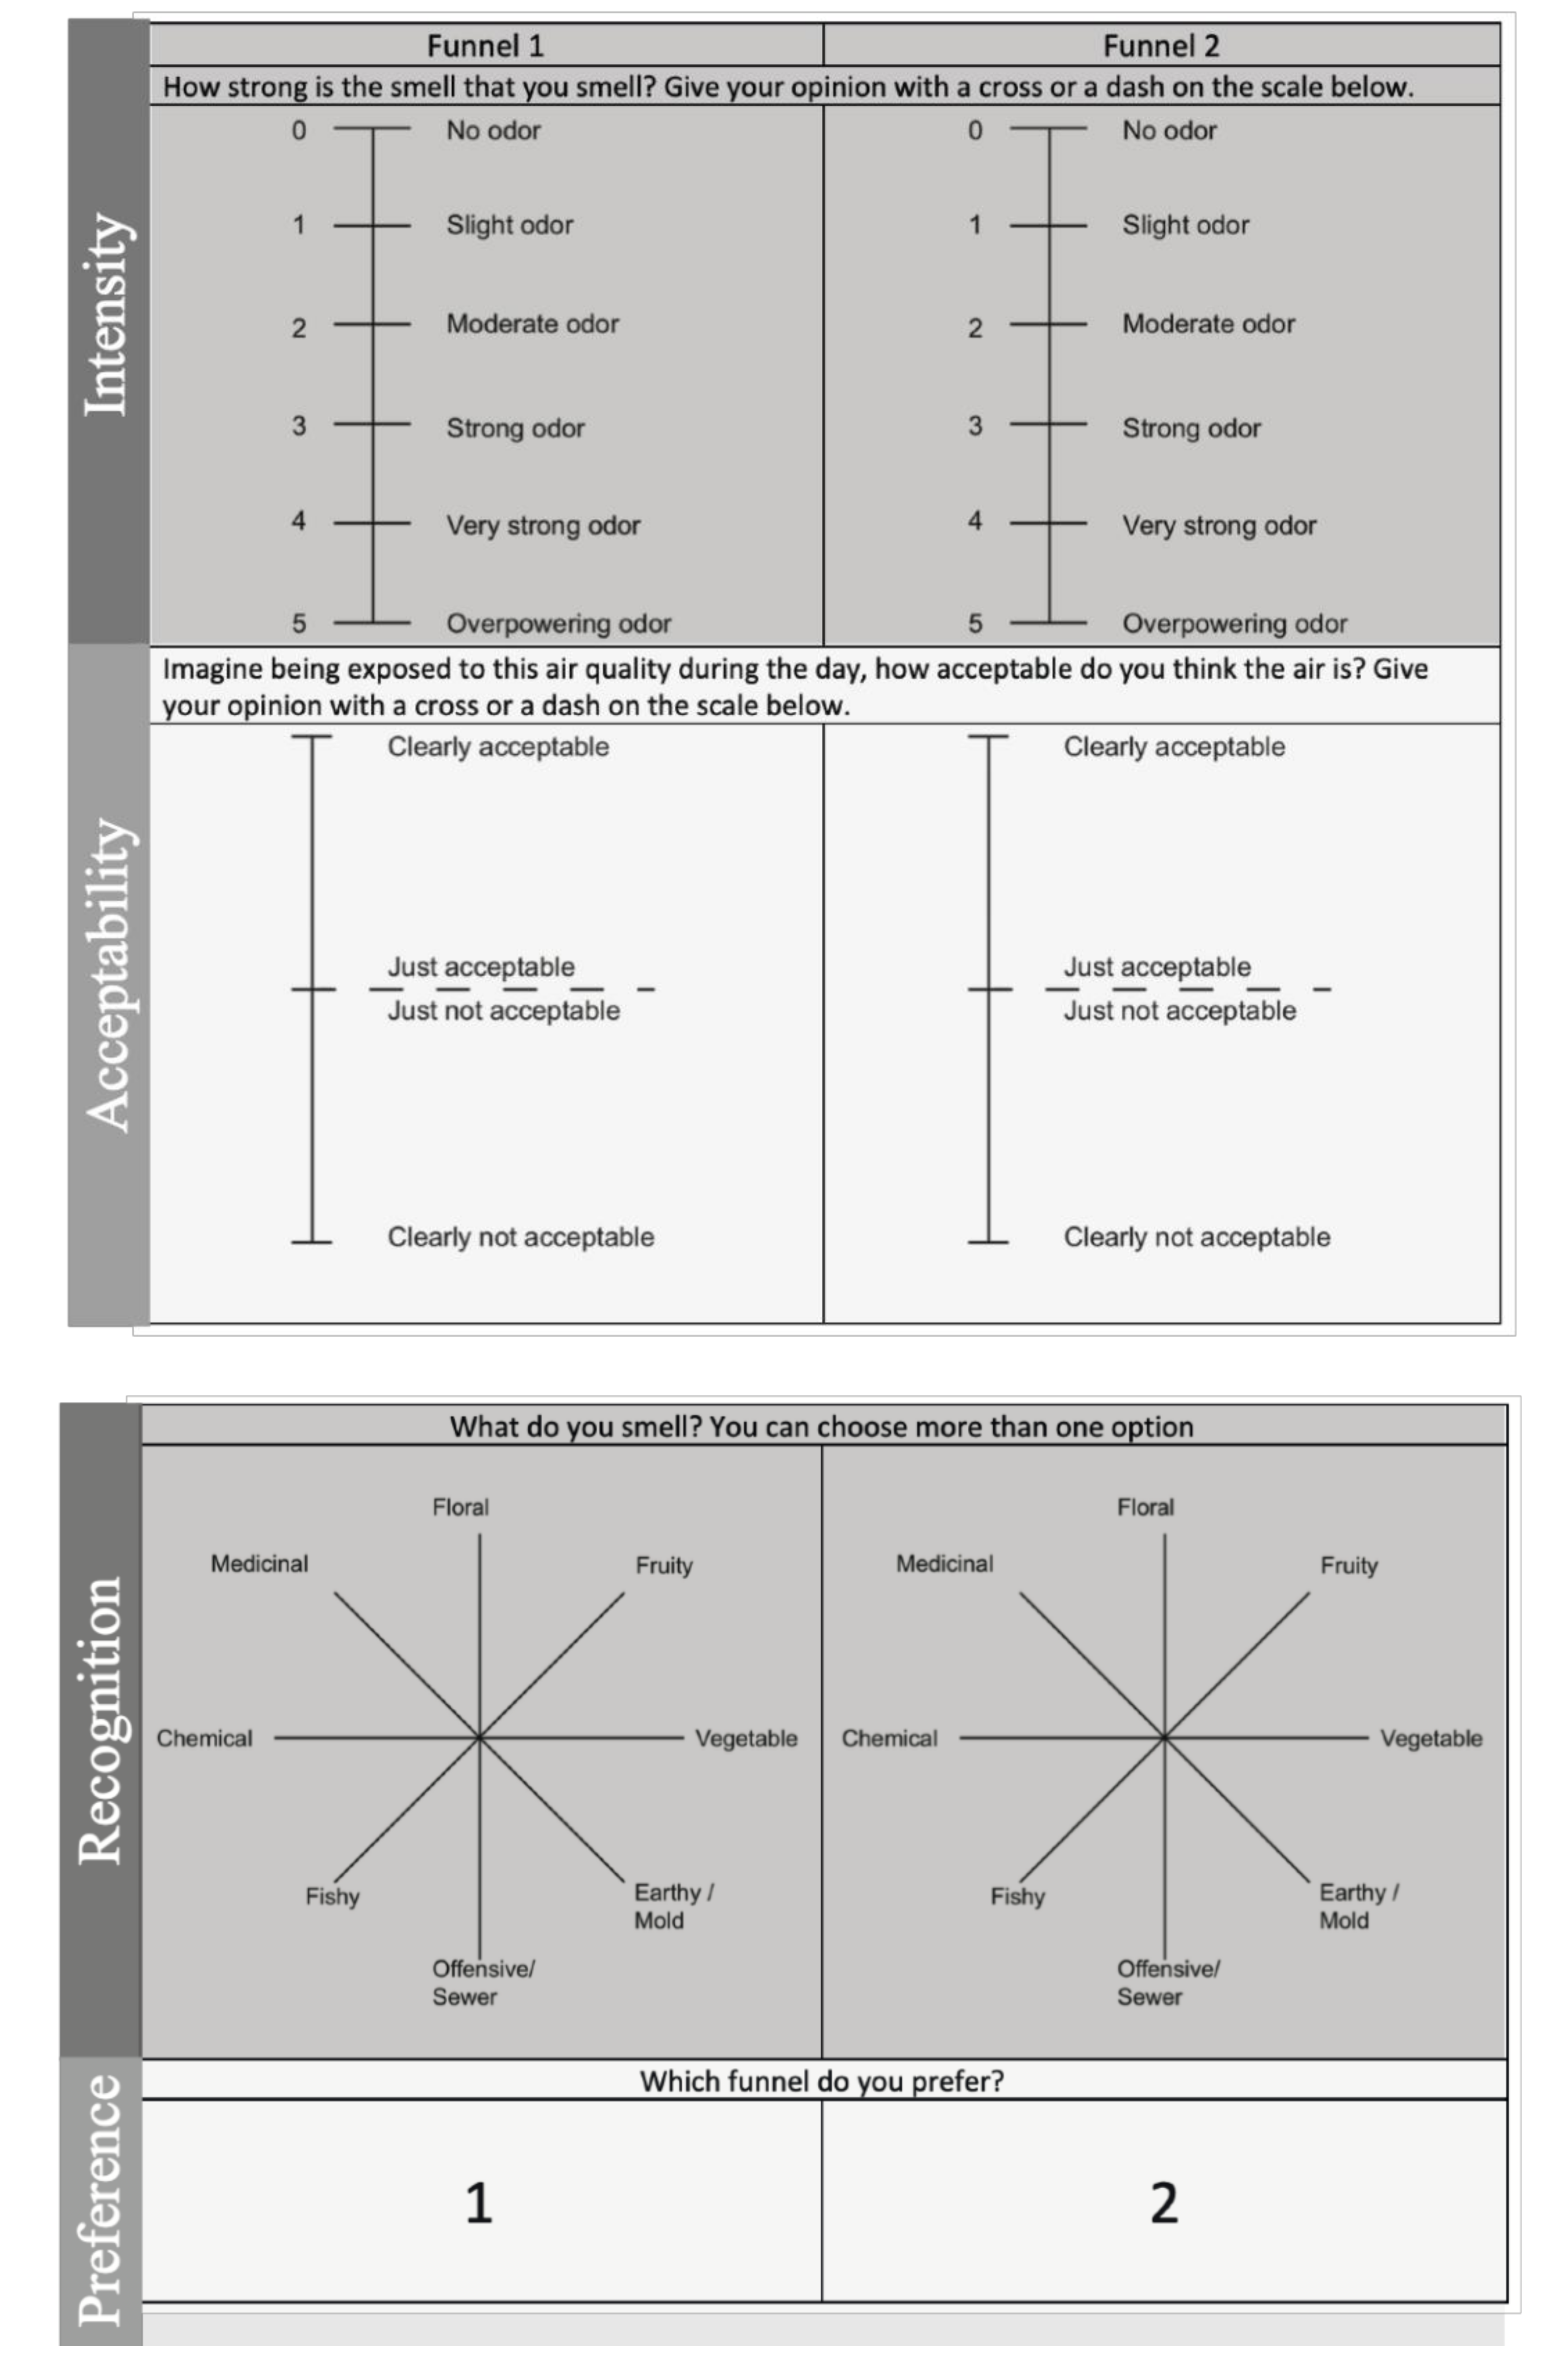
2.4. The Questionnaire
2.5. Pilot Test
2.6. Procedure
2.7. Ethical Aspects
2.8. Data Management and Analysis
3. Results
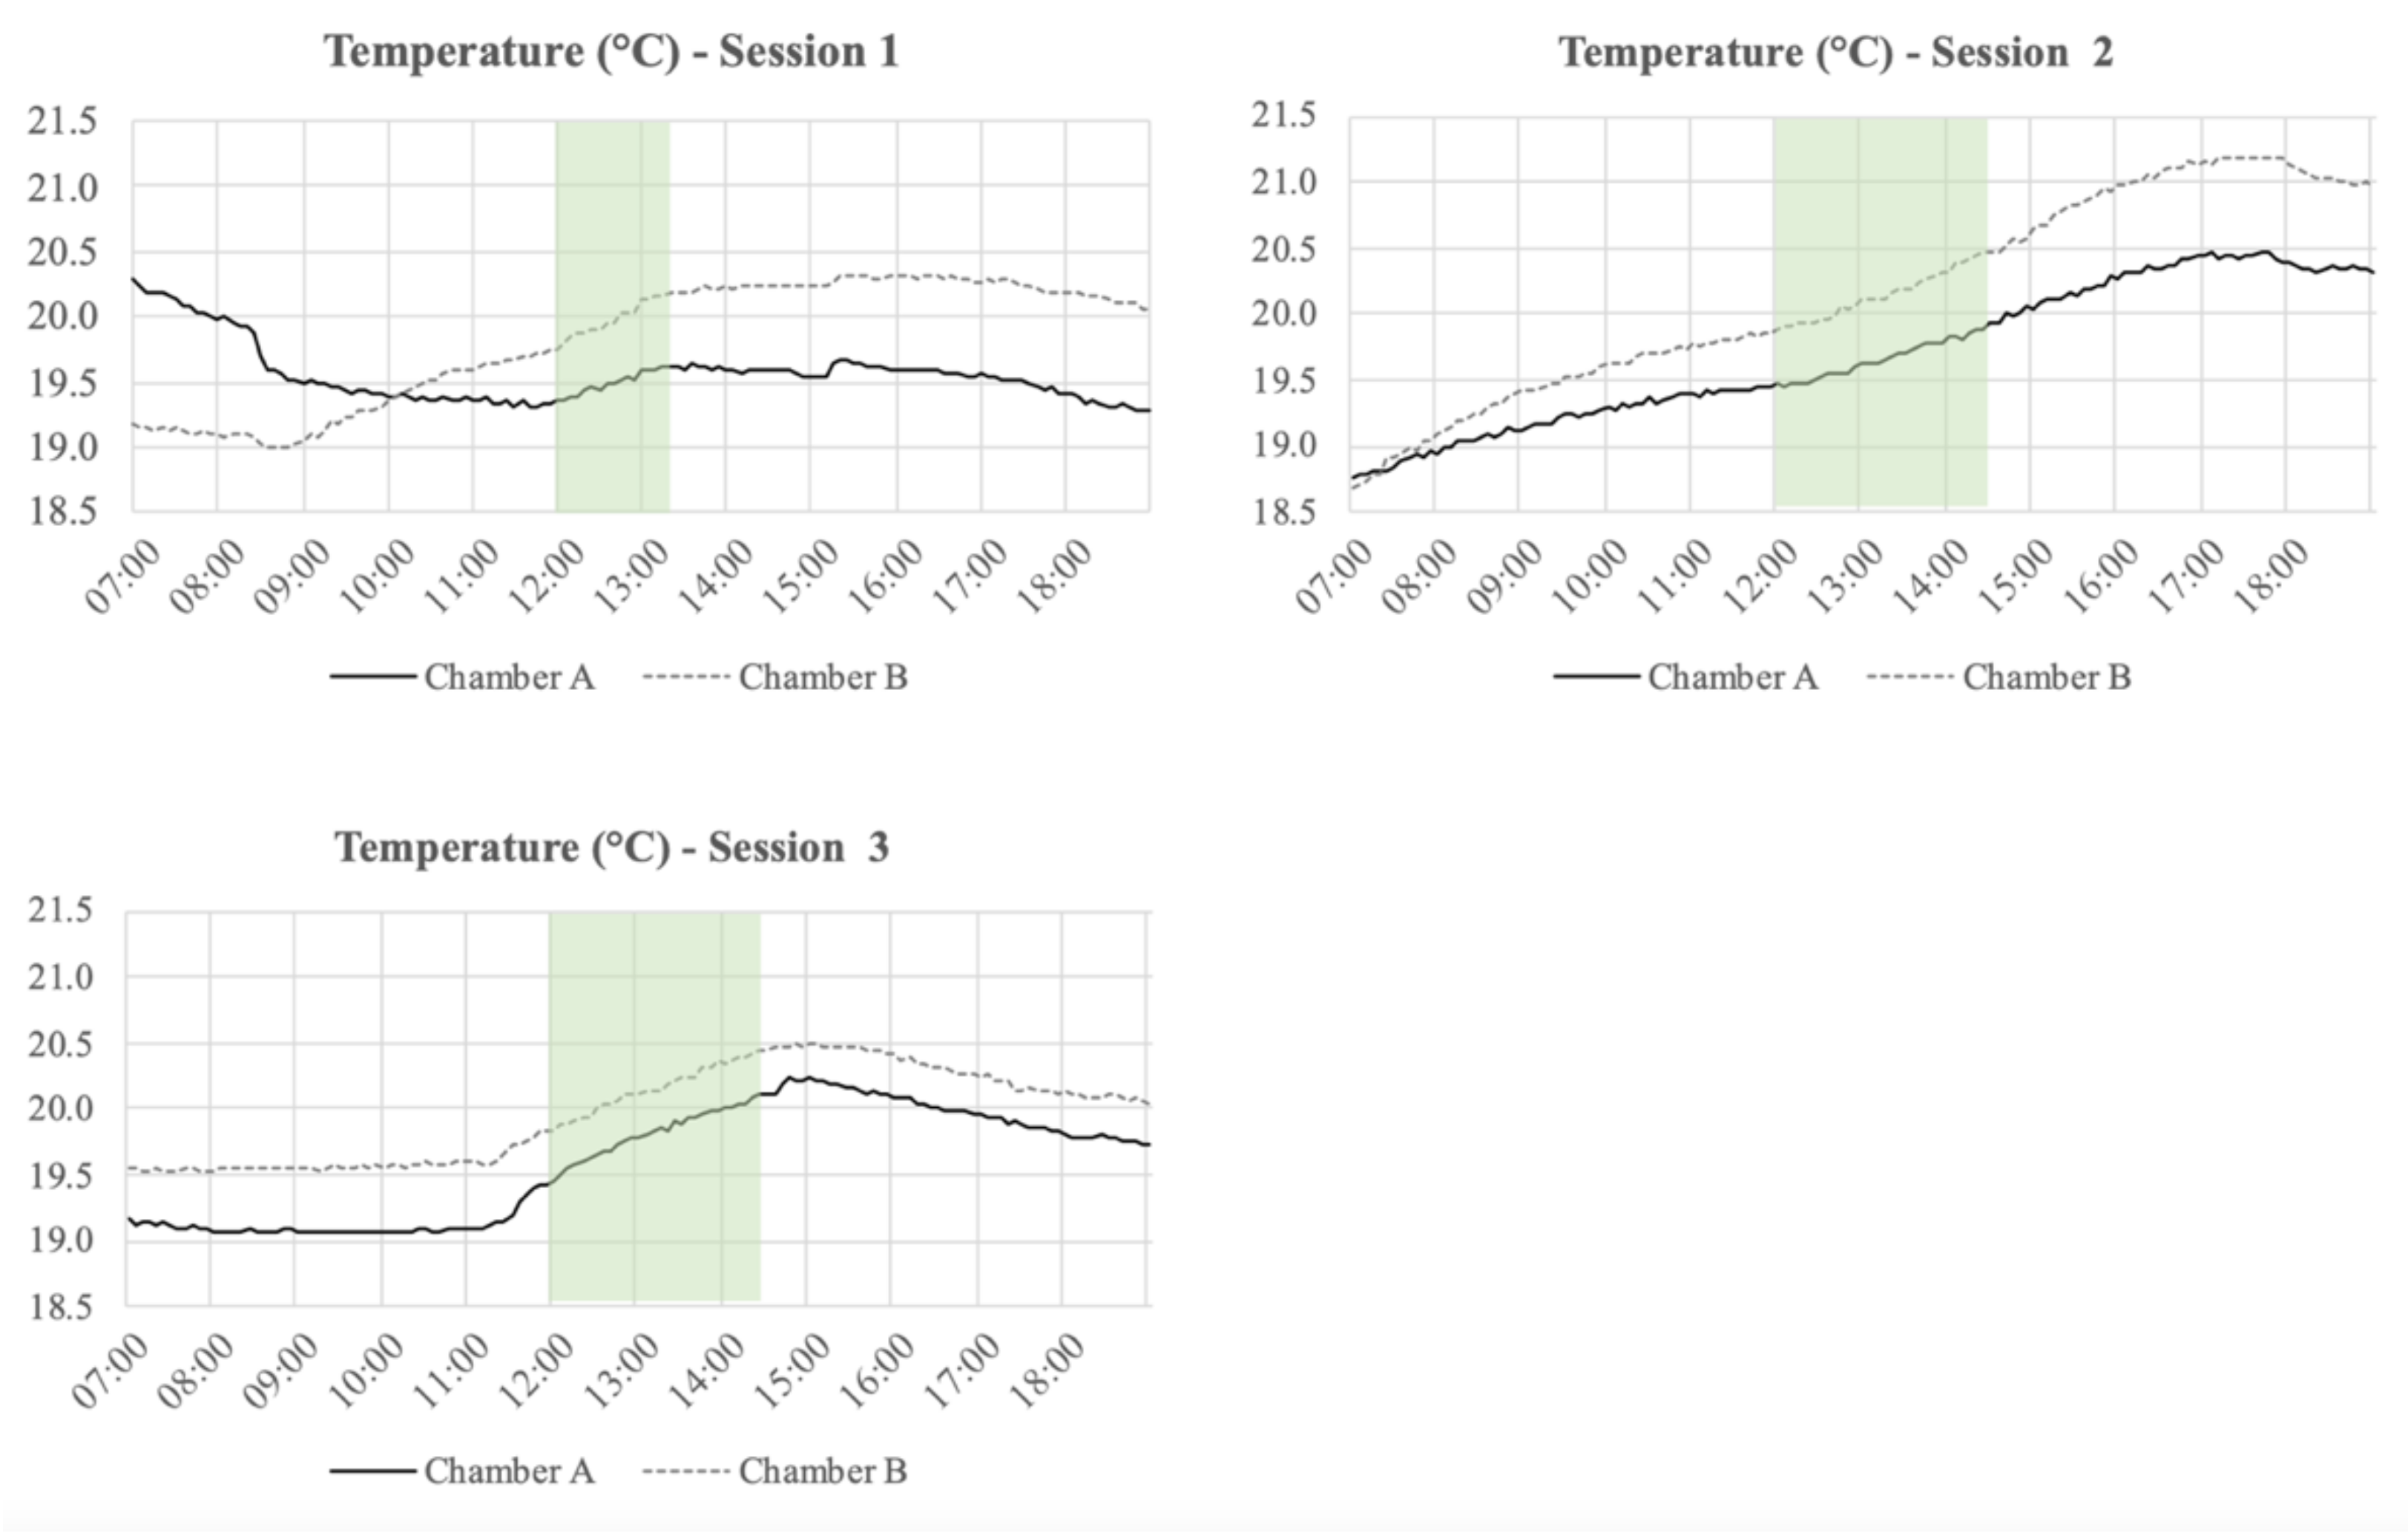
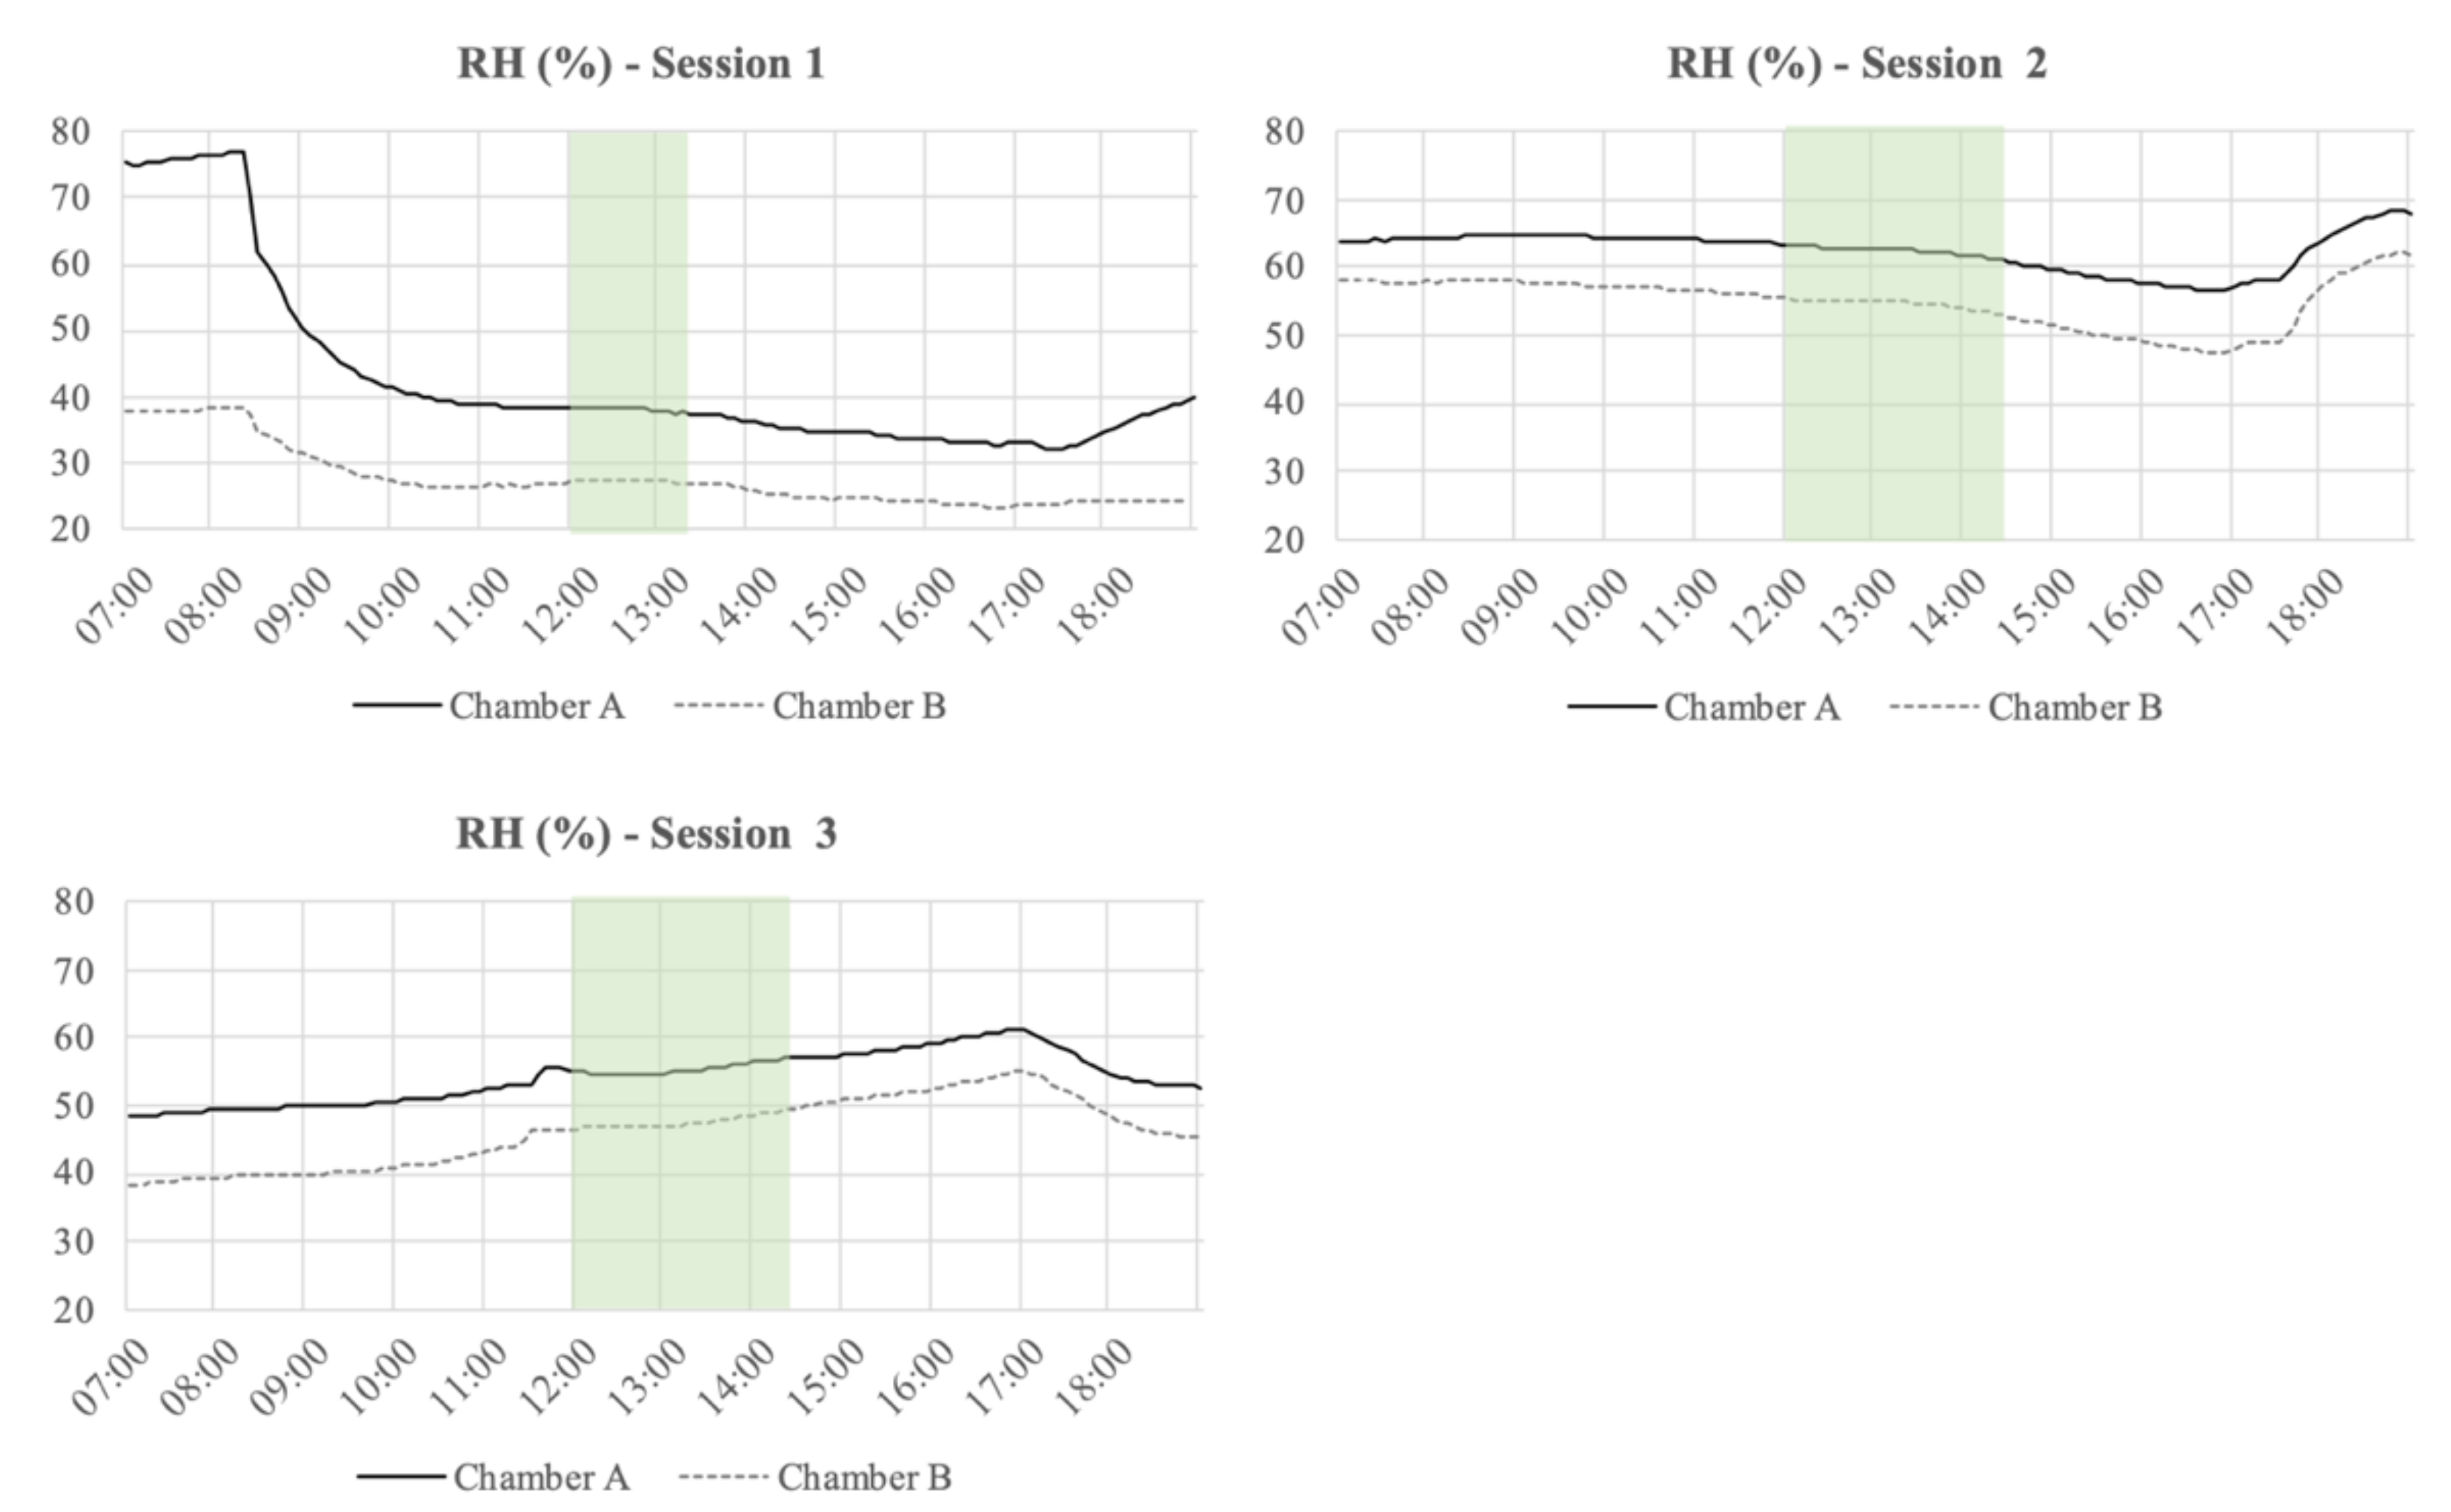
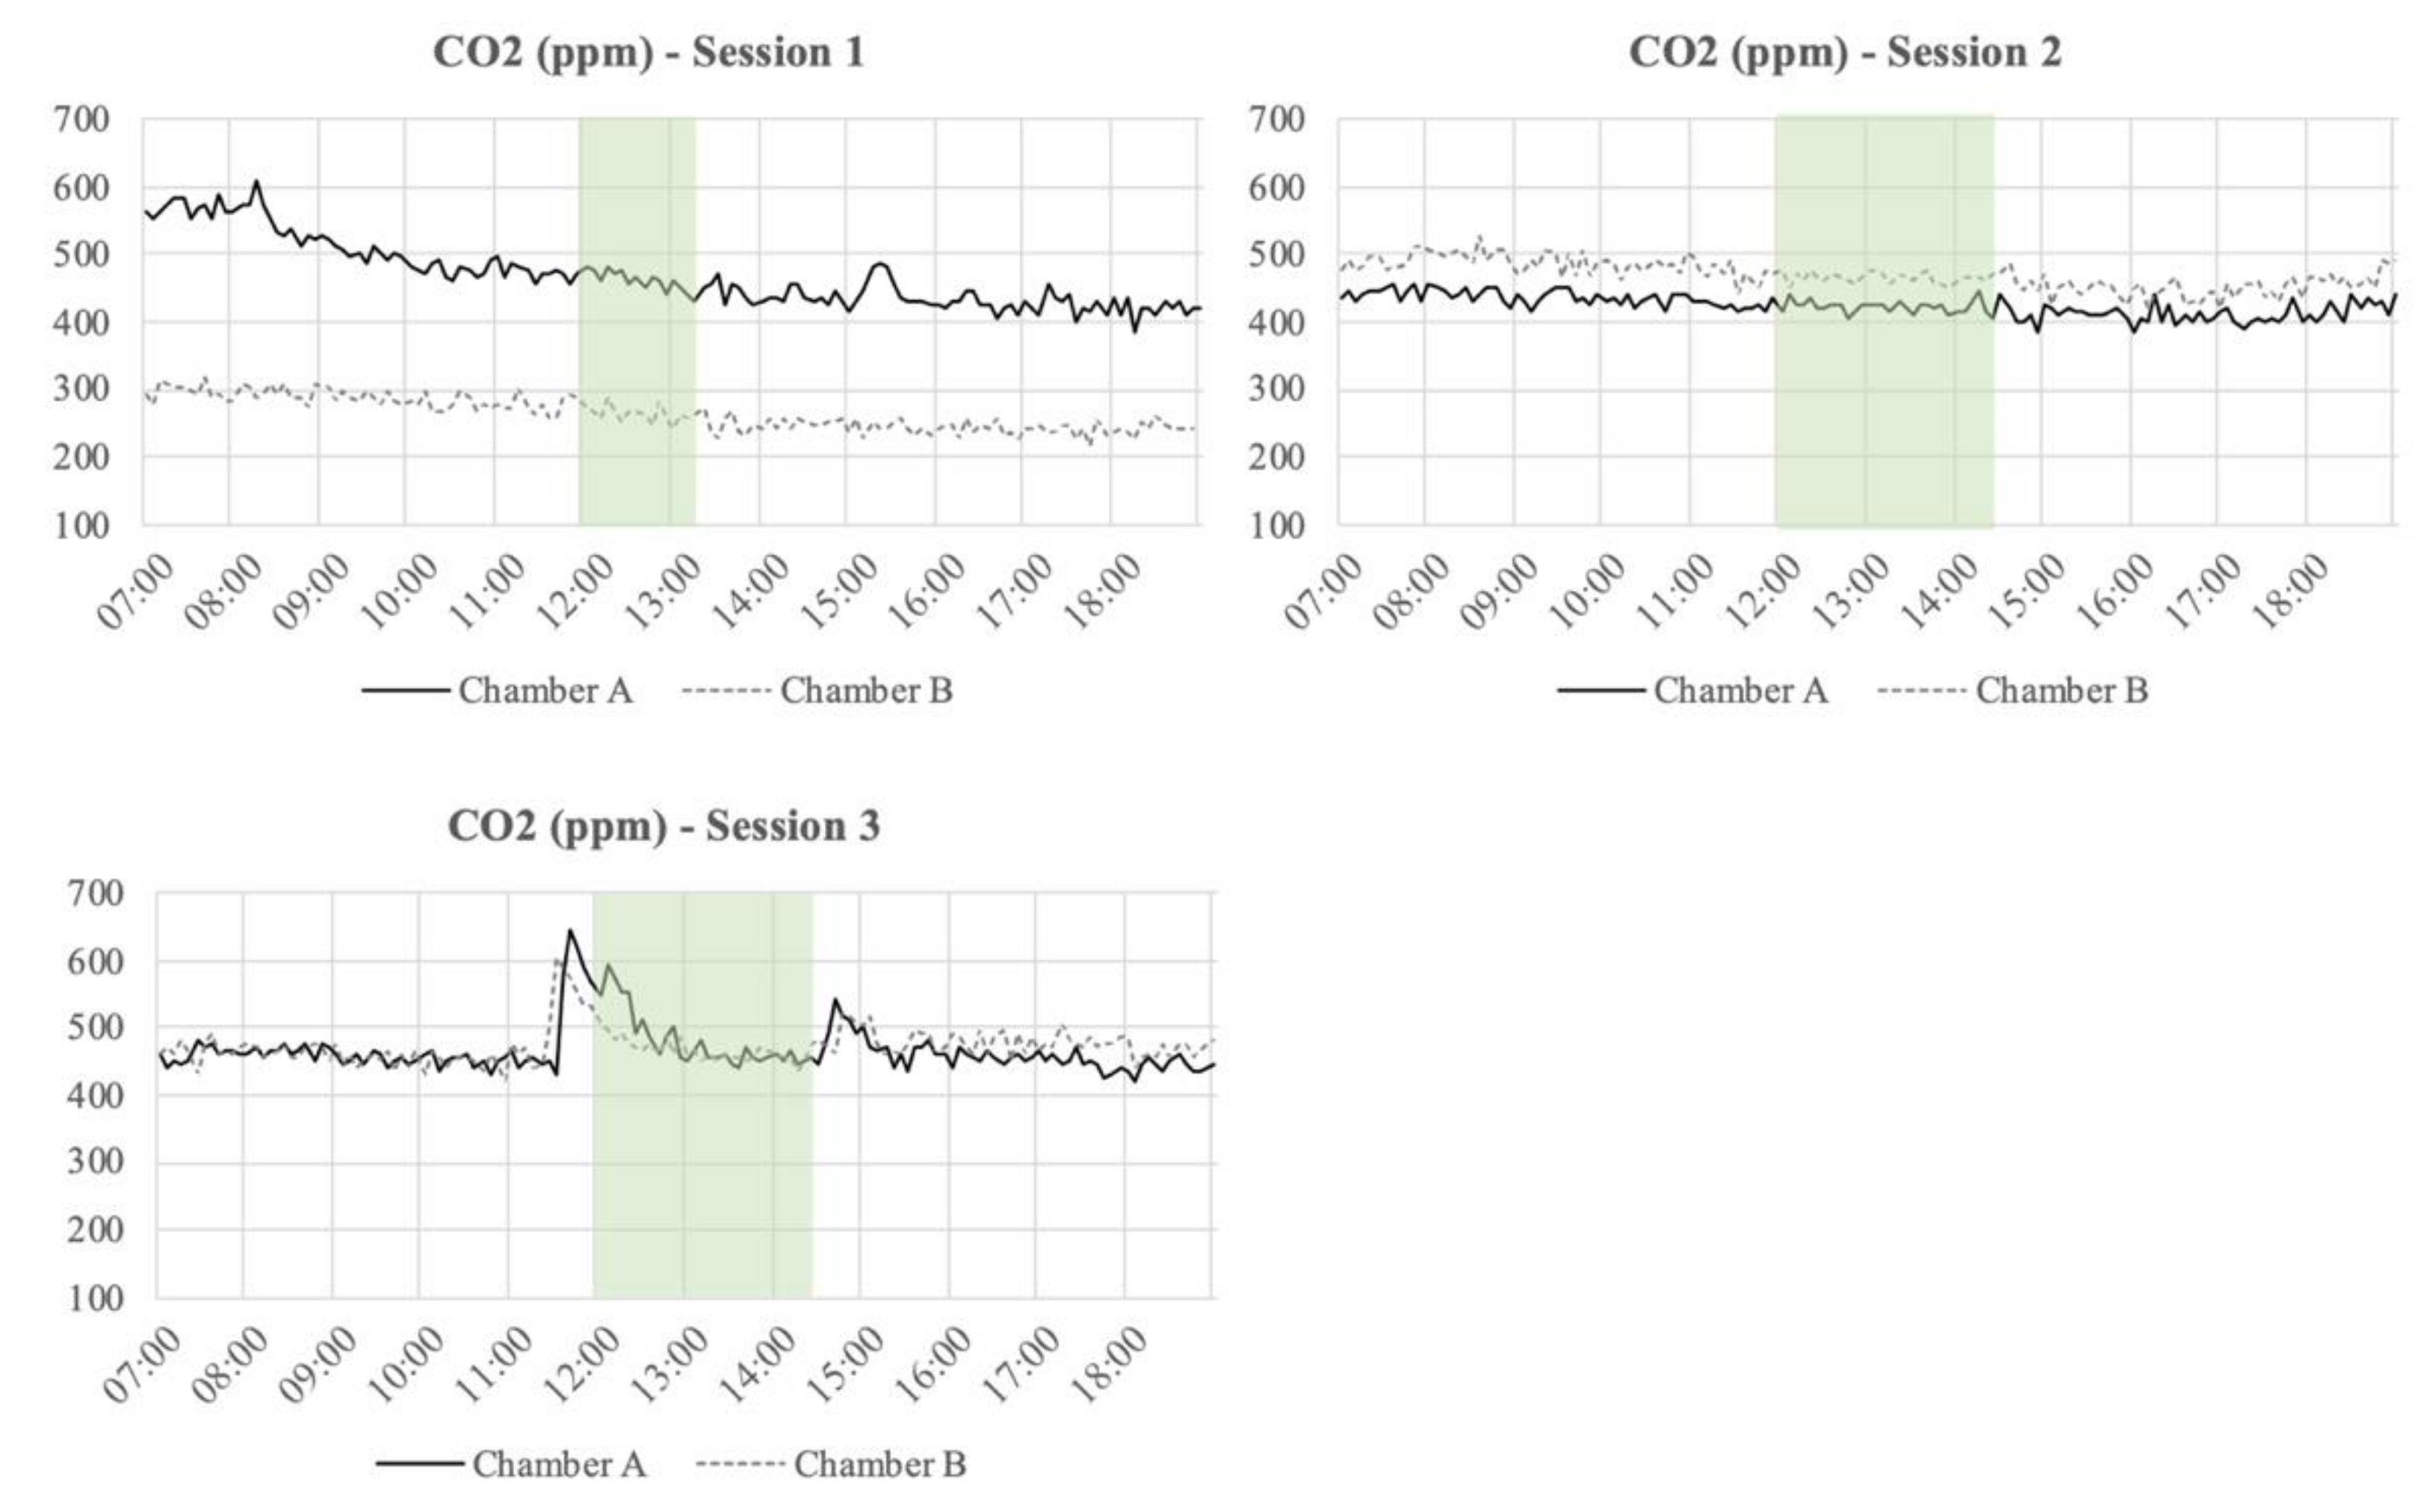
3.1. VOC, Temperature, Relative Humidity, and CO2 Monitoring
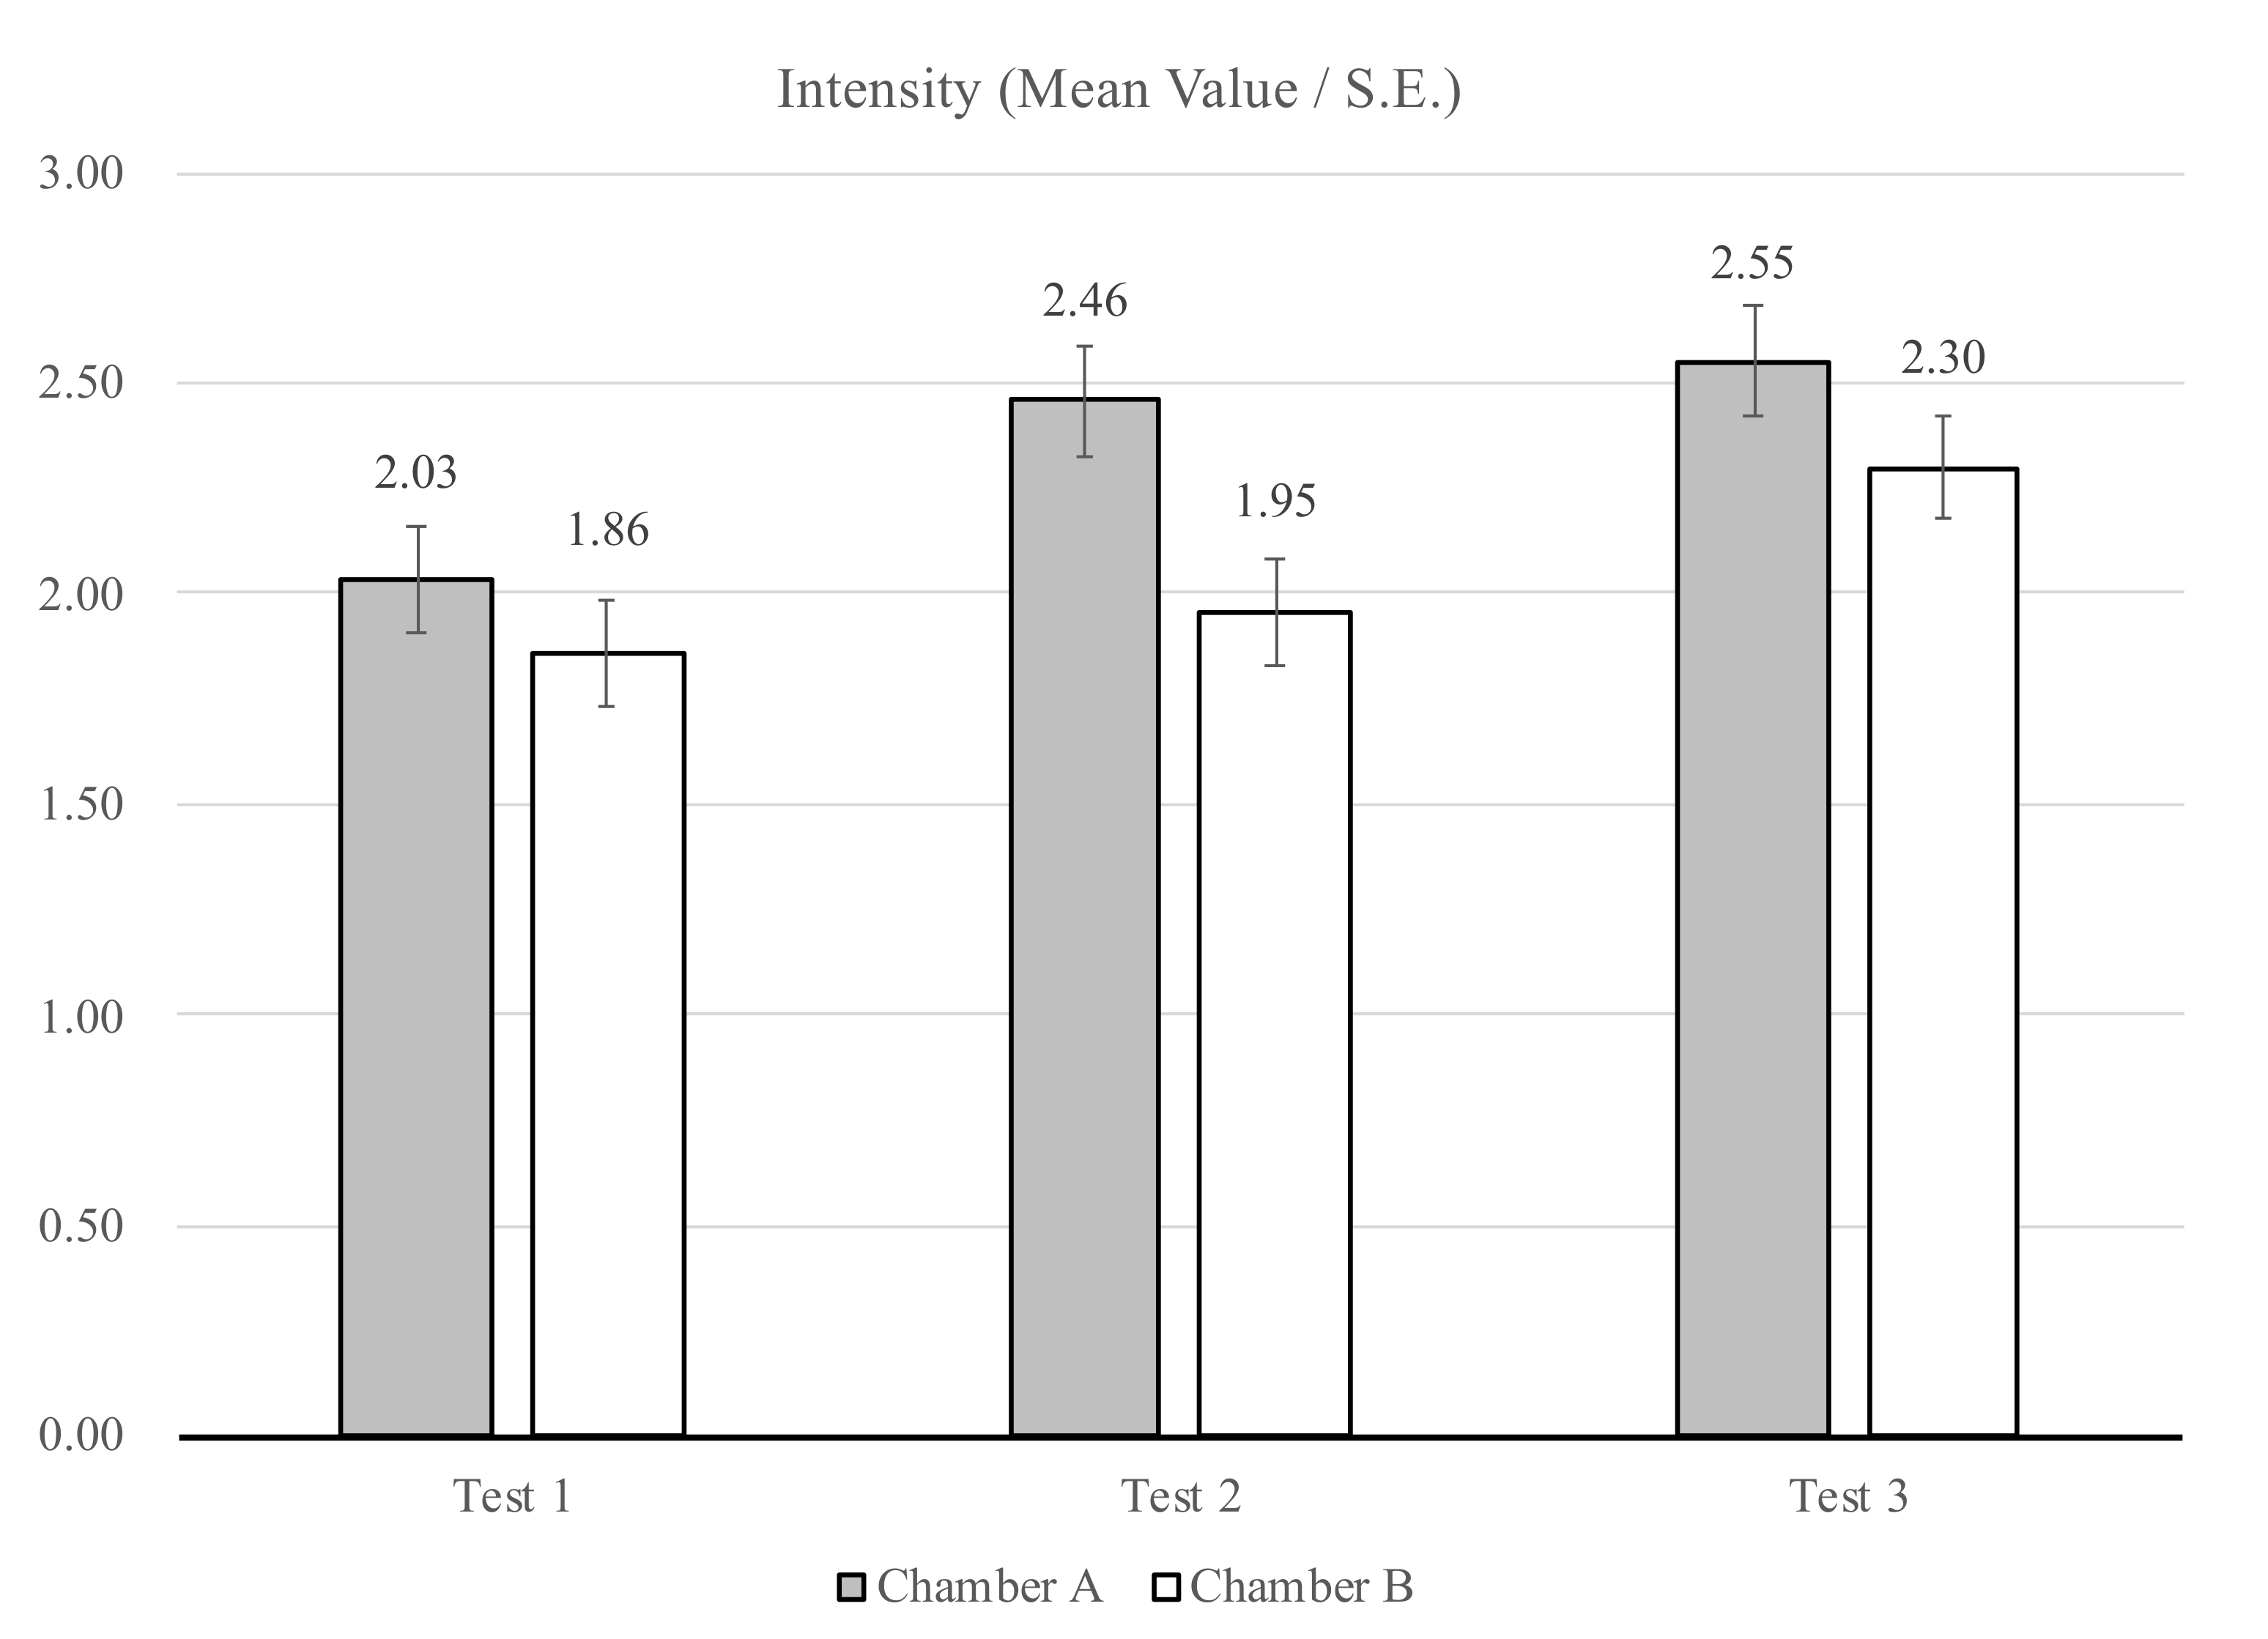
3.2. Intensity
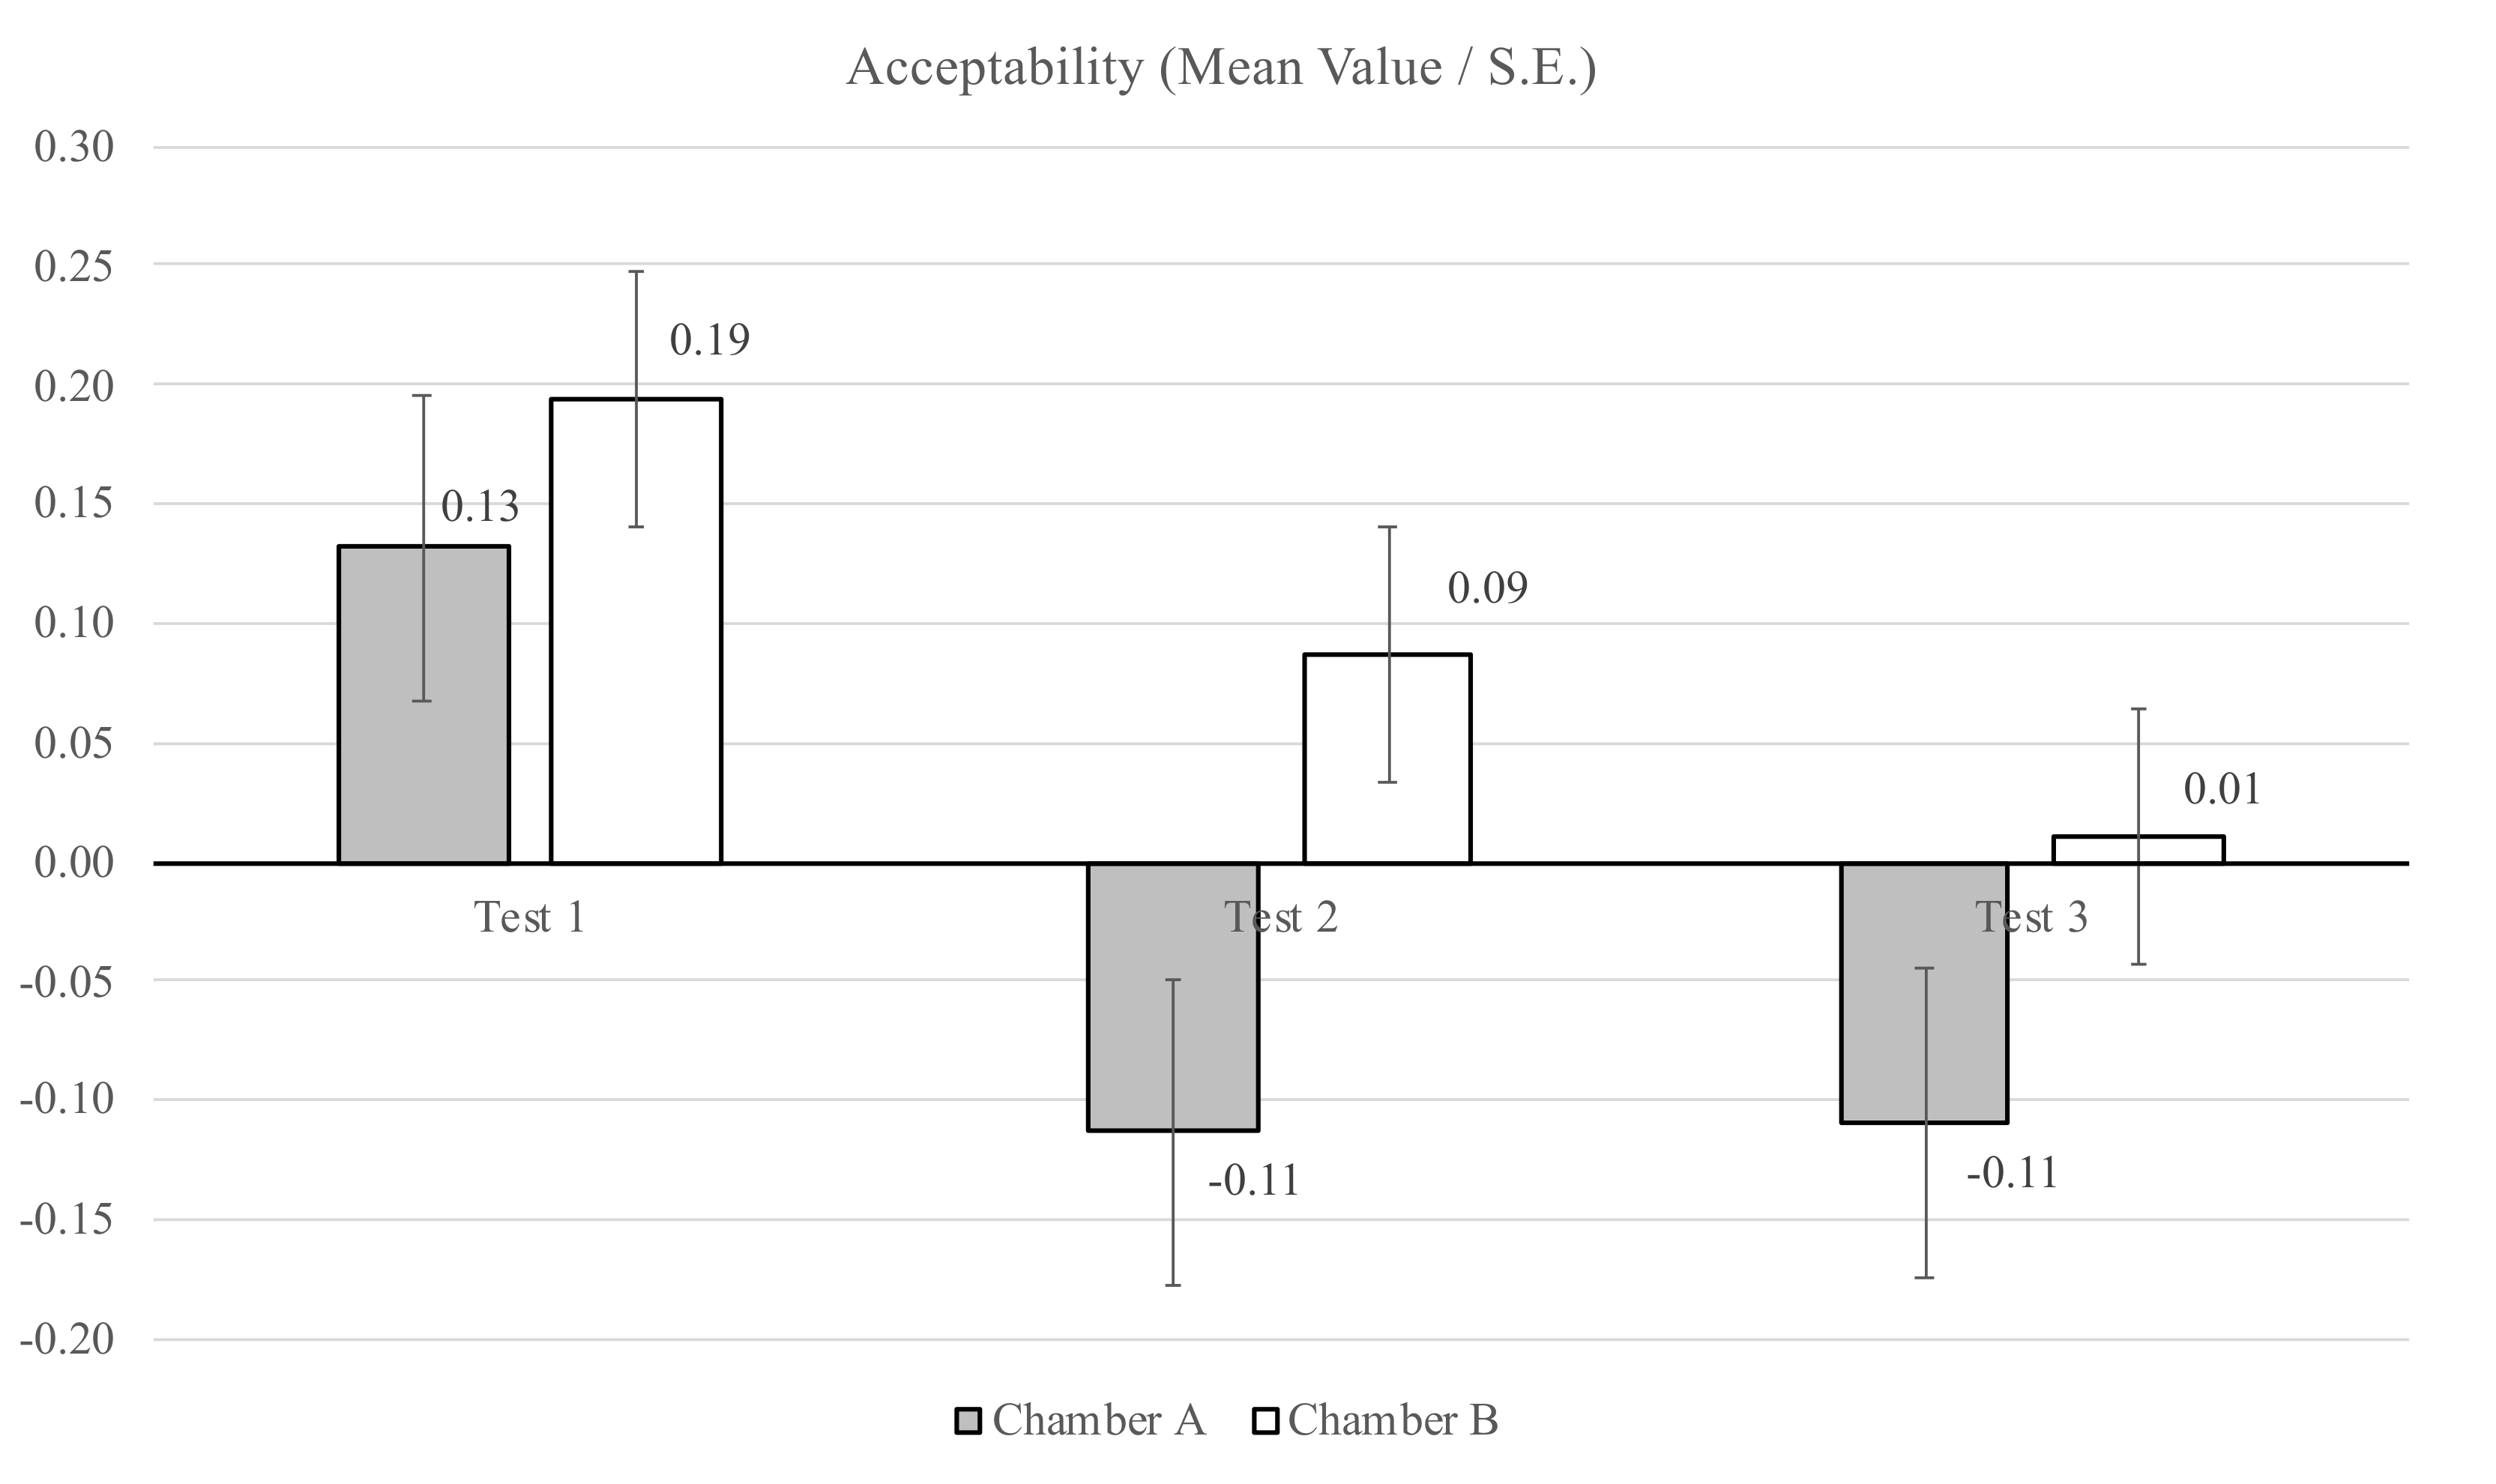
3.3. Acceptability
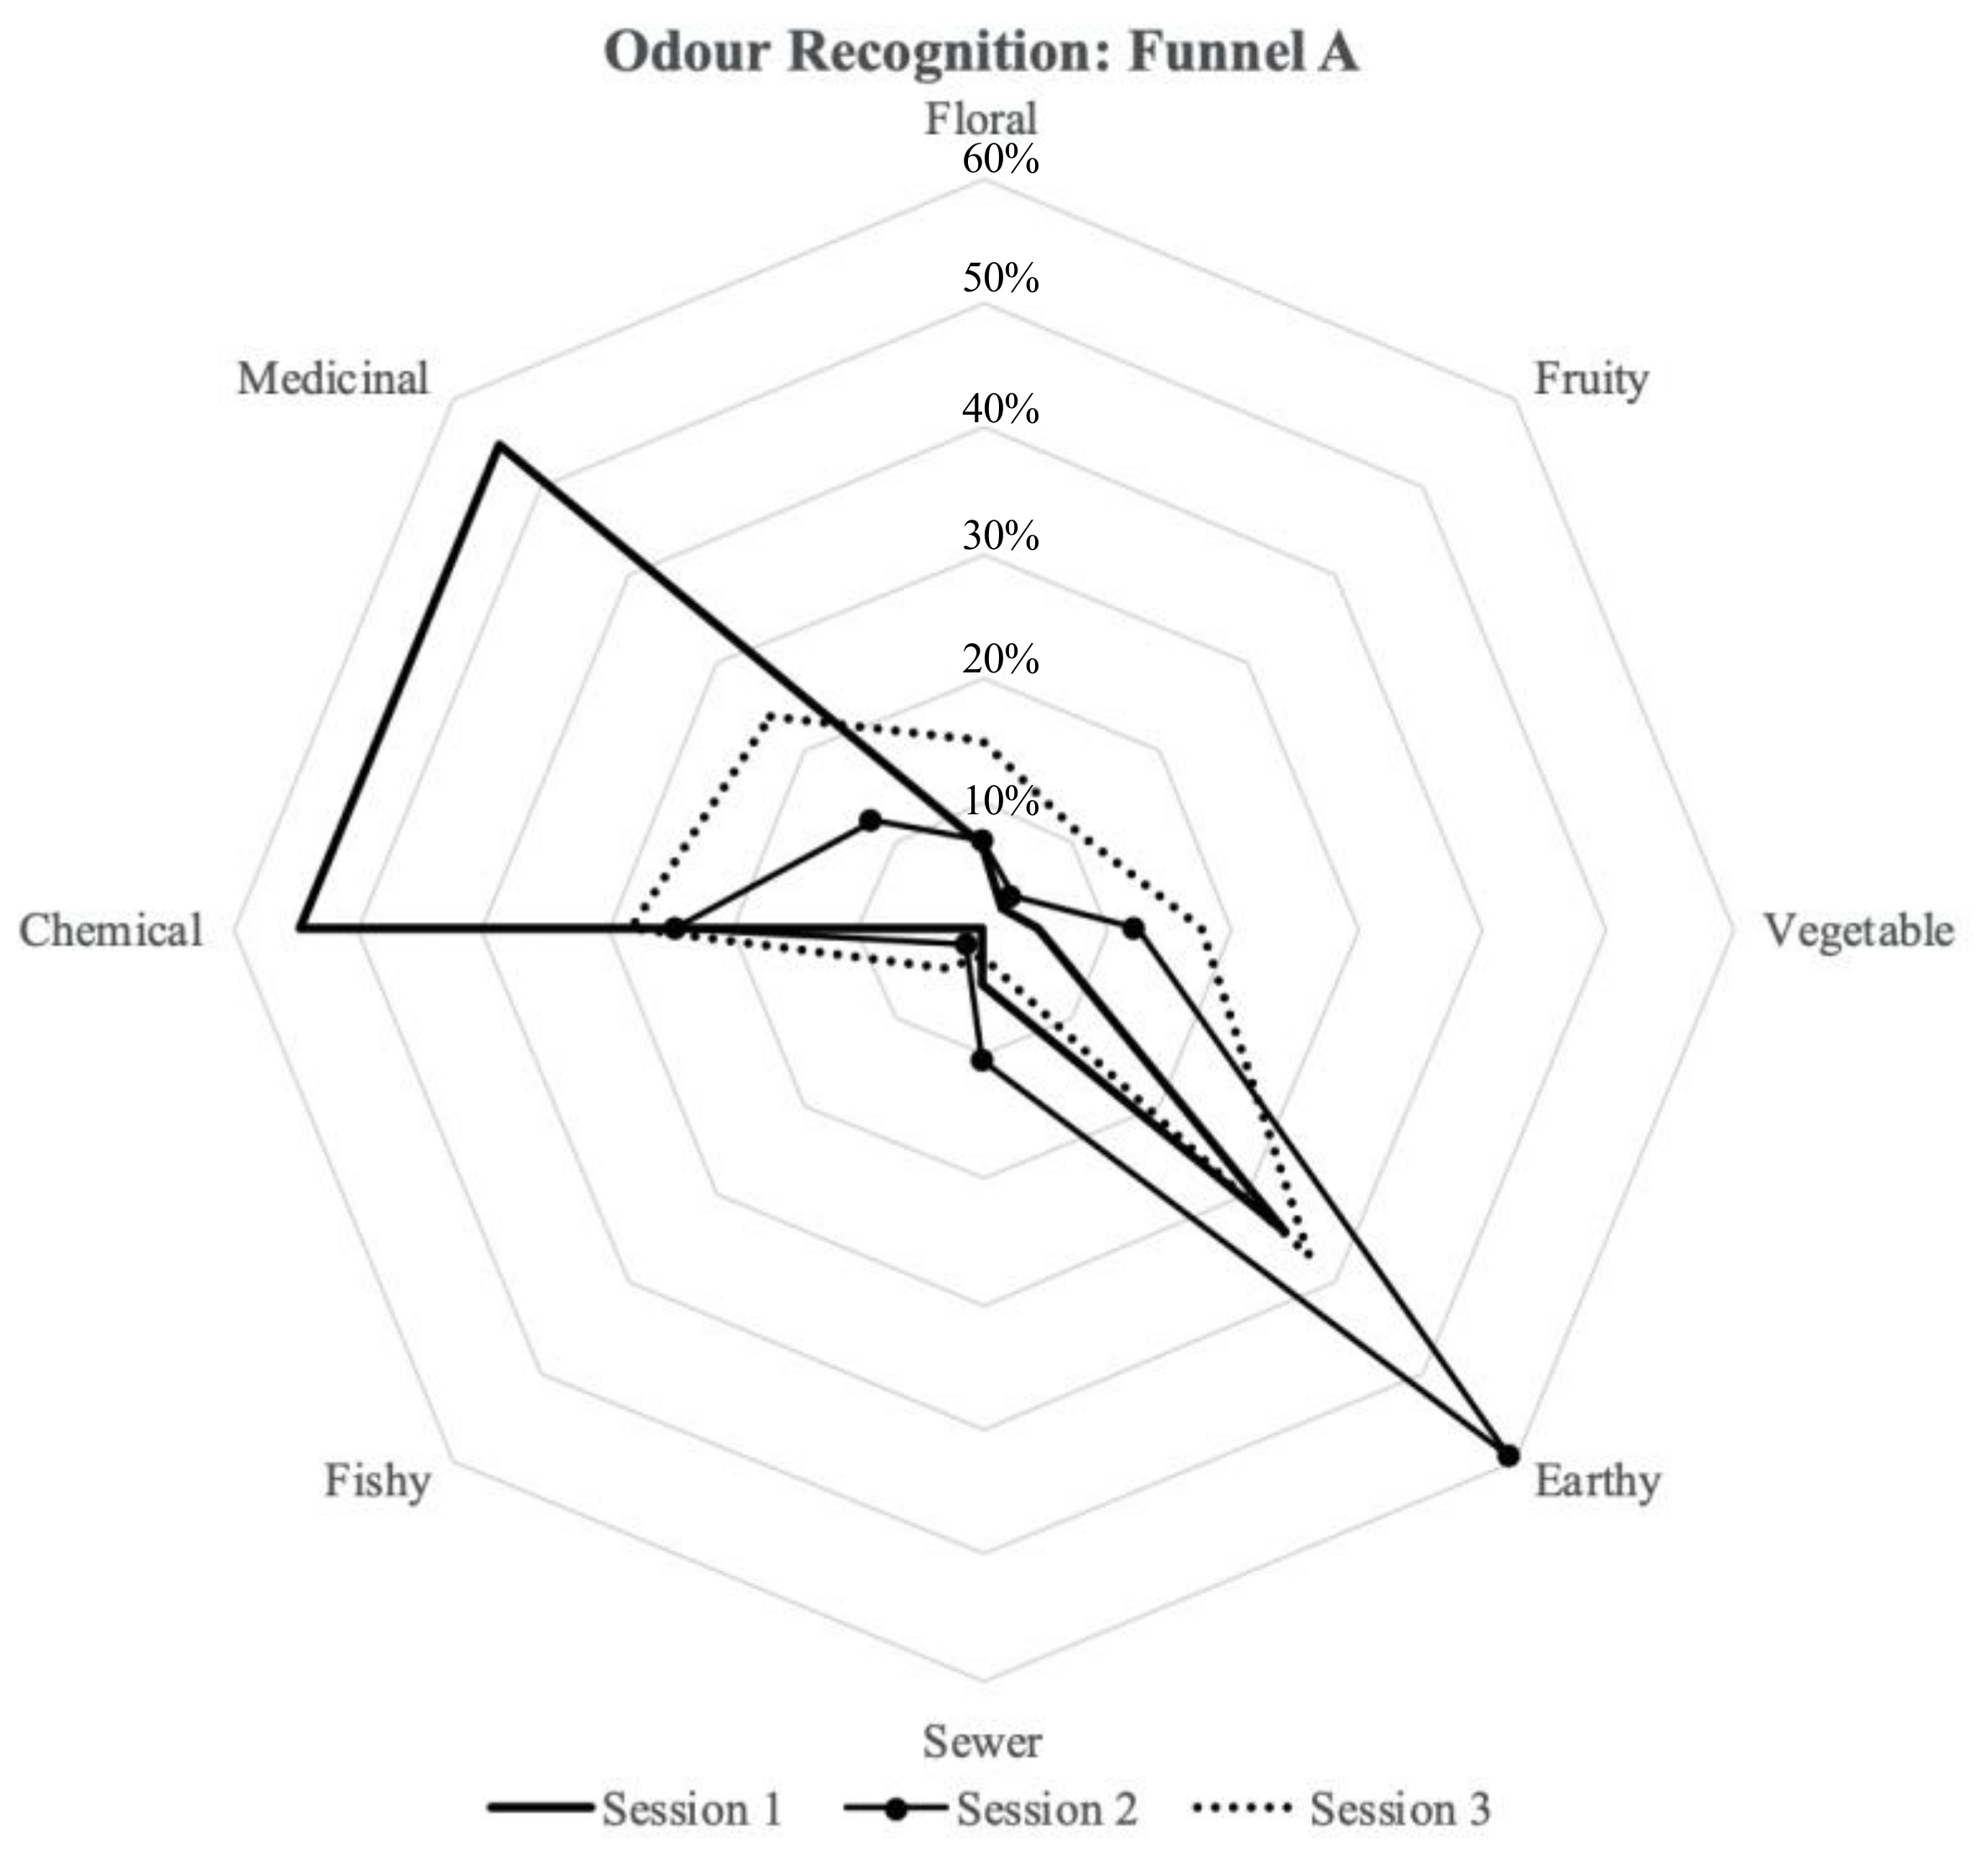
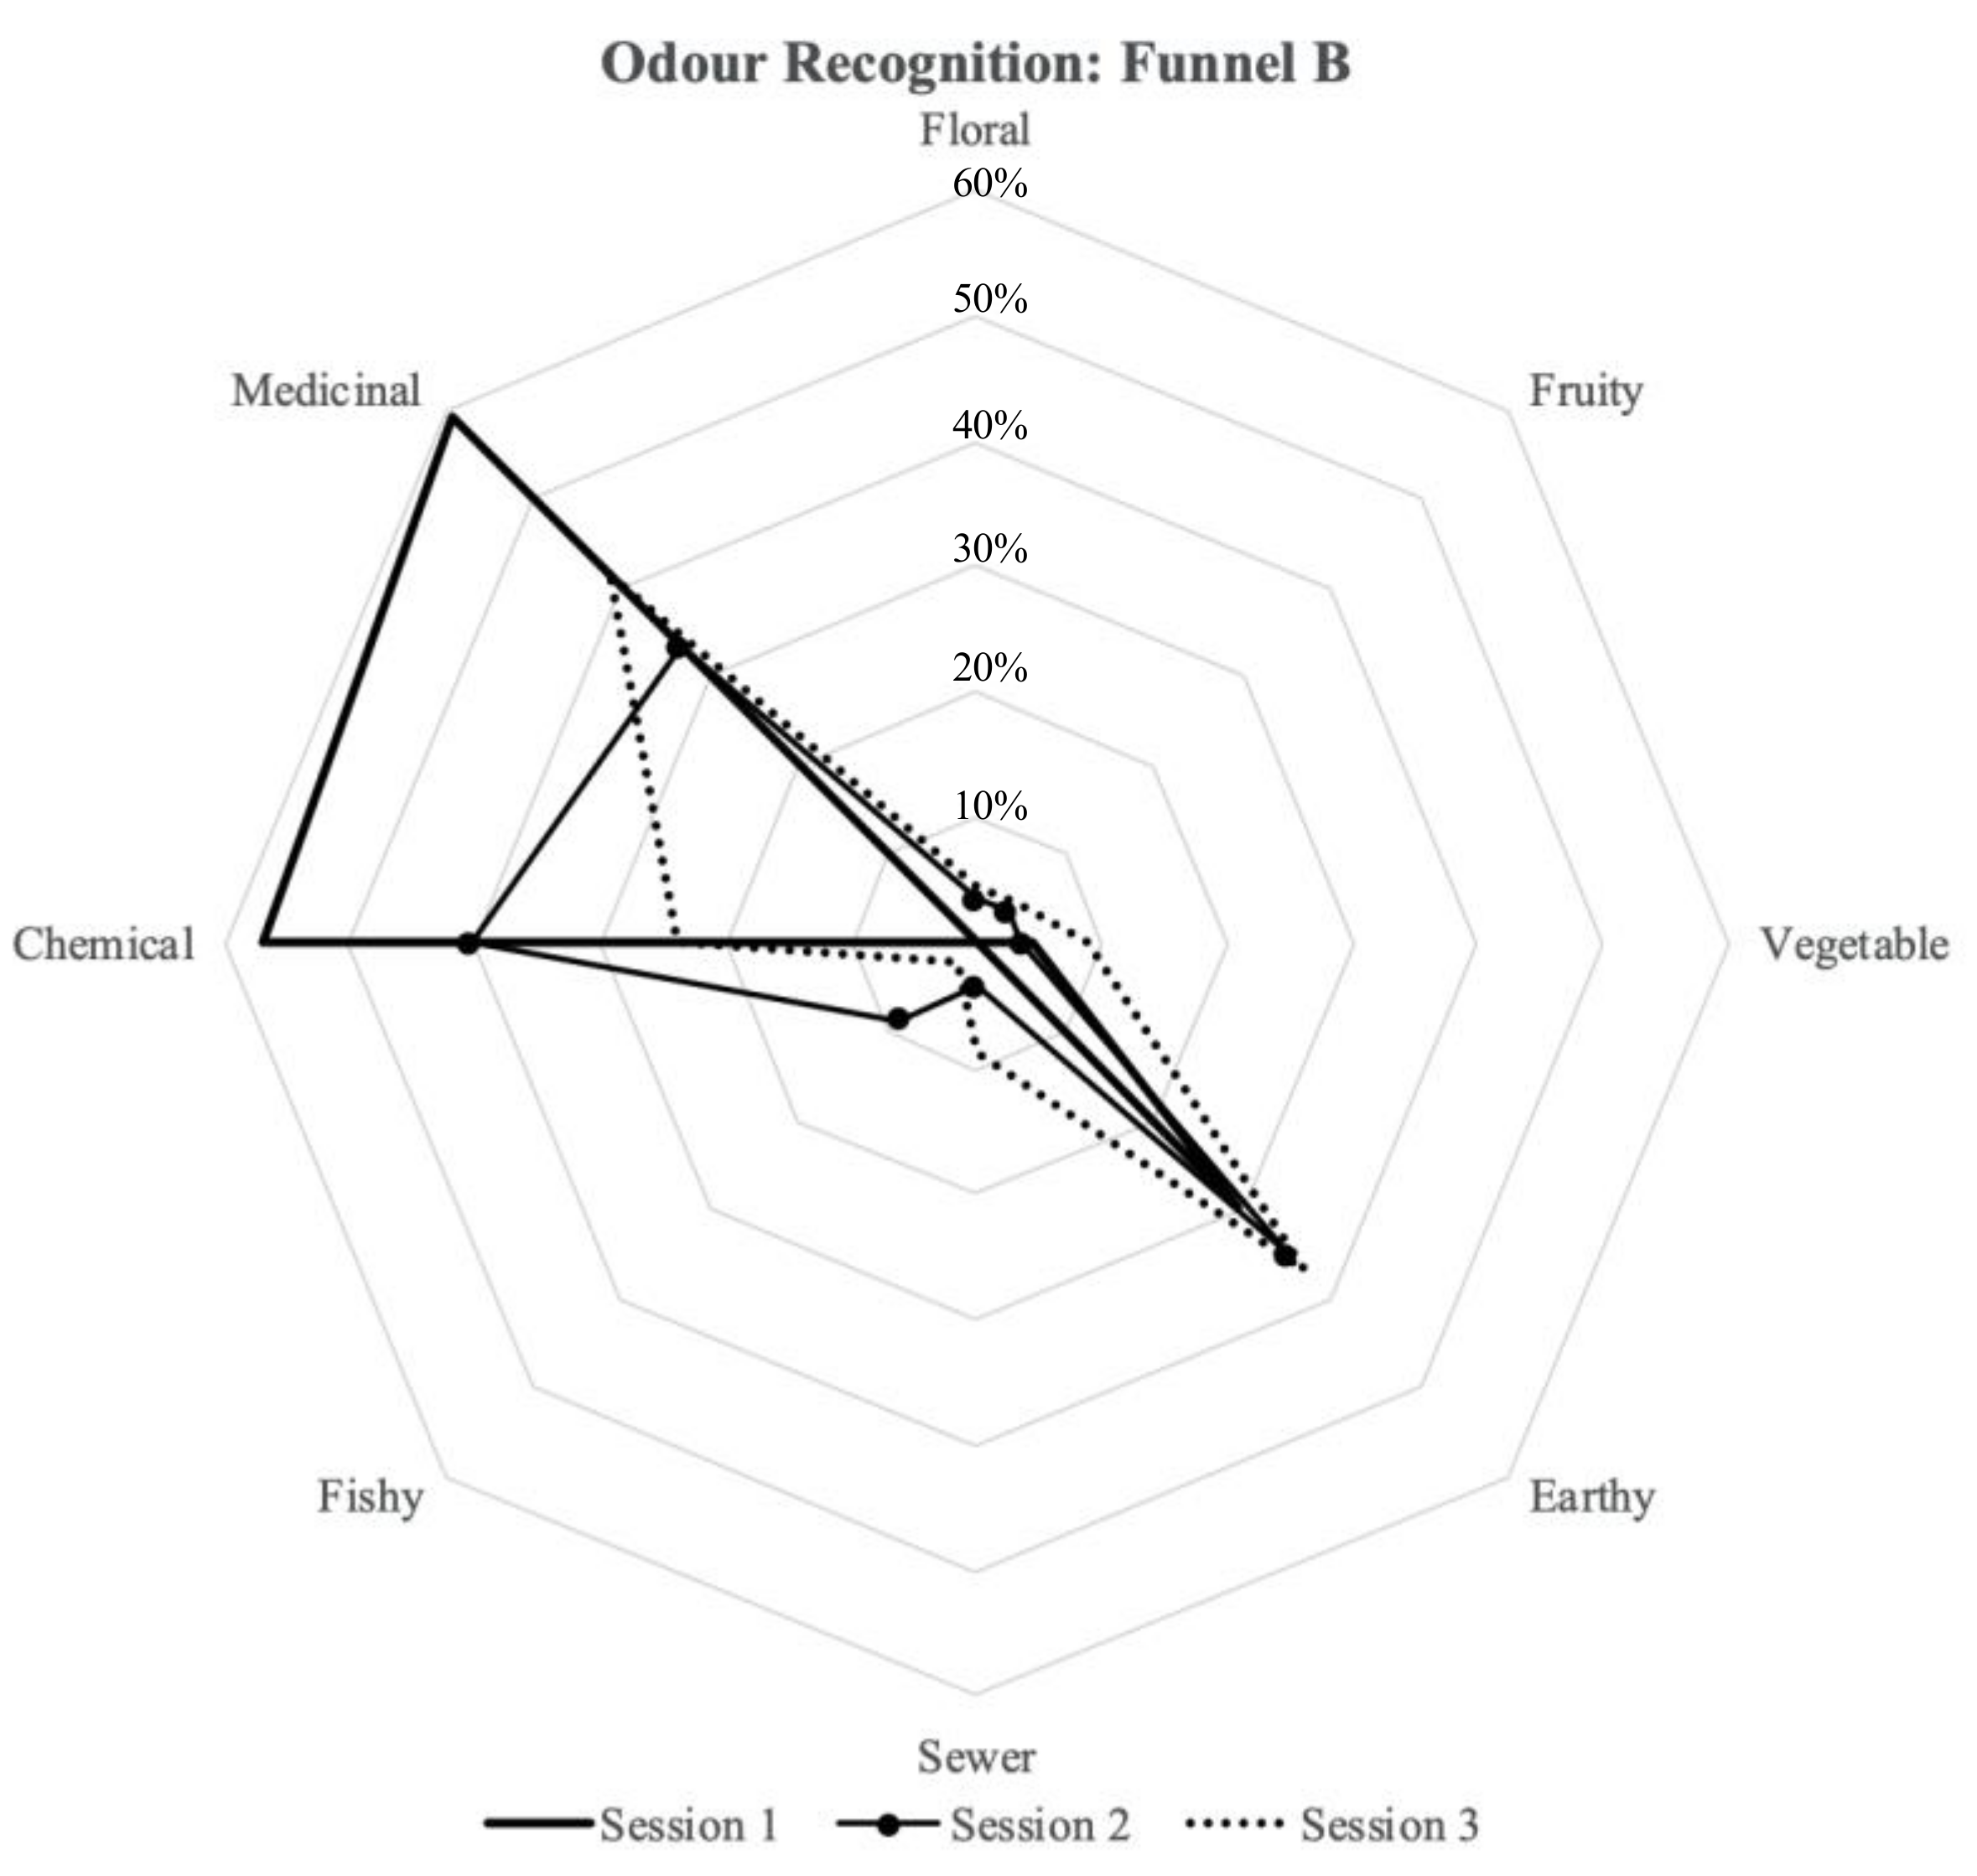
3.4. Odour Recognition
3.5. Preference
4. Discussion
4.1. Impact of Temperature and Humidity in Human Perception
4.2. Acceptability, Intensity, Odour Recognition, and Preference
4.3. Experiments in Semicontrolled Environments
4.4. Limitations
5. Conclusions
Author Contributions
Funding
Institutional Review Board Statement
Informed Consent Statement
Data Availability Statement
Acknowledgments
Conflicts of Interest
References
- Bluyssen, P.M.; de Oliveira Fernandes, E.; Groes, L.; Clausen, G.; Fanger, P.O.; Valbjørn, O.; Bernhard, C.A.; Roulet, C.A. European indoor air quality audit project in 56 office buildings. Indoor Air Int. J. Indoor Environ. Health 1996, 6, 221–238. [Google Scholar] [CrossRef]
- Campagnolo, D.; Saraga, D.E.; Cattaneo, A.; Spinazzè, A.; Mandin, C.; Mabilia, R.; Perreca, E.; Sakellaris, I.; Canha, N.; Mihucz, V.G.; et al. VOCs and aldehydes source identification in European office buildings—The OFFICAIR study. Build. Environ. 2017, 115, 18–24. [Google Scholar] [CrossRef]
- Brown, S.K.; Sim, M.R.; Abramson, M.J.; Gray, C.N. Concentrations of volatile organic-compounds in indoor air—A review. Indoor Air Int. J. Indoor Environ. Health 1994, 4, 123–134. [Google Scholar] [CrossRef]
- Bluyssen, P.M.; Cochet, C.; Fischer, M.; Knöppel, H.; Levy, L.; Lundgren, B.; Maroni, M.; Mølhave, L.; Rothweiler, H.; Saarela, K.; et al. Evaluation of VOC Emissions from Building Products: Solid Flooring Materials; Report No. 18; European Collaborative Action: Zaventem, Belgium, 1997. [Google Scholar]
- Sofuoglu, S.C.; Aslan, G.; Inal, F.; Sofuoglu, A. An assessment of indoor air concentrations and health risks of volatile organic compounds in three primary schools. Int. J. Hyg. Environ. Health 2011, 214, 36–46. [Google Scholar] [CrossRef] [PubMed] [Green Version]
- Yik, F.W.H.; Sat, P.S.K.; Niu, J.L. Moisture generation through Chinese household activities. Indoor Built Environ. 2004, 13, 115–131. [Google Scholar] [CrossRef]
- Kaplan, S. The restorative benefits of nature: Toward an integrative framework. J. Environ. Psychol. 1995, 15, 169–182. [Google Scholar] [CrossRef]
- Han, K.T.; Ruan, L.W. Effects of indoor plants on self-reported perceptions: A systemic review. Sustainability 2019, 11, 4506. [Google Scholar] [CrossRef] [Green Version]
- Wolverton, B.C.; Mcdonald, R.C.; Watkins, E.A. Foliage plants for removing indoor air-pollutants from energy-efficient homes. Econ. Bot. 1984, 38, 224–228. [Google Scholar] [CrossRef]
- Wolverton, B.C.; Johnson, A.; Bounds, K. Interior Landscape Plants for Indoor Air Pollution Abatement; Final Report NASA (NASA-TM-101766, NAS 1.15:101766). Technical Report; National Aeronautics and Space Administration: Long Beach, MS, USA, 1989; pp. 1–22. [Google Scholar]
- Darlington, A.B.; Dat, J.F.; Dixon, M.A. The biofiltration of indoor air: Air flux and temperature influences the removal of toluene, ethylbenzene, and xylene. Environ. Sci. Technol. 2001, 35, 240–246. [Google Scholar] [CrossRef]
- Soreanu, G.; Dixon, M.; Darlington, A. Botanical biofiltration of indoor gaseous pollutants—A mini-review. Chem. Eng. J. 2013, 229, 585–594. [Google Scholar] [CrossRef]
- Dela Cruz, M.; Christensen, J.H.; Thomsen, J.D.; Müller, R. Can ornamental potted plants remove volatile organic compounds from indoor air?—A review. Environ. Sci. Pollut. Res. 2014, 21, 13909–13928. [Google Scholar] [CrossRef] [PubMed]
- Armijos Moya, T.; van den Dobbelsteen, A.; Ottelé, M.; Bluyssen, P.M. A review of green systems within the indoor environment. Indoor Built Environ. 2019, 28, 298–309. [Google Scholar] [CrossRef]
- Armijos Moya, T.; de Visser, P.; Ottelé, M.; van den Dobbelsteen, A.; Bluyssen, P.M. Air cleaning performance of two species of potted plants and different substrates. Submitt. Environ. Sci. Pollut. Res. J. 2021. [Google Scholar] [CrossRef]
- Bluyssen, P.M. All You Need to Know About Indoor Air—A Simple Guide for Educating Yourself to Improve Your Indoor Environment; Delft Academic Press: Delft, The Netherlands, 2015. [Google Scholar]
- Kotzias, D. Indoor air and human exposure assessment—Needs and approaches. Exp. Toxicol. Pathol. 2005, 57, 5–7. [Google Scholar] [CrossRef]
- Vural, M.; Balanlı, A. Sick Building Syndrome from an Architectural Perspective. In Sick Building Syndrome; Abdul-Wahab, S.A., Ed.; Springer: Berlin/Heidelberg, Germany, 2011; pp. 371–391. [Google Scholar]
- Herz, R.S. Influences of odors on mood and affective cognition. In Olfaction, Taste, and Cognition; Rouby, C., Schaal, B., Dubois, D., Gervais, R., Holley, A., Eds.; Cambridge University Press: Cambridge, UK, 2002. [Google Scholar]
- Berglund, B.; Bluyssen, P.M.; Clausen, G.; Garriga-Trillo, A.; Gunnarsen, L.; Knoppel, H.; Lindvall, T.; MacLeod, P.; Molhave, L.; Winneke, G. Sensory Evaluation of Indoor Air Quality; Report No. 20. European Commission Report; European Collaborative Action, Indoor Air Quality and its Impact on Man: Luxembourg City, Luxembourg, 1999. [Google Scholar]
- De Oliveira Fernandes, E.; Bluyssen, P.M.; Clausen, G.H.; Saarela, K.; Maupetit, F.; Kirchner, S.; Molina, J.L.; Bischoff, W.; Knudsen, H.N. Mathis—Materials for Healthy Indoor Spaces and More Energy Efficient Buildings; Indoor Air 99; TNO Bouw: Edinburgh, Scotland, 1999; pp. 628–633. [Google Scholar]
- Bluyssen, P.M.; de Oliveira Fernandes, E.; Molina, J.L. Database for Sources of Pollution for Healthy and Comfortable Indoor Environment (SOPHIE); Status 2000; Healthy Buildings: Espoo, Finland, 2000; pp. 385–390. [Google Scholar]
- Bluyssen, P.M. Sensory evaluation of indoor air pollution sources. In Indoor Air Pollution; Pluschke, P., Ed.; Springer: Berlin/Heidelberg, Germany, 2004; pp. 179–217. [Google Scholar]
- Meilgaard, M.C.; Civille, G.V.; Carr, B.T. Sensory Evaluation Techniques, 4th ed.; CRC Press: Boca Raton, FL, USA, 2006. [Google Scholar]
- Qin, Y.; Liu, J.; Wang, G.; Zhang, Y. Evaluation of indoor air quality based on qualitative, quantitative and olfactory analysis. Chin. Sci. Bull. 2013, 58, 986–991. [Google Scholar] [CrossRef] [Green Version]
- Moya, T.A.; Bluyssen, P.M. Appraisal and identification of different sources of smell by primary school children in the air quality test chamber of the SenseLab. Intell. Build. Int. 2019, 13, 142–155. [Google Scholar] [CrossRef] [Green Version]
- Bluyssen, P.M.; Van Zeist, F.; Kurvers, S.; Tenpierik, M.; Pont, S.; Wolters, B.; Van Hulst, L.; Meertins, D. The creation of SenseLab: A laboratory for testing and experiencing single and combinations of indoor environmental conditions. Intell. Build. Int. 2018, 10, 5–18. [Google Scholar] [CrossRef] [Green Version]
- Gunnarsen, L.; Fanger, P.O. Adaptation to indoor air pollution. Environ. Int. 1992, 1, 43–54. [Google Scholar] [CrossRef]
- Armijos Moya, T.; van den Dobbelsteen, A.; Ottelé, M.; Bluyssen, P.M. Using indoor living wall systems as a climate control method in hot humid climates. In Proceedings of the International Scientific Conference, Healthy Buildings 2017 Europe, Lublin, Poland, 2–5 July 2017; p. 0066. [Google Scholar]
- Armijos Moya, T.; van den Dobbelsteen, A.; Ottelé, M.; Bluyssen, P.M. Green air conditioning: Using indoor living wall systems as a climate control method. Rehva J. 2017, 3, 27–31. [Google Scholar]
- Fang, L.; Clausen, G.; Fanger, P.O. Impact of temperature and humidity on the perception of indoor air quality. Indoor Air Int. J. Indoor Air Qual. Clim. 1998, 8, 80–90. [Google Scholar] [CrossRef]
- Fang, L.; Clausen, G.; Fanger, P.O. Temperature and Humidity: Important Factors for Perception of Air Quality and for Ventilation Requirements. ASHRAE Trans. 2000, 106, 503–510. [Google Scholar]
- Siebielec, S.; Woźniak, M.; Gałązka, A.; Siebielec, G. Microorganisms as indoor and outdoor air biological pollution. Adv. Microbiol. 2020, 59, 115–127. [Google Scholar] [CrossRef]
- Bringslimark, T.; Hartig, T.; Patil, G.G. The psychological benefits of indoor plants: A critical review of the experimental literature. J. Environ. Psychol. 2009, 29, 422–433. [Google Scholar] [CrossRef]
- White, E.V.; Gatersleben, B. Greenery on residential buildings: Does it affect preferences and perceptions of beauty? J. Environ. Psychol. 2011, 31, 89–98. [Google Scholar] [CrossRef] [Green Version]
- Fanger, P.O. Introduction of the olf and the decipol units to quantify air pollution sources perceived by humans indoors and outdoors. Energy Build. 1988, 1, 1–6. [Google Scholar] [CrossRef]
- Vroon, P.A. Psychologische Aspecten van Ziekmakende Gebouwen. Psychological Aspects of Building Related Illness; Rijkuniversiteit Utrecht: Utrecht, The Netherlands, 1990. [Google Scholar]
- Dalton, P. Odor perception and beliefs about risk. Chem. Senses 1996, 21, 447–458. [Google Scholar] [CrossRef] [Green Version]


| Session Number | Date | Number of Participants | Assessment | |||
|---|---|---|---|---|---|---|
| Intensity | Acceptability | Recognition | Preference | |||
| Pilot Test | 4 April 2019 | 59 | x | x | x | - |
| Session 1 | 10 April 2019 | 44 | x | x | x | x |
| Session 2 | 24 April 2019 | 57 | x | x | x | x |
| Session 3 | 8 May 2019 | 46 | x | x | x | x |
| Session 1 | Session 2 | Session 3 | ||||
|---|---|---|---|---|---|---|
| Chamber A | Chamber B | Chamber A | Chamber B | Chamber A | Chamber B | |
| Temperature (°C) | 19.5 | 20.0 | 19.7 | 20.2 | 19.8 | 20.2 |
| RH (%) | 38.1 | 27.3 | 62.4 | 54.5 | 55.5 | 47.6 |
| CO2 (ppm) | 460.9 | 262.8 | 422.5 | 465.6 | 480.3 | 467.4 |
| Chamber A | Chamber B | |||||
|---|---|---|---|---|---|---|
| Session 1 | Session 2 | Session 3 | Session 1 | Session 2 | Session 3 | |
| Mean Value | 2.03 | 2.46 | 2.5 | 1.86 | 1.95 | 2.30 |
| SD * | 0.87 | 0.94 | 0.84 | 0.82 | 0.88 | 0.98 |
| SE ** | 0.13 | 0.12 | 0.12 | 0.12 | 0.12 | 0.14 |
| Chamber A | Chamber B | |||||
|---|---|---|---|---|---|---|
| Session 1 | Session 2 | Session 3 | Session 1 | Session 2 | Session 3 | |
| Mean Value | 0.13 | −0.11 | −0.11 | 0.19 | 0.09 | 0.01 |
| SD * | 0.38 | 0.56 | 0.51 | 0.37 | 0.49 | 0.54 |
| SE ** | 0.06 | 0.08 | 0.07 | 0.06 | 0.06 | 0.08 |
| Preference | Session 1 | Session 2 | Session 3 | |||
|---|---|---|---|---|---|---|
| n = 44 | n = 57 | n = 46 | ||||
| Funnel 1 (A) | 24 | 55% | 21 | 37% | 17 | 37% |
| Funnel 2 (B) | 20 | 45% | 35 | 61% | 28 | 61% |
| No preference | 1 | 2% | 1 | 2% | ||
| Total | 44 | 100% | 57 | 100% | 46 | 100% |
Publisher’s Note: MDPI stays neutral with regard to jurisdictional claims in published maps and institutional affiliations. |
© 2021 by the authors. Licensee MDPI, Basel, Switzerland. This article is an open access article distributed under the terms and conditions of the Creative Commons Attribution (CC BY) license (https://creativecommons.org/licenses/by/4.0/).
Share and Cite
Armijos Moya, T.; Ottelé, M.; van den Dobbelsteen, A.; Bluyssen, P.M. The Effect of an Active Plant-Based System on Perceived Air Pollution. Int. J. Environ. Res. Public Health 2021, 18, 8233. https://0-doi-org.brum.beds.ac.uk/10.3390/ijerph18158233
Armijos Moya T, Ottelé M, van den Dobbelsteen A, Bluyssen PM. The Effect of an Active Plant-Based System on Perceived Air Pollution. International Journal of Environmental Research and Public Health. 2021; 18(15):8233. https://0-doi-org.brum.beds.ac.uk/10.3390/ijerph18158233
Chicago/Turabian StyleArmijos Moya, Tatiana, Marc Ottelé, Andy van den Dobbelsteen, and Philomena M. Bluyssen. 2021. "The Effect of an Active Plant-Based System on Perceived Air Pollution" International Journal of Environmental Research and Public Health 18, no. 15: 8233. https://0-doi-org.brum.beds.ac.uk/10.3390/ijerph18158233