
Muscle Contractile Properties Measured at Submaximal Electrical Amplitudes and Not at Supramaximal Amplitudes Are Associated with Repeated Sprint Performance and Fatigue Markers


Abstract
:1. Introduction
2. Materials and Methods
2.1. Participants
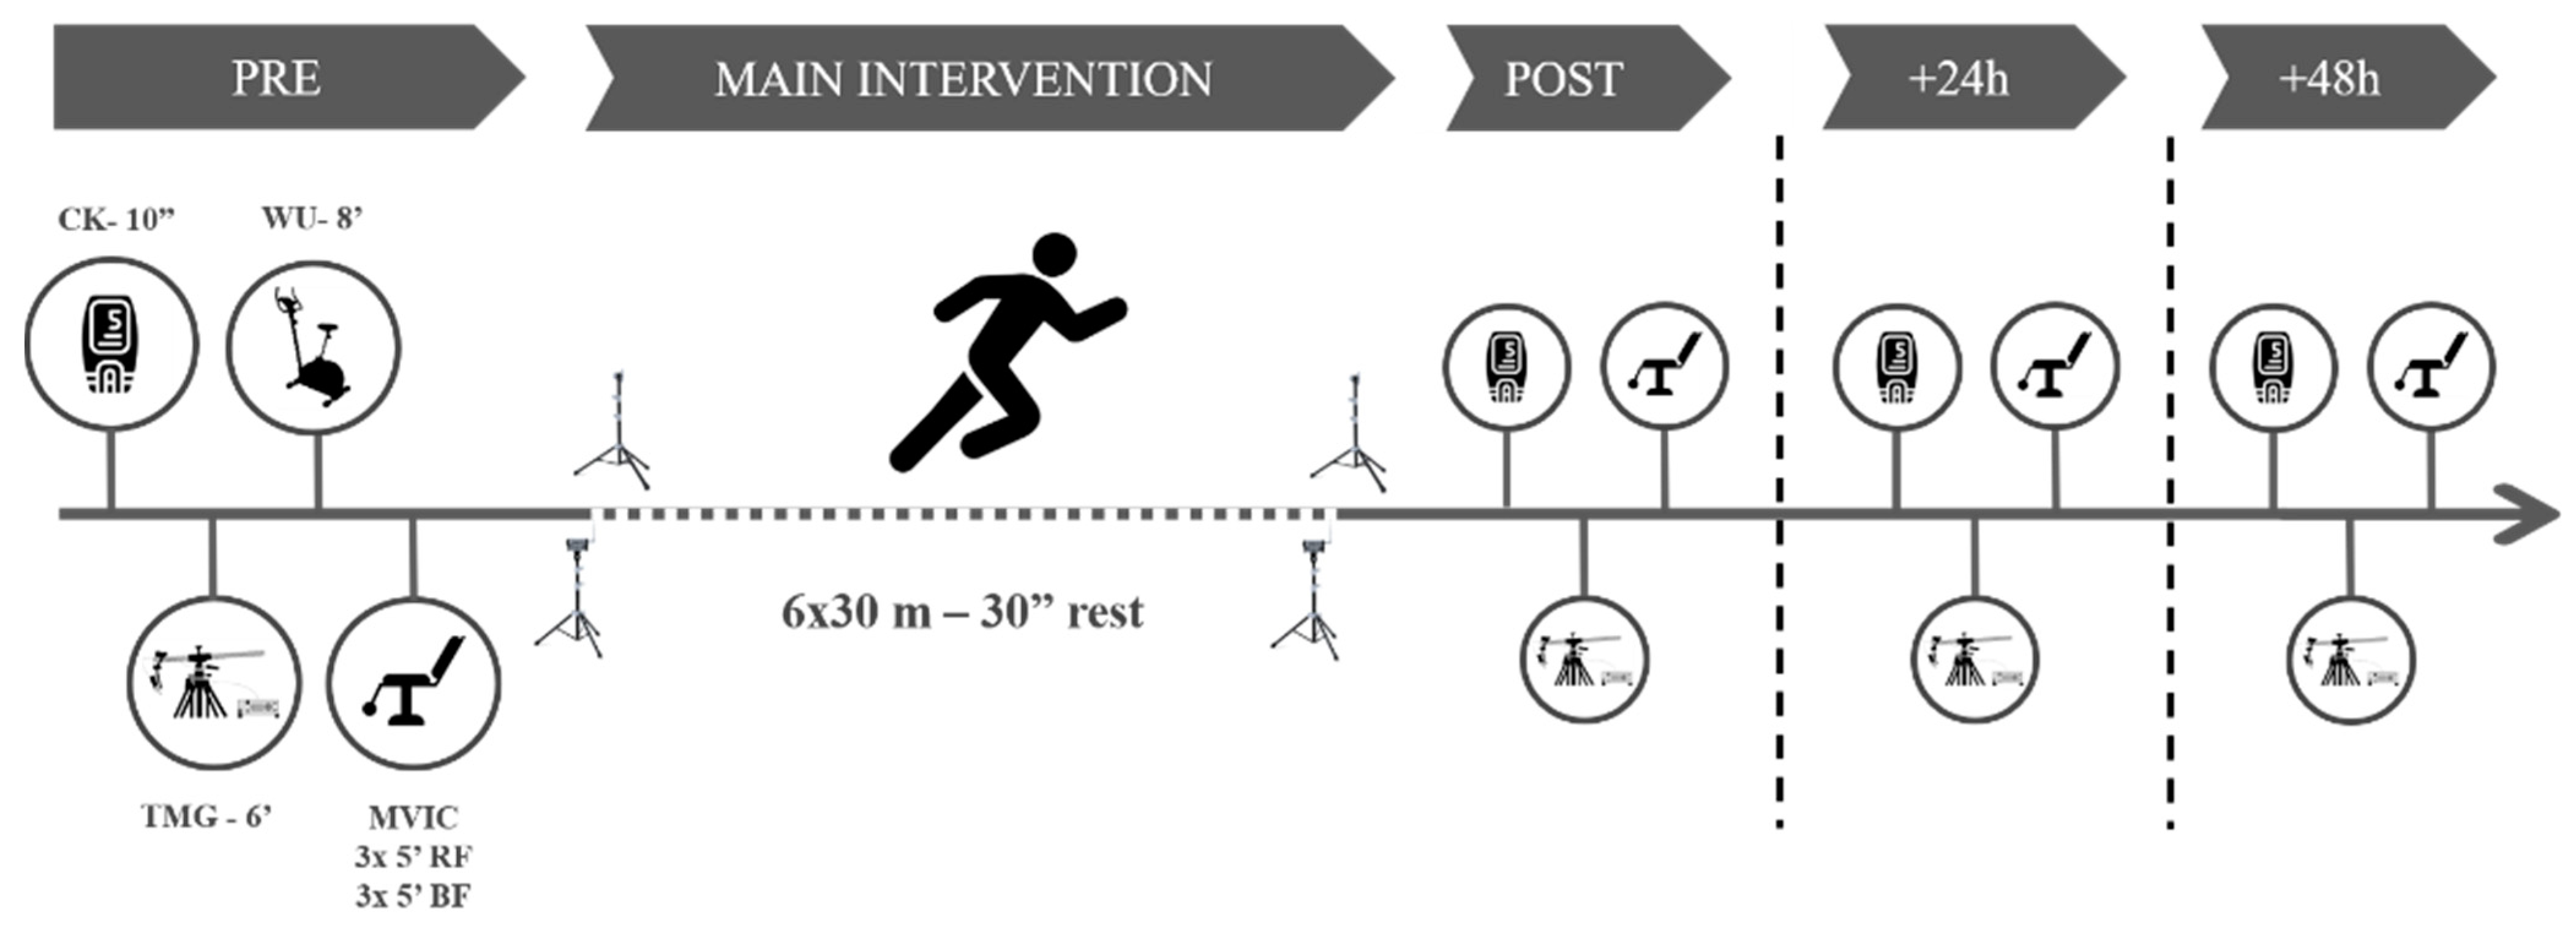
2.2. Procedures
2.3. Statistical Analysis
3. Results
3.1. Repeated Sprint
3.2. MVIC and Fatigue Time Course
3.3. Amplitude Differences
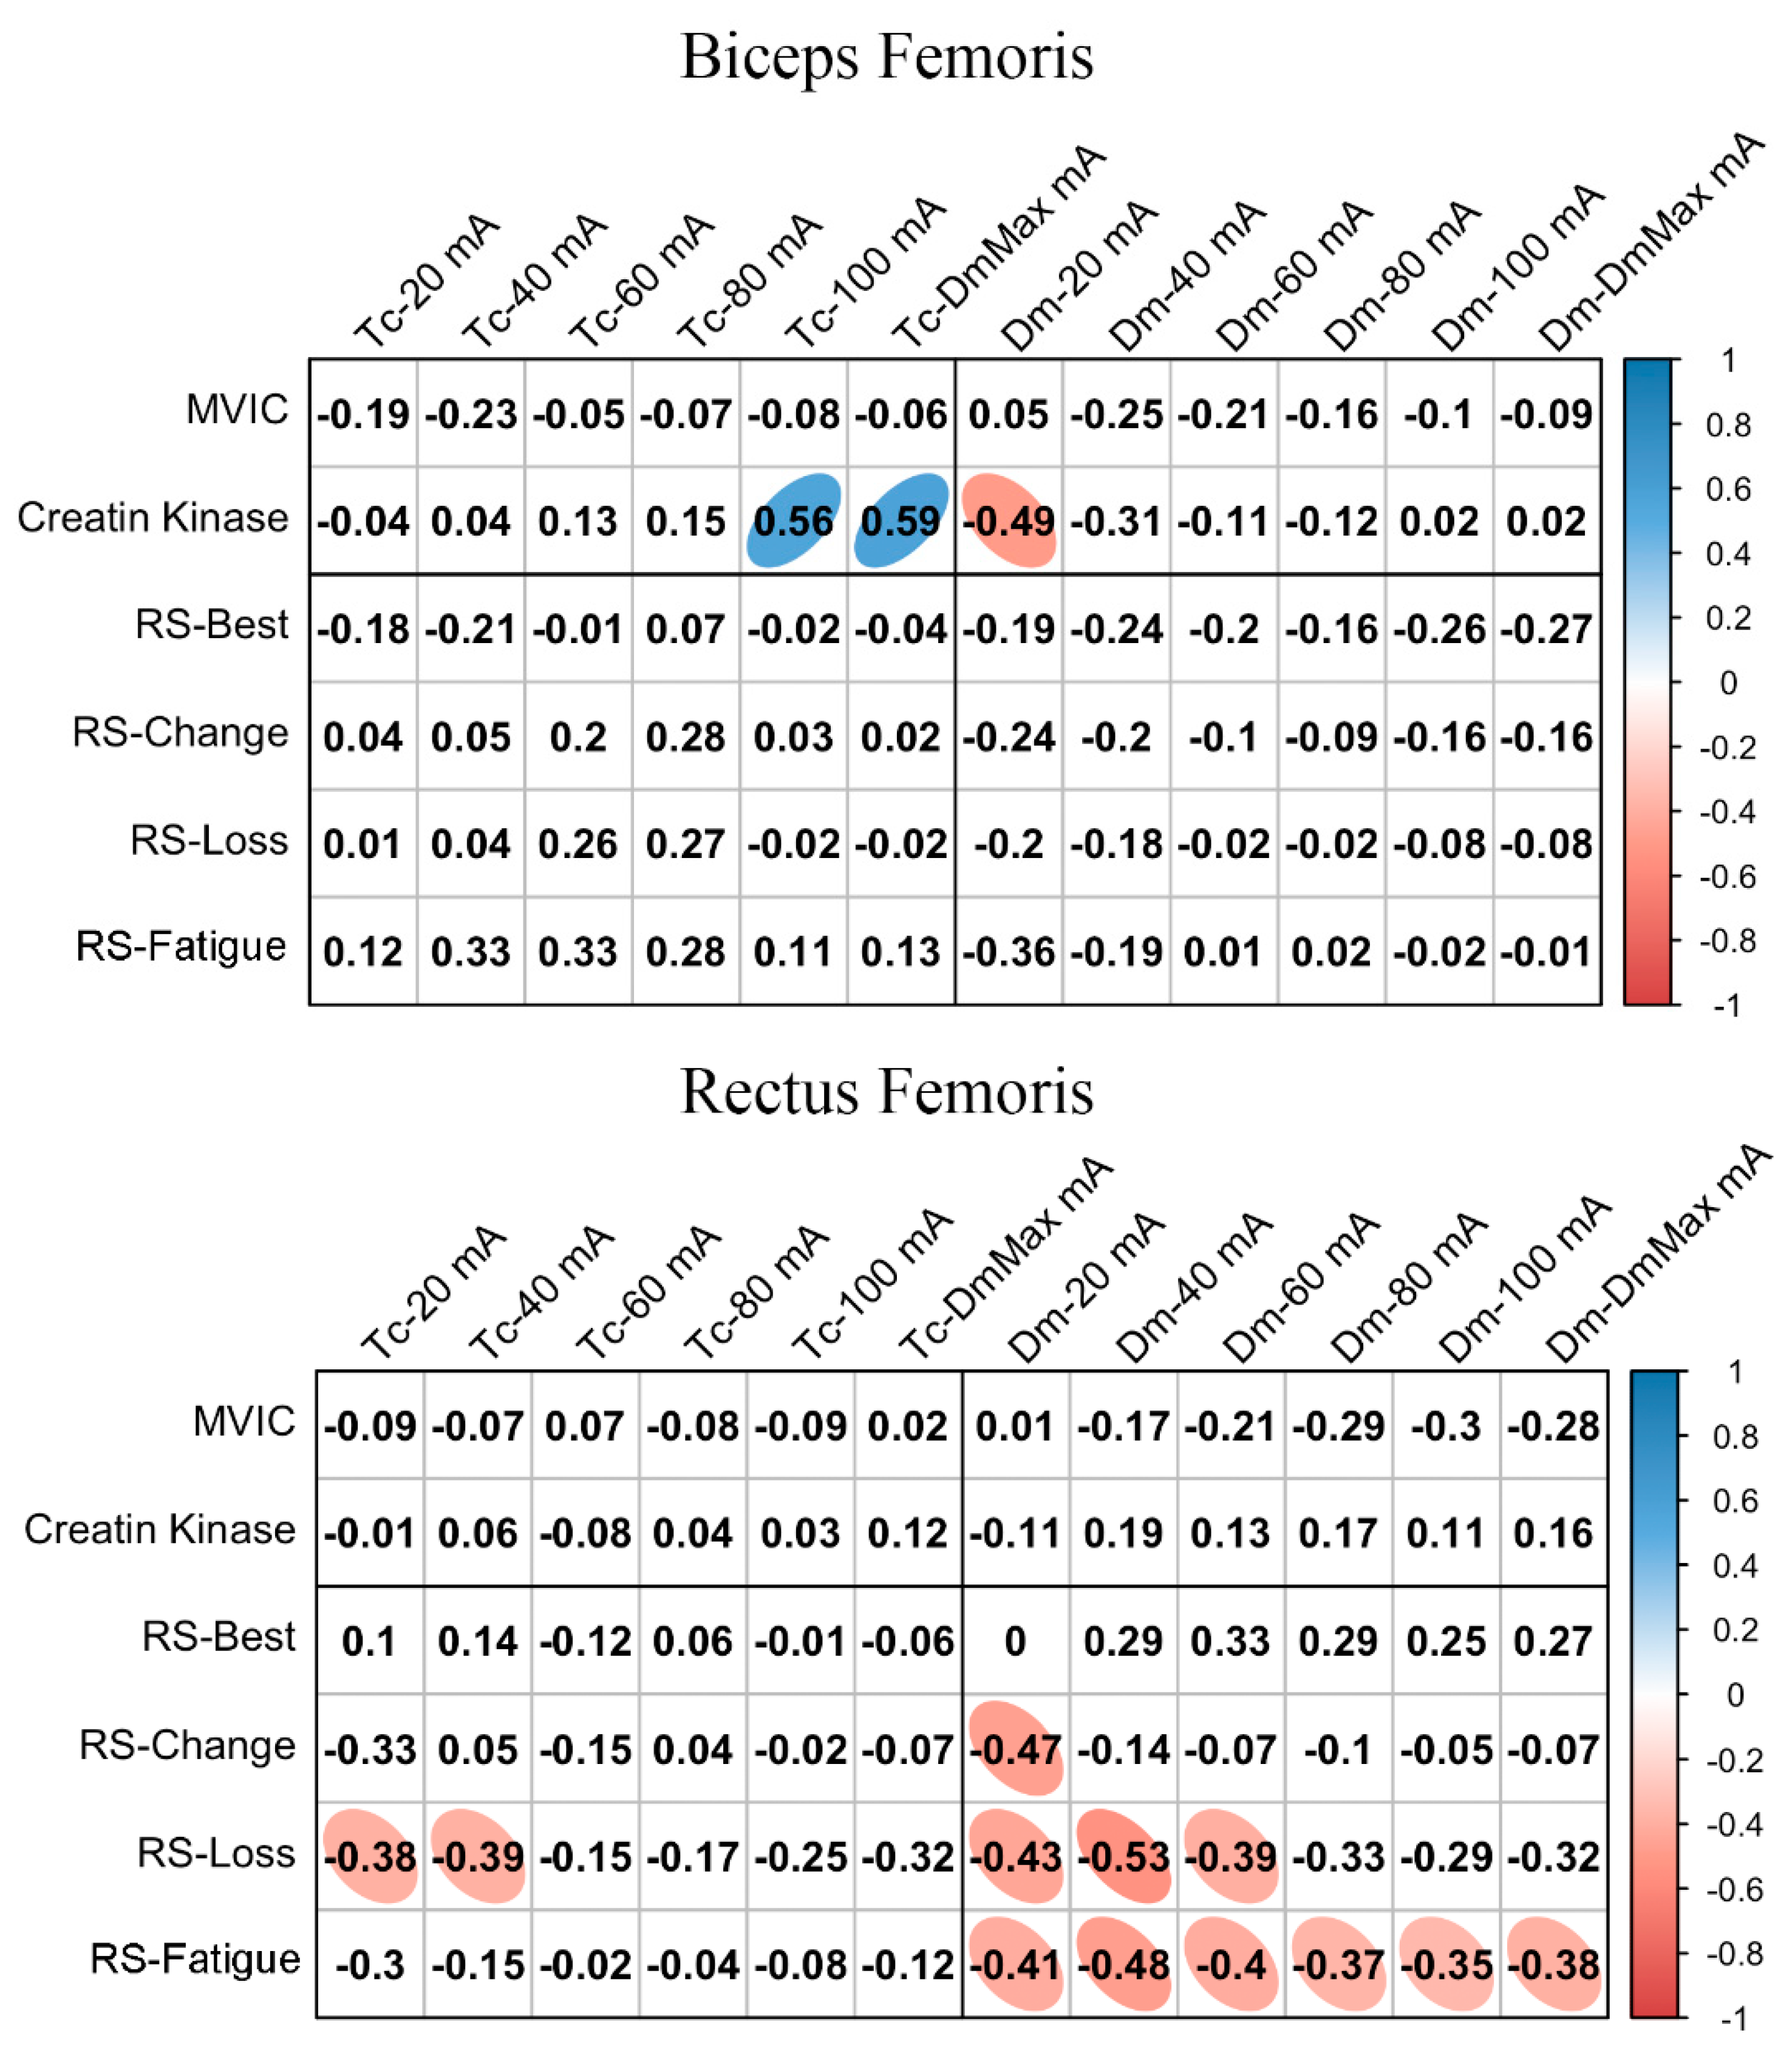
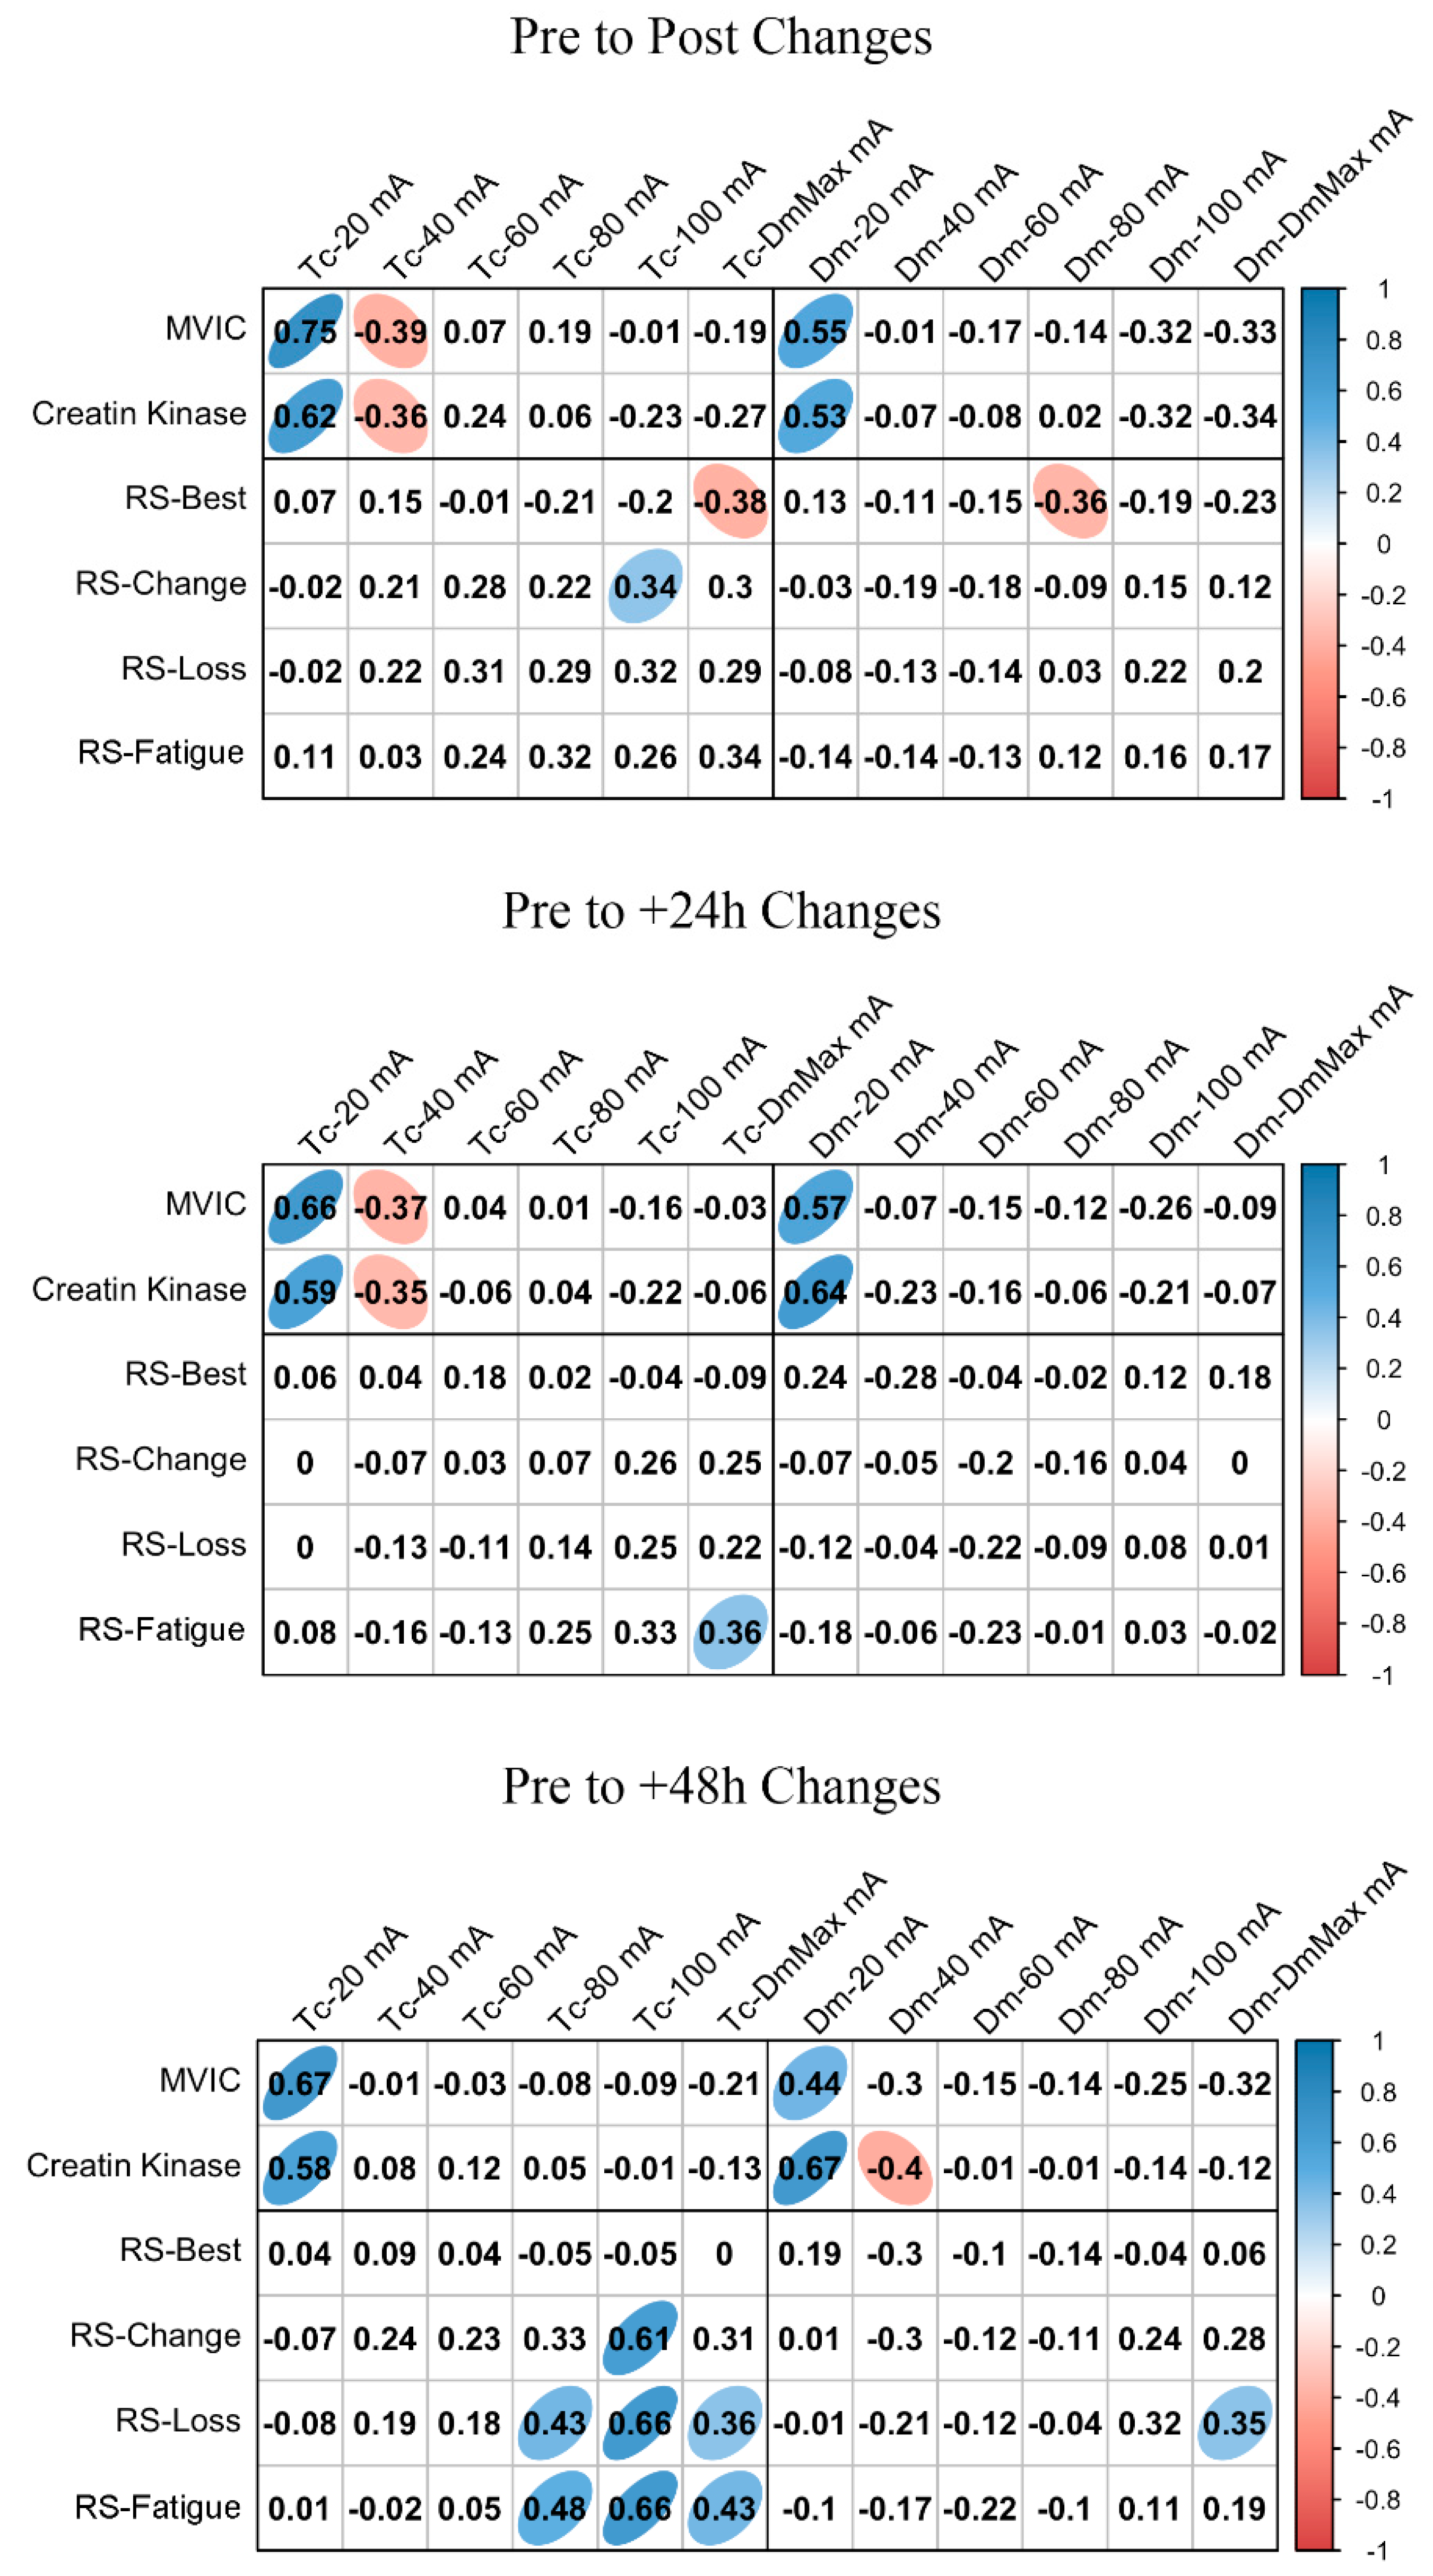
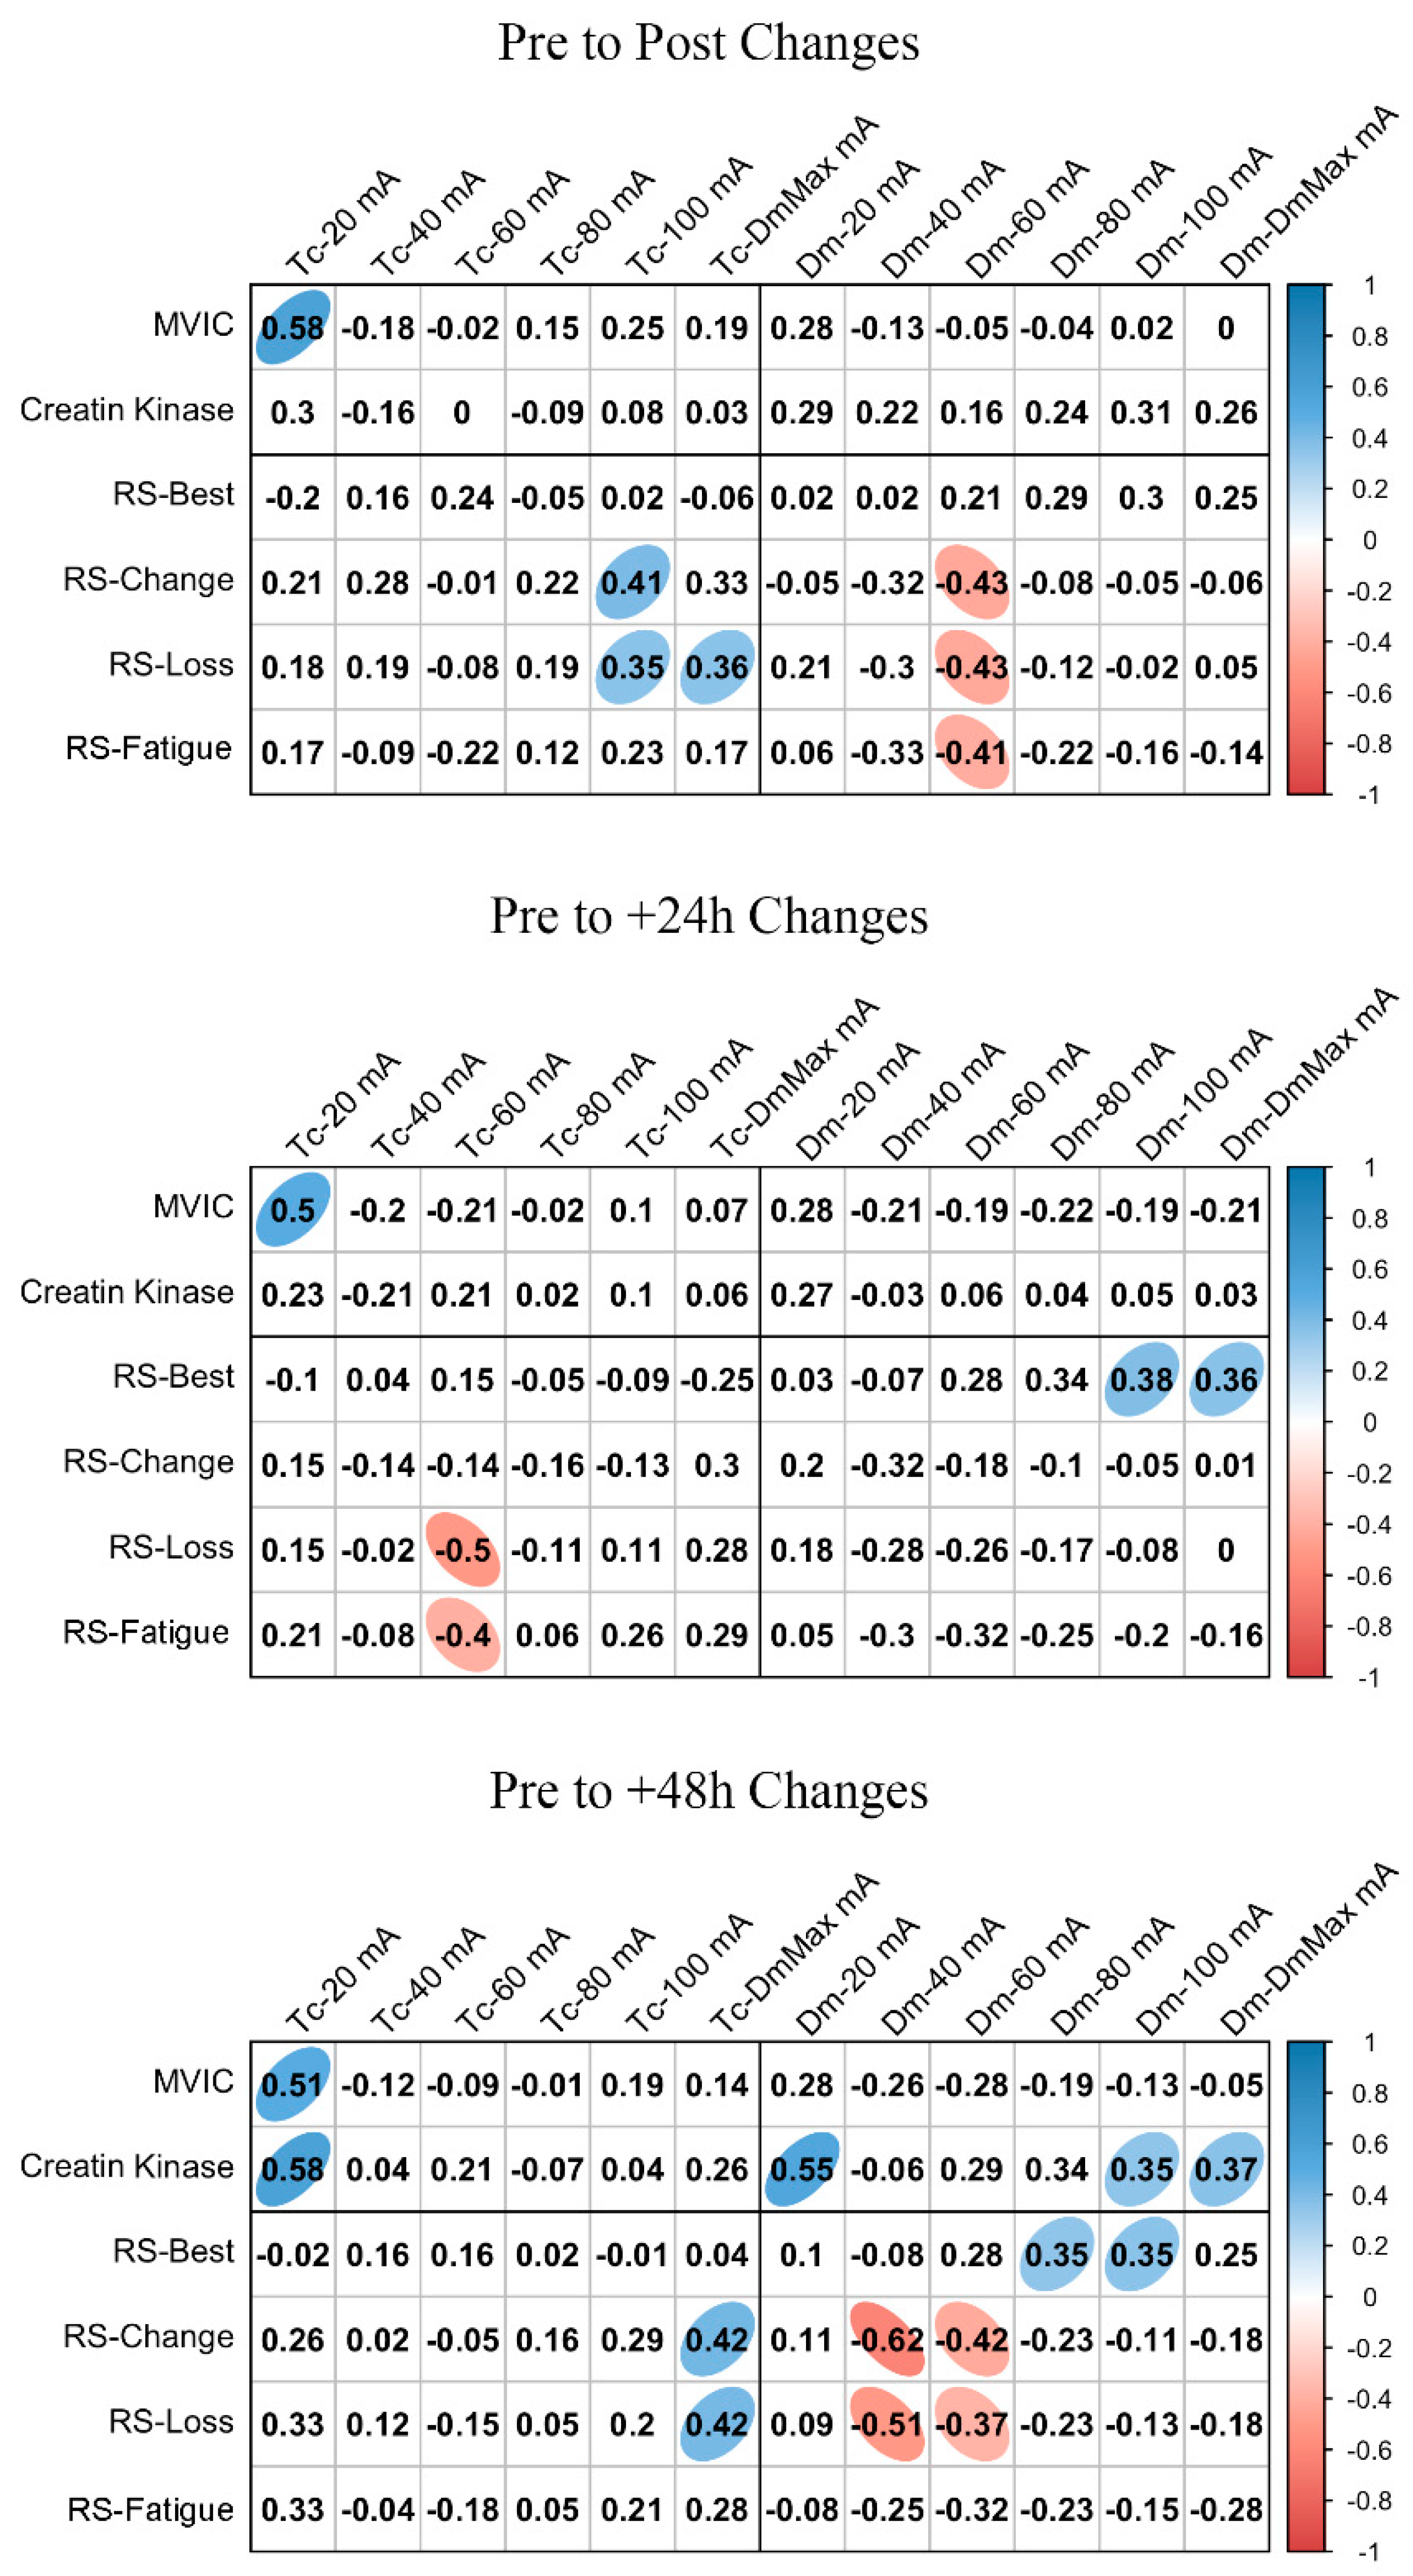
3.4. MCP Relationships with Fatigue and Performance Markers
4. Discussion
5. Conclusions
Author Contributions
Funding
Institutional Review Board Statement
Informed Consent Statement
Data Availability Statement
Conflicts of Interest
References
- Lohr, C.; Schmid, T.; Medina Porqueres, I.; Braumann, K.M.; Reer, R.; Porthun, J. Diagnostic accuracy, Validity, and Reliability of Tensiomyography to assess muscle function and exercise-induced fatigue in healthy participants. A Systematic Review with Meta-Analysis. J. Electromyogr. Kinesiol. 2019, 47, 65–87. [Google Scholar] [CrossRef]
- Muñoz-López, A.; De Hoyo, M.; Nuñez, F.J.; Sañudo, B. Using Tensiomyography to Assess Changes in Knee Muscle Contraction Properties After Concentric and Eccentric Fatiguing Muscle Actions. J. Strength Cond. Res. 2020. Online ahead of print. [Google Scholar] [CrossRef]
- Šimunič, B. Model of Longitudinal Contractions and Transverse Deformations in Skeletal Muscles. Ph.D. Thesis, University of Ljubljana, Ljubljana, Slovenia, 2003. [Google Scholar]
- Rodriguez-Matoso, D.; Rodríguez-Ruiz, D.; Sarmiento, S.; Vaamonde, D.; Da Silva-Grigoletto, M.E. Reproducibility of muscle response measurements using tensiomyography in a range of positions. Rev. Andal. Med. Deport. 2010, 3, 81–86. [Google Scholar]
- Soriguer, F.; Vendrell, J.; Serrano-rios, M.; Pascual-manich, G.; Ortega, E.; Mora-peces, I.; Goday, A.; Gaztambide, S.; Franch, J.; Castell, C.; et al. The effect of inter-electrode distance on radial muscle displacement and contraction time of the biceps femoris, gastrocnemius medialis and biceps brachii, using Tensiomyography in healthy participants. Physiol. Measurement. 2019, 40, 075007. [Google Scholar]
- Šimunič, B. Between-day reliability of a method for non-invasive estimation of muscle composition. J. Electromyogr. Kinesiol. 2012, 22, 527–530. [Google Scholar] [CrossRef] [PubMed]
- Dahmane, R.; Djordjevič, S.; Šimunič, B.; Valenčič, V. Spatial fiber type distribution in normal human muscle: Histochemical and tensiomyographical evaluation. J. Biomech. 2005, 38, 2451–2459. [Google Scholar] [CrossRef] [PubMed]
- Dahmane, R.; Valenčič, V.; Knez, N.; Eržen, I. Evaluation of the ability to make non-invasive estimation of muscle contractile properties on the basis of the muscle belly response. Med. Biol. Eng. Comput. 2001, 39, 51–55. [Google Scholar] [CrossRef]
- Feiereisen, P.; Duchateau, J.; Hainaut, K. Motor unit recruitment order during voluntary and electrically induced contractions in the tibialis anterior. Exp. Brain Res. 1997, 114, 117–123. [Google Scholar] [CrossRef] [PubMed]
- Elder, G.C.B.; Bradbury, K.; Roberts, R. Variability of fiber type distributions within human muscles. J. Appl. Physiol. Respir. Environ. Exerc. Physiol. 1982, 53, 1473–1480. [Google Scholar] [CrossRef]
- Travnik, L.; Djordjevič, S.; Rozman, S.; Hribernik, M.; Dahmane, R. Muscles within muscles: A tensiomyographic and histochemical analysis of the normal human vastus medialis longus and vastus medialis obliquus muscles. J. Anat. 2013, 222, 580–587. [Google Scholar] [CrossRef]
- Pišot, R.; Narici, M.V.; Šimunič, B.; De Boer, M.; Seynnes, O.; Jurdana, M.; Biolo, G.; Mekjavič, I.B. Whole muscle contractile parameters and thickness loss during 35-day bed rest. Eur. J. Appl. Physiol. 2008, 104, 409–414. [Google Scholar] [CrossRef] [PubMed]
- Henneman, E.; Mendell, L. Functional organization of motoneuron pool and its inputs. In Handbook of Physiology; Brookhart, J., Mountcastle, V., Bathesda, M., Eds.; American Physiological Society: Rockville, MD, USA, 1981; pp. 423–507. [Google Scholar]
- Knaflitz, M.; Merletti, R.; De Luca, C.J. Inference of motor unit recruitment order in voluntary and electrically elicited contractions. J. Appl. Physiol. 1990, 68, 1657–1667. [Google Scholar] [CrossRef] [Green Version]
- Salvenberg, H.H.C.M. Rise and relaxation times of twitches and tetani in submaximally recruited, mixed muscle: A computer model. In Skeletal Muscle Mechanics: From Mechanism to Function; Herzog, W., Ed.; John Wiley & Sons, Ltd.: Chichester, UK, 2000. [Google Scholar]
- Loturco, I.; Kobal, R.; Kitamura, K.; Fernandes, V.; Moura, N.; Siqueira, F.; Cal Abad, C.C.; Pereira, L.A. Predictive Factors of Elite Sprint Performance: Influences of Muscle Mechanical Properties and Functional Parameters. J. Strength Cond. Res. 2019, 33, 974–986. [Google Scholar] [CrossRef] [PubMed]
- Morales-Artacho, A.J.; Padial, P.; Rodríguez-Matoso, D.; Rodríguez-Ruiz, D.; García-Ramos, A.; García-Manso, J.M.; Calderón, C.; Feriche, B.; Garciá-Ramos, A.; Garciá-Manso, J.M.; et al. Assessment of Muscle Contractile Properties at Acute Moderate Altitude through Tensiomyography. High Alt. Med. Biol. 2015, 16, 343–349. [Google Scholar] [CrossRef] [PubMed]
- Rampinini, E.; Sassi, A.; Morelli, A.; Mazzoni, S.; Fanchini, M.; Coutts, A.J. Repeated-sprint ability in professional and amateur soccer players. Appl. Physiol. Nutr. Metab. 2009, 34, 1048–1054. [Google Scholar] [CrossRef]
- Monks, M.R.; Compton, C.T.; Yetman, J.D.; Power, K.E.; Button, D.C. Repeated sprint ability but not neuromuscular fatigue is dependent on short versus long duration recovery time between sprints in healthy males. J. Sci. Med. Sport. 2017, 20, 600–605. [Google Scholar] [CrossRef]
- García-Manso, J.M.; Rodríguez-Ruiz, D.; Rodríguez-Matoso, D.; de Yves, S.; Sarmiento, S.; Quiroga, M.; de Saa, Y.; Sarmiento, S.; Quiroga, M. Assessment of muscle fatigue after an ultra-endurance triathlon using tensiomyography (TMG). J. Sports Sci. 2011, 29, 619–625. [Google Scholar] [CrossRef]
- Girard, O.; Mendez-Villanueva, A.; Bishop, D. Repeated-sprint ability—part I: Factors contributing to fatigue. Sports Med. 2011, 41, 673–694. [Google Scholar] [CrossRef]
- Macgregor, L.J.; Hunter, A.M.; Orizio, C.; Fairweather, M.M.; Ditroilo, M. Assessment of Skeletal Muscle Contractile Properties by Radial Displacement: The Case for Tensiomyography. Sport. Med. 2018, 48, 1607–1620. [Google Scholar] [CrossRef] [Green Version]
- Sánchez-Sánchez, J.; Bishop, D.; García-Unanue, J.; Ubago-Guisado, E.; Hernando, E.; López-Fernández, J.; Colino, E.; Gallardo, L. Effect of a Repeated Sprint Ability test on the muscle contractile properties in elite futsal players. Sci. Rep. 2018, 8, 1–8. [Google Scholar] [CrossRef]
- Križaj, D.; Šimunič, B.; Žagar, T. Short-term repeatability of parameters extracted from radial displacement of muscle belly. J. Electromyogr. Kinesiol. 2008, 18, 645–651. [Google Scholar] [CrossRef]
- Sánchez-Sánchez, J.; García-Unanue, J.; Hernando, E.; López-Fernández, J.; Colino, E.; León-Jiménez, M.; Gallardo, L. Repeated sprint ability and muscular responses according to the age category in elite youth soccer players. Front. Physiol. 2019, 10, 1–8. [Google Scholar] [CrossRef] [PubMed] [Green Version]
- Morin, J.-B.; Gimenez, P.; Edouard, P.; Arnal, P.; Jiménez-Reyes, P.; Samozino, P.; Brughelli, M.; Mendiguchia, J. Sprint Acceleration Mechanics: The Major Role of Hamstrings in Horizontal Force Production. Front. Physiol. 2015, 6, 404. [Google Scholar] [CrossRef]
- Jönhagen, S.; Nemeth, G.; Eriksson, E. Hamstring Injuries in Sprinters: The Role of Concentric and Eccentric Hamstring Muscle Strength and Flexibility. Am. J. Sports Med. 1994, 22, 262–266. [Google Scholar] [CrossRef]
- Baird, M.F.; Graham, S.M.; Baker, J.S.; Bickerstaff, G.F. Creatine-kinase- and exercise-related muscle damage implications for muscle performance and recovery. J. Nutr. Metab. 2012, 960363. [Google Scholar] [CrossRef] [PubMed] [Green Version]
- Hunter, A.M.; Galloway, S.D.; Smith, I.J.; Tallent, J.; Ditroilo, M.; Fairweather, M.M.; Howatson, G. Assessment of eccentric exercise-induced muscle damage of the elbow flexors by tensiomyography. J. Electromyogr. Kinesiol. 2012, 22, 334–341. [Google Scholar] [CrossRef] [PubMed]
- Harmsen, J.F.; Franz, A.; Mayer, C.; Zilkens, C.; Buhren, B.A.; Schrumpf, H.; Krauspe, R.; Behringer, M. Tensiomyography parameters and serum biomarkers after eccentric exercise of the elbow flexors. Eur. J. Appl. Physiol. 2019, 119, 455–464. [Google Scholar] [CrossRef]
- de Paula Simola, R.Á.; Harms, N.; Raeder, C.; Kellmann, M.; Meyer, T.; Pfeiffer, M.; Ferrauti, A.; Montella, A.; Imbriani, L.L. Assessment of neuromuscular function after different strength training protocols using tensiomyography. J. Strength Cond. Res. 2015, 29, 1339–1348. [Google Scholar] [CrossRef] [PubMed]


| Intensity | 20 mA | 40 mA | 60 mA | 80 mA | 100 mA | Dm-Max mA | Amplitude Effect | |
|---|---|---|---|---|---|---|---|---|
| p-Value | η2p | |||||||
| Contraction Time (ms) | ||||||||
| Biceps Femoris | ||||||||
| Pre | 29.1 ± 13.6 ef | 31.6 ± 10.3 | 33.1 ± 11.7 | 36.5 ± 11.9 | 40.1 ± 13.6 a | 40.5 ± 13.5 a | <0.001 | 0.16 |
| Post | 37.08 ± 12.8 f | 31.3 ± 14.8 f | 35.4 ± 12.2 f | 37.0 ± 12.6 f | 41.7± 14.2 | 44.1 ± 13.5 abcd | <0.001 | 0.14 |
| +24 h | 38.3 ± 15.5 | 30.2 ± 15.6 | 34.3 ± 12.0 f | 35.7 ± 15.0 | 40.2 ± 16.2 | 43.3 ± 16.7 c | 0.003 | 0.12 |
| +48 h | 35.9 ± 13.6 | 31.5 ± 16.2 | 33.0 ± 11.9 | 34.2 ± 13.2 | 37.1 ± 16.2 | 39.6 ± 16.3 | 0.119 | 0.05 |
| Rectus Femoris | ||||||||
| Pre | 34.1 ± 9.6 * | 29.5 ± 6.2 adef | 27.7 ± 5.8 a | 27.0 ± 4.3 abf | 26.3 ± 4.3 abd | 27.3 ± 5.1 ab | <0.001 | 0.35 |
| Post | 36.1 ± 13.5 ef | 34.6 ± 8.5 def | 31.9 ± 5.7 de | 28.2 ± 6.4 bdf | 27.6 ± 3.9 abc | 26.9 ± 3.8 abc | <0.001 | 0.23 |
| +24 h | 35.6 ± 14.3 | 34.5 ± 9.5 def | 30.8 ± 6.3 ef | 29.1 ± 5.1 bef | 28.1 ± 4.5 bcdf | 27.4 ± 4.4 bcde | 0.002 | 0.18 |
| +48 h | 32.1 ± 11.4 | 34.3 ± 9.8 def | 31.1 ± 7.0 def | 28.5 ± 6.0 bc | 27.6 ± 4.6 bc | 27.0 ± 4.2 bc | 0.006 | 0.14 |
| Muscle Displacement (mm) | ||||||||
| Biceps Femoris | ||||||||
| Pre | 1.2 ± 1.3 * | 3.7 ± 1.7 * | 5.2 ± 2.1 * | 6.7 ± 2.7 * | 8.1 ± 2.7 abcd | 8.1 ± 2.7 abcd | <0.001 | 0.82 |
| Post | 7.5 ± 3.8 bc | 1.4 ± 1.4 * | 3.9 ± 1.5 * | 5.3 ± 2.0 bcef | 6.9 ± 2.7 bcdf | 8.1 ± 2.8 bcde | <0.001 | 0.60 |
| +24 h | 7.1 ± 3.9 bcd | 1.3 ± 1.3 * | 3.2 ± 1.5 * | 4.4 ± 1.9 * | 5.7 ± 2.5 bcdf | 6.7 ± 2.9 bcde | <0.001 | 0.52 |
| +48 h | 7.6 ± 4.2 bc | 1.6 ± 1.8 * | 4.1 ± 2.4 * | 5.3 ± 2.8 bcef | 6.4 ± 2.3 bcd | 7.0 ± 3.4 bcd | 0.001 | 0.49 |
| Rectus Femoris | ||||||||
| Pre | 3.3 ± 2.1 * | 7.4 ± 3.0 * | 8.6 ± 2.8 * | 9.2 ± 2.9 * | 9.7 ± 3.1 abcd | 10.1 ± 3.0 abcd | <0.001 | 0.80 |
| Post | 7.9 ± 3.6 b | 4.3 ± 2.7 * | 7.9 ± 2.8 bdef | 8.7 ± 2.7 bcef | 9.1 ± 2.6 bcd | 9.5 ± 2.7 bcd | <0.001 | 0.44 |
| +24 h | 7.5 ± 3.9 b | 4.0 ± 2.8 * | 7.7 ± 3.0 bdef | 8.6 ± 2.9 bcef | 9.1 ± 2.9 bcdf | 9.5 ± 3.0 bcde | <0.001 | 0.43 |
| +48 h | 7.0 ± 3.9 b | 3.9 ± 2.7 * | 2.2 ± 3.0 * | 8.0 ± 2.9 bcef | 8.6 ± 2.9 bcd | 9.2 ± 2.9 bcd | <0.001 | 0.42 |
Publisher’s Note: MDPI stays neutral with regard to jurisdictional claims in published maps and institutional affiliations. |
© 2021 by the authors. Licensee MDPI, Basel, Switzerland. This article is an open access article distributed under the terms and conditions of the Creative Commons Attribution (CC BY) license (https://creativecommons.org/licenses/by/4.0/).
Share and Cite
Muñoz-López, A.; de Hoyo, M.; Sañudo, B. Muscle Contractile Properties Measured at Submaximal Electrical Amplitudes and Not at Supramaximal Amplitudes Are Associated with Repeated Sprint Performance and Fatigue Markers. Int. J. Environ. Res. Public Health 2021, 18, 11689. https://0-doi-org.brum.beds.ac.uk/10.3390/ijerph182111689
Muñoz-López A, de Hoyo M, Sañudo B. Muscle Contractile Properties Measured at Submaximal Electrical Amplitudes and Not at Supramaximal Amplitudes Are Associated with Repeated Sprint Performance and Fatigue Markers. International Journal of Environmental Research and Public Health. 2021; 18(21):11689. https://0-doi-org.brum.beds.ac.uk/10.3390/ijerph182111689
Chicago/Turabian StyleMuñoz-López, Alejandro, Moisés de Hoyo, and Borja Sañudo. 2021. "Muscle Contractile Properties Measured at Submaximal Electrical Amplitudes and Not at Supramaximal Amplitudes Are Associated with Repeated Sprint Performance and Fatigue Markers" International Journal of Environmental Research and Public Health 18, no. 21: 11689. https://0-doi-org.brum.beds.ac.uk/10.3390/ijerph182111689