
Kitchen Diet vs. Industrial Diets—Impact on Intestinal Barrier Parameters among Stroke Patients

 , , ,
, , ,
Abstract
:1. Introduction
2. Methods
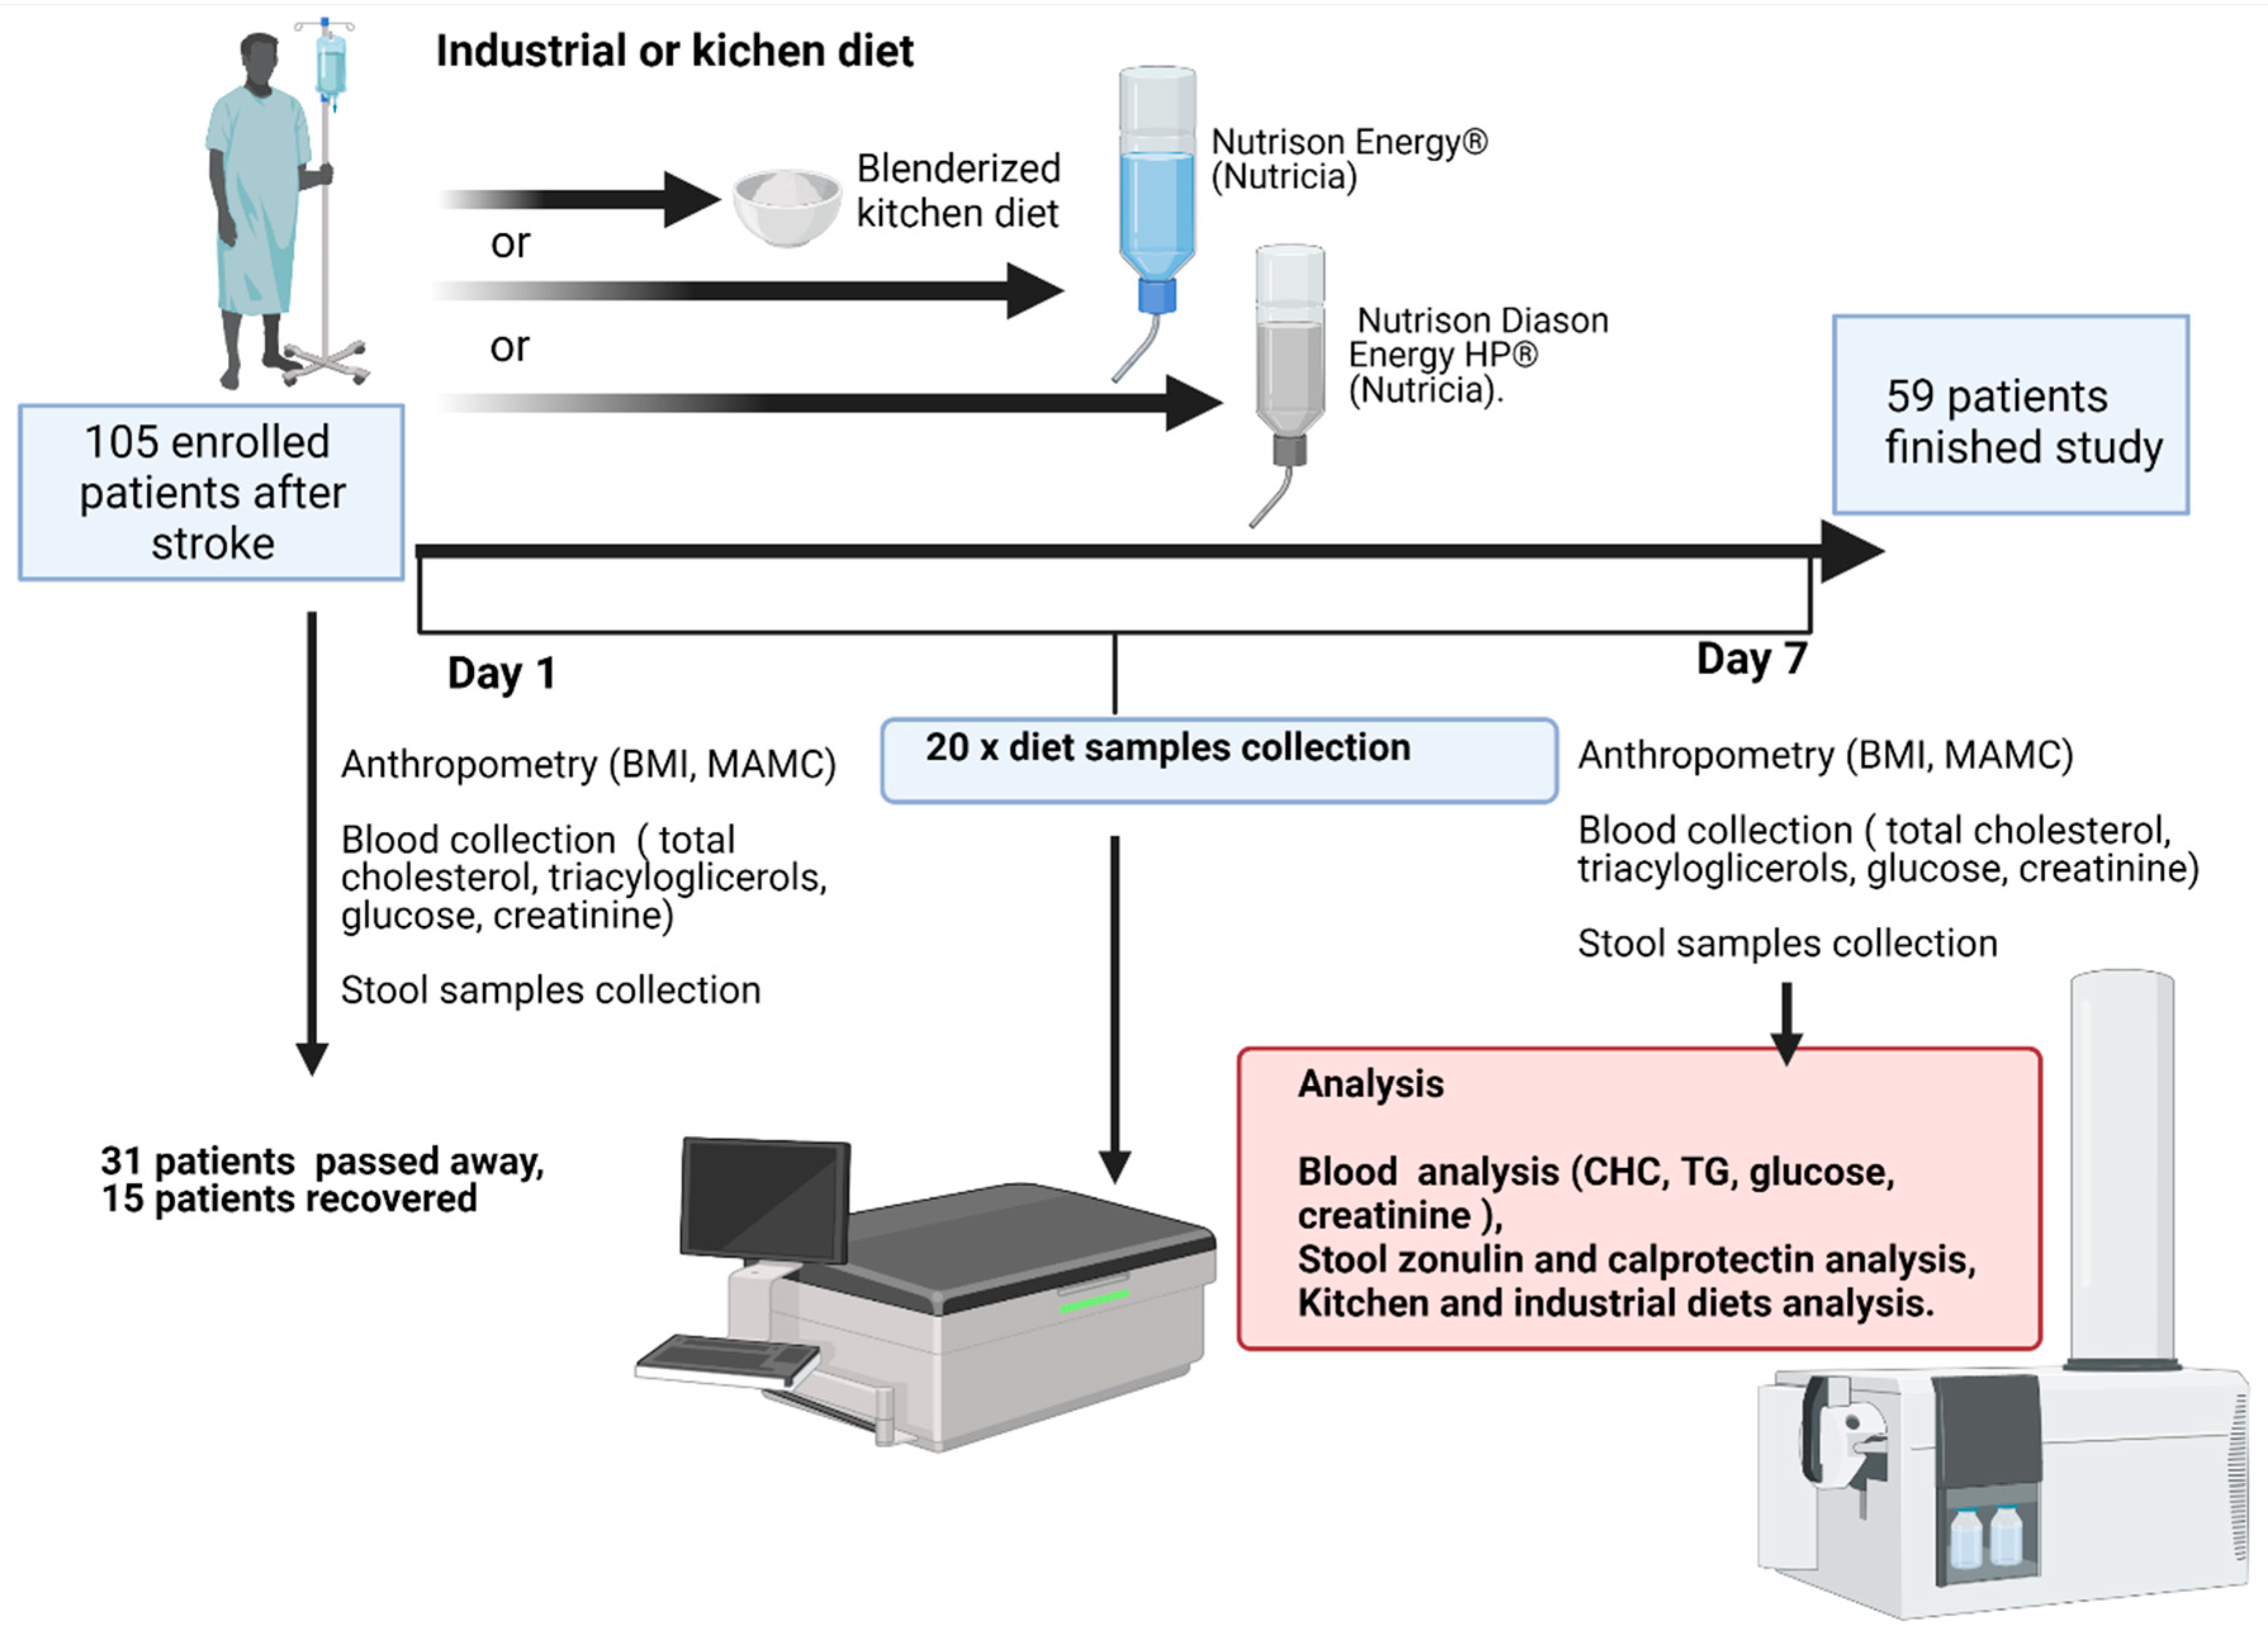
2.1. Patients
2.2. Types of Nutritional Support
2.3. Blood Biochemistry
2.4. Isolation and Measurement of SCFAs by Gas Chromatography, and ELISA Analysis
2.5. Diet Analysis
2.6. Statistical Analysis
3. Results
3.1. Fiber and Protein Content
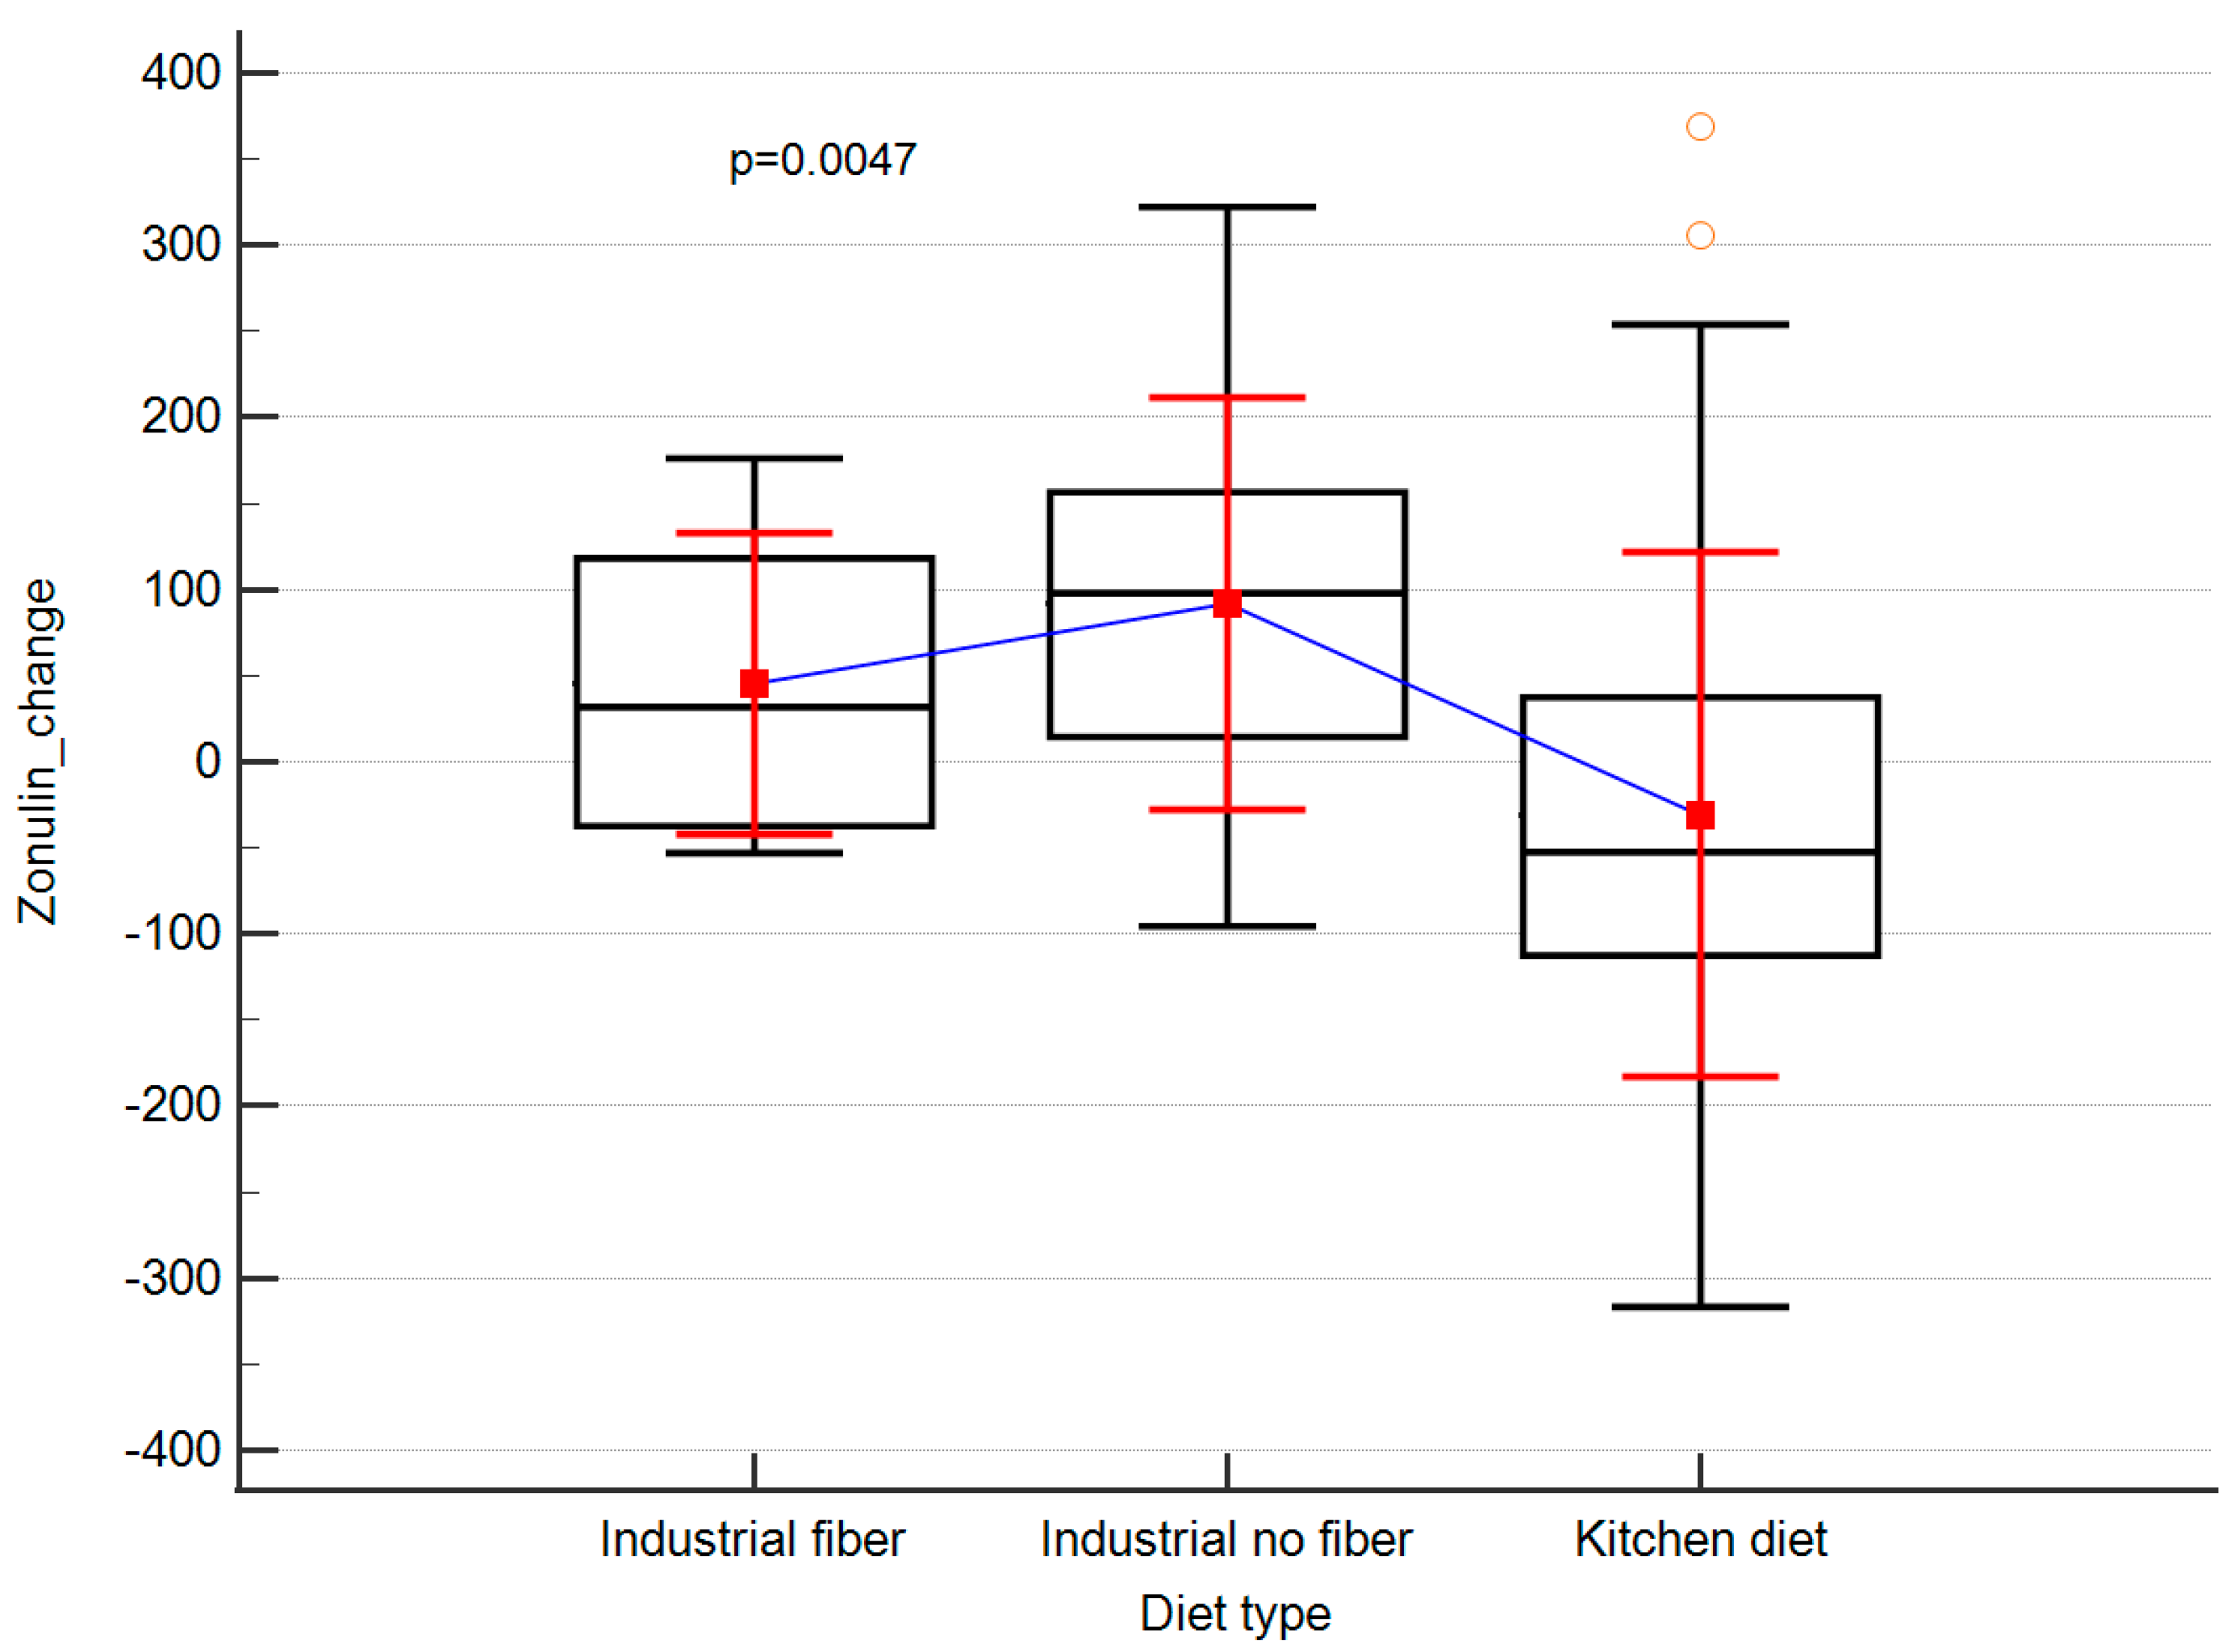
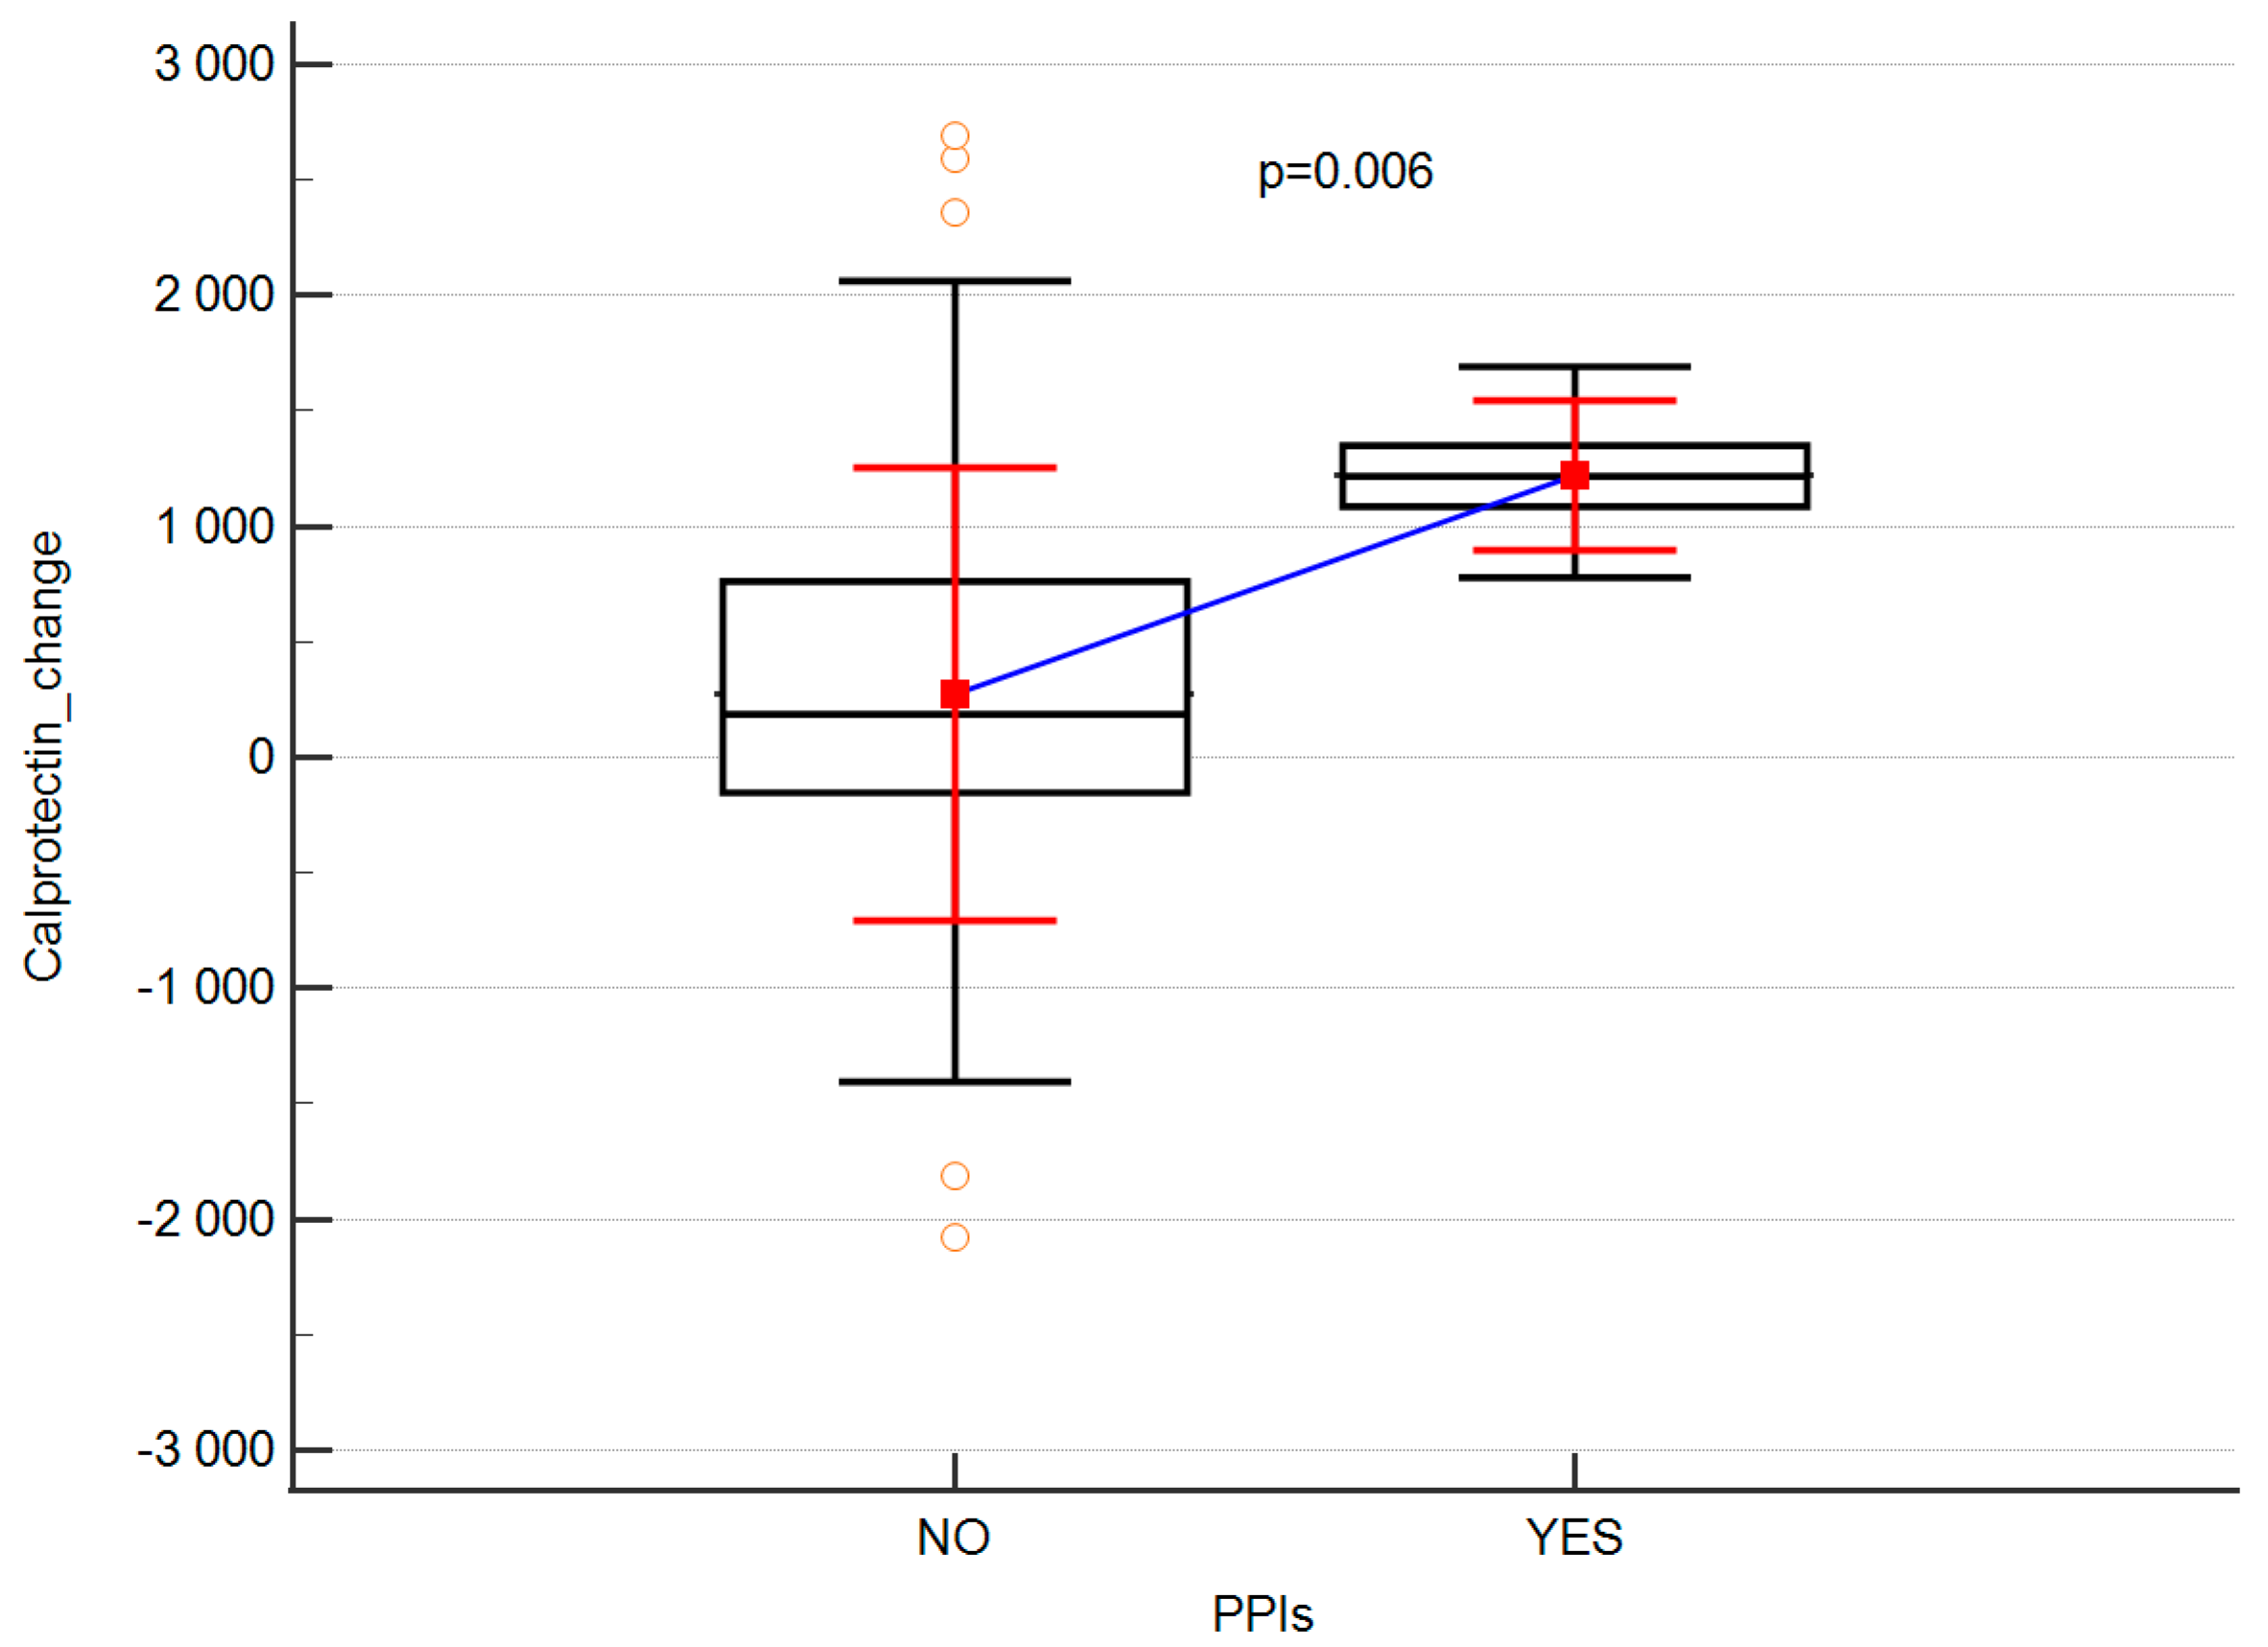
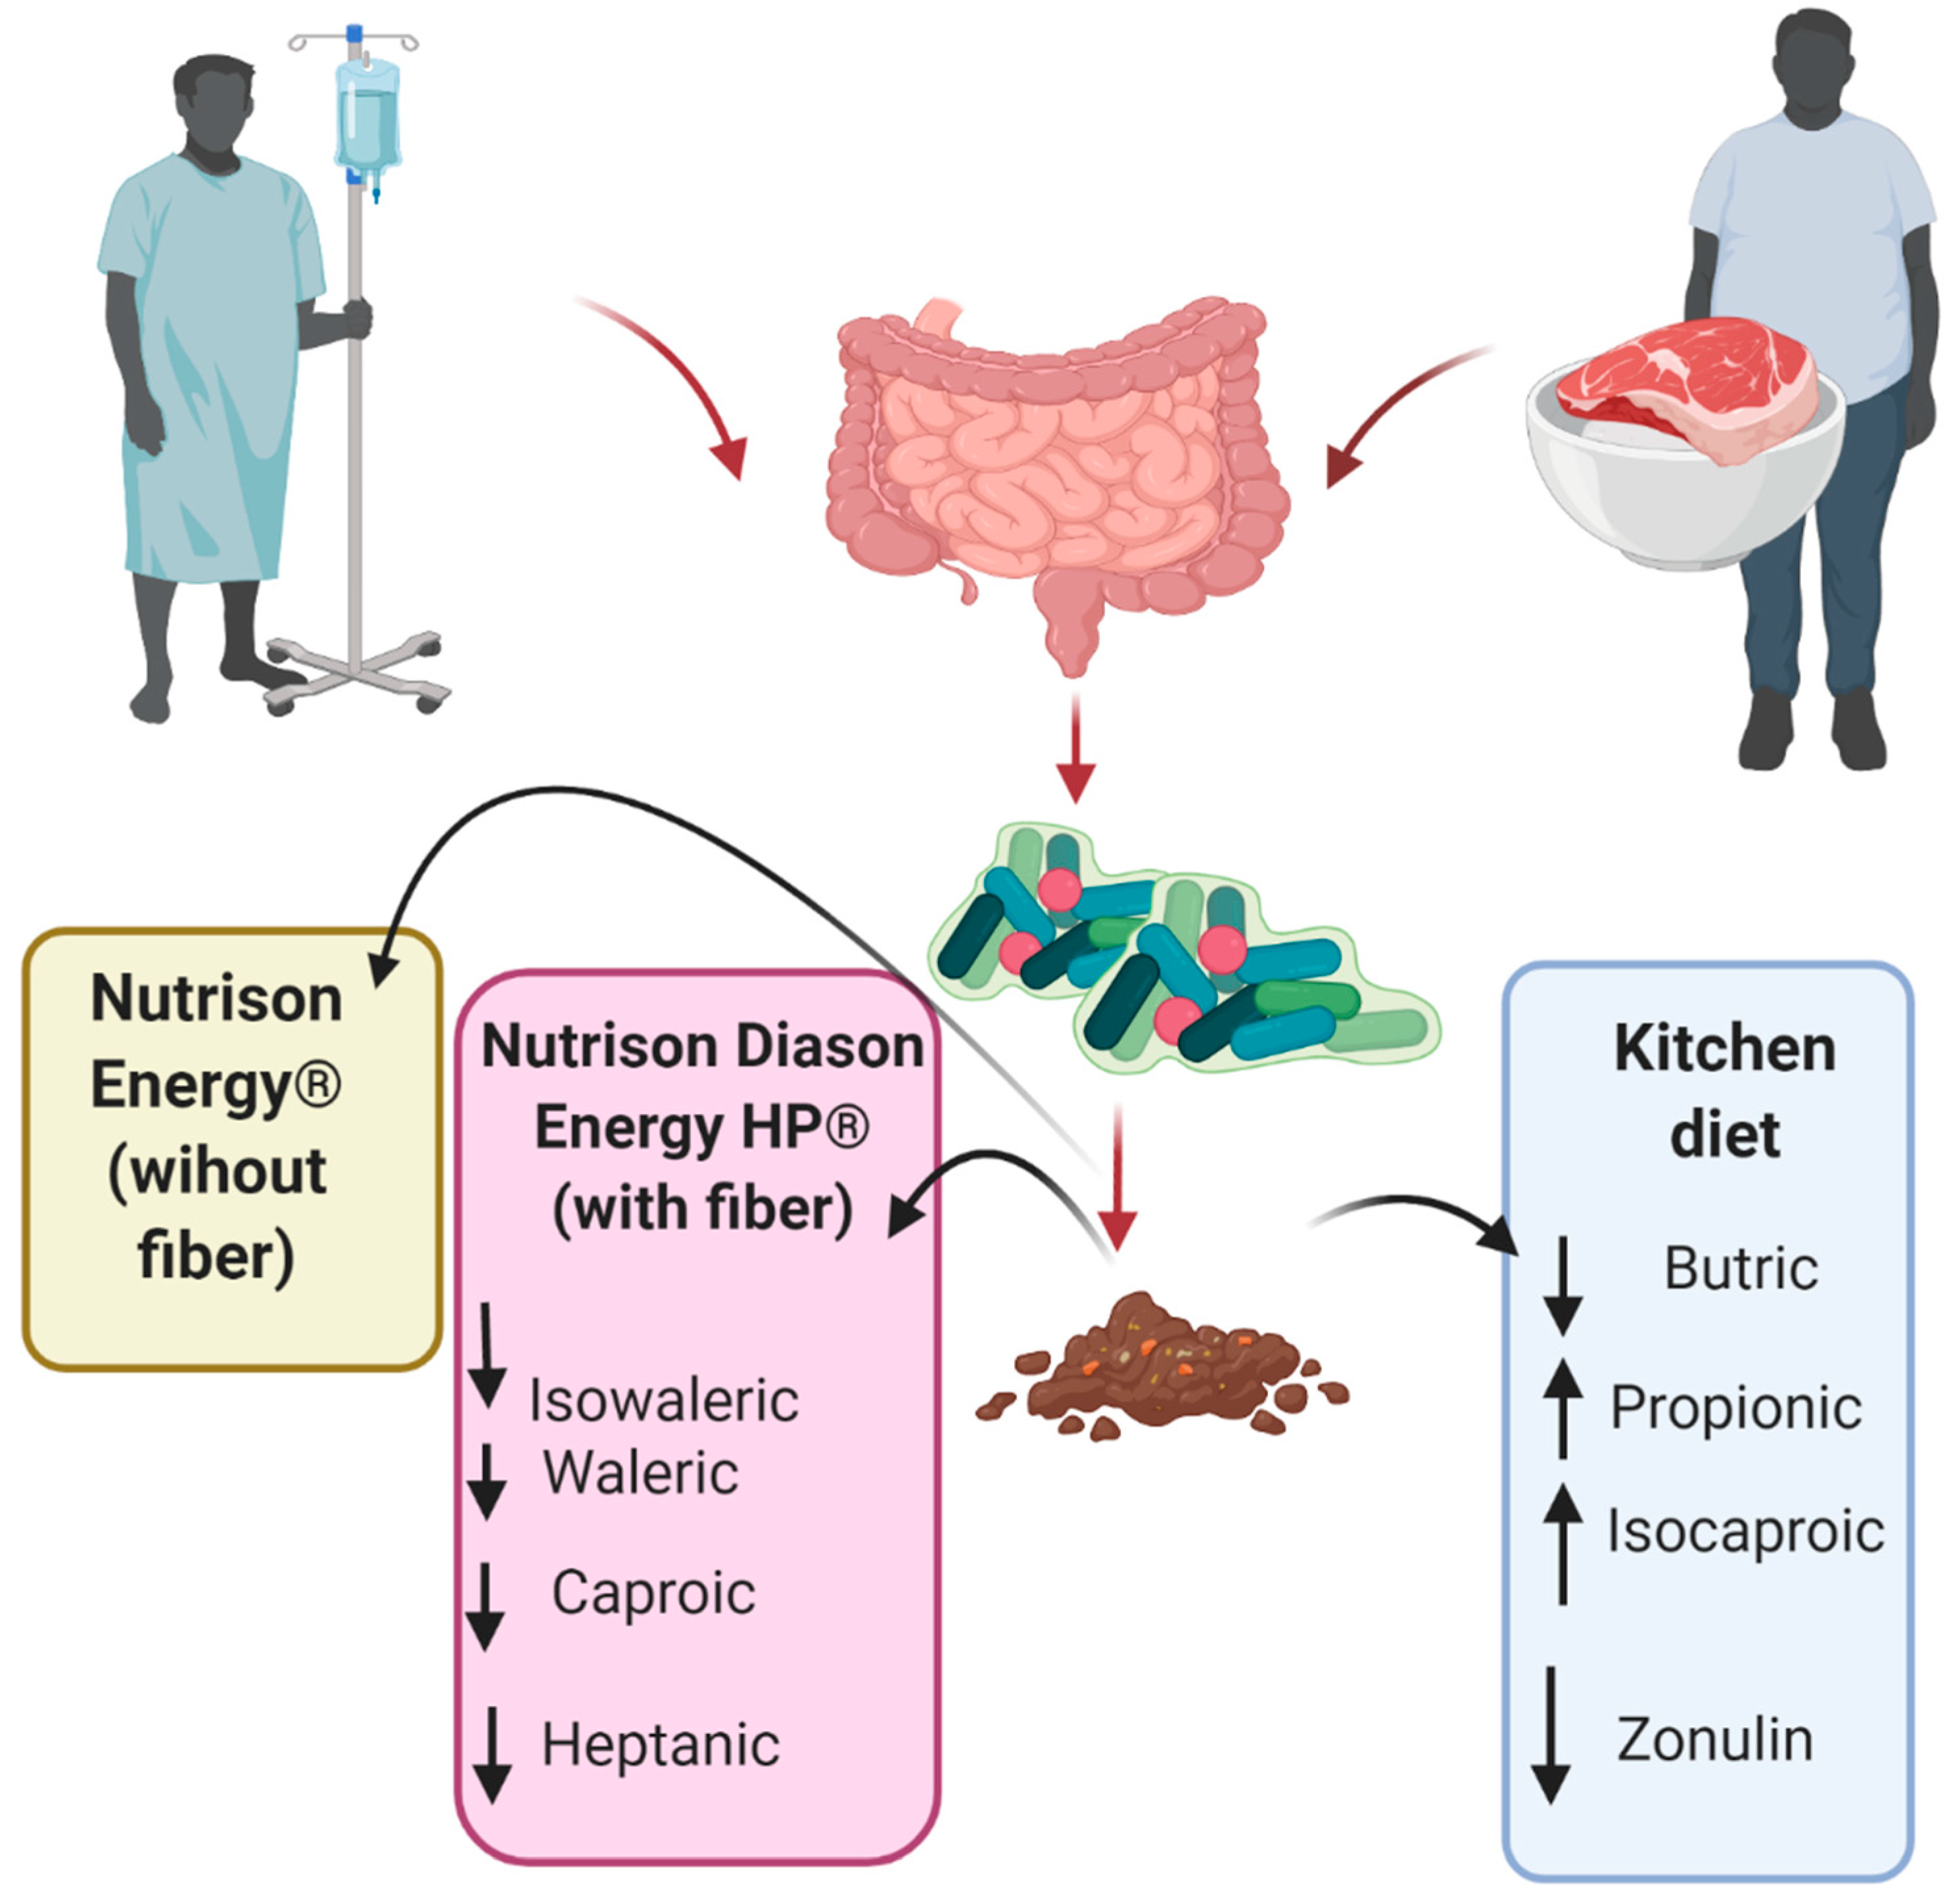
3.2. The Influence of Diet on Anthropometric, Biochemical and Gut Barrier Parameters
4. Discussion
5. Conclusions
Author Contributions
Funding
Institutional Review Board Statement
Informed Consent Statement
Conflicts of Interest
References
- Węgrzyn, D.; Adamek, K.; Łoniewska, B. Budowa bariery jelitowej. Pomeranian J. Life Sci. 2017, 63, 6–9. [Google Scholar] [CrossRef] [Green Version]
- Bischoff, S.C.; Barbara, G.; Buurman, W.; Ockhuizen, T.; Schulzke, J.-D.; Serino, M.; Tilg, H.; Watson, A.; Wells, J.M. Intestinal permeability—A new target for disease prevention and therapy. BMC Gastroenterol. 2014, 14, 189. [Google Scholar] [CrossRef] [PubMed] [Green Version]
- Kim, J.H.; Heo, J.S.; Baek, K.S.; Kim, S.-Y.; Kim, J.H.; Baek, K.-H.; Kim, E.K.; Sheen, Y.H. Zonulin level, a marker of intestinal permeability, is increased in association with liver enzymes in young adolescents. Clin. Chim. Acta 2018, 481, 218–224. [Google Scholar] [CrossRef] [PubMed]
- Fukunaga, S.; Kuwaki, K.; Mitsuyama, K.; Takedatsu, H.; Yoshioka, S.; Yamasaki, H.; Yamauchi, R.; Mori, A.; Kakuma, T.; Tsuruta, O.; et al. Detection of calprotectin in inflammatory bowel disease: Fecal and serum levels and immunohistochemical localization. Int. J. Mol. Med. 2017, 41, 107–118. [Google Scholar] [CrossRef] [PubMed] [Green Version]
- Ferrara, F.; Zeisig; Pietsch, S.; Rutten, R.; Dreyer, A.; Pieper Schazl, A.; McLeod, D.; Barthel, H.; Boltze, J.; Schrodl, W.; et al. Hypothesis and theory: A pathophysiological concept of stroke-induces acute phase response and increased intestinal permeablity leading to secondary brain damage. Front. Neurosci. 2020, 14, 272. [Google Scholar] [CrossRef]
- Cederholm, T.; Bosaeus, I.; Barazzoni, R.; Bauer, J.; van Gossum, A.; Klek, S.; Muscaritolig, M.; Nyulasih, I.; Ockengai, J.; Schneider, S.M.; et al. Diagnostic criteria for malnutrition—An ESPEN Consensus Statement. Clin. Nutr. Edinb. Scotl. 2015, 34, 335–340. [Google Scholar] [CrossRef]
- den Besten, G.; van Eunen, K.; Groen, A.K.; Venema, K.; Reijngoud, D.-J.; Bakker, B.M. The role of short-chain fatty acids in the interplay between diet, gut microbiota, and host energy metabolism. J. Lipid Res. 2013, 54, 2325–2340. [Google Scholar] [CrossRef] [Green Version]
- Gill, P.A.; van Zelm, M.C.; Muir, J.G.; Gibson, P.R. Review article: Short chain fatty acids as potential therapeutic agents in human gastrointestinal and inflammatory disorders. Aliment. Pharmacol. Ther. 2018, 48, 15–34. [Google Scholar] [CrossRef] [Green Version]
- Ashaolu, T.J.; Saibandith, B.; Yupanqui, C.T.; Wichienchot, S. Human colonic microbiota modulation and branched chain fatty acids production affected by soy protein hydrolysate. Int. J. Food Sci. Technol. 2019, 54, 141–148. [Google Scholar] [CrossRef] [Green Version]
- Ajamian, M.; Steer, D.; Rosella, G.; Gibson, P.R. Serum zonulin as a marker of intestinal mucosal barrier function: May not be what it seems. PLoS ONE 2019, 14, e0210728. [Google Scholar] [CrossRef]
- Chumlea, A.C.; Guo, S. Equations for Predicting Stature in White and Black Elderly Individuals. J. Gerontol. 1992, 47, 197–203. [Google Scholar] [CrossRef] [PubMed]
- Chumlea, W.C.; Guo, S.; Roche, A.F.; Steinbaugh, M.L. Prediction of body weight for the nonambulatory elderly from anthropometry. J. Am. Diet. Assoc. 1988, 88, 564–568. [Google Scholar] [CrossRef]
- Baur, F.J.; Ensminger, L.G. The Association of Official Analytical Chemists (AOAC). J. Am. Oil Chem. Soc. 1977, 54, 171–172. [Google Scholar] [CrossRef]
- AOAC. Official Methods of Analysis, 18th ed.; Association of Official Analytical Chemists: Washington, DC, USA, 2006. [Google Scholar]
- von Soxhlet, F.R. Die gewichtsanalytische Bestimmung des Milchfettes. Polytech. J. 1879, 1879, 461–465. [Google Scholar]
- Megazyme. Total Dietary Fibre. Assay Procedure; Megazyme International: Wicklow, Ireland, 2012. [Google Scholar]
- Machado de Sousa, L.R.; Rodrigues Ferreira, S.M.; Madalozzo Schieferdecker, M.E. Physicochemical and nutritional characteristics of handmade enteral diets. Nutr. Hosp. 2014, 29, 568–574. [Google Scholar] [PubMed]
- Cirqueira, A.N.; Poltronieri, F.; Caramico, D.C.O.; Frangella, V.S. Estudo bromatológico de fórmulas artesanais e proposta de protocolo ambulatorial de assistência nutricional enteral Bromatologic study of artisanal formulae and a proposal of ambulatory protocol of nutritional enteral care Una propuesta de protocolo ambulatorial del cuidado enteral alimenticio. Mundo Saúde São Paulo 2009, 33, 467–479. [Google Scholar]
- Filho, E.; Aqino, J.; Donato, N.; Sousa, P.; Silva, J. Monitoramento fisco quimico e microbiologia de dietas enterais em unidade hospital publica da regalia nordeste do Brasil. Aliment. Nutr. 2008, 19, 145–151. [Google Scholar]
- Santos VF, N.D.; Bottoni, A.; Morais, T.B. Nutritional and microbiological quality of standardized homemade enteral diets for patients in home nutritional therapy. Rev. Nutr. 2013, 26, 205–214. [Google Scholar]
- Cupisti, A.; Comar, F.; Benini, O.; Lupetti, S.; D’Alessandro, C.; Barsotti, G.; Gianfaldoni, D. Effect of Boiling on Dietary Phosphate and Nitrogen Intake. J. Ren. Nutr. Off. J. Counc. Ren. Nutr. Natl. Kidney Found. 2006, 16, 36–40. [Google Scholar] [CrossRef]
- Wennberg, M.S.; Engqvist, G.M.; Nyman, E.M.G.-L. Effects of Boiling on Dietary Fiber Components in Fresh and Stored White Cabbage (Brassica oleracea var. capitata). J. Food Sci. 2003, 68, 1615–1621. [Google Scholar] [CrossRef]
- Vieira, M.M.C.; Santos, V.F.N.; Bottoni, A.; Morais, T.B. Nutritional and microbiological quality of commercial and homemade blenderized whole food enteral diets for home-based enteral nutritional therapy in adults. Clin. Nutr. Edinb. Scotl. 2018, 37, 177–181. [Google Scholar] [CrossRef] [PubMed]
- Gallagher, K.; Flint, A.; Mouzaki, M.; Carpenter, A.; Haliburton, B.; Bannister, L.; Norgrove, H.; Hoffman, L.; Mack, D.; Stintzi, A.; et al. Blenderized Enteral Nutrition Diet Study: Feasibility, Clinical, and Microbiome Outcomes of Providing Blenderized Feeds Through a Gastric Tube in a Medically Complex Pediatric Population. JPEN J. Parenter. Enteral. Nutr. 2018, 42, 1046–1060. [Google Scholar] [CrossRef] [PubMed]
- Paddon-Jones, D.; Rasmussen, B.B. Dietary protein recommendations and the prevention of sarcopenia. Curr. Opin. Clin. Nutr. Metab. Care 2009, 12, 86–90. [Google Scholar] [CrossRef] [PubMed] [Green Version]
- Lasek-Bal, A.; Kokot, A.; dr Carrillo, D.; Student, S.; Pawletko, K.; Krzan, A.; Puz, P.; Bal, W.; Jędrzejowska-Szypułka, H. Plasma levels of occludin and claudin-5 in acute stroke are correlated with the type and location of stroke but not with the neurological state of patients-preliminary data. Brain Sci. 2020, 10, 831. [Google Scholar] [CrossRef]
- Chen, Y.; Liang, J.; Ouyang, F.; Chen, X.; Lu, T.; Jiang, Z.; Li, J.; Li, Y.; Zeng, J. Persistence of Gut Microbiota Dysbiosis and Chronic Systemic Inflammation After Cerebral Infarction in Cynomolgus Monkeys. Front. Neurol. 2019, 10, 661. [Google Scholar] [CrossRef] [Green Version]
- Krawczyk, M.; Maciejewska, D.; Ryterska, K.; Czerwińka-Rogowska, M.; Jamioł-Milc, D.; Skonieczna-Żydecka, K.; Milkiewicz, P.; Raszeja-Wyszomirska, J.; Stachowska, E. Gut Permeability Might be Improved by Dietary Fiber in Individuals with Nonalcoholic Fatty Liver Disease (NAFLD) Undergoing Weight Reduction. Nutrients 2018, 10, 1793. [Google Scholar] [CrossRef] [Green Version]
- Jeffery, I.B.; O’Toole, P.W. Diet-microbiota interactions and their implications for healthy living. Nutrients 2013, 5, 234–252. [Google Scholar] [CrossRef]
- Li, J.; Zhao, F.; Wang, Y.; Chen, J.; Tao, J.; Tian, G.; Wu, S.; Liu, W.; Cui, Q.; Geng, B.; et al. Gut microbiota dysbiosis contributes to the development of hypertension. Microbiome 2017, 5, 14. [Google Scholar] [CrossRef] [Green Version]
- Qin, J.; Li, Y.; Cai, Z. A metagenome-wide association study of gut microbiota in type 2 diabetes. Nature 2012, 490, 55–60. [Google Scholar] [CrossRef]
- Ley, R.E.; Turnbaugh, P.J.; Klein, S.; Gordon, J.I. Microbial ecology: Human gut microbes associated with obesity. Nature 2006, 444, 1022–1023. [Google Scholar] [CrossRef]
- Lundgren, D.; Eklöf, V.; Palmqvist, R.; Hultdin, J.; Karling, P. Proton pump inhibitor use is associated with elevated faecal calprotectin levels. A cross-sectional study on subjects referred for colonoscopy. Scand. J. Gastroenterol. 2019, 54, 152–157. [Google Scholar] [CrossRef] [PubMed] [Green Version]
- Castellani, C.; Singer, G.; Kashofer, K.; Huber-Zeyringer, A.; Flucher, C.; Kaiser, M.; Till, H. The Influence of Proton Pump Inhibitors on the Fecal Microbiome of Infants with Gastroesophageal Reflux—A Prospective Longitudinal Interventional Study. Front. Cell. Infect. Microbiol. 2017, 7, 444. [Google Scholar] [CrossRef] [PubMed]
- Jackson, M.A.; Goodrich, J.K.; Maxan, M.-E.; Freedberg, D.E.; Abrams, J.A.; Poole, A.C.; Sutter, J.L.; Welter, D.; Ley, R.E.; Bell, J.T.; et al. Proton pump inhibitors alter the composition of the gut microbiota. Gut 2016, 65, 749–756. [Google Scholar] [CrossRef] [PubMed] [Green Version]
- Minalyan, A.; Gabrielyan, L.; Scott, D.; Jacobs, J.; Pisegna, J.R. The Gastric and Intestinal Microbiome: Role of Proton Pump Inhibitors. Curr. Gastroenterol. Rep. 2017, 19, 42. [Google Scholar] [CrossRef] [Green Version]
- Lewis, G.; Wang, B.; Shafiei Jahani, P.; Hurrell, B.P.; Banie, H.; Aleman Muench, G.R.; Maazi, H.; Howard, E.; Galle-Treger, L.; Lo, R.; et al. Dietary Fiber-Induced Microbial Short Chain Fatty Acids Suppress ILC2-Dependent Airway Inflammation. Front. Immunol. 2019, 10, 2051. [Google Scholar] [CrossRef] [Green Version]
- Schneider, S.M.; Girard-Pipau, F.; Anty, R.; van der Linde, E.G.M.; Philipsen-Geerling, B.J.; Knol, J.; Filippi, J.; Arab, K.; Hébuterne, X. Effects of total enteral nutrition supplemented with a multi-fibre mix on faecal short-chain fatty acids and microbiota. Clin. Nutr. Edinb. Scotl. 2006, 25, 82–90. [Google Scholar] [CrossRef]
- Whelan, K.; Judd, P.A.; Tuohy, K.M.; Gibson, G.R.; Preedy, V.R.; Taylor, M.A. Fecal microbiota in patients receiving enteral feeding are highly variable and may be altered in those who develop diarrhea. Am. J. Clin. Nutr. 2009, 89, 240–247. [Google Scholar] [CrossRef]
- Gregori, D.; Fabiani, A.; Sanson, G.; Lorenzoni, G. Commercial vs. Natural Food-based Tube Feeding on Diarrhea Incidence in Critically Ill Cardiac Surgery Patients (P12-030-19). Curr. Dev. Nutr. 2019, 3, nzz035. [Google Scholar] [CrossRef] [Green Version]


| Blenderized Kitchen Diet | Nutrison Energy® | Nutrison Diason Energy® | p | |
|---|---|---|---|---|
| BMI (kg/m2) | 24.9 ± 24.9 | 24.6 ± 3.8 | 23.8 ± 3.8 | ns |
| Body mass | 64.7 ± 10.5 | 62.9 ± 12.0 | 63.1 ± 10.4 | ns |
| MAMC | 31.8 ± 4.5 | 29.7 ± 2.7 | 29.3 ± 2.9 | ns |
| Calf circumference (cm) | 34.4 ± 4.2 | 32.8 ± 3.7 | 33.4 ± 3.0 | ns |
| Total cholesterol (mg/dL) | 181 ± 49 | 160 ± 49 | 182 ± 53 | ns |
| Triglycerides (mg/dL) | 119 ± 63 | 130 ± 83 | 109 ± 37 | ns |
| Glucose (mg/dL) | 158 ± 49 | 131 ± 38 | 166 ± 43 | ns |
| Creatinine (mg/dL) | 0.9 ± 0.4 | 1.0 ± 0.3 | 1.0 ± 0.6 | ns |
| Lymphocytes (tys/µL) | 1.73 ± 0.78 | 1.5 ± 0.83 | 2.31 ± 1.5 | ns |
| Erythrocytes (mln/µL) | 4.67 ± 0.51 | 3.88 ± 0.88 | 4.96 ± 0.61 | ns |
| Haemoglobin (g/dL) | 13.95 ± 1.52 | 11.19 ± 2.51 | 14.18 ± 0.61 | ns |
| CRP (mg/L) | 31.23 ± 44.47 | 80.51 ± 68.05 | 58.27 ± 87.27 | ns |
| Dry Matter (%) | Protein (g) | Fat (g) | Total Fibre (g) | Ash | |
|---|---|---|---|---|---|
| Kitchen diet, content determined in 100 mL | 10.4% | 2.4 | 4.5 | 1.1 | 0.68 |
| Kitchen diet, content according to the software per 100 mL | No information | 4.2 | 4.4 | 2.4 | 0.9 |
| Nutrison Energy diet, content determined in 100mL | 29% | 5.4 | 5.2 | 0.02 | 0.92 |
| Nutrison Energy, content declared by the manufacturer per 100 mL | No information | 6.2 | 5.8 | <0.1 | No information on the packaging |
| Nutrison Diason Energy HP diet, content determined in 100 mL | 28.10% | 7.1 | 7.7 | 1.8 | 0.8 |
| Nutrison Diason Energy HP diet, declared by the manufacturer per 100 mL | No information | 7.7 | 7.7 | 1.5 | No information on the packaging |
| Kitchen Diet before | Kitchen Diet after | Nutrison Diason Energy HP before | Nutrison Diason Energy HP after | Nutrison Energy before | Nutrison Energy after | |
|---|---|---|---|---|---|---|
| MEAN ± SD | MEAN ± SD | MEAN ± SD | MEAN ± SD | MEAN ± SD | MEAN ± SD | |
| Lymphocytes [103/µL] | 1.73 ± 0.78 * | 1.33 ± 0.66 * | 2.31 ± 1.5 | 2.38 ± 1.8 | 1.5 ± 0.8 | 1.52 ± 0.48 |
| Erythrocytes [106/µL] | 4.67 ± 0.51 * | 4.27 ± 0.65 * | 4.96 ± 0.61 * | 4.3 ± 0.5 * | 3.88 ± 0.9 | 4.96 ± 0.6 |
| Haemoglobin [g/dL] | 13.95 ± 1.5 * | 12.8 ± 2.1 * | 14.18 ± 1.5 * | 12.3 ± 1.8 * | 11.2 ± 10.6 | 11.22 ± 2.7 |
| CRP [mg/L] | 31.2 − 2.7 * | 68.8 − 25.1 * | 58.3 ± 11.7 | 46.2 ± 30.5 | 80.51 ± 78.3 | 77.04 ± 55.4 |
| Body weight (kg) | 64.7 ± 10.5 * | 63.7 ± 9.9 * | 63.1 ± 10.4 | 62.9 ± 10.5 | 62.9 ± 12.0 | 62.5 ± 12.1 |
| BMI (kg/m2) | 24.9 ± 4.2 * | 24.5 ± 4.1 * | 23.8 ± 3.8 | 23.1 ± 3.8 | 24.6 ± 3.8 | 23.7 ± 3.3 |
| Calprotectin (ug/mL) | 814 ± 629 | 1225 ± 162 | 1163 ± 830 | 1398 ± 805 | 1042 ± 1053 | 1376 ± 688 |
| Zonulin (ng/mL) | 410.3 ± 168 * | 431.1 ± 137 * | 421 ± 138 | 477 ± 161 | 397 ± 165 | 482 ± 138 |
| Acetic acid (%) | 27.9 ± 12.4 | 29.2 ± 7.6 | 35.9 ± 5.2 | 36.4 ± 4.7 | 31.5 ± 8.5 | 37.0 ± 11.9 |
| Butyric acid (%) | 20.2 * ± 7.2 | 16.1 * ± 5.9 | 16.8 ± 3.8 | 16.0 ± 2.7 | 14.6 ± 5.3 | 12.3 ± 6.6 |
| Propionic acid (%) | 16.3 * ± 5.8 | 18.9 * ± 6.2 | 17.9 ± 3.8 | 19.9 ± 7.6 | 18.4 ± 5.0 | 18.3 ± 7.1 |
| Isobutyric acid (%) | 7.9 ± 5.1 | 8.6 ± 7.6 | 5.7 ± 1.0 | 5.7 ± 1.2 | 6.6 ± 1.5 | 6.7 ± 2.0 |
| Isovaleric acid (%) | 15.0 ± 3.7 | 14.4 ± 3.3 | 12.4 * ± 2.3 | 12.8 * ± 29 | 13.8 ± 3.6 | 15.3 ± 4.4 |
| Valeric acid (%) | 7.7 ± 2.2 | 7.4 ± 2.1 | 7.2 * ± 0.8 | 6.7 * ± 1.4 | 7.3 ± 2.5 | 6.0 ± 2.2 |
| Isocaproic acid (%) | 1.2 * ± 27 | 1.7 * ± 1.5 | 1.5 ± 0.5 | 1.0 ± 0.4 | 2.6 ± 2.4 | 1.7 ± 2.2 |
| Caproic acid (%) | 2.5 ± 2.7 | 2.1 ± 1.7 | 1.6 * ± 0.7 | 0.8 * ± 0.3 | 2.7 ± 2.4 | 1.4 ± 2.0 |
| Heptanoic acid (%) | 1.3 ± 2.9 | 1.6 ± 1.8 | 1.1 * ± 0.6 | 0.7 * ± 0.4 | 2.53 ± 2.6 | 1.3 ± 2.2 |
| SS | Degrees of Freedom | MS | F | p | |
|---|---|---|---|---|---|
| Caloric intake | 451,086 | 1 | 451,086 | 0.93634 | 0.338071 |
| Type of diet | 1,228,154 | 2 | 614,077 | 1.27467 | 0.288814 |
| Antibiotics | 127,430 | 1 | 127,430 | 0.26451 | 0.609397 |
| Probiotics | 49,523 | 1 | 49,523 | 0.1028 | 0.749889 |
| PPI | 2,819,281 | 1 | 2,819,281 | 5.85211 | 0.019398 |
Publisher’s Note: MDPI stays neutral with regard to jurisdictional claims in published maps and institutional affiliations. |
© 2022 by the authors. Licensee MDPI, Basel, Switzerland. This article is an open access article distributed under the terms and conditions of the Creative Commons Attribution (CC BY) license (https://creativecommons.org/licenses/by/4.0/).
Share and Cite
Czerwińska-Rogowska, M.; Skonieczna-Żydecka, K.; Kaseja, K.; Jakubczyk, K.; Palma, J.; Bott-Olejnik, M.; Brzozowski, S.; Stachowska, E. Kitchen Diet vs. Industrial Diets—Impact on Intestinal Barrier Parameters among Stroke Patients. Int. J. Environ. Res. Public Health 2022, 19, 6168. https://0-doi-org.brum.beds.ac.uk/10.3390/ijerph19106168
Czerwińska-Rogowska M, Skonieczna-Żydecka K, Kaseja K, Jakubczyk K, Palma J, Bott-Olejnik M, Brzozowski S, Stachowska E. Kitchen Diet vs. Industrial Diets—Impact on Intestinal Barrier Parameters among Stroke Patients. International Journal of Environmental Research and Public Health. 2022; 19(10):6168. https://0-doi-org.brum.beds.ac.uk/10.3390/ijerph19106168
Chicago/Turabian StyleCzerwińska-Rogowska, Maja, Karolina Skonieczna-Żydecka, Krzysztof Kaseja, Karolina Jakubczyk, Joanna Palma, Marta Bott-Olejnik, Sławomir Brzozowski, and Ewa Stachowska. 2022. "Kitchen Diet vs. Industrial Diets—Impact on Intestinal Barrier Parameters among Stroke Patients" International Journal of Environmental Research and Public Health 19, no. 10: 6168. https://0-doi-org.brum.beds.ac.uk/10.3390/ijerph19106168