Article

Modification Effect of PARP4 and ERCC1 Gene Polymorphisms on the Relationship between Particulate Matter Exposure and Fasting Glucose Level

1
Department of Integrative Bioscience & Biotechnology, Sejong University, 209 Neungdong-ro, Gwangjin-gu, Seoul 05006, Korea
2
Department of Preventive Medicine, College of Medicine, Dong-A University, 32 Daesingongwon-ro, Seo-gu, Busan 49201, Korea
3
Department of Preventive Medicine, Seoul National University College of Medicine, 28 Yongon-dong, Chongno-gu, Seoul 03080, Korea
*
Author to whom correspondence should be addressed.
Int. J. Environ. Res. Public Health 2022, 19(10), 6241; https://0-doi-org.brum.beds.ac.uk/10.3390/ijerph19106241
Submission received: 15 April 2022 / Revised: 16 May 2022 / Accepted: 18 May 2022 / Published: 20 May 2022

Abstract

:
Particulate matter (PM) has been linked to adverse health outcomes, including insulin resistance (IR). To evaluate the relationships between exposures to PM10, PM2.5–10, and PM2.5; the serum level of fasting glucose, a key IR indicator; and effects of polymorphisms of two repair genes (PARP4 and ERCC1) on these relations, PMs exposure data and blood samples for glucose measurement and genotyping were collected from 527 Korean elders. Daily average levels of PMs during 8 days, from 7 days before examination to the health examination day (from lag day 7 to lag day 0), were used for association analyses, and mean concentrations of PM10, PM2.5–10, and PM2.5 during the study period were 43.4 µg/m3, 19.9 µg/m3, and 23.6 µg/m3, respectively. All three PMs on lag day 4 (mean, 44.5 µg/m3 for PM10, 19.9 µg/m3 for PM2.5–10, and 24.3 µg/m3 for PM2.5) were most strongly associated with an increase in glucose level (percent change by inter-quartile range-change of PM: (β) = 1.4 and p = 0.0023 for PM10; β = 3.0 and p = 0.0010 for PM2.5–10; and β = 2.0 and p = 0.0134 for PM2.5). In particular, elders with PARP4 G-C-G or ERCC1 T-C haplotype were susceptible to PMs exposure in relation to glucose levels (PARP4 G-C-G: β = 2.6 and p = 0.0006 for PM10, β = 3.5 and p = 0.0009 for PM2.5–10, and β = 1.6 and p = 0.0020 for PM2.5; ERCC1 T-C: β = 2.2 and p = 0.0016 for PM10, β = 3.5 and p = 0.0003 for PM2.5–10, and β = 1.2 and p = 0.0158 for PM2.5). Our results indicated that genetic polymorphisms of PARP4 and ERCC1 could modify the relationship between PMs exposure and fasting glucose level in the elderly.

1. Introduction

Insulin resistance (IR), a prediabetic state of type 2 diabetes, is an important health issue with a rapidly increasing incidence worldwide [1,2]. Several studies reported positive associations between particulate matters (PMs) and serum levels of fasting glucose, an important IR indicator [3,4]. The adverse effect of PM10 with a diameter of less than 10 μm on fasting glucose level was proven in the general population, regardless of short-term or long-term exposure [3,4]. Although short-term or long-term exposure to PM2.5 with a diameter of less than 2.5 μm was also reported to induce IR in C57BL/6 mice and incident metabolic syndrome in KORA cohort [5,6], evidence for the effects of PM2.5 and particularly PM2.5–10, known as coarse PM, on fasting glucose levels was insufficient.
Oxidative stress is considered to be a major biological mechanism underlying IR [7]. Although a variety of potential mechanisms of PMs inducing IR have been suggested, oxidative stress is still at the center of research attention [8,9,10,11]. Exposure to PM2.5 in mice can cause vascular IR by inducing pulmonary oxidative stress [8,12]. Furthermore, the adverse effect of PM2.5 on vascular IR can be reduced by removing superoxide from the lungs of mice [11,12]. The water-insoluble fraction of PM10 can also induce oxidative stress in human lung epithelial A549 cells [13]. Because PMs contain pro-oxidant molecules, such as chromium, iron, nickel, and zinc, that can induce reactive oxygen species [10], oxidative stress is plausible as a major mechanism of PMs on IR. Because oxidative stress could induce oxidative DNA damages, cells need to up-regulate DNA repair genes to protect against oxidative DNA damage upon PMs exposure [14]. In fact, an epidemiologic study reported that PMs exposure could even induce oxidative stress-associated DNA damage in healthy young adults exposed to low concentrations of ambient PM2.5–10 and PM2.5 [15].
Poly(ADP-ribose) polymerase family member 4 (PARP4) and excision repair cross-complementation 1 (ERCC1), respectively, repair DNA damage using base excision and nucleotide excision repair pathways to remove oxidized DNA bases or nucleotides [16,17]. These DNA damage repairs are considered to be very important processes because they can protect the human body against oxidative stress. It has been reported that PARP is activated by DNA strand breakage through the excessive accumulation of reactive oxygen species in relation to hyperglycemia [18]. Although PARP1 and PARP2, included in the same family as PARP4, were reported to affect glucose metabolism and insulin sensitivity [19], there is no evidence for the effect of PARP4 on blood glucose level. On the other hand, ERCC1 gene was reported to have an impact on glucose intolerance in a progeroid mouse model with ERCC1 deficiency, resulting in fat loss and IR by triggering an autoinflammatory response [20]. Previous evidence showed that genetic variations of PARP4 and ERCC1 could potentially affect IR differently by changing the capacity of corresponding enzymes encoded by them.
As population aging increases, we need to pay attention to the elderly, who are more vulnerable to chronic diseases than others [21]. With increasing age, the body’s function as well as immune system become more sensitive and vulnerable [21]. The EpiAir study, an epidemiologic surveillance on air pollution and Italian health, indicated that elderly subjects were more vulnerable to exposure to particulate matters than to other pollutants [21]. Therefore, the objective of the present study was to evaluate relations between PMs (PM10, PM2.510, and PM2.5) exposure and the serum level of fasting glucose among the elderly population considering modification by genetic polymorphisms of PARP4 and ERCC1.

2. Materials and Methods

2.1. Study Population and Sampling

The Korean Elderly Environmental Panel I study began from 2008. There were five repeated health examinations from start time to 2010 (twice in 2008, once in 2009, and twice in 2010) for 560 participants aged 60 or over recruited at a community welfare center for elders in Seoul, Korea. After excluding participants lacking blood samples and PM concentrations data, the final analysis included 527 participants. We asked participants to fast from midnight on the day before the examination. We collected their blood samples on the day of visit at around 10 A.M. Whole blood was centrifuged at 30 to 60 min after collection, and the serum and cellular layer were separated and stored in screw-cap tubes. All serum samples were frozen at −70 °C until analysis for glucose level measurement. The cellular layer was also stored at −70 °C for DNA preparation. To analyze urinary cotinine levels, spot urine samples were also collected and then stored at −20 °C until analysis. Information about basic demographics, including smoking status, was collected through an interview by trained staff.

2.2. PM Concentrations and Meteorological Factors

PM10 and PM2.5 concentrations were collected from the Korea National Institute of Environmental Research and Seoul Research Institute of Public Health and Environment, respectively, as day average levels during 8 days from seven days before to the health examination day (from lag day 7 to lag day 0) [4,22]. PM2.510 concentration was calculated as the difference between PM10 and PM2.5 concentrations. Daily outdoor temperature and dewpoint of the day were obtained from the Korea Meteorological Administration. All PM concentrations and meteorological data were obtained from monitoring sites nearest to the residence of participants. Daily means were calculated and used as individual values corresponding to each participant.

2.3. Fasting Glucose Level Measurement

Serum level of fasting glucose was measured using a hexokinase method with a Pureauto S GLU kit (Daiichi Pure Chemicals, Tokyo, Japan) [4].

2.4. Cotinine Measurement

To determine exposure to tobacco smoke, urinary cotinine level was measured using an enzyme-linked immunosorbent assay (Cotinine Elisa; Bio-Quant, San Diego, CA, USA) following the manufacturer’s procedure [4]. The lower limit of detection (LODL) of cotinine level was 1 µg/g, and the value under LODL was assigned as 0.5 µg/g. A value greater than the upper LOD (LODU = 10,000 µg/g) was assigned as 15,000 µg/g. Cotinine level was adjusted for urinary creatinine level in statistical analyses.

2.5. Genotyping

We listed all single-nucleotide polymorphisms (SNPs) on PARP4 and ERCC1 and examined their minor allele frequencies in Asian population using International HapMap data because low minor allele frequency may lead to null result; although, the SNP is meaningful for the risk of target outcome. After we searched for linkage structure using the Haploview to confirm which SNPs should be selected for haplotype construction, we finally selected three SNPs of PARP4 (rs12863638, rs3783073, and rs2275660) and two SNPs of ERCC1 (rs11615 and rs3212961) (Table A1). Table A1 shows detailed information for these five SNPs including rs number, Human Genome Variation Society (HGVS) name, chromosome number, their position, function, call rate, and accuracy. All five SNPs were genotyped using TaqMan method. In brief, a polymerase chain reaction (PCR) was carried out with a final volume of 5 μL, containing 10 ng of genomic DNA, 2.5 μL of 2X TaqMan Universal PCR Master Mix, 0.125 μL of 40X Assay Mix, and 1.25 μL of DNase-free water (Assay ID, C_9228399_10 for rs12863638; C_27515784_10 for rs3783073; C_15879320_10 for rs2275660; C_2532959_1 for rs11615; and C_25934767_10 for rs3212961). Thermal cycle conditions were: 50 °C for 2 min and 95 °C for 10 min, followed by 45 cycles at 95 °C for 15 s and 60 °C for 1 min. Dual 384-Well GeneAmp PCR System 9700 (ABI, Foster City, CA, USA) was used for PCR. Endpoint fluorescent readings were conducted using an ABI PRISM 7900 HT Sequence Detection System (ABI, Foster City, CA, USA). Five percent of samples were randomly chosen for repeated testing. Identical results were found with 100% accuracy rate (Table A1). We also tested the Hardy–Weinberg Equilibrium (HWE) for genotyped SNPs using chi-square test and found that all p-values were larger than 0.05, indicating that all SNPs were in HWE.

2.6. Haplotype Determination

Because adjacent SNPs in the same chromosome region can be inherited together in a haplotype, an analysis using multiple SNPs can simultaneously increase statistical sensitivity [23] or the power to detect loci relative to that of single SNPs [24]. Therefore, haplotypes composed of SNPs of each gene were made using PHASE program version 2.1 (http://stephenslab.uchicago.edu/phase/download.html, accessed on 14 May 2018). In brief, we deleted the data of people whose genotype was lacking for at least one SNP, and then composed haplotypes based on three SNPs of PARP4 (rs12863638, rs3783073, and rs2275660) and two SNPs of ERCC1 (rs11615 and rs3212961). The linkage disequilibrium (LD) between two SNPs of each gene was evaluated based on relative disequilibrium (D′) [25]. Statistical significance of LD was evaluated using Fisher’s exact test.

2.7. Statistical Analysis

Baseline characteristics of participants were compared between males and females. Student’s t-test was used for mean comparison and chi-square test was used for frequency comparison. Mean concentrations and selected percentiles of repeated measures, including fasting glucose and PMs, were calculated. For PMs, the day average from lag day 0 to lag day 7 was used. Original or log-transformed concentrations of PM10, PM2.5–10, and PM2.5 were compared among lag days using analysis of variance (ANOVA). Relations among PM10, PM2.510, and PM2.5 levels on each lag day were evaluated using Pearson’s correlation. After fasting glucose levels were log-transformed for their normality, the relation of each PM with glucose level was estimated using mixed effect models since we repeated measurements for both PMs and glucose level. The relation of each PM with glucose level was also evaluated by genotypes and diplotypes of PARP4 and ERCC1 genes. In all models, changes in glucose level by inter-quartile range (IQR) changes in PM10, PM2.510, and PM2.5 were evaluated after adjusting for age (year), sex (males vs. female), body mass index (BMI, kg/m2), urinary cotinine level (μg/g creatinine), outdoor temperature (°C), and dewpoint (°C) of the day. Statistical significance was considered when p-value was lower than 0.05. All statistical analyses were performed using SAS version 9.4 (SAS Institute Inc., Cary, NC, USA).

3. Results

3.1. Baseline Characteristics of Study Participants

The study participants were 527 elders (Table 1). There were 136 (25.8%) males and 391 (74.2%) females, and the average visit number was 3.3. The mean age was 70.8 years for all participants, and most participants (n = 294, 55.8%) had BMI < 25. Frequencies of five SNPs were not significantly different between males and females (p > 0.05 for all five) (Table 1).

3.2. Distribution of Repeated Measures during the Study Period

The average fasting glucose level was 5.5 mmol/L during the study period, while the mean concentrations of PM10, PM2.5–10, and PM2.5 were 43.4 µg/m3, 19.9 µg/m3, and 23.6 µg/m3, respectively (Table 2). The mean outdoor temperature and dewpoint of the day were 17.2 °C and 6.1 °C, respectively (Table 2). The IQR was 22.7 µg/m3 for PM10, 16.2 µg/m3 for PM2.5–10, and 9.0 µg/m3 for PM2.5 (Table 2).

3.3. PM Concentrations and Their Correlations

In the comparison of PM10, PM2.5–10, and PM2.5 concentrations among lag days, PM10 and PM2.5–10 concentrations were significantly different among lag days for both original and log-transformed concentrations (p < 0.05 for all), while PM2.5 concentrations were not significantly different among lag days; although, original values showed marginal significance (p = 0.0812) (Figure 1). However, each PM10 or PM2.5–10 concentration was correlated among lag days (all p < 0.0001 with correlation coefficients ranging from 0.14 to 0.72 for PM10 and from 0.24 to 0.66 for PM2.5–10), while PM2.5 concentration showed no significant correlations between levels on lag day 0 and levels on lag days 4 to 7 and between levels on lag day 1 and levels on lag days 6 and 7, although levels on other lag days were significantly correlated with each other (Table A2).
Since PM2.5–10 and PM2.5 were included in PM10, relations among PMs on the same day were also evaluated (Table A2). All three PMs were strongly correlated with each other with the maximum and minimum correlation coefficients of 0.92 and 0.54 (all p < 0.0001) (Table A2).

3.4. Association between PMs Exposure and Fasting Glucose Level

Relations between PM concentrations on eight lag days (from lag day 0 to lag day 7) and fasting glucose level were evaluated (Table 3). All three PMs significantly or marginally increased glucose levels from lag days 3 to 7, with the strongest effect on lag day 4, with mean concentrations of 44.5 µg/m3 for PM10, 19.9 µg/m3 for PM2.5–10, and 24.3 µg/m3 for PM2.5 (percent change by IQR; change in PM: (β) = 1.4 and p = 0.0023 for PM10; β = 3.0 and p = 0.0010 for PM2.5–10; and β = 2.0 and p = 0.0134 for PM2.5) (Table 3). Because PMs on lag day 4 showed the strongest associations with glucose level based on the effect size, lag day 4 was chosen for further analyses.

3.5. Association between PMs Exposure and Fasting Glucose Level by Genotypes or Diplotypes of Repair Genes

Relation between PMs exposure and glucose level was evaluated by genotypes of PARP4 and ERCC1. Participants with G allele for rs12863638, C allele for rs3783073, G allele for rs2275660, T allele for rs11615, and C allele for rs3212961 seemed to be susceptible to exposure to three PMs in relation to the increase in glucose level, although the ERCC1 TT genotype for rs11615 was marginally significant with the greatest effect size (Table 4).
All three SNPs of PARP4 and two SNPs of ERCC1 were in a strong LD with each other (p < 0.0001 for all relations). For PARP4, D′ was 0.95 between rs12863638 and rs3783073, 0.71 between rs12863638 and rs2275660, and 0.98 between rs3783073 and rs2275660. For ERCC1, D′ between rs11615 and rs3212961 was 0.89. Because the G allele for rs12863638, C allele for rs3783073, and G allele for rs2275660 of PARP4 and T allele for rs11615 and C allele for rs3212961 of ERCC1 showed an increasing trend for the susceptibility to PMs exposure and there were strong linkages among SNPs of same gene, we evaluated the relationship between PMs exposure and glucose level by combined diplotypes of PARP4 and ERCC1. First of all, we created the risky haplotypes of PARP4 (G-C-G haplotype composed of G allele for rs12863638, C allele for rs3783073, and G allele for rs2275660) and ERCC1 (T-C haplotype composed of T allele for rs11615 and C allele for rs3212961) and evaluated the effect of PMs exposure on glucose level in participants with or without risky haplotype (Table 4). For all three PMs, participants with the PARP4 G-C-G haplotype or ERCC1 T-C haplotype were found to be susceptible to PMs exposure based on their glucose levels (PARP4 G-C-G: β = 2.6 and p = 0.0006 for PM10, β = 3.5 and p = 0.0009 for PM2.5–10, and β = 1.6 and p = 0.0020 for PM2.5; ERCC1 T-C: β = 2.2 and p = 0.0016 for PM10, β = 3.5 and p = 0.0003 for PM2.5–10, and β = 1.2 and p = 0.0158 for PM2.5), while others (participants without PARP4 G-C-G haplotype or ERCC1 T-C haplotype) were not susceptible (p > 0.05 for all three PMs and both genes) (Table 4).
We also evaluated the interaction between PMs exposure and genotypes or diplotypes in relation to glucose level (Table 4). Two PMs (PM10 and PM2.5) showed significant interactions with PARP4 diplotypes for glucose level (p = 0.0262 for PM10 and p = 0.0191 for PM2.5), while PM2.5 showed marginal significant interactions with PARP4 diplotypes (p = 0.0802) (Table 4). However, ERCC1 diplotypes did not show interactions with all three PMs for glucose level (p > 0.05 for all three PMs) (Table 4).
We also evaluated direct effects of genes on glucose level, but did not find significant effects of genes on glucose level (p > 0.05 for both genes) (Table A3).

4. Discussion

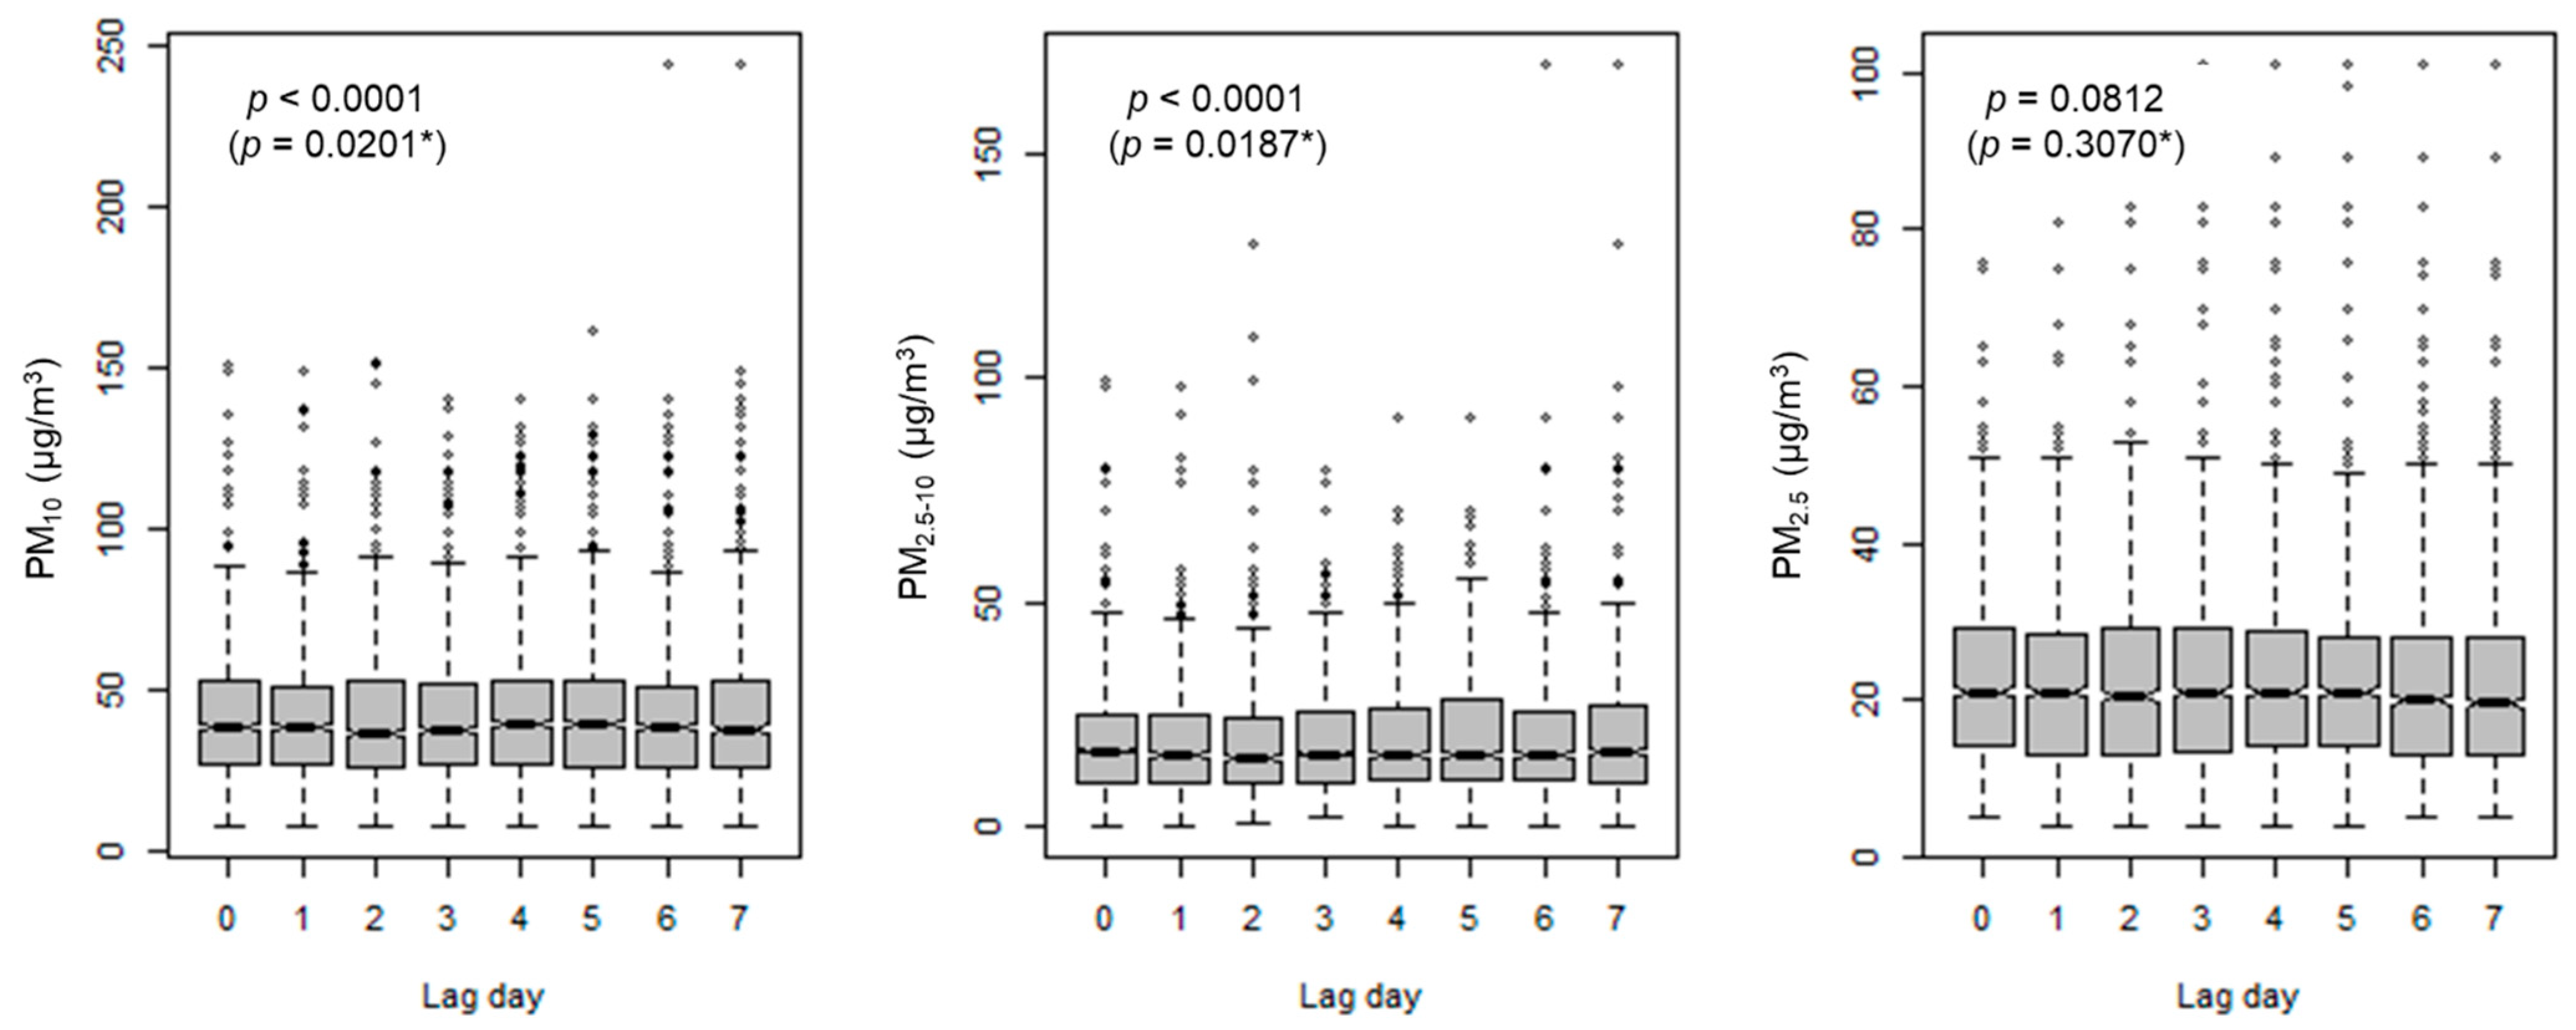
In the present study, all three PMs were strongly correlated with each other and PM2.5 had a higher daily variability than the other PMs. Furthermore, participants with PARP4 G-C-G and ERCC1 T-C haplotypes were susceptible to PMs exposure in relation to fasting glucose level.
The World Health Organization (WHO) has suggested a daily average level of 45 µg/m3 for PM10 and 15 µg/m3 for PM2.5 in their Global Air Quality Guidelines [26]. Compared to the Global Air Quality Guidelines by WHO, our elderly population were exposed to a relatively and consistently high level of PMs, particularly PM2.5. Considering correlations among three PMs on a specific lag day or among several lag days for the same PM in our study, PMs were temporally variable, particularly PM2.5, although their levels were related to each other. In the present study, we chose lag day 4 for further analyses based on the strongest associations of PMs on lag day 4 with glucose level in the present study, and found the biggest change in glucose level after PM2.5–10 exposure, followed by PM2.5 and PM10. The biggest change in glucose level after PM2.5–10 exposure was supported by previously reported studies. Liang et al. [27] showed that each increase of 10 µg/m3 in 3-day moving averages of PM significantly increased the risk of outpatient visits of pneumonia, bronchiolitis, and asthma, regardless of PM size, with PM2.5–10 showing the biggest effect size (4.36% of PM10, 9.19% of PM2.5–10, and 3.71% of PM2.5 for outpatient visits of pneumonia; 3.12% of PM10, 9.13% of PM2.5–10, and 3.21% of PM2.5 for bronchiolitis; and 3.33% of PM10, 11.69% of PM2.5–10, and 3.45% of PM2.5 for asthma). Lei et al. [28] showed that PM2.5–10 had stronger associations with the loss of lung function than PM2.5. The greatest effect size for PM2.5–10 in our analyses could be attributable to the difference in the amount of lipopolysaccharide (LPS) among PMs. Biologic components intrinsic to PM such as LPS could directly activate Toll-like receptors, leading to inflammation [29]. In fact, LPS was reported to induce metabolic syndromes, such as IR [30,31]. Moreover, LPS was known to be dominant in urbanized environments in Asia [30]. The amount of LPS was reported to be higher in PM10 than in PM2.5 because of higher level of LPS in PM2.5–10 [30]. Because the effect size of PM10 could be offset by that of PM2.5 in our study, the effect size of PM2.5–10 on glucose level was the greatest. However, there is still a debate about which PM could play a role in oxidative-stress-related DNA damage. Feng et al. [32] indicated that DNA damage caused by fine particles, ranging from 0.43 to 2.1 μm in size, was greater than the damage caused by coarse particles, ranging from 4.7 to 10 μm in size. They also suggested that greater DNA damage in fine particles could be attributable to heavy metals enriched in fine particles [32]. Therefore, in the future, we need to clarify which PM size is more important for the prevention of oxidative-stress-related DNA damage as well as their biological functions and mechanisms.
DNA repair proteins such as PARP4 and ERCC1 can protect against metabolic dysfunction including IR [20,33]. Both PARP and ERCC family members were reported to be involved in the pathway of IR regulation through repairing oxidative DNA damage and inhibiting autoinflammatory response [20,33]. However, there is a lack of knowledge regarding the relation between PARP4, a particular member of PARP family, and fasting glucose level. Furthermore, the effect of PARP4 and ERCC1 variations on the relation between PMs exposure and glucose level has not yet been reported, although positive associations between DNA damage accumulation and the development of metabolic disorders were reported [33]. Because genetic polymorphisms of two repair genes, PARP4 and ERCC1, can affect DNA repair efficiency [34], their polymorphisms may modify the relation between PMs exposure and glucose level. In the present study, we found that participants with PARP4 G-C-G and ERCC1 T-C haplotypes were apparently susceptible to an increase in glucose level in relation to exposure to all three PMs, although the effect size was slightly different by PMs. Although no study reported the effects of PARP4 and ERCC1 polymorphisms on relation between PMs exposure and fasting glucose level, several studies supported the potential idea that those polymorphisms could affect the impact of PMs exposure on glucose level. For the ERCC1 gene, the defective ERCC1 gene could increase the incidence of vascular diseases [35], and genetic polymorphisms of ERCC1 could affect the efficiency of chemotherapy, as well as the susceptibility of a variety of diseases, including lung cancer and several cardiovascular diseases [36,37,38]. Particularly, the ERCC1 rs11615 T allele was found to be a risk factor for developing non-small cell lung cancer [37]. Because the lungs can be directly exposed to PMs [8,11,12,13], the effects of these SNPs are plausible. In fact, the risk effect of rs11615 T allele [37] was consistent with our results, which we obtained with regard to both PMs and glucose level. Studies on ERCC1 rs3212961 were controversial, although the rs3212961 C allele was associated with a shorter overall survival in gastric cancer patients [39] and a higher risk for non-Hodgkin lymphoma development [40], which were consistent with results of the present study. However, we found no evidence for the relation between the three SNPs of the PARP4 gene examined in the present study and DNA damage or lung oxidation, although rs17080653, another intronic variant in PARP4, showed a protective effect on head and neck cancer [41] and inter-individual differences in DNA repair processes [42].
In the present study, we found interactions between PMs exposure and PARP4 genotypes or diplotypes in relation to glucose level. All three PMs, in particular PM10 and PM2.5, showed interactions with PARP4 diplotypes, although the direct effect of PARP4 gene was not found. This meant the active functions of both environmental and genetic factors in relation with fasting glucose level, with an emphasis on the environmental factors in regulating genes. However, we did not find any significant interactions between PMs exposure and ERCC1 diplotypes, although ERCC1 rs11615 showed marginal interactions with PM10 and PM2.5 in relation with glucose. Therefore, in the future, we need to validate the interactive effect of the ERCC1 gene with PMs in relation to glucose level with a larger sample size.
To the best of our knowledge, the present study is the first to explore the effects of genetic modifications of PARP4 and ERCC1 on relations between three PM species and fasting blood glucose level, targeting elders who are susceptible to environmental pollutants. Although we used a panel study design, which could increase statistical power, our study also had limitations. First, we did not control for other air pollutants (O3 or NO2) and GST family genes polymorphisms, although we found adverse effects of O3 and NO2 exposures on the glucose level and modification of GSTM1 and T1, as well as an impact of P1 polymorphisms on the relation between PM10 exposure and glucose level, in a previous study [4]. Because too many missing data could be produced if we matched O3 and NO2 to PM10 and PM2.5 on a daily basis, which could lead to non-significance due to small numbers of data used in the analyses, we did not control O3 or NO2 in our statistical models. This was the same for the GSTM1, T1, and P1 genes. In the future, we need to confirm whether the modification effect of PARP4 and ERCC1 polymorphisms on the relations between PMs exposure and glucose level still remains after controlling for these factors with a larger sample size. Second, in the present study, we only explored the acute effects of PMs on glucose level. Therefore, we need to clarify whether our genetic modification effect still remains after long-term exposure and short-term exposure. Third, in the future, we need to consider the chemical nature of the particles to confirm the causality of particles as well as genes in relation to glucose level.

5. Conclusions

In conclusion, all three PMs were strongly correlated with each other and PM2.5 had higher daily variability than the others. Furthermore, elderly participants with PARP4 G-C-G and ERCC1 T-C haplotypes were susceptible to an increase in fasting glucose level after exposure to all three PMs, regardless of PM10, PM2.5–10, or PM2.5. These results should be confirmed in the future after considering other causal factors and confounders with a larger sample size.

Author Contributions

Conceptualization, methodology, and analyses, J.H.K.; Writing—original draft, J.H.K.; Writing—review and editing, S.L. and Y.-C.H. All authors have read and agreed to the published version of the manuscript.

Funding

The present study was supported by a grant (2019R1I1A2A01050001) funded by the Ministry of Education, Korea.

Institutional Review Board Statement

The protocol of the current study was approved by the Institutional Review Board of Seoul National University Hospital (IRB no. H-0804-045-241).

Informed Consent Statement

All participants provided written informed content.

Conflicts of Interest

The authors declare no conflict of interest.

Appendix A

Table A1. Genotyped polymorphisms of repair genes.
Geners No.HGVS NameChromosome No.PositionAmino Acid ChangeCall Rate (%)Accuracy (%)
PARP4rs12863638c.-2+2528G>T13Intron in the 5′ UTR-99.2100
rs3783073c.879+374T>C13Intron-98.8100
rs2275660c.2695G>A13Codon 899Ala899Thr98.7100
ERCC1rs11615c.354T>C19Codon 118Asn118Asn100100
rs3212961c.525+33C>A19Intron-98.3100
Table A2. Correlations among PM10, PM2.5–10, and PM2.5 levels (Pearson correlation coefficients and p-values).
Pollutant PM10 PM2.5–10 PM2.5
Lag Day012345670123456701234567
PM10010.66 0.30 0.14 0.15 0.15 0.19 0.29 0.92 0.61 0.31 0.21 0.27 0.30 0.33 0.43 0.90 0.58 0.23 0.05 −0.03 −0.03 0.01 0.07
<0.0001<0.0001<0.0001<0.0001<0.0001<0.0001<0.0001<0.0001<0.0001<0.0001<0.0001<0.0001<0.0001<0.0001<0.0001<0.0001<0.0001<0.00010.03480.26530.19830.75190.0025
1 10.66 0.34 0.22 0.25 0.19 0.23 0.58 0.90 0.57 0.34 0.28 0.32 0.25 0.33 0.61 0.90 0.60 0.28 0.08 0.11 −0.002 0.05
<0.0001<0.0001<0.0001<0.0001<0.0001<0.0001<0.0001<0.0001<0.0001<0.0001<0.0001<0.0001<0.0001<0.0001<0.0001<0.0001<0.0001<0.00010.0008<0.00010.93380.0453
2 10.66 0.39 0.30 0.28 0.22 0.27 0.59 0.88 0.59 0.39 0.33 0.29 0.27 0.26 0.59 0.88 0.59 0.29 0.21 0.12 0.07
<0.0001<0.0001<0.0001<0.0001<0.0001<0.0001<0.0001<0.0001<0.0001<0.0001<0.0001<0.0001<0.0001<0.0001<0.0001<0.0001<0.0001<0.0001<0.0001<0.00010.0028
3 10.69 0.47 0.29 0.29 0.12 0.28 0.51 0.88 0.61 0.43 0.26 0.31 0.12 0.34 0.64 0.91 0.61 0.40 0.18 0.17
<0.0001<0.0001<0.0001<0.0001<0.0001<0.0001<0.0001<0.0001<0.0001<0.0001<0.0001<0.0001<0.0001<0.0001<0.0001<0.0001<0.0001<0.0001<0.0001<0.0001
4 10.72 0.37 0.27 0.12 0.16 0.28 0.57 0.88 0.60 0.33 0.30 0.14 0.22 0.41 0.67 0.91 0.66 0.28 0.14
<0.0001<0.0001<0.0001<0.0001<0.0001<0.0001<0.0001<0.0001<0.0001<0.0001<0.0001<0.0001<0.0001<0.0001<0.0001<0.0001<0.0001<0.0001<0.0001
5 10.58 0.32 0.17 0.19 0.21 0.37 0.59 0.87 0.47 0.27 0.09 0.25 0.32 0.46 0.68 0.90 0.52 0.27
<0.0001<0.0001<0.0001<0.0001<0.0001<0.0001<0.0001<0.0001<0.0001<0.000100.0002<0.0001<0.0001<0.0001<0.0001<0.0001<0.0001<0.0001
6 10.63 0.23 0.20 0.27 0.28 0.35 0.51 0.91 0.54 0.10 0.13 0.21 0.24 0.33 0.52 0.89 0.55
<0.0001<0.0001<0.0001<0.0001<0.0001<0.0001<0.0001<0.0001<0.0001<0.0001<0.0001<0.0001<0.0001<0.0001<0.0001<0.0001<0.0001
7 10.32 0.25 0.23 0.34 0.34 0.31 0.57 0.91 0.20 0.16 0.15 0.21 0.17 0.26 0.55 0.84
<0.0001<0.0001<0.0001<0.0001<0.0001<0.0001<0.0001<0.0001<0.0001<0.0001<0.0001<0.0001<0.0001<0.0001<0.0001<0.0001
PM2.5–100 10.63 0.32 0.24 0.27 0.34 0.37 0.44 0.65 0.42 0.16 −0.01 −0.04 −0.03 0.05 0.11
<0.0001<0.0001<0.0001<0.0001<0.0001<0.0001<0.0001<0.0001<0.00010.75710.07150.2140.0662<0.0001
1 10.64 0.37 0.29 0.32 0.30 0.35 0.47 0.62 0.41 0.14 0.01 0.02 −0.004 0.06
<0.0001<0.0001<0.0001<0.0001<0.0001<0.0001<0.0001<0.0001<0.0001<0.00010.81080.40270.87330.0198
2 10.61 0.38 0.32 0.36 0.31 0.23 0.39 0.55 0.33 0.13 0.06 0.11 0.07
<0.0001<0.0001<0.0001<0.0001<0.0001<0.0001<0.0001<0.0001<0.0001<0.00010.0144<0.00010.0056
3 10.66 0.46 0.34 0.39 0.13 0.23 0.42 0.61 0.38 0.22 0.13 0.15
<0.0001<0.0001<0.0001<0.0001<0.0001<0.0001<0.0001<0.0001<0.0001<0.0001<0.0001<0.0001
4 10.65 0.42 0.46 0.21 0.21 0.30 0.45 0.60 0.40 0.17 0.09
<0.0001<0.0001<0.0001<0.0001<0.0001<0.0001<0.0001<0.0001<0.0001<0.00010.0003
5 10.54 0.36 0.19 0.25 0.26 0.32 0.44 0.56 0.34 0.15
<0.0001<0.0001<0.0001<0.0001<0.0001<0.0001<0.0001<0.0001<0.0001<0.0001
6 10.61 0.21 0.15 0.15 0.14 0.20 0.30 0.62 0.36
<0.0001<0.0001<0.0001<0.0001<0.0001<0.0001<0.0001<0.0001<0.0001
7 10.33 0.24 0.16 0.18 0.11 0.14 0.36 0.54
<0.0001<0.0001<0.0001<0.0001<0.0001<0.0001<0.0001<0.0001
PM2.50 10.63 0.25 0.09 −0.02 −0.04 −0.05 0.01
<0.0001<0.00010.00030.43030.11010.05890.6835
1 10.66 0.36 0.13 0.17 −0.01 0.02
<0.0001<0.0001<0.0001<0.00010.54070.4813
2 10.71 0.37 0.31 0.10 0.05
<0.0001<0.0001<0.0001<0.00010.0497
3 10.70 0.48 0.20 0.15
<0.0001<0.0001<0.0001<0.0001
4 10.75 0.33 0.17
<0.0001<0.0001<0.0001
5 10.57 0.31
<0.0001<0.0001
6 10.62
<0.0001
7 1
 
Table A3. Direct effects of genotypes or combined diplotypes of repair genes on glucose level.
GeneGenotype or DiplotypeNo. (%)% Change (95% CI)p-Valuep-Value for Trend
PARP4rs12863638
GG238 (45.5)Ref. 0.1456
GT238 (45.5)–1.4 (–4.4, 1.6)0.3489
TT47 (9.0)3.7 (–1.5, 8.8)0.1671
rs3783073
CC214 (41.1)Ref. 0.2695
CT245 (47.0)0.6 (–2.4, 3.7)0.6969
TT62 (11.9)–3.3 (–8.1, 1.5)0.1793
rs2275660
AA231 (44.4)Ref. 0.4948
AG222 (42.7)0.2 (–2.9, 3.3)0.9101
GG67 (12.9)2.7 (–1.9, 7.2)0.2500
Without G-C-G haplotype251 (49.0)Ref. 0.7902
With G-C-G haplotype261 (51.0)0.4 (–2.5, 3.3)0.7902
ERCC1rs11615
CC291 (55.2)Ref. 0.2806
CT203 (38.5)1.1 (–1.9, 4.1)0.4855
TT33 (6.3)4.7 (–1.3, 10.8)0.1222
rs3212961
CC137 (26.4)Ref. 0.5296
CA265 (51.2)–1.9 (–5.3, 1.6)0.2808
AA116 (22.4)–1.8 (–6.0, 2.3)0.3883
Without T-C haplotype295 (56.9)Ref. 0.5575
With T-C haplotype223 (43.1)0.9 (–2.0, 3.8)0.5575
After glucose levels were log-transformed for their normality, direct effect of genotypes or combined diplotypes of repair genes on glucose levels were evaluated after adjusting for age, sex, BMI, urinary cotinine level, outdoor temperature, and dewpoint of the day. Each haplotype was composed of rs12863638, rs3783073, and rs2275660 for PARP4 and rs11615 and rs3212961 for ERCC1. BMI, body mass index; CI, confidence interval.

References

  1. Saklayen, M.G. The global epidemic of the metabolic syndrome. Curr. Hypertens. Rep. 2018, 20, 12. [Google Scholar] [CrossRef] [PubMed] [Green Version]
  2. Dandona, P.; Aljada, A.; Bandyopadhyay, A. Inflammation: The link between insulin resistance, obesity and diabetes. Trends Immunol. 2017, 25, 4–7. [Google Scholar] [CrossRef] [PubMed]
  3. Wolf, K.; Popp, A.; Schneider, A.; Breitner, S.; Hampel, R.; Rathmann, W.; Herder, C.; Roden, M.; Koenig, W.; Meisinger, C.; et al. Association between long-term exposure to air pollution and biomarkers related to insulin resistance, subclinical inflammation and adipokines. Diabetes 2016, 65, 3314–3326. [Google Scholar] [CrossRef] [PubMed] [Green Version]
  4. Kim, J.H.; Hong, Y.C. GSTM1, GSTT1, and GSTP1 polymorphisms and associations between air pollutants and markers of insulin resistance in elderly Koreans. Environ. Health Perspect. 2012, 120, 1378–1384. [Google Scholar] [CrossRef] [PubMed] [Green Version]
  5. Xu, X.; Liu, C.; Xu, Z.; Tzan, K.; Zhong, M.; Wang, A.; Lippmann, M.; Chen, L.C.; Rajagopalan, S.; Sun, Q. Long-term exposure to ambient fine particulate pollution induces insulin resistance and mitochondrial alteration in adipose tissue. Toxicol. Sci. 2011, 124, 88–98. [Google Scholar] [CrossRef] [Green Version]
  6. Voss, S.; Schneider, A.; Huth, C.; Wolf, K.; Markevych, I.; Schwettmann, L.; Rathmann, W.; Peters, A.; Breitner, S. Long-term exposure to air pollution, road traffic noise, residential greenness, and prevalent and incident metabolic syndrome: Results from the population-based KORA F4/FF4 cohort in Augsburg, Germany. Environ. Int. 2021, 147, 106364. [Google Scholar] [CrossRef]
  7. Yaribeygi, H.; Farrokhi, F.R.; Butler, A.E.; Sahebkar, A. Insulin resistance: Review of the underlying molecular mechanisms. J. Cell. Physiol. 2019, 234, 8152–8161. [Google Scholar] [CrossRef]
  8. Haberzettl, P.; O’Toole, T.E.; Bhatnagar, A.; Conklin, D.J. Exposure to fine particulate air pollution causes vascular insulin resistance by inducing pulmonary oxidative stress. Environ. Health Perspect. 2016, 124, 1830–1839. [Google Scholar] [CrossRef] [Green Version]
  9. Zhang, Y.; Li, Y.; Shi, Z.; Wu, J.; Yang, X.; Feng, L.; Ren, L.; Duan, J.; Sun, Z. Metabolic impact induced by total, water soluble and insoluble components of PM2.5 acute exposure in mice. Chemosphere 2018, 207, 337–346. [Google Scholar] [CrossRef]
  10. Ghio, A.J.; Carraway, M.S.; Madden, M.C. Composition of air pollution particles and oxidative stress in cells, tissues, and living systems. J. Toxicol. Environ. Health Part B 2012, 15, 1–21. [Google Scholar] [CrossRef]
  11. Liu, C.; Xu, X.; Bai, Y.; Zhong, J.; Wang, A.; Sun, L.; Kong, L.; Ying, Z.; Sun, Q.; Rajagopalan, S. Particulate air pollution mediated effects on insulin resistance in mice are independent of CCR2. Part Fibre Toxicol. 2017, 14, 6. [Google Scholar] [CrossRef] [PubMed] [Green Version]
  12. Rao, X.; Zhong, J.; Brook, R.D.; Rajagopalan, S. Effect of particulate matter air pollution on cardiovascular oxidative stress pathways. Antioxid. Redox Signal. 2018, 28, 797–818. [Google Scholar] [CrossRef] [PubMed]
  13. Yi, S.; Zhang, F.; Qu, F.; Ding, W. Water-insoluble fraction of airborne particulate matter (PM10) induces oxidative stress in human lung epithelial A549 cells. Environ. Toxicol. 2014, 29, 226–233. [Google Scholar] [CrossRef] [PubMed]
  14. Santa-Gonzalez, G.A.; Gomez-Molina, A.; Arcos-Burgos, M.; Meyer, J.N.; Camargo, M. Distinctive adaptive response to repeated exposure to hydrogen peroxide associated with upregulation of DNA repair genes and cell cycle arrest. Redox. Biol. 2016, 9, 124–133. [Google Scholar] [CrossRef] [Green Version]
  15. Brauner, E.V.; Forchhammer, L.; Moller, P.; Simonsen, J.; Glasius, M.; Wahlin, P.; Raaschou-Nielsen, O.; Loft, S. Exposure to ultrafine particles from ambient air and oxidative stress-induced DNA damage. Environ. Health Perspect. 2007, 115, 1177–1182. [Google Scholar] [CrossRef]
  16. Kim, J.H.; Hong, Y.-C. Modification of PARP4, XRCC3, and RAD51 gene polymorphisms on the relation between bisphenol A exposure and liver abnormality. Int. J. Environ. Res. Public Health 2020, 17, 2794. [Google Scholar] [CrossRef] [Green Version]
  17. Gillet, L.C.J.; Scharer, O.D. Molecular mechanisms of mammalian global genome nucleotide excision repair. Chem. Rev. 2006, 106, 253–276. [Google Scholar] [CrossRef]
  18. Gao, J.; Zheng, Z.; Gu, Q.; Chen, X.; Liu, X.; Xu, X. Deacetylation of MnSOD by PARP-regulated SIRT3 protects retinal capillary endothelial cells from hyperglycemia-induced damage. Biochem. Biophys. Res. Commun. 2016, 472, 425–431. [Google Scholar] [CrossRef]
  19. Bai, P.; Cantó, C. The Role of PARP-1 and PARP-2 enzymes in metabolic regulation and disease. Cell Metab. 2012, 16, 290–295. [Google Scholar] [CrossRef] [Green Version]
  20. Karakasilioti, I.; Kamileri, I.; Chatzinikolaou, G.; Kosteas, T.; Vergadi, E.; Robinson, A.R.; Tsamardinos, I.; Rozgaja, T.A.; Siakouli, S.; Tsatsanis, C.; et al. DNA damage triggers a chronic autoinflammatory response, leading to fat depletion in NER progeria. Cell Metab. 2013, 18, 403–415. [Google Scholar] [CrossRef] [Green Version]
  21. Simoni, M.; Baldacci, S.; Maio, S.; Cerrai, S.; Sarno, G.; Viegi, G. Adverse effects of outdoor pollution in the elderly. J. Thorac. Dis. 2015, 7, 34–45. [Google Scholar] [PubMed]
  22. Kim, K.N.; Lee, H.; Kim, J.H.; Jung, K.; Lim, Y.H.; Hong, Y.C. Physical activity- and alcohol-dependent association between air pollution exposure and elevated liver enzyme levels: An elderly panel study. J. Prev. Med. Public Health 2015, 48, 151–169. [Google Scholar] [CrossRef] [PubMed] [Green Version]
  23. Kim, J.H.; Kim, H.; Lee, K.Y.; Kang, J.-W.; Lee, K.-H.; Park, S.-Y.; Yoon, H.-I.; Jheon, S.H.; Sung, S.W.; Hong, Y.-C. Aryl hydrocarbon receptor gene polymorphisms affect lung cancer risk. Lung Cancer 2007, 56, 9–15. [Google Scholar] [CrossRef] [PubMed]
  24. Yamazaki, K.; Beauchamp, G.K. Genetic basis for MHC-dependent mate choice. Adv. Genet. 2007, 59, 129–145. [Google Scholar] [PubMed]
  25. Lee, K.M.; Choi, J.Y.; Park, S.K.; Chung, H.W.; Ahn, B.; Yoo, K.Y.; Han, W.; Noh, D.Y.; Ahn, S.H.; Kim, H. Genetic polymorphisms of ataxia telangiectasia mutated and breast cancer risk. Cancer Epidemiol. Biomark. Prev. 2005, 14, 821–825. [Google Scholar] [CrossRef] [Green Version]
  26. World Health Organization. WHO Global Air Quality Guidelines: Particulate Matter (PM2.5 and PM10), Ozone, Nitrogen Dioxide, Sulfur Dioxide and Carbon Monoxide. 2021. Available online: https://0-www-ncbi-nlm-nih-gov.brum.beds.ac.uk/books/NBK574594/ (accessed on 11 April 2022).
  27. Liang, Z.; Meng, Q.; Yang, Q.; Chen, N.; You, C. Size-specific particulate matter associated with acute lower respiratory infection outpatient visits in children: A counterfactual analysis in Guangzhou, China. Front. Public Health 2021, 9, 789542. [Google Scholar] [CrossRef]
  28. Lei, J.; Yang, T.; Huang, S.; Li, H.; Zhu, Y.; Gao, Y.; Jiang, Y.; Wang, W.; Liu, C.; Kan, H.; et al. Hourly concentrations of fine and coarse particulate matter and dynamic pulmonary function measurements among 4992 adult asthmatic patients in 25 Chinese cities. Environ. Int. 2022, 158, 106942. [Google Scholar] [CrossRef]
  29. Fonceca, A.M.; Zosky, G.R.; Bozanich, E.M.; Sutanto, E.N.; Kicic, A.; McNamara, P.S.; Knight, D.A.; Sly, P.D.; Turner, D.J.; Stick, S.M. Accumulation mode particles and LPS exposure induce TLR-4 dependent and independent inflammatory responses in the lung. Respir. Res. 2018, 19, 15. [Google Scholar] [CrossRef] [Green Version]
  30. Liu, C.; Ying, Z.; Harkema, J.; Sun, Q.; Rajagopalan, S. Epidemiological and experimental links between air pollution and type 2 diabetes. Toxicol. Pathol. 2013, 41, 361–373. [Google Scholar] [CrossRef] [Green Version]
  31. Cani, P.D.; Amar, J.; Iglesias, M.A.; Poggi, M.; Knauf, C.; Bastelica, D.; Neyrinck, A.M.; Fava, F.; Tuohy, K.M.; Chabo, C.; et al. Metabolic endotoxemia initiates obesity and insulin resistance. Diabetes 2007, 56, 1761–1772. [Google Scholar] [CrossRef] [Green Version]
  32. Feng, X.; Shao, L.; Jones, T.; Li, Y.; Cao, Y.; Zhang, M.; Ge, S.; Yang, C.-X.; Lu, J.; BéruBé, K. Oxidative potential and water-soluble heavy metals of size-segregated airborne particles in haze and non-haze episodes: Impact of the “Comprehensive Action Plan” in China. Sci. Total Environ. 2022, 814, 152774. [Google Scholar] [CrossRef] [PubMed]
  33. Shimizu, I.; Yoshida, Y.; Suda, M.; Minamino, T. DNA damage response and metabolic disease. Cell Metab. 2014, 20, 967–977. [Google Scholar] [CrossRef] [PubMed] [Green Version]
  34. Kim, H.N.; Kim, N.Y.; Yu, L.; Kim, Y.-K.; Lee, I.-K.; Yang, D.-H.; Lee, J.-J.; Shin, M.-H.; Park, K.-S.; Choi, J.-S.; et al. Polymorphisms in DNA repair genes and MDR1 and the risk for non-Hodgkin lymphoma. Int. J. Mol. Sci. 2014, 15, 6703–6716. [Google Scholar] [CrossRef] [PubMed] [Green Version]
  35. Durik, M.; Kavousi, M.; van der Pluijm, I.; Isaacs, A.; Cheng, C.; Verdonk, K.; Loot, A.E.; Oeseburg, H.; Bhaggoe, U.M.; Leijten, F.; et al. Nucleotide excision DNA repair is associated with age-related vascular dysfunction. Circulation 2012, 126, 468–478. [Google Scholar] [CrossRef]
  36. Hamilton, G.; Rath, B. Pharmacogenetics of platinum-based chemotherapy in non-small cell lung cancer: Predictive validity of polymorphisms of ERCC1. Expert Opin. Drug Metab. Toxicol. 2018, 14, 17–24. [Google Scholar] [CrossRef]
  37. Chaszczewska-Markowska, M.; Kosacka, M.; Chryplewicz, A.; Dyła, T.; Brzecka, A.; Bogunia-Kubik, K. ECCR1 and NFKB2 polymorphisms as potential biomarkers of non-small cell lung cancer in a Polish population. Anticancer Res. 2019, 39, 3269–3272. [Google Scholar] [CrossRef]
  38. Zhang, S.; Wang, X.B.; Han, Y.D.; Xiong, C.L.; Zhou, Y.; Wang, C.; Liu, Z.J.; Yang, N.; Zheng, F. Polymorphism in ERCC1 confers susceptibility of coronary artery disease and severity of coronary artery atherosclerosis in a Chinese Han population. Sci. Rep. 2017, 7, 6407. [Google Scholar] [CrossRef] [Green Version]
  39. Liu, J.; Deng, N.; Xu, Q.; Sun, L.; Tu, H.; Wang, Z.; Xing, C.; Yuan, Y. Polymorphisms of multiple genes involved in NER pathway predict prognosis of gastric cancer. Oncotarget 2016, 7, 48130–48142. [Google Scholar] [CrossRef] [Green Version]
  40. Guo, H.; Bassig, B.A.; Lan, Q.; Zhu, Y.; Zhang, Y.; Holford, T.R.; Leaderer, B.; Boyle, P.; Qin, Q.; Zhu, C.; et al. Polymorphisms in DNA repair genes, hair dye use, and the risk of non-Hodgkin lymphoma. Cancer Causes Control 2014, 25, 1261–1270. [Google Scholar] [CrossRef] [Green Version]
  41. Das, R.; Kundu, S.; Laskar, S.; Choudhury, Y.; Ghosh, S.K. Assessment of DNA repair susceptibility genes identified by whole exome sequencing in head and neck cancer. DNA Repair 2018, 66–67, 50–63. [Google Scholar] [CrossRef]
  42. Van Kan, M.; Burns, K.E.; Helsby, N.A. A systematic review of inter-individual differences in the DNA repair processes involved in melphalan monoadduct repair in relation to treatment outcomes. Cancer Chemother. Pharmacol. 2021, 88, 755–769. [Google Scholar] [CrossRef] [PubMed]
Figure 1. PMs exposure by lag days. Original or * log-transformed concentrations of PM10, PM2.5–10, and PM2.5 were compared among lag days using ANOVA. ANOVA, analysis of variance.
Ijerph 19 06241 g001
Table 1. Baseline characteristics of participants.
CharacteristicTotal (N = 527)Male (N = 136)Female (N = 391)p-Value
No. of visit, mean ± SE3.3 ± 0.13.2 ± 0.13.4 ± 0.10.0710
Age, mean ± SE (range) (year)70.8 ± 0.2 (60~87)71.4 ± 0.4 (62~84)70.6 ± 0.3 (60~87)0.0812
Height, mean ± SE (cm)154.7 ± 0.3 164.3 ± 0.4151.4 ± 0.3<0.0001
Weight, mean ± SE (kg)59.4 ± 0.465.8 ± 0.857.1 ± 0.4<0.0001
BMI, n (%) (kg/m2)
 ≥3022 (4.2)5 (3.7)17 (4.3)0.5866
 25~<30211 (40.0)50 (36.7)161 (41.2)
 <25294 (55.8)81 (59.6)213 (54.5)
No. of current smokers, (%)30 (5.7)29 (21.3)1 (0.3)<0.0001
PARP4 rs12863638, n (%)
 GG238 (45.5)63 (46.3)175 (45.2)0.3452
 GT238 (45.5)57 (41.9)181 (46.8)
 TT47 (9.0)16 (11.8)31 (8.0)
PARP4 rs3783073, n (%)
 CC214 (41.1)61 (45.2)153 (39.6)0.2334
 CT245 (47.0)63 (46.7)182 (47.2)
 TT62 (11.9)11 (8.1)51 (13.2)
PARP4 rs2275660, n (%)
 AA231 (44.4)50 (37.0)181 (47.0)0.0921
 AG222 (42.7)68 (50.4)154 (40.0)
 GG67 (12.9)17 (12.6)50 (13.0)
ERCC1 rs11615, n (%)
 CC291 (55.2)74 (54.4)217 (55.5)0.9664
 CT203 (38.5)53 (39.0)150 (38.4)
 TT33 (6.3)9 (6.6)24 (6.1)
ERCC1 rs3212961, n (%)
 CC137 (26.4)37 (27.2)100 (51.1)0.9334
 CA265 (51.2)70 (51.5)195 (51.1)
 AA116 (22.4)29 (21.3)87 (22.8)
BMI, body mass index; SE, standard error.
Table 2. Distribution of repeated measures during the study period.
Selected Percentiles
Repeated MeasureNMean (SE)10th25th50th75th90th95th
Urinary cotinine level, μg/g creatinine1576240.7 (34.7)0.50.92.21.716.8286.2
Fasting glucose level in serum, mmol/L10655.5 (0.04)4.64.85.25.86.77.4
PM10, μg/m3169743.4 (0.4)22.531.040.253.763.579.0
PM2.5–10, μg/m3169719.9 (0.3)8.611.216.727.433.441.1
PM2.5, μg/m3171623.6 (0.2)13.618.023.627.032.037.8
Outdoor temperature, °C175216.8 (0.2)3.011.018.224.326.226.7
Dewpoint, °C17526.2 (0.2)−8.3−2.46.614.919.319.8
SE, standard error. Individual average concentrations of PM10, PM2.5–10, PM2.5, outdoor temperature and dewpoint from health examination day to lag day 7 were used for the calculation of mean and selected percentiles.
Table 3. Relations between PMs at each lag day and glucose level.
PM10 PM2.5–10 PM2.5
Lag Day% Change (95% CI)p-Value% Change (95% CI)p-Value% Change (95% CI)p-Value
00.7 (−0.3, 1.6)0.17271.7 (0.1, 3.2)0.03430.4 (−1.5, 2.3)0.6952
10.2 (−0.9, 1.2)0.7658−0.2 (−2.1, 1.7)0.81920.8 (−1.1, 2.6)0.4249
20.6 (−0.5, 1.7)0.27421.0 (−0.9, 2.9)0.30751.2 (-0.8, 3.2)0.2396
31.2 (0.2, 2.2)0.01911.9 (0.1, 3.8)0.04221.8 (0.03, 3.5)0.0464
41.4 (0.5, 2.3)0.00233.0 (1.2, 4.8)0.00102.0 (0.4, 3.5)0.0134
50.8 (−0.03, 1.7)0.05941.7 (0.03, 3.3)0.04591.9 (0.2, 3.5)0.0244
60.9 (0.1, 1.7)0.02041.7 (0.4, 3.0)0.00931.3 (−0.2, 2.9)0.0976
71.2 (0.4, 2.0)0.00322.4 (1.0, 3.7)0.00051.6 (−0.1, 3.3)0.0656
After glucose levels were log-transformed for their normality, percent changes in glucose levels by IQR-changes of PM10 (22.7 μg/m3), PM2.5–10 (16.2 μg/m3), and PM2.5 (9.0 μg/m3) were obtained after adjusted for age, sex, BMI, urinary cotinine level, and outdoor temperature and dewpoint of the day. BMI, body mass index; CI, confidence interval; IQR, inter-quartile range.
Table 4. Relations between PMs at lag day 4 and glucose level by genotypes or combined diplotypes of repair genes.
PM10 PM2.5–10 PM2.5
GeneGenotype or DiplotypeNo. (%)% Change (95% CI)p-Valuep-Value for Interaction% Change(95% CI)p-Valuep-Value for Interaction% Change(95% CI)p-Valuep-Value for Interaction
PARP4rs12863638
GG238 (45.5)1.9 (0.4, 3.3)0.01280.44112.9 (−0.1, 6.0)0.05730.65773.4 (1.0, 5.8)0.00640.1085
GT238 (45.5)1.1 (−0.2, 2.3)0.0964 3.4 (1.0, 5.8)0.0055 0.5 (–1.7, 2.7)0.6626
TT47 (9.0)−1.0 (−4.3, 2.3)0.5639 −1.9 (−8.4, 4.6)0.5770 –2.0 (–7.6, 3.5)0.4755
rs3783073
CC214 (41.1)2.0 (0.5, 3.5)0.00970.50464.4 (1.4, 7.3)0.00410.43872.8 (0.1, 5.5)0.04170.6745
CT245 (47.0)1.2 (−0.2, 2.5)0.0861 2.1 (−0.5, 4.8)0.1174 1.9 (–0.4, 4.2)0.1055
TT62 (11.9)0.6 (−1.3, 2.5)0.5370 1.2 (–2.7, 5.2)0.5377 0.8 (–2.2, 3.9)0.5929
rs2275660
AA231 (44.4)0.6 (−0.6, 1.8)0.32550.01291.5 (–0.9, 3.9)0.23660.08530.6 (–1.3, 2.6)0.54310.0033
AG222 (42.7)1.6 (0.1, 3.0)0.0389 3.7 (0.9, 6.5)0.0099 1.8 (–0.8, 4.4)0.1742
GG67 (12.9)5.1 (1.7, 8.4)0.0042 9.1 (2.3, 15.9)0.0113 8.8 (3.1, 14.6)0.0038
Without G-C-G haplotype251 (49.0)0.4 (–0.7, 1.6)0.46470.02621.0 (–0.7, 2.7)0.24850.08020.1 (–0.7, 0.9)0.82770.0191
With G-C-G haplotype261 (51.0)2.6 (1.1, 4.0)0.0006 3.5 (1.4, 5.5)0.0009 1.6 (0.6, 2.6)0.0020
ERCC1rs11615
CC291 (55.2)0.3 (−0.8, 1.5)0.57810.05290.8 (–1.5, 3.2)0.48740.16840.3 (–1.6, 2.3), 0.74100.0399
CT203 (38.5)2.5 (1.0, 4.1)0.0015 5.3 (2.3, 8.2)0.0005 3.6 (0.8, 6.3)0.0120
TT33 (6.3)3.1 (−0.2, 6.5)0.0785 6.1 (–1.2, 13.3)0.1147 5.2 (–0.4, 10.7)0.0796
rs3212961
CC137 (26.4)2.7 (1.0, 4.5)0.00260.34175.2 (1.8, 8.7)0.00340.37334.2 (1.2, 7.1)0.00690.2007
CA265 (51.2)0.9 (−0.3, 2.2)0.1348 2.8 (0.3, 5.3)0.0282 0.9 (–1.2, 3.0)0.4108
AA116 (22.4)1.2 (−1.0, 3.3)0.2822 0.8 (–3.6, 5.1)0.7301 2.7 (–0.9, 6.2)0.1415
Without T-C haplotype295 (56.9)0.9 (–0.3, 2.1)0.15650.17461.2 (–0.6, 3.0)0.19900.15480.5 (–0.3, 1.3)0.19980.2609
With T-C haplotype223 (43.1)2.2 (0.9, 3.6)0.0016 3.5 (1.6, 5.4)0.0003 1.2 (0.2, 2.2)0.0158
After glucose levels were log transformed for their normality, percent changes in glucose levels by IQR changes in PM10 (22.7 μg/m3), PM2.5–10 (16.2 μg/m3), and PM2.5 (9.0 μg/m3) were obtained after adjusting for age, sex, BMI, urinary cotinine level, outdoor temperature and dewpoint of the day, by genotypes or combined diplotypes of repair genes. p-Value for interaction between PM exposure and genotypes or diplotypes was also evaluated. Each haplotype was composed of rs12863638, rs3783073, and rs2275660 for PARP4, and rs11615 and rs3212961 for ERCC1. BMI, body mass index; CI, confidence interval; IQR, inter-quartile range.
Publisher’s Note: MDPI stays neutral with regard to jurisdictional claims in published maps and institutional affiliations.

