
SarQoL Questionnaire in Community-Dwelling Older Adults under EWGSOP2 Sarcopenia Diagnosis Algorithm: A New Screening Method?

 , , , , ,
  and
and
Abstract
:1. Introduction
2. Material and Methods
2.1. Study Design and Recruitment of the Sample
2.2. General Assessments
2.2.1. Sarcopenia
Handgrip Strength (Upper Body Strength) and Sit-to-Stand Test (Lower Body Strength)
Appendicular Skeletal Muscle Mass (ASMM)
Physical Performance (Gait Speed)
2.2.2. Physical Activity Quantification
2.2.3. Frailty Status
2.2.4. Nutritional Status
2.3. Quality of Life (SarQoL)
2.4. Statistical Analysis
3. Results
4. Discussion
5. Conclusions
Author Contributions
Funding
Institutional Review Board Statement
Informed Consent Statement
Data Availability Statement
Conflicts of Interest
References
- Cruz-Jentoft, A.J.; Bahat, G.; Bauer, J.; Boirie, Y.; Bruyère, O.; Cederholm, T.; Cooper, C.; Landi, F.; Rolland, Y.; Sayer, A.A.; et al. Sarcopenia: Revised European Consensus on Definition and Diagnosis. Age Ageing 2019, 48, 16–31. [Google Scholar] [CrossRef] [PubMed] [Green Version]
- Schaap, L.A.; van Schoor, N.M.; Lips, P.; Visser, M. Associations of Sarcopenia Definitions, and Their Components, with the Incidence of Recurrent Falling and Fractures: The Longitudinal Aging Study Amsterdam. J. Gerontol. A Biol. Sci. Med. Sci. 2018, 73, 1199–1204. [Google Scholar] [CrossRef] [PubMed]
- Ibrahim, K.; May, C.; Patel, H.P.; Baxter, M.; Sayer, A.A.; Roberts, H. A Feasibility Study of Implementing Grip Strength Measurement into Routine Hospital Practice (GRImP): Study Protocol. Pilot Feasibility Stud. 2016, 2, 27. [Google Scholar] [CrossRef] [PubMed] [Green Version]
- Leong, D.P.; Teo, K.K.; Rangarajan, S.; Lopez-Jaramillo, P.; Avezum, A.; Orlandini, A.; Seron, P.; Ahmed, S.H.; Rosengren, A.; Kelishadi, R.; et al. Prognostic Value of Grip Strength: Findings from the Prospective Urban Rural Epidemiology (PURE) Study. Lancet Lond. Engl. 2015, 386, 266–273. [Google Scholar] [CrossRef]
- Alley, D.E.; Shardell, M.D.; Peters, K.W.; McLean, R.R.; Dam, T.-T.L.; Kenny, A.M.; Fragala, M.S.; Harris, T.B.; Kiel, D.P.; Guralnik, J.M.; et al. Grip Strength Cutpoints for the Identification of Clinically Relevant Weakness. J. Gerontol. A Biol. Sci. Med. Sci. 2014, 69, 559–566. [Google Scholar] [CrossRef]
- Han, A.; Bokshan, S.L.; Marcaccio, S.E.; DePasse, J.M.; Daniels, A.H. Diagnostic Criteria and Clinical Outcomes in Sarcopenia Research: A Literature Review. J. Clin. Med. 2018, 7, 70. [Google Scholar] [CrossRef] [Green Version]
- Roubenoff, R.; Hughes, V.A. Sarcopenia: Current Concepts. J. Gerontol. A Biol. Sci. Med. Sci. 2000, 55, 716. [Google Scholar] [CrossRef] [Green Version]
- Sayer, A.; Syddall, H.; Martin, H.; Patel, H.; Baylis, D.; Cooper, C. The Developmental Origins of Sarcopenia. J. Nutr. Health Aging 2008, 12, 427–432. [Google Scholar] [CrossRef] [Green Version]
- Bravo-José, P.; Moreno, E.; Espert, M.; Romeu, M.; Martínez, P.; Navarro, C. Prevalence of Sarcopenia and Associated Factors in Institutionalised Older Adult Patients. Clin. Nutr. ESPEN 2018, 27, 113–119. [Google Scholar] [CrossRef]
- Cuesta, F.; Formiga, F.; Lopez-Soto, A.; Masanes, F.; Ruiz, D.; Artaza, I.; Salvà, A.; Serra-Rexach, J.A.; Rojano, I.; Luque, X.; et al. Prevalence of Sarcopenia in Patients Attending Outpatient Geriatric Clinics: The ELLI Study. Age Ageing 2015, 44, 807–809. [Google Scholar] [CrossRef] [Green Version]
- Salvà, A.; Serra-Rexach, J.A.; Artaza, I.; Formiga, F.; Rojano, I.; Luque, X.; Cuesta, F.; López-Soto, A.; Masanés, F.; Ruiz, D.; et al. Prevalence of Sarcopenia in Spanish Nursing Homes: Comparison of the Results of the ELLI Study with Other Populations. Rev. Esp. Geriatr. Gerontol. 2016, 51, 260–264. [Google Scholar] [CrossRef] [PubMed]
- Bianchi, L.; Abete, P.; Bellelli, G.; Bo, M.; Cherubini, A.; Corica, F.; Di Bari, M.; Maggio, M.; Manca, G.M.; Rizzo, M.R.; et al. Prevalence and Clinical Correlates of Sarcopenia, Identified According to the EWGSOP Definition and Diagnostic Algorithm, in Hospitalized Older People: The GLISTEN Study. J. Gerontol. A Biol. Sci. Med. Sci. 2017, 72, 1575–1581. [Google Scholar] [CrossRef] [PubMed]
- Mayhew, A.J.; Amog, K.; Phillips, S.; Parise, G.; McNicholas, P.D.; de Souza, R.J.; Thabane, L.; Raina, P. The Prevalence of Sarcopenia in Community-Dwelling Older Adults, an Exploration of Differences between Studies and within Definitions: A Systematic Review and Meta-Analyses. Age Ageing 2019, 48, 48–56. [Google Scholar] [CrossRef] [Green Version]
- Simsek, H.; Meseri, R.; Sahin, S.; Kilavuz, A.; Bicakli, D.H.; Uyar, M.; Savas, S.; Sarac, F.; Akcicek, F. Prevalence of Sarcopenia and Related Factors in Community-Dwelling Elderly Individuals. Saudi Med. J. 2019, 40, 568–574. [Google Scholar] [CrossRef]
- Bahat, G.; Tufan, A.; Kilic, C.; Karan, M.A.; Cruz-Jentoft, A.J. Prevalence of Sarcopenia and Its Components in Community-Dwelling Outpatient Older Adults and Their Relation with Functionality. Aging Male Off. J. Int. Soc. Study Aging Male 2018, 23, 424–430. [Google Scholar] [CrossRef]
- Masanes, F.; Culla, A.; Navarro-Gonzalez, M.; Navarro-Lopez, M.; Sacanella, E.; Torres, B.; Lopez-Soto, A. Prevalence of Sarcopenia in Healthy Community-Dwelling Elderly in an Urban Area of Barcelona (Spain). J. Nutr. Health Aging 2012, 16, 184–187. [Google Scholar] [CrossRef]
- Guillamón-Escudero, C.; Diago-Galmés, A.; Tenías-Burillo, J.M.; Soriano, J.M.; Fernández-Garrido, J.J. Prevalence of Sarcopenia in Community-Dwelling Older Adults in Valencia, Spain. Int. J. Environ. Res. Public Health 2020, 17, 9130. [Google Scholar] [CrossRef] [PubMed]
- Zhang, X.; Zhang, W.; Wang, C.; Tao, W.; Dou, Q.; Yang, Y. Sarcopenia as a Predictor of Hospitalization among Older People: A Systematic Review and Meta-Analysis. BMC Geriatr. 2018, 18, 188. [Google Scholar] [CrossRef]
- Sobestiansky, S.; Michaelsson, K.; Cederholm, T. Sarcopenia Prevalence and Associations with Mortality and Hospitalisation by Various Sarcopenia Definitions in 85–89 Year Old Community-Dwelling Men: A Report from the ULSAM Study. BMC Geriatr. 2019, 19, 318. [Google Scholar] [CrossRef]
- Rizzoli, R.; Reginster, J.-Y.; Arnal, J.-F.; Bautmans, I.; Beaudart, C.; Bischoff-Ferrari, H.; Biver, E.; Boonen, S.; Brandi, M.-L.; Chines, A.; et al. Quality of Life in Sarcopenia and Frailty. Calcif. Tissue Int. 2013, 93, 101–120. [Google Scholar] [CrossRef]
- Puts, M.T.E.; Shekary, N.; Widdershoven, G.; Heldens, J.; Lips, P.; Deeg, D.J.H. What Does Quality of Life Mean to Older Frail and Non-Frail Community-Dwelling Adults in the Netherlands? Qual. Life Res. Int. J. Qual. Life Asp. Treat. Care Rehabil. 2007, 16, 263–277. [Google Scholar] [CrossRef] [PubMed]
- Sieber, C.C. Malnutrition and Sarcopenia. Aging Clin. Exp. Res. 2019, 31, 793–798. [Google Scholar] [CrossRef] [PubMed]
- Cruz-Jentoft, A.J.; Kiesswetter, E.; Drey, M.; Sieber, C.C. Nutrition, Frailty, and Sarcopenia. Aging Clin. Exp. Res. 2017, 29, 43–48. [Google Scholar] [CrossRef] [PubMed]
- Greco, E.A.; Pietschmann, P.; Migliaccio, S. Osteoporosis and Sarcopenia Increase Frailty Syndrome in the Elderly. Front. Endocrinol. Lausanne 2019, 10, 255. [Google Scholar] [CrossRef] [PubMed]
- Beaudart, C.; Biver, E.; Reginster, J.-Y.; Rizzoli, R.; Rolland, Y.; Bautmans, I.; Petermans, J.; Gillain, S.; Buckinx, F.; Dardenne, N.; et al. Validation of the SarQoL®, a Specific Health-Related Quality of Life Questionnaire for Sarcopenia. J. Cachexia Sarcopenia Muscle 2017, 8, 238–244. [Google Scholar] [CrossRef]
- Fábrega-Cuadros, R.; Martínez-Amat, A.; Cruz-Díaz, D.; Aibar-Almazán, A.; Hita-Contreras, F. Psychometric Properties of the Spanish Version of the Sarcopenia and Quality of Life, a Quality of Life Questionnaire Specific for Sarcopenia. Calcif. Tissue Int. 2020, 106, 274–282. [Google Scholar] [CrossRef]
- Montero-Errasquín, B.; Vaquero-Pinto, N.; Sánchez-Cadenas, V.; Geerinck, A.; Sánchez-García, E.; Mateos-Nozal, J.; Ribera-Casado, J.M.; Cruz-Jentoft, A.J. Spanish Translation, Cultural Adaptation and Validation of the SarQoL®: A Specific Health-Related Quality of Life Questionnaire for Sarcopenia. BMC Musculoskelet. Disord. 2022, 23, 191. [Google Scholar] [CrossRef]
- Malmstrom, T.K.; Morley, J.E. SARC-F: A Simple Questionnaire to Rapidly Diagnose Sarcopenia. J. Am. Med. Dir. Assoc. 2013, 14, 531–532. [Google Scholar] [CrossRef]
- World Medical Association Declaration of Helsinki: Ethical Principles for Medical Research Involving Human Subjects. JAMA 2013, 310, 2191–2194. [CrossRef] [Green Version]
- Hamasaki, H.; Kawashima, Y.; Katsuyama, H.; Sako, A.; Goto, A.; Yanai, H. Association of Handgrip Strength with Hospitalization, Cardiovascular Events, and Mortality in Japanese Patients with Type 2 Diabetes. Sci. Rep. 2017, 7, 7041. [Google Scholar] [CrossRef] [Green Version]
- Trosclair, D.; Bellar, D.; Judge, L.W.; Smith, J.; Mazerat, N.; Brignac, A. Hand-Grip Strength as a Predictor of Muscular Strength and Endurance. J. Strength Cond. Res. 2011, 25, S99. [Google Scholar] [CrossRef]
- Gopinath, B.; Kifley, A.; Liew, G.; Mitchell, P. Handgrip Strength and Its Association with Functional Independence, Depressive Symptoms and Quality of Life in Older Adults. Maturitas 2017, 106, 92–94. [Google Scholar] [CrossRef] [PubMed] [Green Version]
- Cooper, C.; Fielding, R.; Visser, M.; van Loon, L.J.; Rolland, Y.; Orwoll, E.; Reid, K.; Boonen, S.; Dere, W.; Epstein, S.; et al. Tools in the Assessment of Sarcopenia. Calcif. Tissue Int. 2013, 93, 201–210. [Google Scholar] [CrossRef] [PubMed]
- Kyle, U.G.; Genton, L.; Hans, D.; Pichard, C. Validation of a Bioelectrical Impedance Analysis Equation to Predict Appendicular Skeletal Muscle Mass (ASMM). Clin. Nutr. Edinb. Scotl. 2003, 22, 537–543. [Google Scholar] [CrossRef]
- Alvero-Cruz, J.R.; Correas Gómez, L.; Ronconi, M.; Fernández Vázquez, R.; Porta i Manzañido, J. La Bioimpedancia Eléctrica Como Método de Estimación de La Composición Corporal, Normas Prácticas de Utilización. Rev. Andal. Med. Deporte 2011, 4, 167–174. [Google Scholar]
- Studenski, S.; Perera, S.; Patel, K.; Rosano, C.; Faulkner, K.; Inzitari, M.; Brach, J.; Chandler, J.; Cawthon, P.; Connor, E.B.; et al. Gait Speed and Survival in Older Adults. JAMA J. Am. Med. Assoc. 2011, 305, 50–58. [Google Scholar] [CrossRef] [Green Version]
- Rubio Castañeda, F.J.; Tomas Aznar, C. Medición de La Actividad Física En Personas Mayores de 65 Años Mediante El IPAQ-E: Validez de Contenido, Fiabilidad y Factores Asociados. Rev. Esp. Salud Pública 2017, 91. [Google Scholar]
- Roman-Viñas, B.; Serra-Majem, L.; Hagströmer, M.; Ribas-Barba, L.; Sjöström, M.; Segura-Cardona, R. International Physical Activity Questionnaire: Reliability and Validity in a Spanish Population. Eur. J. Sport Sci. 2010, 10, 297–304. [Google Scholar] [CrossRef]
- Salaffi, F.; Di Carlo, M.; Carotti, M.; Farah, S.; Giovagnoni, A. Frailty Prevalence According to the Survey of Health, Ageing and Retirement in Europe-Frailty Instrument (SHARE-FI) Definition, and Its Variables Associated, in Patients with Symptomatic Knee Osteoarthritis: Findings from a Cross-Sectional Study. Aging Clin. Exp. Res. 2021, 33, 1519–1527. [Google Scholar] [CrossRef]
- Romero Ortuño, R. El Instrumento de Fragilidad Para Atención Primaria de La Encuesta de Salud, Envejecimiento y Jubilación En Europa (SHARE-FI): Resultados de La Muestra Española. Rev. Esp. Geriatría Gerontol. 2011, 46, 243–249. [Google Scholar] [CrossRef]
- Donini, L.M.; Marrocco, W.; Marocco, C.; Lenzi, A. Validity of the Self- Mini Nutritional Assessment (Self- MNA) for the Evaluation of Nutritional Risk. A Cross- Sectional Study Conducted in General Practice. J. Nutr. Health Aging 2018, 22, 44–52. [Google Scholar] [CrossRef] [PubMed]
- Cuerda, C.; Álvarez, J.; Ramos, P.; Abánades, J.C.; García-de-Lorenzo, A.; Gil, P.; De-la-Cruz, J.J. Prevalence of Malnutrition in Subjects over 65 Years of Age in the Community of Madrid. The DREAM + 65 Study. Nutr. Hosp. 2016, 33, 101. [Google Scholar] [CrossRef] [PubMed]
- Beaudart, C.; Edwards, M.; Moss, C.; Reginster, J.-Y.; Moon, R.; Parsons, C.; Demoulin, C.; Rizzoli, R.; Biver, E.; Dennison, E.; et al. English Translation and Validation of the SarQoL®, a Quality of Life Questionnaire Specific for Sarcopenia. Age Ageing 2017, 46, 271–276. [Google Scholar] [CrossRef] [Green Version]
- Beaudart, C.; Locquet, M.; Reginster, J.-Y.; Delandsheere, L.; Petermans, J.; Bruyère, O. Quality of Life in Sarcopenia Measured with the SarQoL®: Impact of the Use of Different Diagnosis Definitions. Aging Clin. Exp. Res. 2018, 30, 307–313. [Google Scholar] [CrossRef] [PubMed] [Green Version]
- Tsekoura, M.; Kastrinis, A.; Katsoulaki, M.; Billis, E.; Gliatis, J. Sarcopenia and Its Impact on Quality of Life. Adv. Exp. Med. Biol. 2017, 987, 213–218. [Google Scholar] [CrossRef] [PubMed]
- Chen, L.-K.; Woo, J.; Assantachai, P.; Auyeung, T.-W.; Chou, M.-Y.; Iijima, K.; Jang, H.C.; Kang, L.; Kim, M.; Kim, S.; et al. Asian Working Group for Sarcopenia: 2019 Consensus Update on Sarcopenia Diagnosis and Treatment. J. Am. Med. Dir. Assoc. 2020, 21, 300–307.e2. [Google Scholar] [CrossRef] [PubMed]
- Rodriguez-Rejon, A.I.; Artacho, R.; Puerta, A.; Zuñiga, A.; Ruiz-Lopez, M.D. Diagnosis of Sarcopenia in Long-Term Care Homes for the Elderly: The Sensitivity and Specificity of Two Simplified Algorithms with Respect to the EWGSOP Consensus. J. Nutr. Health Aging 2018, 22, 796–801. [Google Scholar] [CrossRef]
- Studenski, S.; Peters, K.; Alley, D.; Cawthon, P.; Mclean, R.; Harris, T.; Ferrucci, L.; Guralnik, J.; Fragala, M.; Kenny, A.; et al. The FNIH Sarcopenia Project: Rationale, Study Description, Conference Recommendations, and Final Estimates. J. Gerontol. A Biol. Sci. Med. Sci. 2014, 69, 547–558. [Google Scholar] [CrossRef]
- Fielding, R.A.; Vellas, B.; Evans, W.J.; Bhasin, S.; Morley, J.E.; Newman, A.B.; Abellan van Kan, G.; Andrieu, S.; Bauer, J.; Breuille, D.; et al. Sarcopenia: An Undiagnosed Condition in Older Adults. Current Consensus Definition: Prevalence, Etiology, and Consequences. International Working Group on Sarcopenia. J. Am. Med. Dir. Assoc. 2011, 12, 249–256. [Google Scholar] [CrossRef] [Green Version]
- Kim, M.; Won, C.W. Prevalence of Sarcopenia in Community-Dwelling Older Adults Using the Definition of the European Working Group on Sarcopenia in Older People 2: Findings from the Korean Frailty and Aging Cohort Study. Age Ageing 2019, 48, 910–916. [Google Scholar] [CrossRef]
- Patel, H.P.; Syddall, H.E.; Jameson, K.; Robinson, S.; Denison, H.; Roberts, H.C.; Edwards, M.; Dennison, E.; Cooper, C.; Aihie Sayer, A. Prevalence of Sarcopenia in Community-Dwelling Older People in the UK Using the European Working Group on Sarcopenia in Older People (EWGSOP) Definition: Findings from the Hertfordshire Cohort Study (HCS). Age Ageing 2013, 42, 378–384. [Google Scholar] [CrossRef] [PubMed] [Green Version]
- Yang, M.; Liu, Y.; Zuo, Y.; Tang, H. Sarcopenia for Predicting Falls and Hospitalization in Community-Dwelling Older Adults: EWGSOP versus EWGSOP2. Sci. Rep. 2019, 9, 17636. [Google Scholar] [CrossRef] [PubMed]
- Martone, A.M.; Bianchi, L.; Abete, P.; Bellelli, G.; Bo, M.; Cherubini, A.; Corica, F.; Di Bari, M.; Maggio, M.; Manca, G.M.; et al. The Incidence of Sarcopenia among Hospitalized Older Patients: Results from the Glisten Study. J. Cachexia Sarcopenia Muscle 2017, 8, 907–914. [Google Scholar] [CrossRef] [PubMed]
- Geerinck, A.; Dawson-Hughes, B.; Beaudart, C.; Locquet, M.; Reginster, J.-Y.; Bruyère, O. Assessment of the Performance of the SarQoL® Questionnaire in Screening for Sarcopenia in Older People. Aging Clin. Exp. Res. 2021, 33, 2149–2155. [Google Scholar] [CrossRef] [PubMed]
- Volpato, S.; Bianchi, L.; Cherubini, A.; Landi, F.; Maggio, M.; Savino, E.; Bandinelli, S.; Ceda, G.P.; Guralnik, J.M.; Zuliani, G.; et al. Prevalence and Clinical Correlates of Sarcopenia in Community-Dwelling Older People: Application of the EWGSOP Definition and Diagnostic Algorithm. J. Gerontol. A Biol. Sci. Med. Sci. 2014, 69, 438–446. [Google Scholar] [CrossRef]
- Cruz-Jentoft, A.J.; Landi, F.; Schneider, S.M.; Zúñiga, C.; Arai, H.; Boirie, Y.; Chen, L.-K.; Fielding, R.A.; Martin, F.C.; Michel, J.-P.; et al. Prevalence of and Interventions for Sarcopenia in Ageing Adults: A Systematic Review. Report of the International Sarcopenia Initiative (EWGSOP and IWGS). Age Ageing 2014, 43, 748–759. [Google Scholar] [CrossRef]
- Messier, V.; Rabasa-Lhoret, R.; Barbat-Artigas, S.; Elisha, B.; Karelis, A.D.; Aubertin-Leheudre, M. Menopause and Sarcopenia: A Potential Role for Sex Hormones. Maturitas 2011, 68, 331–336. [Google Scholar] [CrossRef]
- Cevei, M.; Onofrei, R.R.; Cioara, F.; Stoicanescu, D. Correlations between the Quality of Life Domains and Clinical Variables in Sarcopenic Osteoporotic Postmenopausal Women. J. Clin. Med. 2020, 9, 441. [Google Scholar] [CrossRef] [Green Version]
- Dorosty, A.; Arero, G.; Chamar, M.; Tavakoli, S. Prevalence of Sarcopenia and Its Association with Socioeconomic Status among the Elderly in Tehran. Ethiop. J. Health Sci. 2016, 26, 389–396. [Google Scholar] [CrossRef] [Green Version]
- Cruz-Jentoft, A.J.; Baeyens, J.P.; Bauer, J.M.; Boirie, Y.; Cederholm, T.; Landi, F.; Martin, F.C.; Michel, J.-P.; Rolland, Y.; Schneider, S.M.; et al. Sarcopenia: European Consensus on Definition and Diagnosis: Report of the European Working Group on Sarcopenia in Older People. Age Ageing 2010, 39, 412–423. [Google Scholar] [CrossRef] [Green Version]
- Marcell, T.J. Sarcopenia: Causes, Consequences, and Preventions. J. Gerontol. A Biol. Sci. Med. Sci. 2003, 58, 911. [Google Scholar] [CrossRef] [PubMed]
- Tarantino, U.; Baldi, J.; Celi, M.; Rao, C.; Liuni, F.M.; Iundusi, R.; Gasbarra, E. Osteoporosis and Sarcopenia: The Connections. Aging Clin. Exp. Res. 2013, 25, 93–95. [Google Scholar] [CrossRef] [PubMed]
- Chen, L.-K.; Liu, L.-K.; Woo, J.; Assantachai, P.; Auyeung, T.-W.; Bahyah, K.S.; Chou, M.-Y.; Chen, L.-Y.; Hsu, P.-S.; Krairit, O.; et al. Sarcopenia in Asia: Consensus Report of the Asian Working Group for Sarcopenia. J. Am. Med. Dir. Assoc. 2014, 15, 95–101. [Google Scholar] [CrossRef]
- Dodds, R.M.; Murray, J.C.; Robinson, S.M.; Sayer, A.A. The Identification of Probable Sarcopenia in Early Old Age Based on the SARC-F Tool and Clinical Suspicion: Findings from the 1946 British Birth Cohort. Eur. Geriatr. Med. 2020, 11, 433–441. [Google Scholar] [CrossRef] [PubMed] [Green Version]


| Total | Men | p-Value | Women | p-Value | |||
|---|---|---|---|---|---|---|---|
| WS * (N = 27) | S ** (N = 11) | WS * (N = 121) | S ** (N = 43) | ||||
| Age (years) | 73 ± 5 | 71 ± 4 | 75 ± 5 | 0.013 | 72 ± 5 | 74 ± 5 | 0.104 |
| Living arrangement | 0.230 | 0.062 | |||||
| With partner | 143 (70.8%) | 27 (100%) | 9 (81.8%) | 86 (71.1%) | 21 (48.8%) | ||
| With son | 5 (2.5%) | 0 (0%) | 0 (0%) | 3 (2.5%) | 2 (4.7%) | ||
| Alone | 6 (3%) | 0 (0%) | 2 (18.2%) | 3 (2.5%) | 1 (2.3%) | ||
| Other | 48 (23.7%) | 0 (0%) | 0 (0%) | 0.165 | 29 (24%) | 19 (44.2%) | 0.045 |
| Education | |||||||
| Elementary school or no degree | 170 (84.1%) | 19 (70.4%) | 11 (100%) | 100 (82.6%) | 40 (94%) | ||
| Secondary school | 22 (10.9%) | 8 (29.6%) | 0 (0%) | 12 (9.9%) | 2 (4.7%) | ||
| University or higher degree | 10 (5%) | 0 (0%) | 0 (0%) | 0.015 | 9 (7.4%) | 1 (2.3%) | 0.001 |
| Frailty status (score) | |||||||
| Non-frail | 85 (42.1%) | 18 (66.7%) | 4 (36.4%) | 54 (44.6%) | 9 (20.9%) | ||
| Pre-frail | 87 (43.1%) | 9 (33.3%) | 4 (36.4%) | 54 (44.6%) | 20 (46.5%) | ||
| Frail | 30 (14.8%) | 0 (0%) | 3 (37.3%) | 0.017 | 13 (10.7%) | 14 (32.6%) | 0.080 |
| Nutritional status (score) | |||||||
| Normal nourished | 127 (62.9%) | 22 (81.5%) | 4 (36.4%) | 76 (62.8%) | 25 (58.1%) | ||
| At risk of malnutrition | 4 (2%) | 0 (0%) | 0 (0%) | 1 (0.8%) | 3 (7%) | ||
| Malnourished | 71 (35.1%) | 5 (18.5%) | 7 (63.6%) | 44 (36.4%) | 15 (14.9%) | ||
| Body mass index (kg/m2) | 27.5 ± 4.2 | 28.2 ± 4.4 | 28.7 ± 4.9 | 0.800 | 27.2 ± 4.2 | 27.7 ± 4.1 | 0.500 |
| Comorbidities | |||||||
| Hypertension | 102 (50.5%) | 18 (66.7%) | 8 (72.7%) | 0.720 | 54 (44.6%) | 22 (51.2%) | 0.460 |
| Dyslipidemia | 90 (44.6%) | 14 (51.9%) | 5 (45.5%) | 0.620 | 51 (42.1%) | 20 (46.5%) | 0.720 |
| Diabetes mellitus 2 | 28 (13.9%) | 6 (22.2%) | 5 (45.5%) | 0.150 | 12 (9.9%) | 5 (11.6%) | 0.750 |
| Osteoporosis | 13 (6.4%) | 1 (3.7%) | 0 (0%) | 0.520 | 9 (7.4%) | 3 (7%) | 0.920 |
| SarQoL | |||||||
| Overall quality of life | 75.3 ± 10.1 | 81.2 ± 10.4 | 69.8 ± 12.5 | 0.006 | 76.9 ± 8.4 | 68.3 ± 9.6 | 0.000 |
| Physical and mental health | 75.7 ± 13.9 | 83.1 ± 12.7 | 69.3 ± 15.3 | 0.007 | 76.8 ± 12.7 | 69.6 ± 14.8 | 0.003 |
| Locomotion | 80.6 ± 15.7 | 86.5 ± 16.3 | 73 ± 15.9 | 0.025 | 83.6 ± 14.4 | 70.5 ± 13.7 | 0.000 |
| Body composition | 65.7 ± 14.9 | 76.2 ± 14.2 | 65.9 ± 15.7 | 0.076 | 64.2 ± 14.5 | 63.3 ± 14 | 0.710 |
| Functionality | 75.3 ± 13.4 | 80.3 ± 14.8 | 67.1 ± 15.3 | 0.018 | 77.9 ± 11.9 | 67.1 ± 11.7 | 0.000 |
| Activities of daily living | 72.4 ± 10.3 | 78.1 ± 10.3 | 65.7 ± 14.8 | 0.005 | 73.8 ± 8.3 | 66.6 ± 10.8 | 0.000 |
| Leisure activities | 67.9 ± 20 | 73.9 ± 19.2 | 60.5 ± 15.3 | 0.046 | 68.4 ± 20.3 | 64.6 ± 20.3 | 0.290 |
| Fears | 88.9 ± 17.5 | 94 ± 14 | 95.5 ± 10.1 | 0.750 | 89 ± 17.3 | 83.4 ± 20.2 | 0.110 |
| Physical activity parameters | |||||||
| METS (score) | 855.4 ± 420.3 | 1212.1 ± 644.6 | 821 ± 448.1 | 0.043 | 845 ± 342.9 | 669.5 ± 294.2 | 0.003 |
| ASMM (kg) | 17.8 ± 3.6 | 23.2 ± 2.9 | 23.1 ± 3.2 | 0.990 | 16.5 ± 2.4 | 16.6 ± 2.8 | 0.850 |
| Handgrip strength (kg) | 22.4 ± 7.7 | 35.6 ± 7 | 30.1 ± 5 | 0.023 | 21.4 ± 3.8 | 15.1 ± 4.3 | 0.000 |
| Gait speed (m/s) | 1.01 ± 0.22 | 1 ± 0.2 | 0.9 ± 0.2 | 0.043 | 1.1 ± 0.2 | 0.9 ± 0.2 | 0.000 |
| Sit to stand test (s) | 11.9 ± 3.6 | 10.8 ± 2.6 | 17.4 ± 3.4 | 0.000 | 10.5 ± 2.1 | 14.9 ± 4.4 | 0.000 |
| Age | BMI | Weekly Physical Activity (METS) | Appendicular Skeletal Muscle Mass | Handgrip Strength | Sit to Stand Test | Gait Speed | ||
|---|---|---|---|---|---|---|---|---|
| Physical and mental health (D1) | Men | 0.341 | −0.291 | 0.422 | −0.13 | 0.133 | −0.565 | 0.363 |
| Women | −0.202 | −0.164 | 0.331 | −0.077 | 0.147 | −0.240 | 0.096 | |
| Locomotion (D2) | Men | −0.351 | −0.412 | 0.538 | −0.24 | 0.198 | −0.575 | 0.544 |
| Women | −0.247 | −0.284 | 0.424 | −0.106 | 0.328 | −0.381 | 0.351 | |
| Body composition (D3) | Men | −0.062 | −0.265 | 0.132 | −0.088 | −0.04 | −0.176 | −0.022 |
| Women | −0.235 | 0.123 | 0.195 | 0.079 | −0.059 | −0.039 | 0.104 | |
| Functionality (D4) | Men | −0.390 | −0.344 | 0.510 | −0.161 | 0.397 | −0.589 | 0.514 |
| Women | −0.198 | −0.301 | 0.267 | −0.153 | 0.267 | −0.396 | 0.384 | |
| Activities of daily living (D5) | Men | −0.361 | −0.365 | 0.331 | −0.224 | 0.269 | −0.422 | 0.413 |
| Women | −0.236 | −0.168 | −0.316 | −0.038 | 0.326 | −0.201 | −0.281 | |
| Leisure activities (D6) | Men | −0.232 | −0.16 | 0.387 | −0.074 | 0.251 | −0.262 | 0.097 |
| Women | −0.243 | 0.011 | 0.332 | 0.015 | 0.061 | −0.231 | 0.163 | |
| Fears (D7) | Men | −0.068 | −0.368 | 0.268 | −0.051 | 0.171 | −0.094 | 0.252 |
| Women | −0.106 | −0.238 | 0.016 | −0.13 | 0.072 | −0.192 | 0.255 | |
| SarQoL Total | Men | −0.350 | −0.423 | 0.521 | −0.21 | 0.33 | −0.592 | 0.513 |
| Women | −0.305 | −0.279 | 0.406 | −0.120 | 0.314 | −0.394 | 0.383 |
| Independent Variable | Men | Independent Variable | Women | ||||||||||||||
|---|---|---|---|---|---|---|---|---|---|---|---|---|---|---|---|---|---|
| B | SE | Beta | T | p | R2 | Adjusted R2 | Model Significance | B | SE | Beta | T | p | R2 | Adjusted R2 | Model Significance | ||
| D1 Physical and mental health | D1 Physical and mental health | ||||||||||||||||
| 1. Age | −0.323 | 0.509 | −0.999 | −0.364 | 0.53 | 0.44 | 0.37 | 0.001 | 1. Age | −0.306 | 0.210 | −0.116 | −1.455 | 0.148 | 0.152 | 0.13 | 0.0001 |
| 2. METS | 0.005 | 0.003 | 0.22 | 1.531 | 0.135 | 2. BMI | −0.441 | 0.245 | −0.135 | −1.802 | 0.074 | ||||||
| 3. Sit To Stand Test | −1.655 | 0.609 | −0.469 | −2.715 | 0.01 | 3. METS | 0.009 | 0.003 | 0.235 | 3.007 | 0.003 | ||||||
| 4. Gait Speed | 2.503 | 12.22 | 0.034 | 0.205 | 0.839 | 4. Sit To Stand Test | −0.595 | 0.302 | −0.151 | −1.970 | 0.051 | ||||||
| D2 Locomotion | D2 Locomotion | ||||||||||||||||
| 1. Age | −0.313 | 0.498 | −0.082 | −0.628 | 0.534 | 0.628 | 0.57 | 0.0001 | 1. Age | −0.460 | 0.208 | −0.154 | −2.215 | 0.028 | 0.339 | 0.323 | 0.0001 |
| 2. BMI | −1.568 | 0.424 | −0.411 | −3.703 | 0.001 | 2. BMI | −1.296 | 0.241 | −0.352 | −5.368 | 0.000 | ||||||
| 3. METS | 0.007 | 0.003 | 0.254 | 2.128 | 0.041 | 3. METS | 0.013 | 0.003 | 0.287 | 4.178 | 0.000 | ||||||
| 4. Sit To Stand Test | −0.634 | 0.598 | −0.154 | −0.106 | 0.297 | 4. Handgrip | 0.760 | 0.212 | 0.238 | 3.581 | 0.000 | ||||||
| 5. Gait Speed | 27.324 | 11.810 | 0.320 | 2.314 | 0.027 | ||||||||||||
| D3 Body Composition | D3 Body Composition | ||||||||||||||||
| 1. Age | −0.583 | 0.224 | −0.209 | −2.604 | 0.010 | 0.066 | 0.054 | 0.004 | |||||||||
| 2. METS | 0.004 | 0.003 | 0.097 | 1.209 | 0.228 | ||||||||||||
| D4 Functionality | D4 Functionality | ||||||||||||||||
| 1. Age | −0.134 | 0.527 | −0.038 | −0.254 | 0.801 | 0.6 | 0.522 | 0.0001 | 1. Age | −0.258 | 0.191 | −0.104 | −1.353 | 0.178 | 0.312 | 0.285 | 0.0001 |
| 2. BMI | −1.170 | 0.427 | −0.330 | −2.736 | 0.010 | 2. BMI | −0.898 | 0.213 | −0.293 | −4.214 | 0.000 | ||||||
| 3. METS | 0.006 | 0.003 | 0.239 | 1.894 | 0.068 | 3. METS | 0.004 | 0.003 | 0.116 | 1.632 | 0.105 | ||||||
| 4. Handgrip | 0.502 | 0.323 | 0.219 | 1.556 | 0.130 | 4. Handgrip | 0.286 | 0.188 | 0.107 | 1.515 | 0.132 | ||||||
| 5. Sit To Stand Test | −0.977 | 0.587 | −0.256 | −1.667 | 0.106 | 5. Sit To Stand Test | −0.916 | 0.287 | −0.247 | −3.192 | 0.002 | ||||||
| 6. Gait Speed | 15.118 | 11.875 | 0.191 | 1.273 | 0.212 | 6. Gait Speed | 6.286 | 4.680 | 0.112 | 1.343 | 0.181 | ||||||
| D5 Activities of Daily Living | D5 Activities of Daily Living | ||||||||||||||||
| 1. Age | −0.586 | 0.447 | −0.206 | −1.310 | 0.199 | 0.47 | 0.387 | 0.001 | 1. Age | −0.219 | 0.153 | −0.118 | −1.433 | 0.154 | 0.211 | 0.181 | 0.0001 |
| 2. BMI | −0.799 | 0.381 | −0.278 | −2.098 | 0.044 | 2. BMI | −0.388 | 0.171 | −0.169 | −2.267 | 0.025 | ||||||
| 3. METS | 0.003 | 0.003 | 0.146 | 1.023 | 0.314 | 3. METS | 0.005 | 0.002 | 0.159 | 2.086 | 0.039 | ||||||
| 4. Sit To Stand Test | −0.185 | 0.538 | −0.060 | −0.344 | 0.733 | 4. Handgrip | 0.434 | 0.151 | 0.217 | 2.868 | 0.005 | ||||||
| 5. Gait Speed | 22.902 | 10.618 | 0.356 | 2.157 | 0.039 | 5. Sit To Stand Test | −0.262 | 0.230 | −0.094 | −1.136 | 0.258 | ||||||
| 6. Gait Speed | 2.985 | 3.754 | 0.071 | 0.795 | 0.428 | ||||||||||||
| D6 Leisure Activities | D6 Leisure Activities | ||||||||||||||||
| 1. METS | 0.008 | 0.005 | 0.267 | 1.665 | 0.105 | 0.071 | 0.046 | 0.105 | 1. Age | −0.519 | 0.328 | −0.132 | −1.582 | 0.116 | 0.113 | 0.103 | 0.000 |
| 2. METS | 0.015 | 0.005 | 0.243 | 3.073 | 0.002 | ||||||||||||
| 3. Sit To Stand Test | −0.580 | 0.508 | −0.099 | −1.141 | 0.256 | ||||||||||||
| 4. Gait Speed | 0.509 | 8.009 | 0.006 | 0.063 | 0.949 | ||||||||||||
| D7 Fears | D7 Fears | ||||||||||||||||
| 1. BMI | −1.337 | 0.424 | −0.465 | −3.155 | 0.003 | 0.217 | 0.195 | 0.003 | 1. BMI | −0.761 | 0.329 | −0.174 | −2.311 | 0.022 | 0.117 | 0.101 | 0.0001 |
| 2. Sit To Stand Test | −0.591 | 0.452 | −0.112 | −1.307 | 0.193 | ||||||||||||
| 3. Gait Speed | 1.573 | 6.890 | 0.197 | 2.282 | 0.024 | ||||||||||||
| SarQol Total | SarQol Total | ||||||||||||||||
| 1. Age | −0.340 | 0.351 | −0.127 | −0.968 | 0.341 | 0.693 | 0.634 | 0.0001 | 1. Age | −0.289 | 0.135 | −0.157 | −2.137 | 0.034 | 0.375 | 0.351 | 0.0001 |
| 2. BMI | −1.115 | 0.285 | −0.414 | −3.918 | 0.000 | 2. BMI | −0.605 | 0.151 | −0.265 | −3.996 | 0.000 | ||||||
| 3. METS | 0.005 | 0.002 | 0.270 | 2.451 | 0.020 | 3. METS | 0.007 | 0.002 | 0.234 | 3.439 | 0.001 | ||||||
| 4. Handgrip | 0.251 | 0.215 | 0.144 | 1.169 | 0.251 | 4. Handgrip | 0.299 | 0.134 | 0.151 | 2.239 | 0.027 | ||||||
| 5. Sit To Stand Test | −0.607 | 0.390 | −0.209 | −1.556 | 0.130 | 5. Sit To Stand Test | −0.608 | 0.204 | −0.221 | −2.985 | 0.003 | ||||||
| 6. Gait Speed | 12.555 | 7.903 | 0.208 | 1.589 | 0.122 | 6. Gait Speed | 3.364 | 3.321 | 0.081 | 1.013 | 0.313 | ||||||
| Analyzed Variables | 95% Asymptotic Confidence Interval | |||
|---|---|---|---|---|
| Area | p-Value | Lower Limit | Upper Limit | |
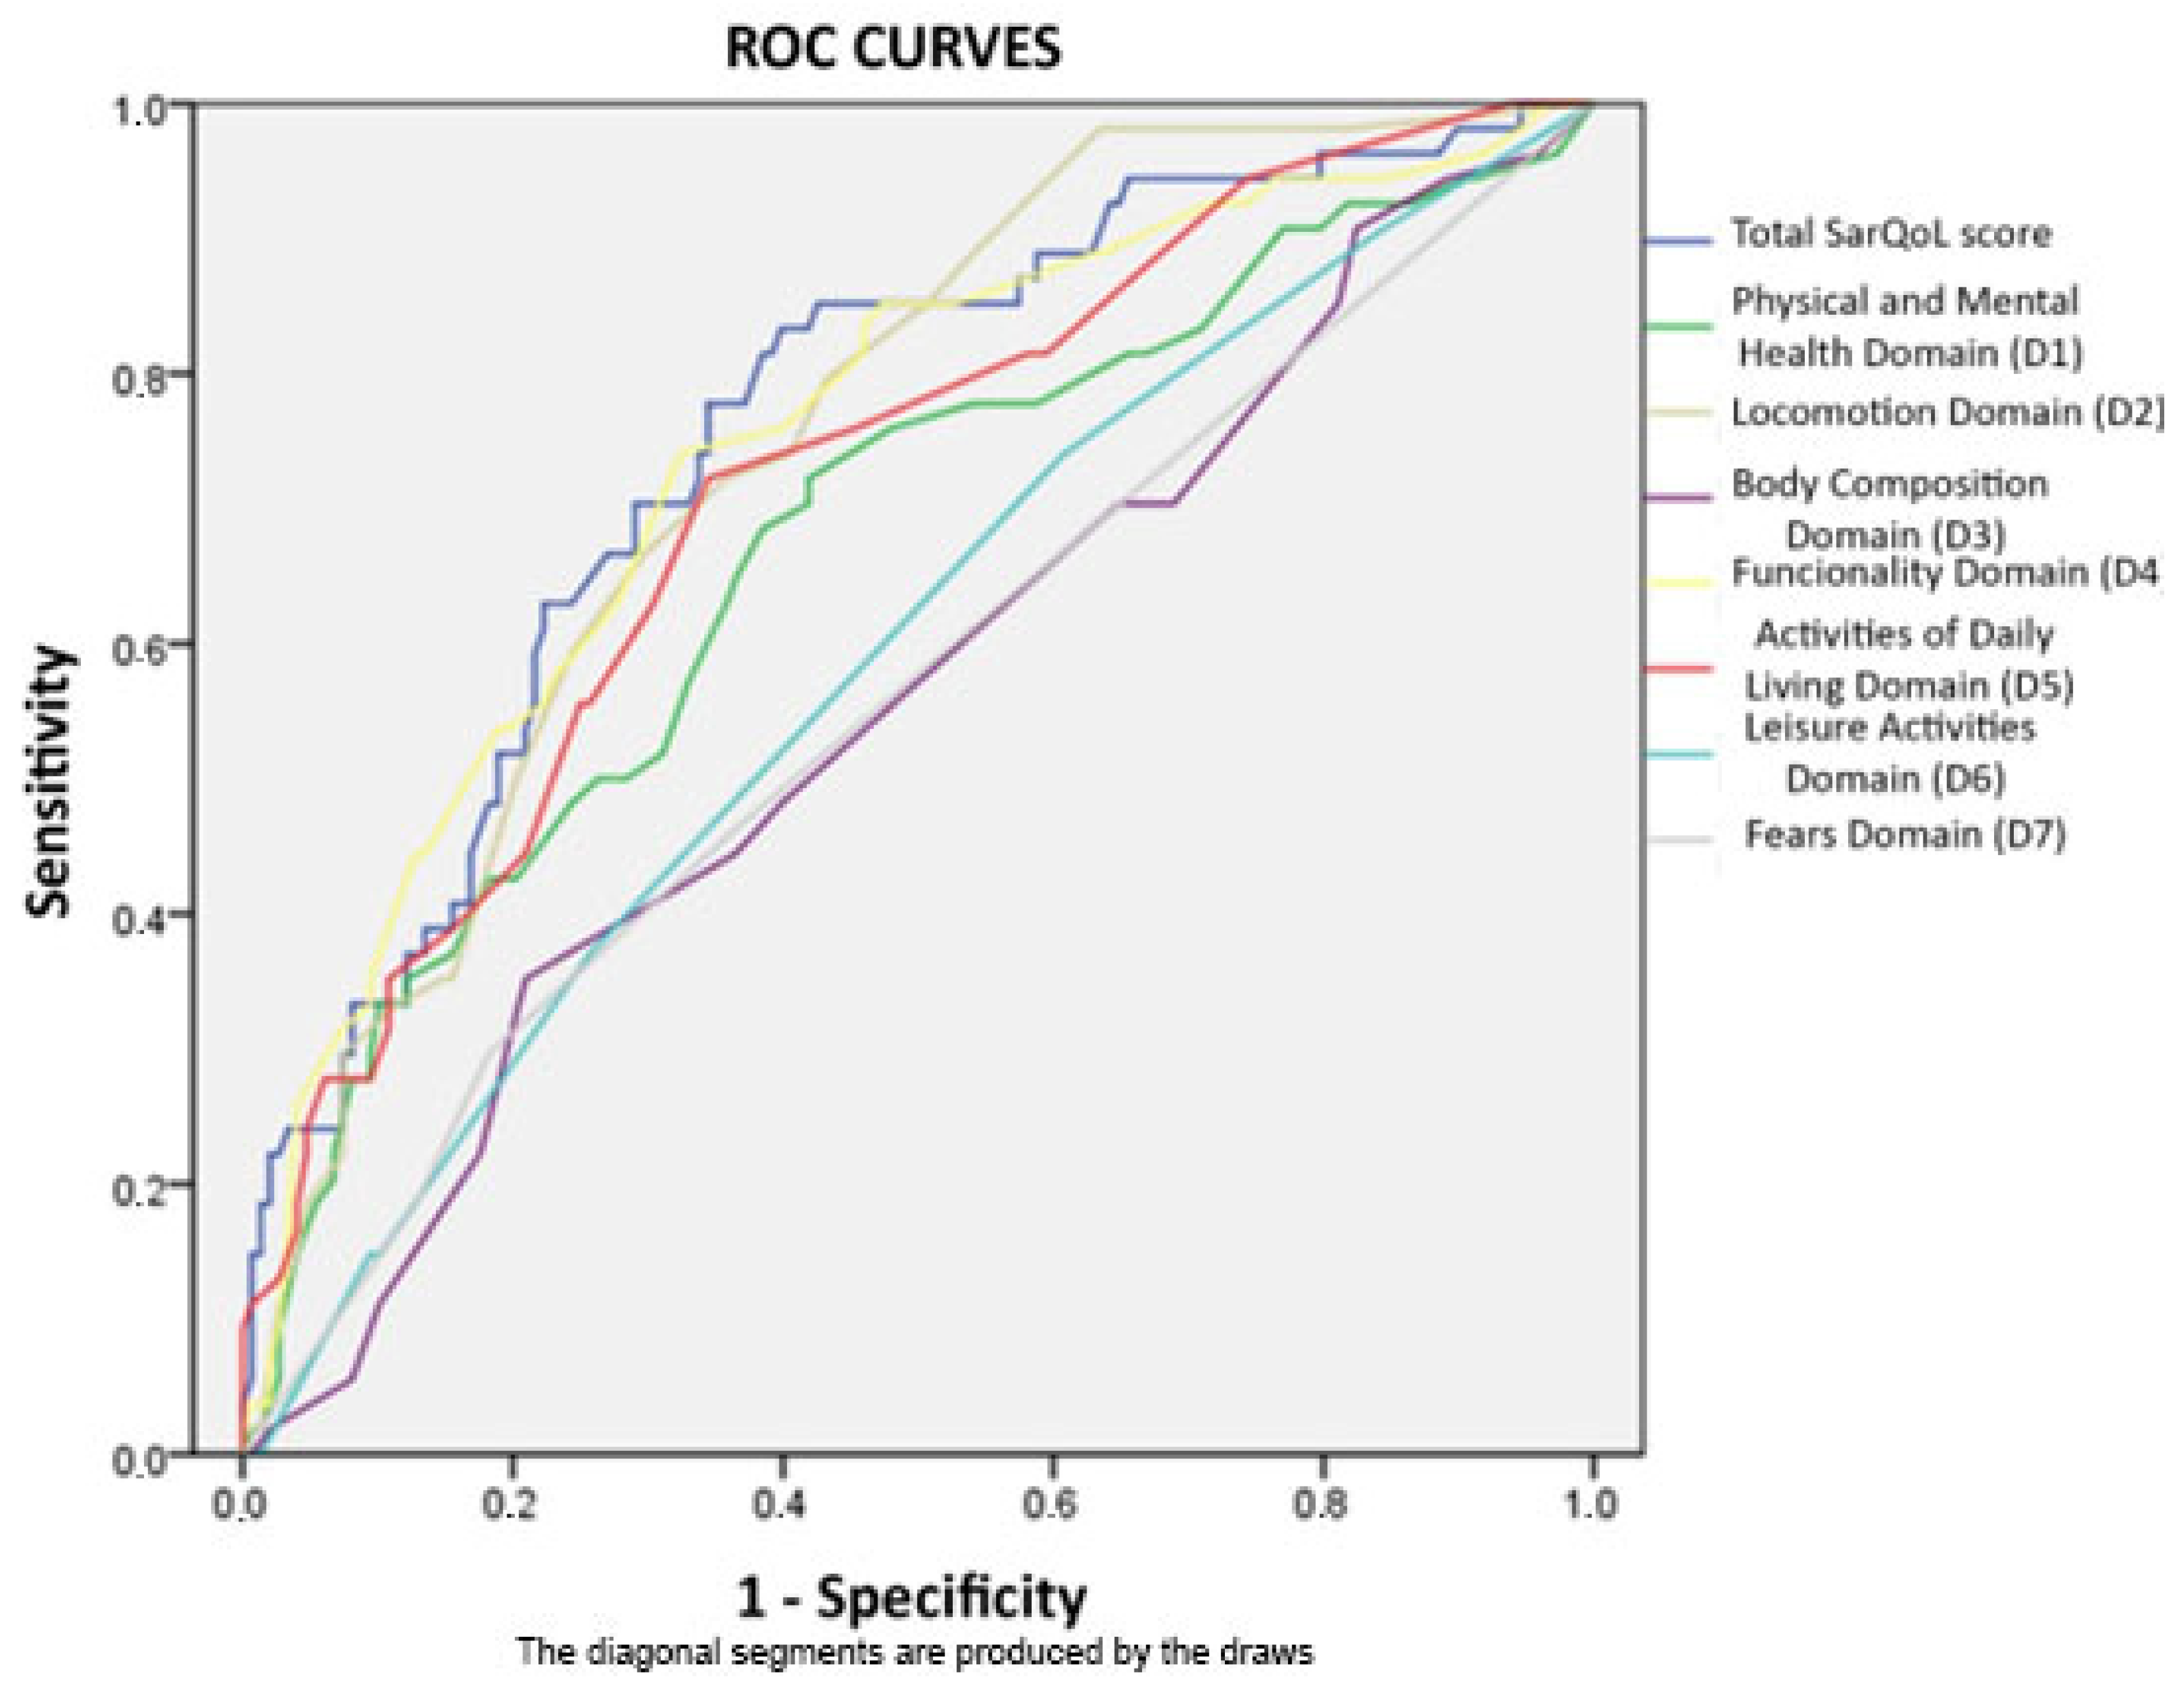
| Total SarQoL score | 0.756 * | 0.000 | 0.682 | 0.83 |
| Physical and Mental Health Domain (D1) | 0.671 | 0.000 | 0.584 | 0.758 |
| Locomotion Domain (D2) | 0.749 * | 0.000 | 0.679 | 0.819 |
| Body Composition Domain (D3) | 0.554 | 0.244 | 0.464 | 0.644 |
| Functionality Domain (D4) | 0.746 * | 0.000 | 0.669 | 0.824 |
| Activities Of Daily Living Domain (D5) | 0.717 * | 0.000 | 0.638 | 0.796 |
| Leisure Activities Domain (D6) | 0.586 | 0.063 | 0.498 | 0.673 |
| Fears Domain (D7) | 0.559 | 0.202 | 0.467 | 0.65 |
| Analyzed Variables | 95% Asymptotic Confidence Interval | |||
|---|---|---|---|---|
| Area | p-Value | Lower Limit | Upper Limit | |
| Total SarQoL score | 0.685 | 0.014 | 0.556 | 0.815 |
| Physical and Mental Health Domain (D1) | 0.647 | 0.052 | 0.506 | 0.787 |
| Locomotion Domain (D2) | 0.696 | 0.009 | 0.576 | 0.817 |
| Body Composition Domain (D3) | 0.455 | 0.553 | 0.302 | 0.608 |
| Functionality Domain (D4) | 0.621 | 0.109 | 0.489 | 0.753 |
| Activities Of Daily Living Domain (D5) | 0.666 | 0.028 | 0.533 | 0.799 |
| Leisure Activities Domain (D6) | 0.661 | 0.032 | 0.530 | 0.793 |
| Fears Domain (D7) | 0.515 | 0.838 | 0.372 | 0.659 |
Publisher’s Note: MDPI stays neutral with regard to jurisdictional claims in published maps and institutional affiliations. |
© 2022 by the authors. Licensee MDPI, Basel, Switzerland. This article is an open access article distributed under the terms and conditions of the Creative Commons Attribution (CC BY) license (https://creativecommons.org/licenses/by/4.0/).
Share and Cite
Guillamón-Escudero, C.; Diago-Galmés, A.; Zuazua Rico, D.; Maestro-González, A.; Tenías-Burillo, J.M.; Soriano, J.M.; Fernández-Garrido, J.J. SarQoL Questionnaire in Community-Dwelling Older Adults under EWGSOP2 Sarcopenia Diagnosis Algorithm: A New Screening Method? Int. J. Environ. Res. Public Health 2022, 19, 8473. https://0-doi-org.brum.beds.ac.uk/10.3390/ijerph19148473
Guillamón-Escudero C, Diago-Galmés A, Zuazua Rico D, Maestro-González A, Tenías-Burillo JM, Soriano JM, Fernández-Garrido JJ. SarQoL Questionnaire in Community-Dwelling Older Adults under EWGSOP2 Sarcopenia Diagnosis Algorithm: A New Screening Method? International Journal of Environmental Research and Public Health. 2022; 19(14):8473. https://0-doi-org.brum.beds.ac.uk/10.3390/ijerph19148473
Chicago/Turabian StyleGuillamón-Escudero, Carlos, Angela Diago-Galmés, David Zuazua Rico, Alba Maestro-González, Jose M. Tenías-Burillo, Jose M. Soriano, and Julio J. Fernández-Garrido. 2022. "SarQoL Questionnaire in Community-Dwelling Older Adults under EWGSOP2 Sarcopenia Diagnosis Algorithm: A New Screening Method?" International Journal of Environmental Research and Public Health 19, no. 14: 8473. https://0-doi-org.brum.beds.ac.uk/10.3390/ijerph19148473