Article

Natural Gas Intermittent Kiln for the Ceramic Industry: A Transient Thermal Analysis

by
Ricardo S. Gomez
1,*,
Túlio R. N. Porto
1,
Hortência L. F. Magalhães
2,
Gicelia Moreira
2,
Anastácia M. M. C. N. André
1,
Ruth B. F. Melo
3 and
Antonio G. B. Lima
1
1
Department of Mechanical Engineering, Federal University of Campina Grande, Campina Grande 58429-900, Brazil
2
Department of Chemical Engineering, Federal University of Campina Grande, Campina Grande 58429-900, Brazil
3
Department of Physics, State University of Paraiba, Campina Grande 58431-410, Brazil
*
Author to whom correspondence should be addressed.
Submission received: 10 April 2019 / Revised: 18 April 2019 / Accepted: 24 April 2019 / Published: 25 April 2019

Abstract

:
Drying and firing of ceramic products are processes that require high energy consumption. Making these processes more efficient can improve product quality, reduce processing time and energy consumption, and promote economic and environmental gains. In this sense, this work aims to quantify heat transfer in an intermittent ceramic kiln during the heating and cooling stages, with and without thermal insulation. All mathematical formulation is based on the first law of thermodynamics. From the results, we conclude that the greatest heat loss occurs by radiation in the sidewalls of the equipment, and that a considerable amount of energy is required to heat the sidewalls, base, and ceiling of the kiln. Further, with the use of thermal insulation, it was concluded that a high reduction in the heat lost through the sidewalls was achieved, thus providing a global energy gain of approximately 35% and a reduction in the maximum external surface temperature from 249.34 to 79.47 °C when compared to the kiln without thermal insulation, reducing the risks of work accidents and thermal discomfort when in operation.

1. Introduction

Ceramic or ceramic material comprises all inorganic, non-metallic materials, generally obtained after heat treatment at elevated temperatures [1]. A class of this material (clay ceramics) is obtained from the firing of clay, being widely used in civil construction. According to Brongniart [2], clay is the most widespread raw material on the Earth's surface, and is easily molded, thus it has various practical and artistic applications. These characteristics justify the fact that ceramics have appeared in different civilizations, at different periods and on all regions of the world, since the end of the Paleolithic period [3,4].
In the manufacturing process of ceramic materials, water is added to the clay, in order to increase its plasticity and allow parts to be molded easily into different forms [1,5,6].
After molding, the wet part must be submitted to the drying stage, which consists of a thermodynamic process of heat transfer and moisture removal in the porous materials [1]. Because the drying process promotes volumetric variations in the molded part, this water needs to be removed carefully and homogeneously to avoid the formation of cracks, torsions, excessive deformations, and other types of defects [7]. Thus, it is important that the ceramic parts are submitted to a suitable drying process to give them the necessary strength and consistency during the firing stage [8].
After the drying step, the molded part is subjected to the firing process in order to guarantee its mechanical strength and rigidity. At this stage, the temperature of the part can reach values close to 1200 °C, depending on the type of application. Then, if the moisture of the material is not removed adequately in the drying step, the extreme temperature in the kiln will force the exit of the water during the firing process, increasing the risk of defect formation, which may lead to the explosion of the product [5,9].
After the firing step, the part is cooled under controlled conditions. This avoids expressive thermal stresses that can cause cracks or accentuate fissures in the product that originate from the drying and firing stages. After cooling, it is common that the products undergo quality control to discard cracked, broken, or burnt excess parts. The parts that are approved by quality control have the necessary characteristics for commercialization and application.
Therefore, it is extremely important that the firing process is as short as possible without compromising on product quality, i.e., without exceeding the critical heating and cooling rates at each temperature. In this way, it is possible to reduce costs with less energy consumption and increase the process productivity. Based on the above considerations, it is necessary to have adequate control of the drying and firing processes of the ceramic part, as well as the equipment used in such applications from the energy and shelf life viewpoints.
Then, with the aid of mathematical modeling and experimentation, several researchers have sought to understand and optimize the drying and firing processes of ceramic materials [5,6,7,8,9,10,11,12,13,14,15,16,17,18,19,20,21,22,23,24,25,26,27,28]. In these studies, the energy consumption of the process was not evaluated, but rather the influence of the drying parameters on the heat and mass transfer, temperature distribution, and moisture content in the products, and the volumetric retraction, and formation of stresses, deformations, and cracks in the parts (solid or hollow).
Crasta [29], in research developed in Italy, showed that energy expenditures in the ceramic industries represent about 23% of the total average cost of production. Alves [30] performed a detailed survey of the electrical and thermal (natural gas) energy consumption of the Brazilian ceramic parts industry, concluding that the drying and firing sectors together accounted for approximately 95% of the total energy consumption, representing approximately 87% of the total energy cost. Alves [31] indicated that the drying process of ceramic tiles has a share of about 30% in the consumption of thermal energy, while the firing process is responsible for the other 70%. Besides the economic aspects, energy consumption is directly related to the environment in such a way that any energy efficiency improvements of the equipment and processes brings with such improvements some environmental gains.
The drying and firing of ceramic materials is carried out in well-known equipment, such as dryers and kilns. In some cases, the equipment works with the two steps, called the kiln-dryer. These devices can operate in the continuous or intermittent mode.
Thermal analysis in kilns can provide, both for designers and operators, decision-making tools to make drying and firing processes more efficient. For example, by knowing the temperature distributions on the internal and external surfaces of the kiln, as well as the conditions of the air temperature, relative humidity, and velocity in its surroundings, it is possible to quantify the heat transfer occurring during the heating and cooling processes. Then, it is possible to propose alternatives to obtain better quality products, as well as to reduce processing the time and energy consumption. Several studies of thermal analysis in kilns can be found in the literature [32,33,34,35,36,37,38,39,40,41,42,43,44].
Yu [32] developed a transient mathematical model for tunnel kilns. Using the model, the author was able to predict several parameters of the process, such as the temperature distribution in parts, energy consumption, heat losses, rate at which energy is accumulated, etc. According to the researcher, the results obtained were in good agreement with the practical situation.
Nicolau [33] developed a mathematical model for tunnel kilns using mass and energy balances. The thermal balance allowed the distribution of energy in the kiln, the energy lost to the surroundings, and the energy that can be reused in other processes to be estimated. The results were compared with the measured values, showing good agreement.
Mezquita [34] and Soussi [35] quantified energy consumption when part of the gases from the tunnel kiln cooling zone are recovered in the firing chamber instead of being exhausted to the atmosphere. In both works, the authors found good agreement between the theoretical and experimental results and concluded that the recovery of gases provides energy savings for the process.
Hadala [36] quantified heat losses by the sidewalls of an intermittent kiln during heating and heat treatment of metal parts. The temperature distribution in the kiln walls was determined by solving the heat conduction equation in each point using the finite element method. After analyzing six wall configurations and four types of operation modes, the authors concluded that heat losses depend on the type and thickness of the insulation on the walls and the operation mode of the kiln.
In this sense, the main purpose of this work is to quantify the transient heat transfers occurring in an intermittent ceramic kiln during the heating and cooling stages with and without thermal insulation in the sidewalls of the kiln in an advanced approach. The main contribution of this work is related to the new methodology of transient analysis that simultaneously includes the first law of thermodynamics, the finite volumes numerical method, and the mesh analysis technique, thus providing an innovative analysis procedure. Further, all study is conducted in a kiln at the pilot scale.

2. Materials and Methods

2.1. The Physical Problem

This paper presents a thermal analysis of the kiln/dryer shown in Figure 1 during the heating and cooling stages. The equipment was constructed with refractory bricks and uses natural gas as fuel. Natural gas circulates through rectangular channels in the sidewalls, base, and ceiling of the kiln, without coming into contact with the materials that are placed in its interior. The kiln measures 1.90 m in height, 1.64 m in depth, and 1.62 m in length.
The internal measures of the kiln are as follows: 1.13 m depth and 1.15 m length. As the ceiling is in a dome form, it measures 1.20 m in the highest part and 0.82 m in the lower part. The heat transfer area in the sidewalls and the base/ceiling assembly are 6.48 m2 and 4.50 m2, respectively. The internal volume of the kiln is 1.84 m3.

2.2. Experimental Procedure

During the heating and cooling processes of the kiln without insulation, the temperatures on the inner and outer lateral surfaces of the kiln were monitored. The kiln remained on for 14 h (840 min, heating period). Then, the cooling phase lasted 44 h and 5 min.
To obtain the temperatures in the kiln, 11 K type (Ni-Cr alloy) thermocouples were used, 10 in the sidewalls and one in the chimney. Figure 2 shows a scheme of the positions of the thermocouples on the right and left sidewalls of the kiln. To measure the temperature on the outer surfaces of the kiln, an infrared digital thermometer (TI—890) was used, measuring at 10 different points that were well distributed in two of the four sidewalls of the kiln. The local ambient conditions where the kiln was put into operation were also monitored. For this, a temperature and relative humidity meter were used (thermohygrometer).
The temperature data were collected at intervals of approximately 15 min, totaling 234-time intervals, from the moment it was put into operation. The storage and management of the collected data was performed using LabView software.

2.3. Mathematical Formulation

2.3.1. Kiln without Thermal Insulation

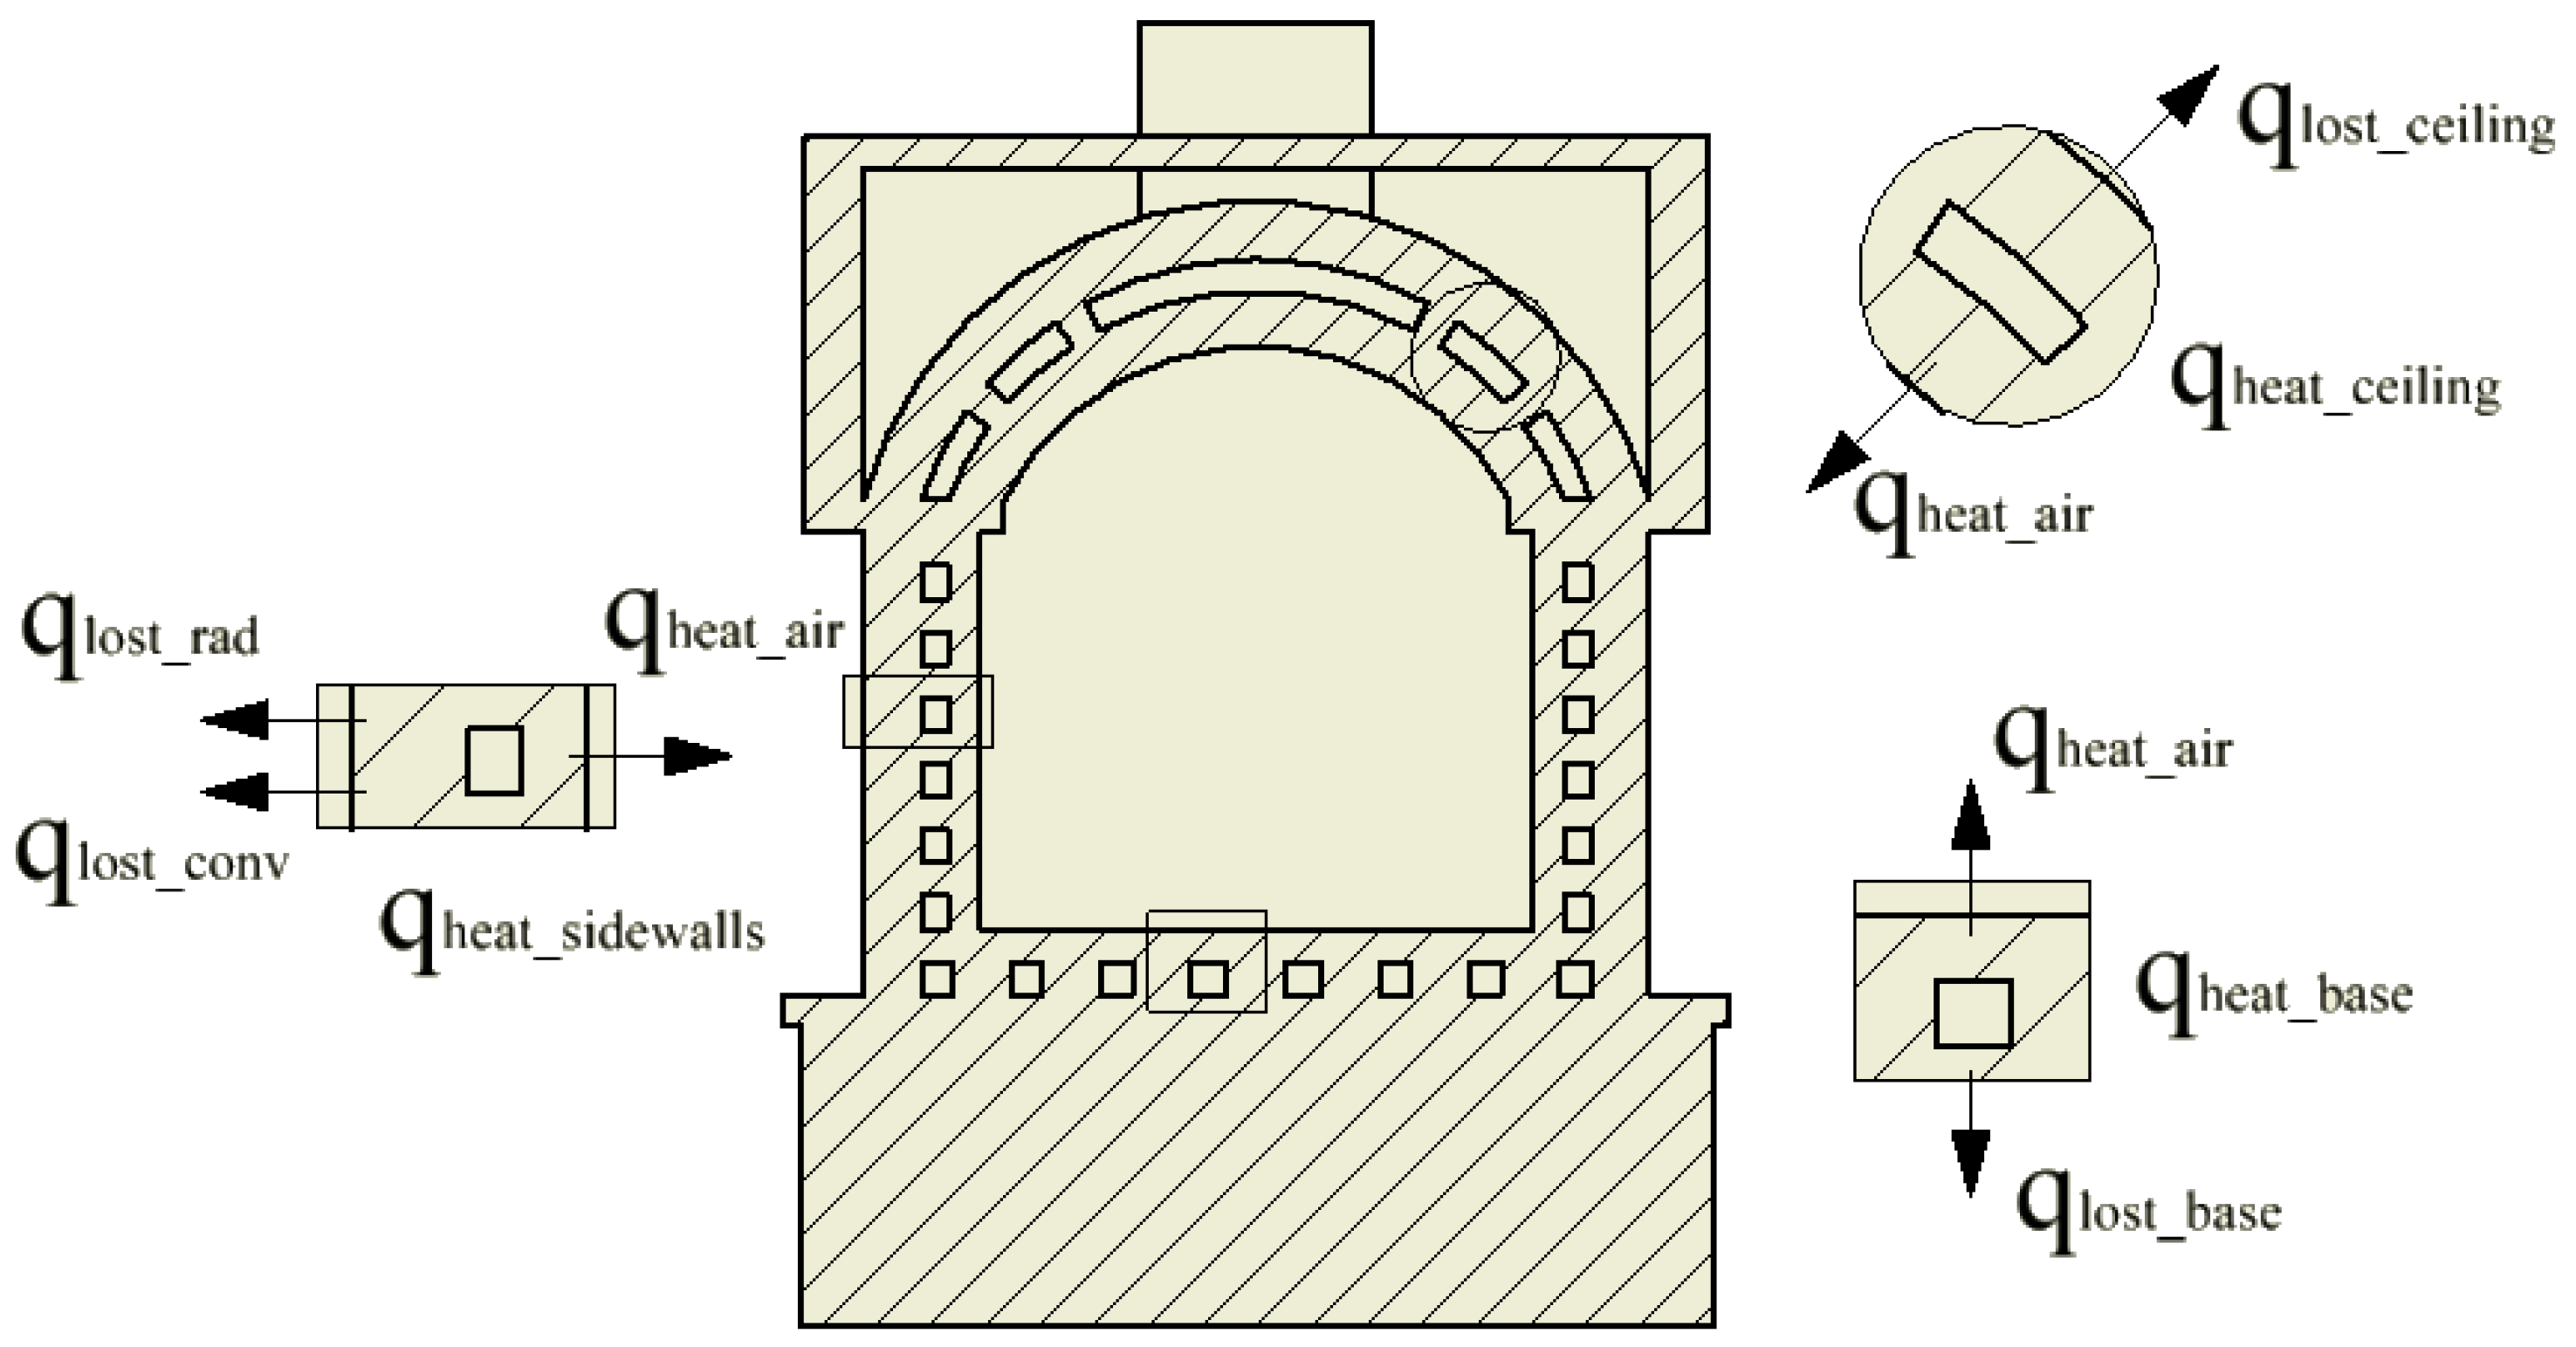
For this analysis, consider Figure 3, which illustrates the different heat transfer portions involved in the process. The figure shows a section of the kiln/dryer analyzed, where it is possible to verify the channels through which the combustion gases flows, as well as small control volumes in the sidewalls, base, and ceiling of the kiln, which indicate the directions of the heat fluxes.
From the first law of thermodynamics (energy conservation law), we obtain the energy balance in the kiln, which is represented by Equation (1), in the form of the temporal rate:
E ˙ in E ˙ out + E ˙ g = dE st dt = E ˙ st ,
where the terms on the left side of the equation represent, respectively, the energy rate that enters the control volume, the energy rate that leaves the control volume, and the energy rate that is generated. E ˙ st is the rate of energy stored in the system.
For the case of the non-insulated kiln, the energy balance can be represented by Equation (2), as follows:
E ˙ supplied = E ˙ st + q lost .
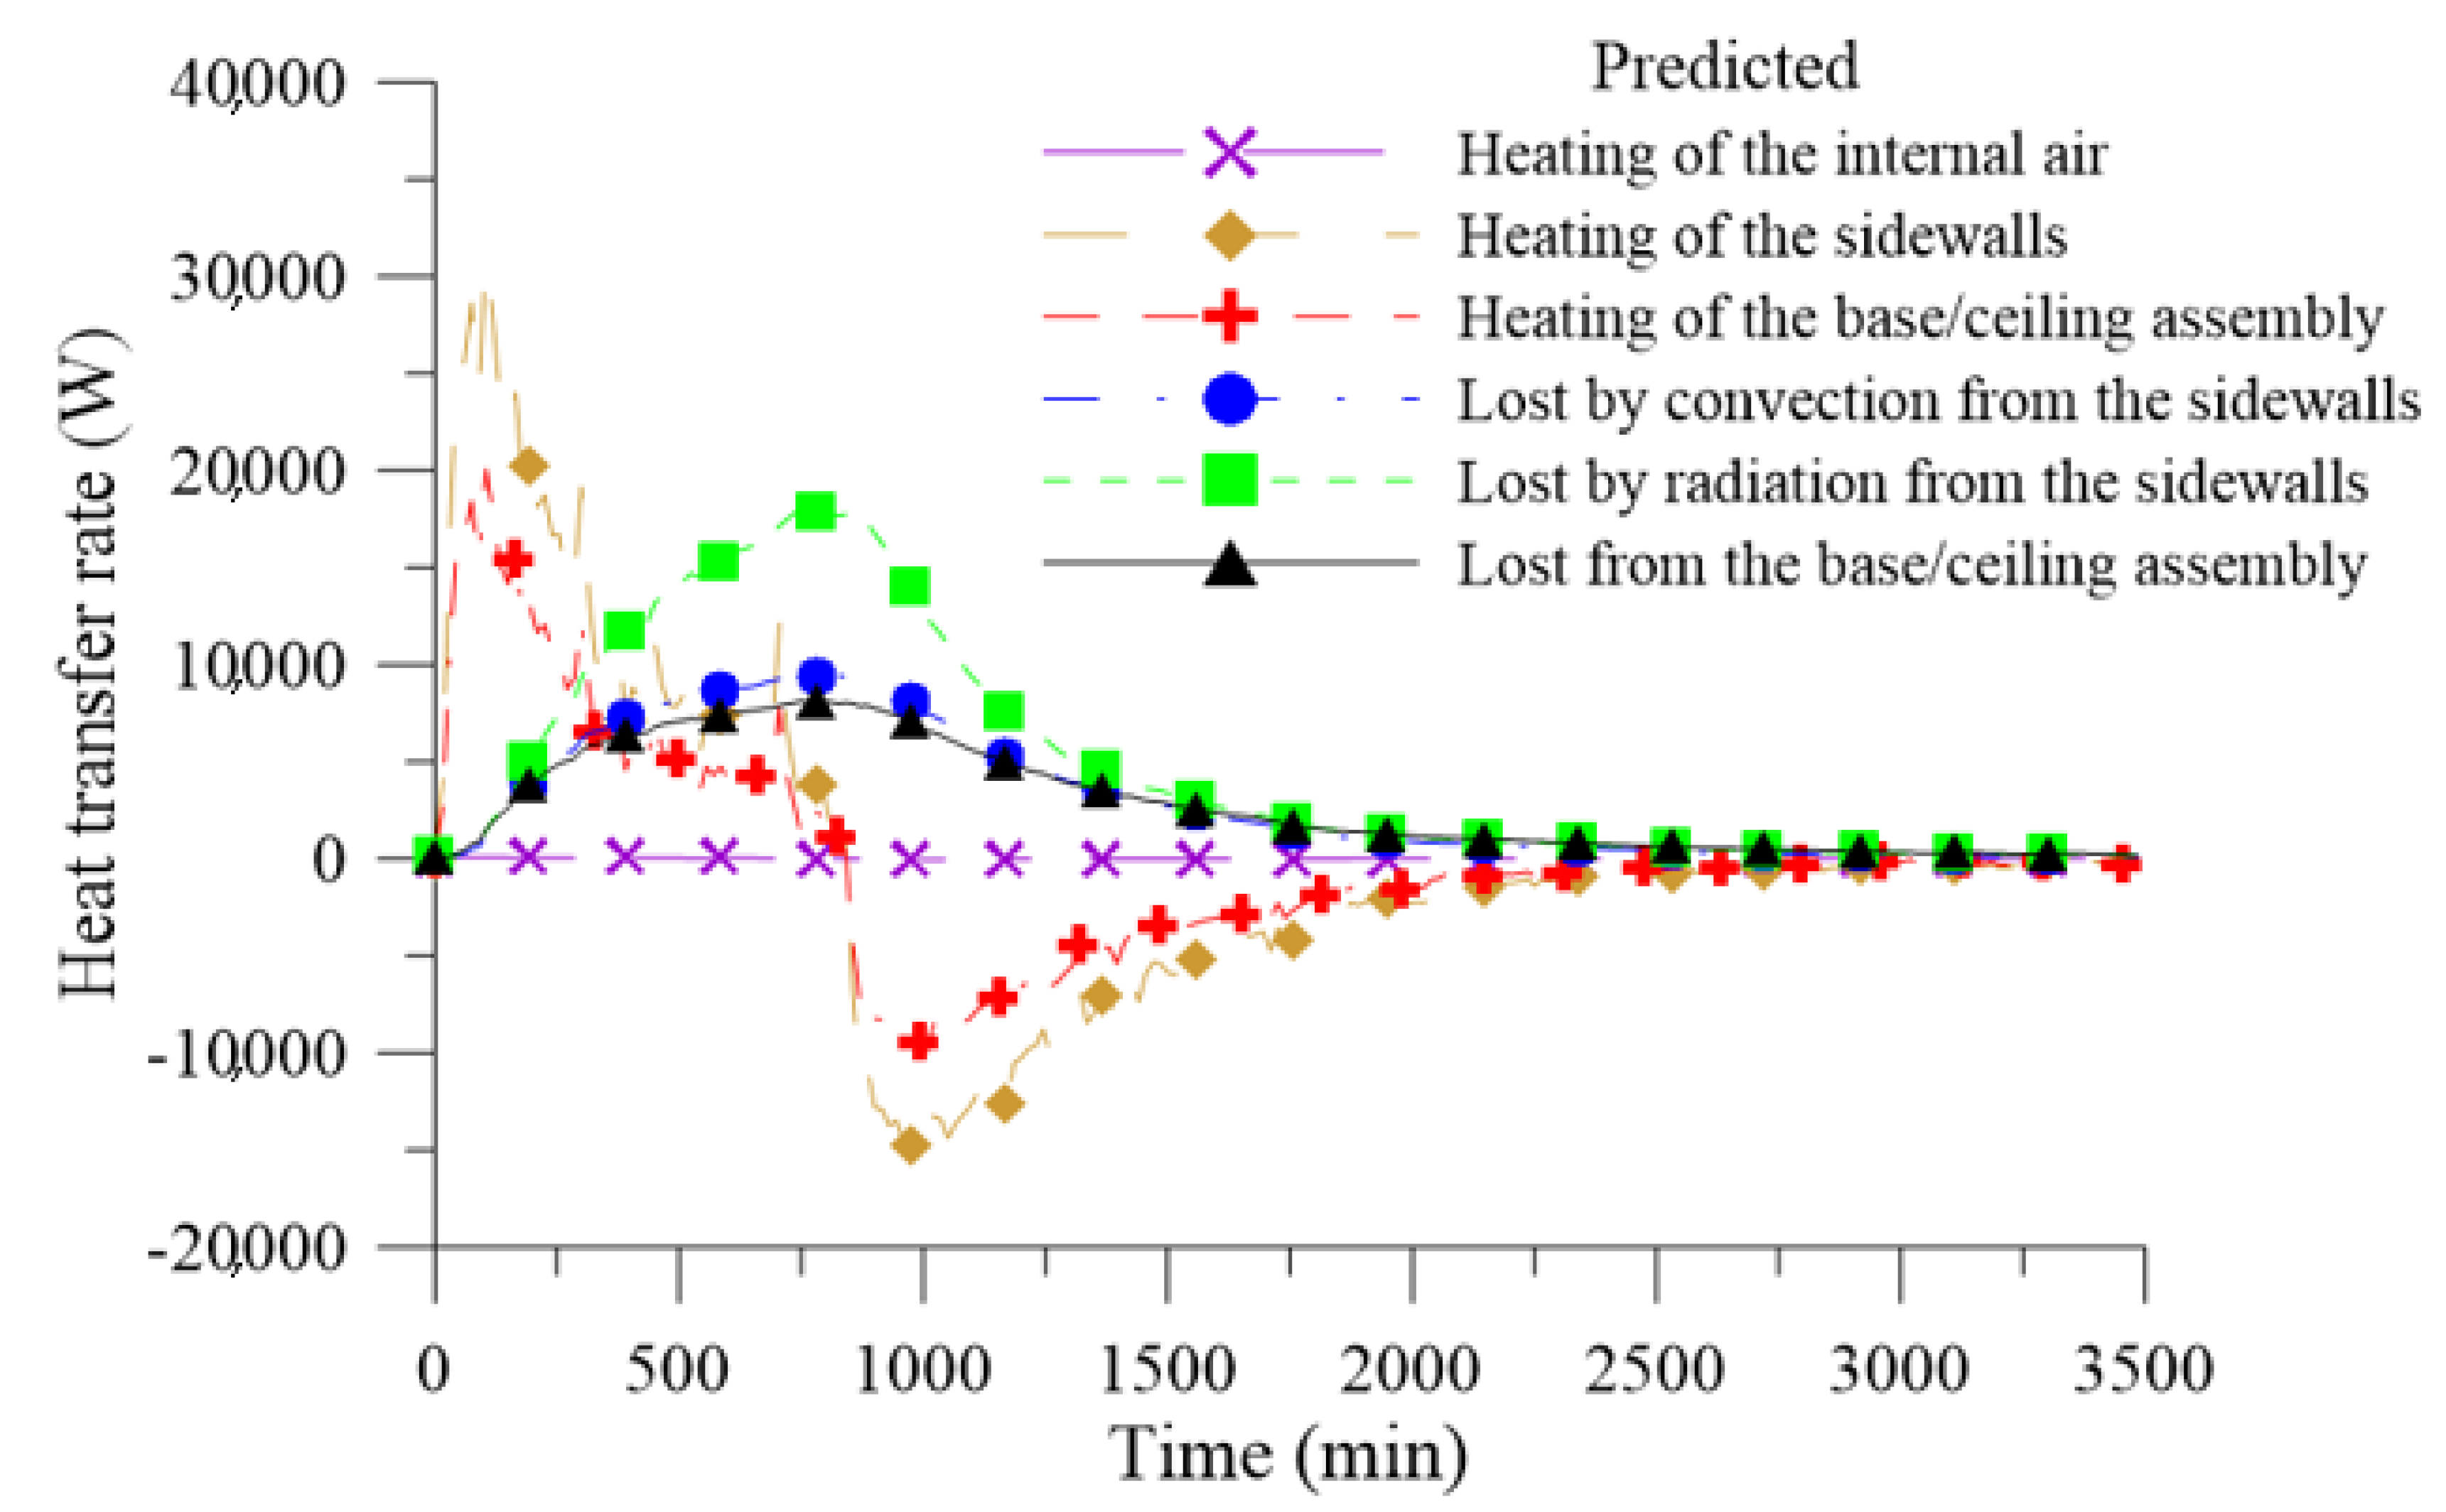
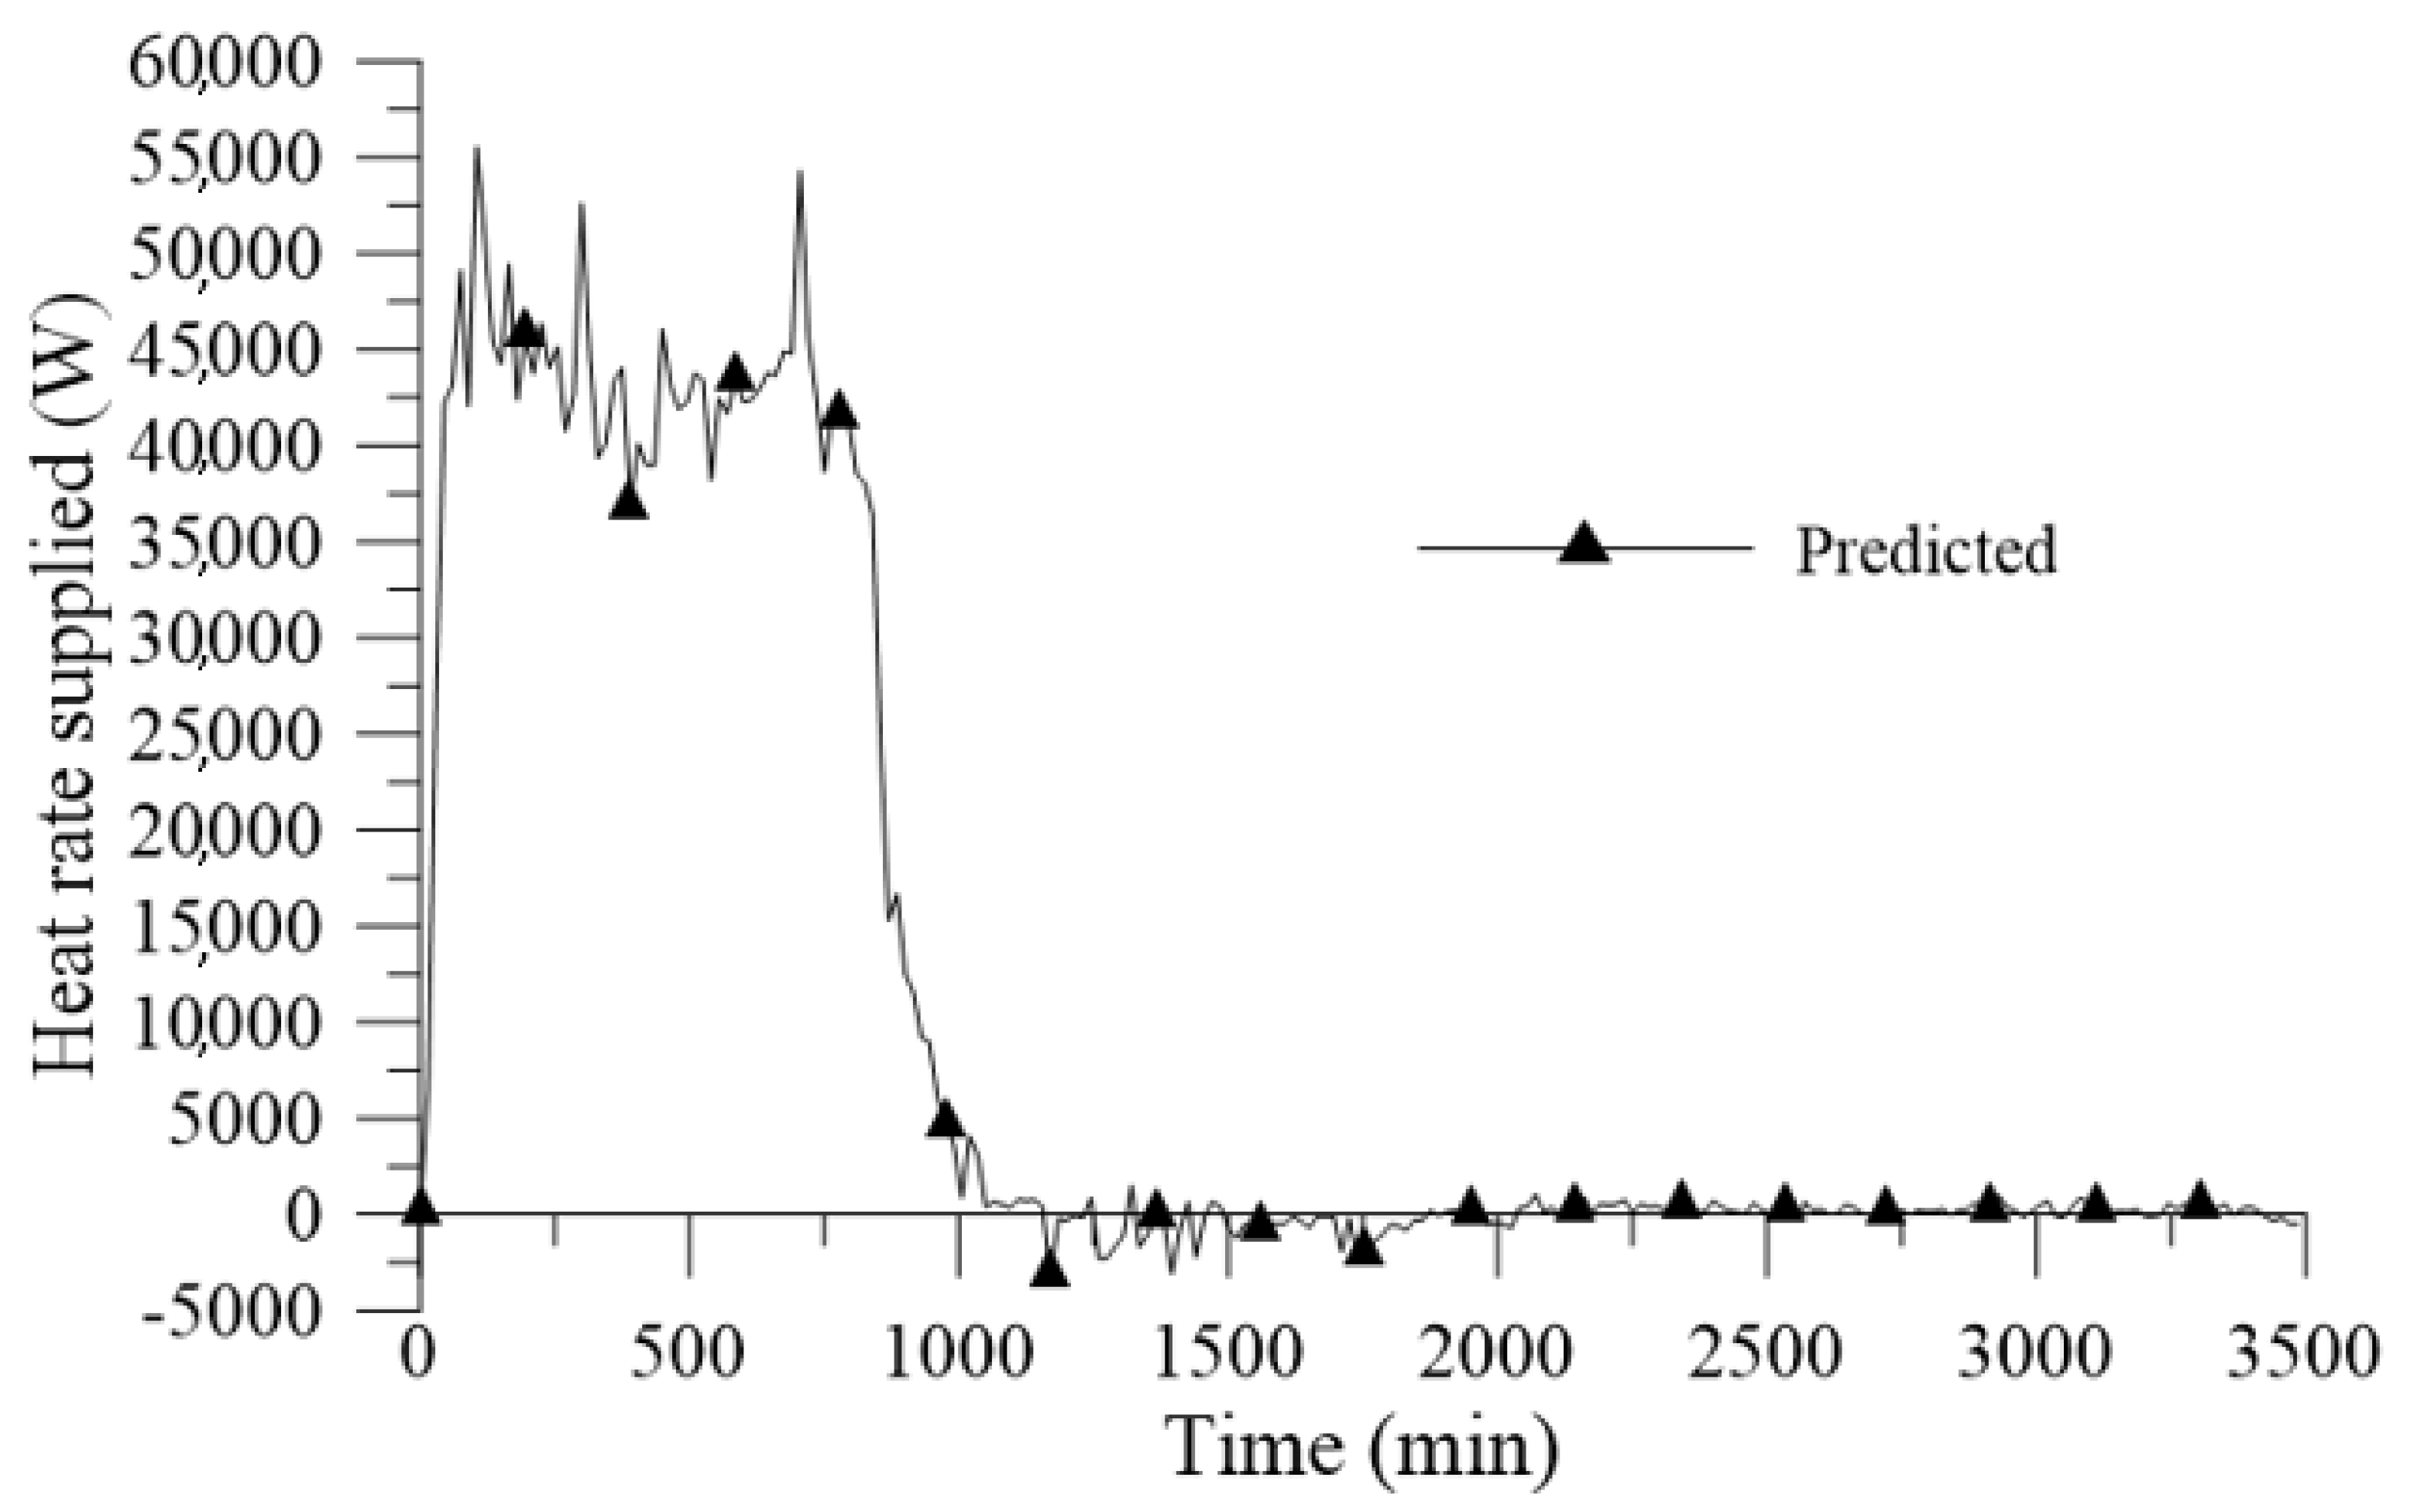
Thus, the rate at which the energy is supplied, E ˙ supplied , from the combustion of natural gas is given by the sum of the rate at which energy is stored in the kiln ( E ˙ st ) with the heat lost ( q lost ).
The rate of energy stored in the kiln is obtained by summing the portions of the energy to heat the ceramic products, the internal air, the sidewalls, and the base/ceiling assembly of the kiln, as indicated in Equation (3):
E ˙ st = q heat products + q heat air + q heat sidewalls + q heat base / ceiling .
Since the experiment was performed without products inside the kiln, it is assumed that the portion, q heat products = 0 .
The heat loss ( q lost ) is given by the sum of the heat transfer rates lost by the four side faces of the kiln and the heat transfer rate lost by the base/ceiling assembly of the kiln, according to Equation (4):
q lost = q lost sidewalls + q lost base / ceiling .
The rate for heating the internal air at each instant of time is obtained by Equation (5), as follows:
q heat air = m air   ×   c p air   ×   Δ T int Δ t ,
where m air is the mass of air inside the kiln, c p air is the specific heat at constant pressure of the air, and Δ T int is the variation of the internal temperature of the kiln in a given time interval, Δt.
To obtain the specific heat of the air, c p air , for each instant of time, interpolations were performed with values provided by Bergman [45] for atmospheric air.
Considering air as an ideal gas, the mass of air, m air , can be calculated by the Clapeyron equation (Equation (6)):
PV = m air M air   ×   RT ,
where P is the pressure, V is the volume inside the kiln, R is the universal gas constant (R = 8.31 J/mol/K), T is the temperature in Kelvin, and M is the molar mass of the gas.
Considering that the kiln was closed during the whole experiment, it is assumed that the mass of air contained within the kiln does not change with time. In this way, the mass of air can be calculated at the instant of time, t = t0 = 0 s, where the ambient temperature and the atmospheric pressure are known.
The rates for heating the sidewalls and the base/ceiling assembly of the kiln are represented by Equations (7) and (8), respectively, as follows:
q heat sidewalls = m sidewalls   ×   c p firebrick   ×   Δ T med Δ t ,
q heat base / ceiling = m base / ceiling   ×   c p firebrick   ×   Δ T med Δ t ,
where the masses, m sidewalls and m base / ceiling , are calculated by the product of the density of the refractory brick with its respective volume. The values used for the density and specific heat of the refractory brick were 2500 kg/m3 and 840 J/kg·K.
The data collection of the temperatures in the kiln was done at intervals of 15 min (Δt = 900 s.). The variation of the average temperature in the kiln is given by Equation (9):
Δ T average = T average t + Δ t T average t .
The average temperatures at time instants t and t + Δt are obtained by Equations (10) and (11), respectively:
T average t = T s , int t   +   T s , ext t 2 ,
T average t   +   Δ t = T s , int t + Δ t + T s , ext t   +   Δ t 2 ,
where T s , int and T s , ext are the internal and external surface temperatures of the kiln sidewalls, respectively.
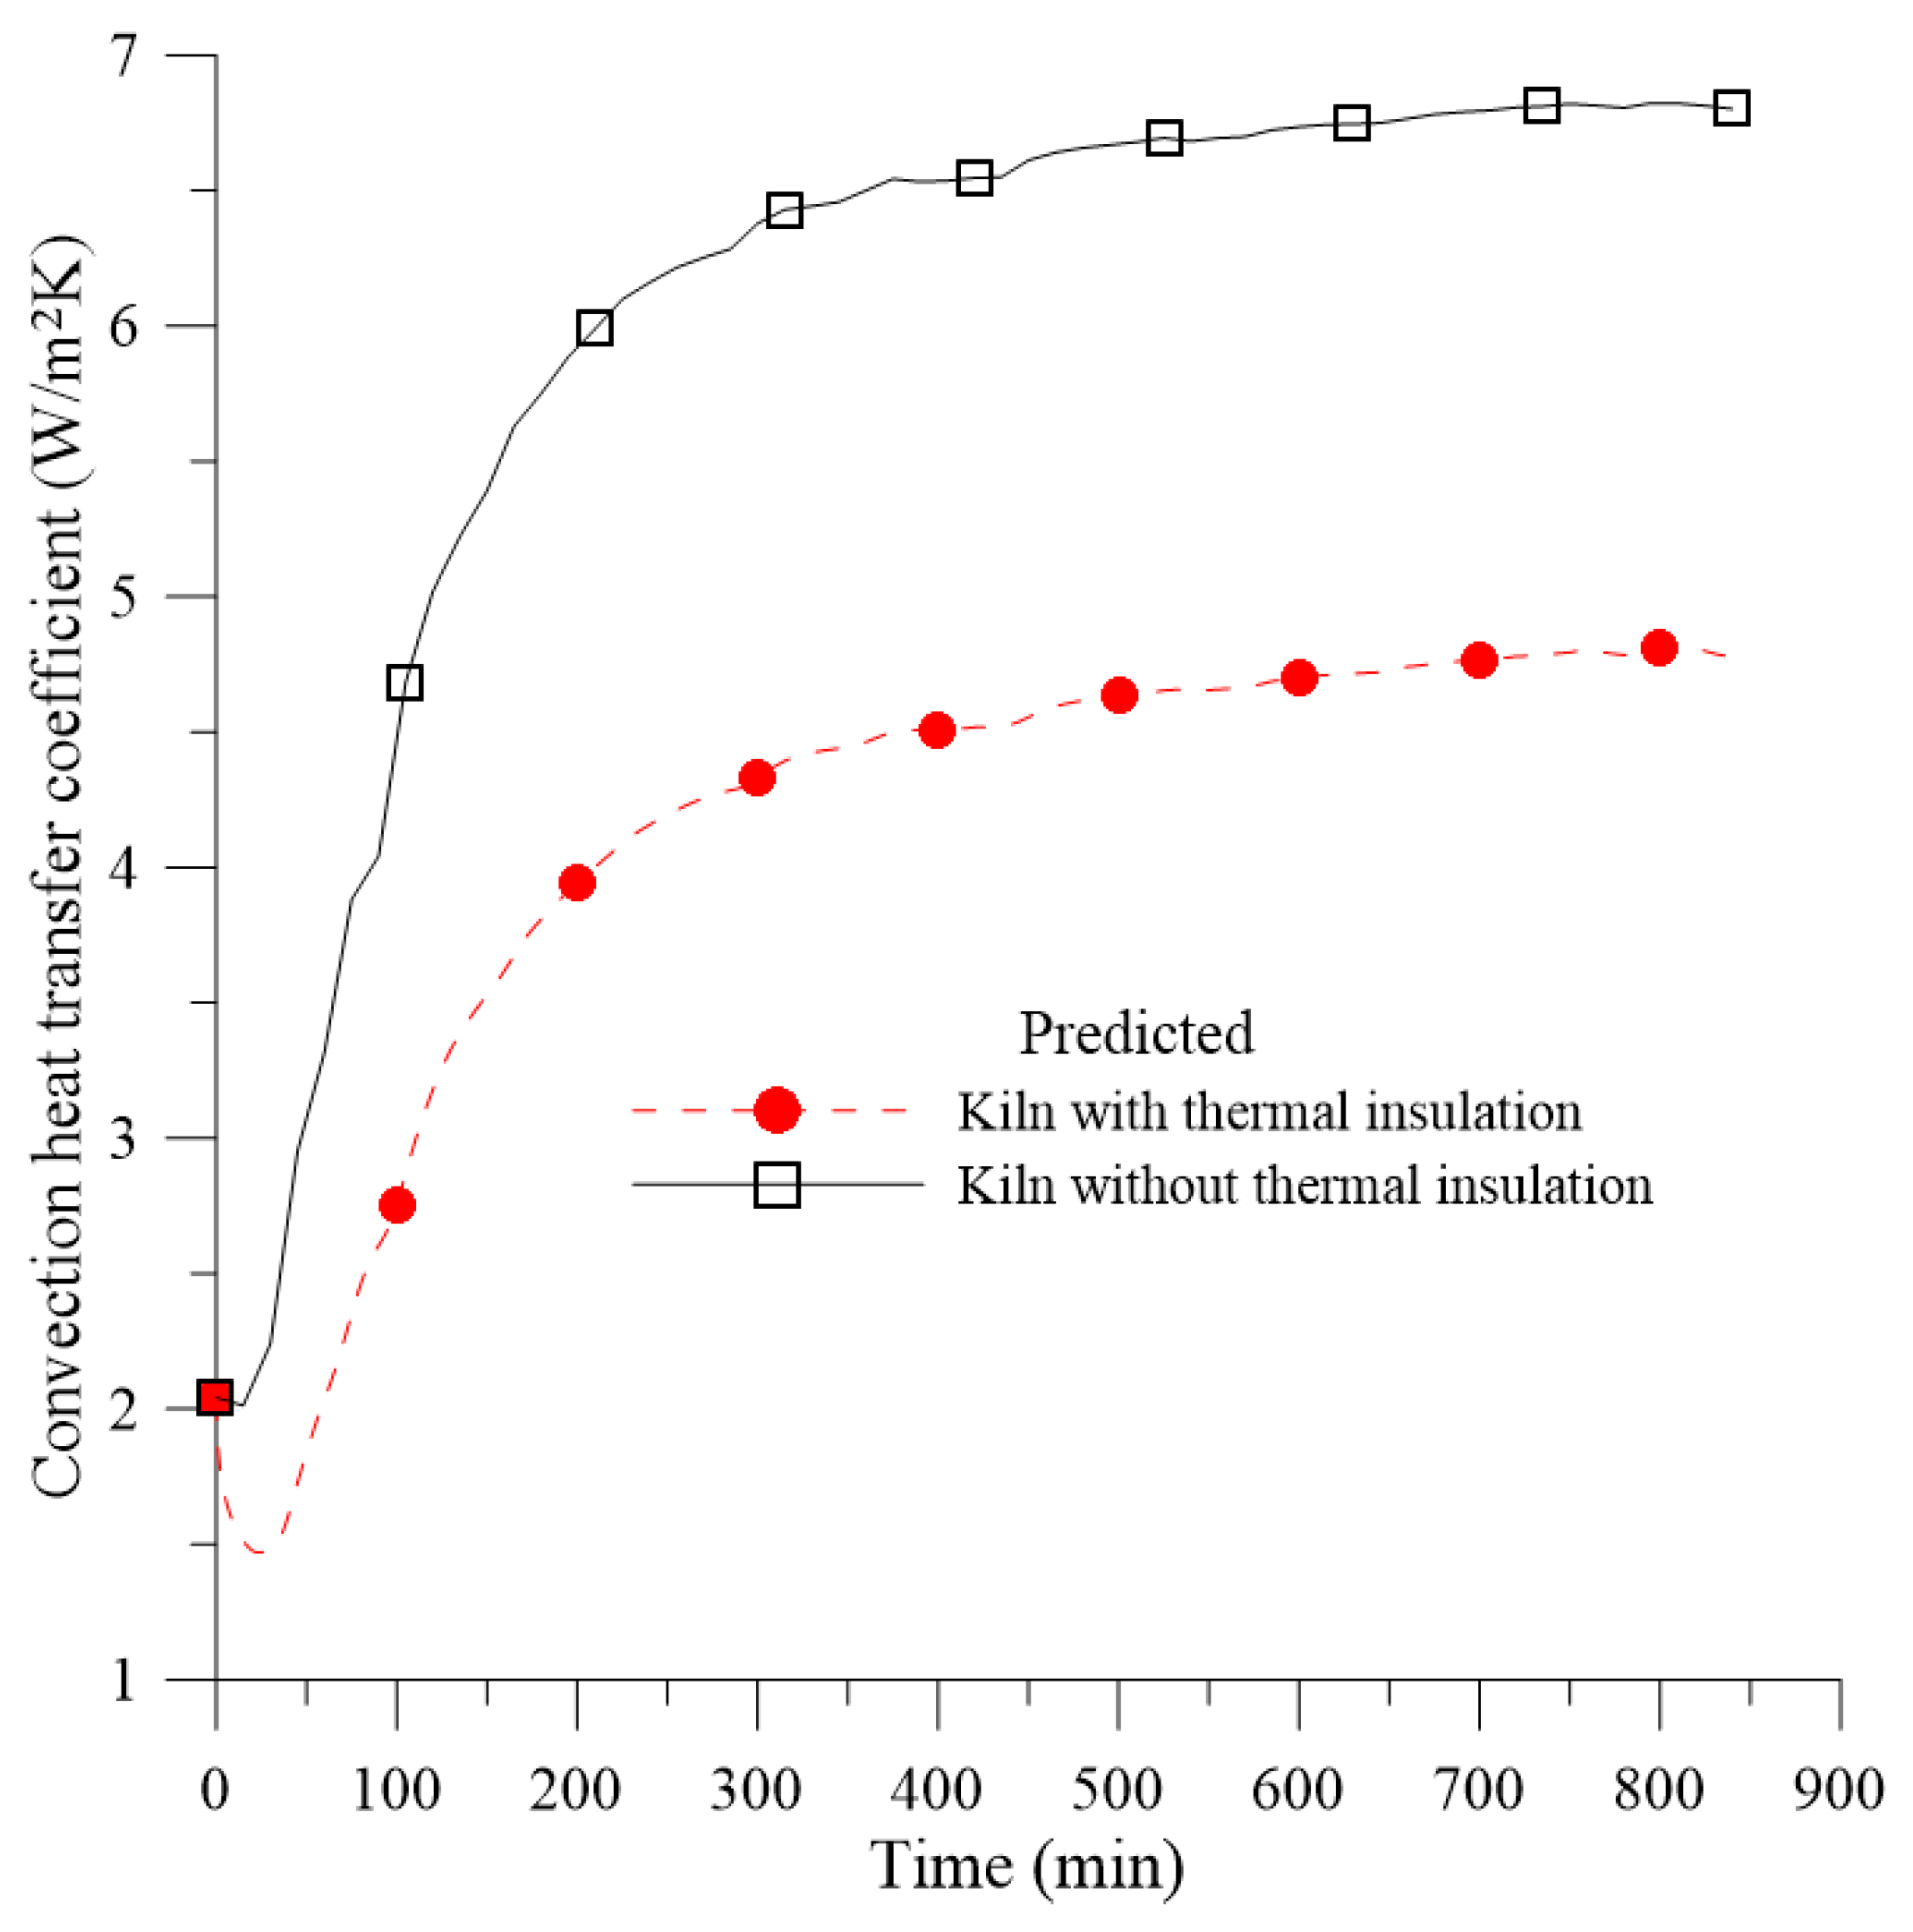
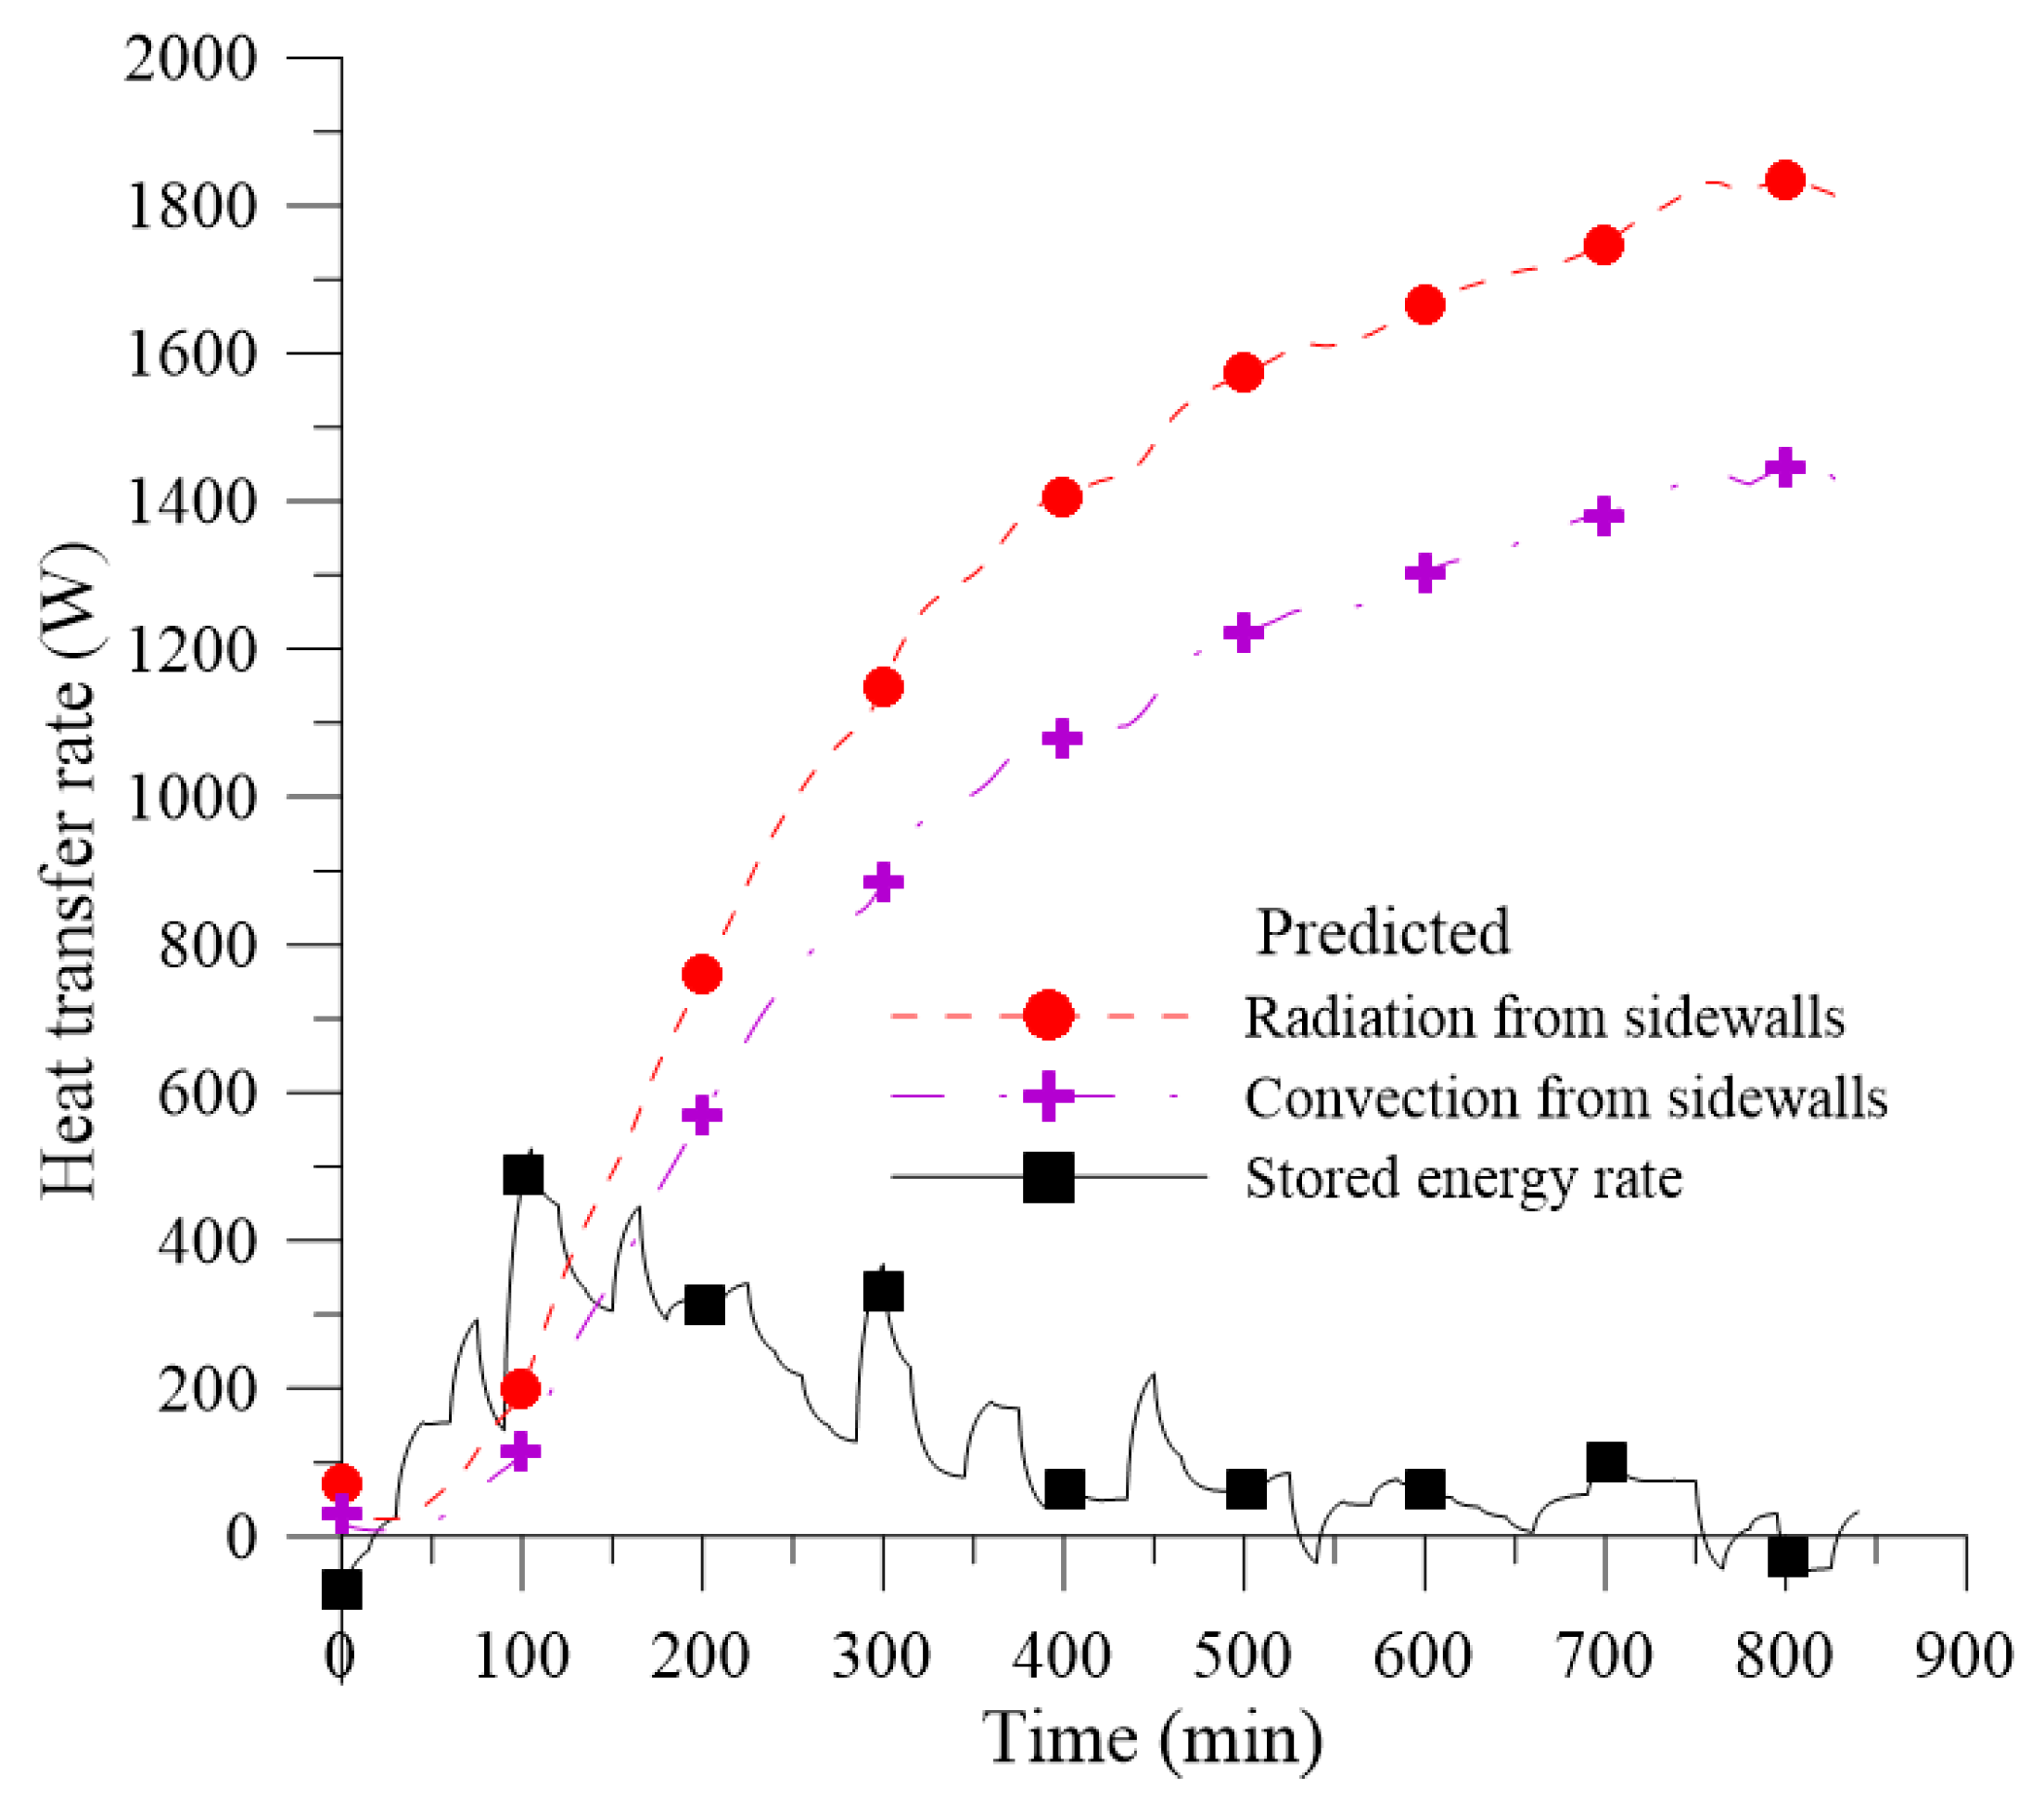
The energy lost by the sidewalls of the kiln was divided into two portions: Heat lost by convection, q c o n v , and heat lost by radiation, q r a d , according to Equation (12):
q lost sidewalls = q c o n v + q r a d .
The heat lost by convection is given by Equation 13:
q conv = A   × h ¯ c ×   ( T s , ext T ) ,
where A = 6.48 m2 is the sum of the outer sidewall areas of the kiln, h ¯ c is the convective heat transfer coefficient, T s , ext is the external surface temperature, and T is the temperature of the fluid that is in contact with the outer surface of the kiln (ambient air).
The convective heat transfer coefficient is a proportionality constant that summarizes the conditions in the boundary layers closest to the surface, and is dependent on the thermophysical properties of the fluid (density, viscosity, thermal conductivity, and specific heat), surface geometry, and nature of the flow (forced or natural convection, laminar or turbulent regime). This parameter can be obtained by the average Nusselt number (Equation (14)), as follows:
Nu ¯ L = h ¯ c   ×   L k f ,
where L is the characteristic length, which, for the present case, corresponds to the outer sidewall height of the kiln, and k f is the thermal conductivity of the fluid (ambient air).
As there is no presence of external sources to promote the movement of the fluid that is in contact with the kiln, it is assumed that the nature of the flow is by natural (or free) convection. In this way, the flow is induced by buoyancy forces, which originate from density differences caused by temperature variations in the fluid [45].
Modeling the sidewalls of the kiln as vertical flat plates and considering the laminar flow (104 ≤ RaL ≤ 109), the correlation recommended by Churchill and Chu [46] was used to calculate the average Nusselt number (Equation (15)), as follows:
Nu ¯ L = { 0.825   +   0.387   Ra L 1 / 6 [ 1   +   ( 0.492 / Pr ) 9 / 16 ] 8 / 27 } 2 ,
where Pr is the number of Prandtl, which represents the ratio between the momentum and thermal diffusivity of a fluid, and R a L is the Rayleigh number, defined by Equation (16):
Ra L = g × β × ( T s , ext T ) L 3 υ × α ,
where g is the gravity acceleration, β = 1 / T f is the volumetric expansion coefficient, T s , ext and T are the outer surface temperature of the kiln and ambient temperature, respectively. L is the characteristic length, υ is the kinematic viscosity, and α is the thermal diffusivity.
The values of the parameters, Pr, β, ν, and α, were tabulated according to the type and temperature of the fluid. For each instant of time, such values were obtained by interpolations taking into account the film temperature ( T f ), which correspond to the average temperature between the ambient temperature and the temperature of the outer surface of the kiln (Equation (17)), as follows:
T f = T s , ext   +   T 2 .
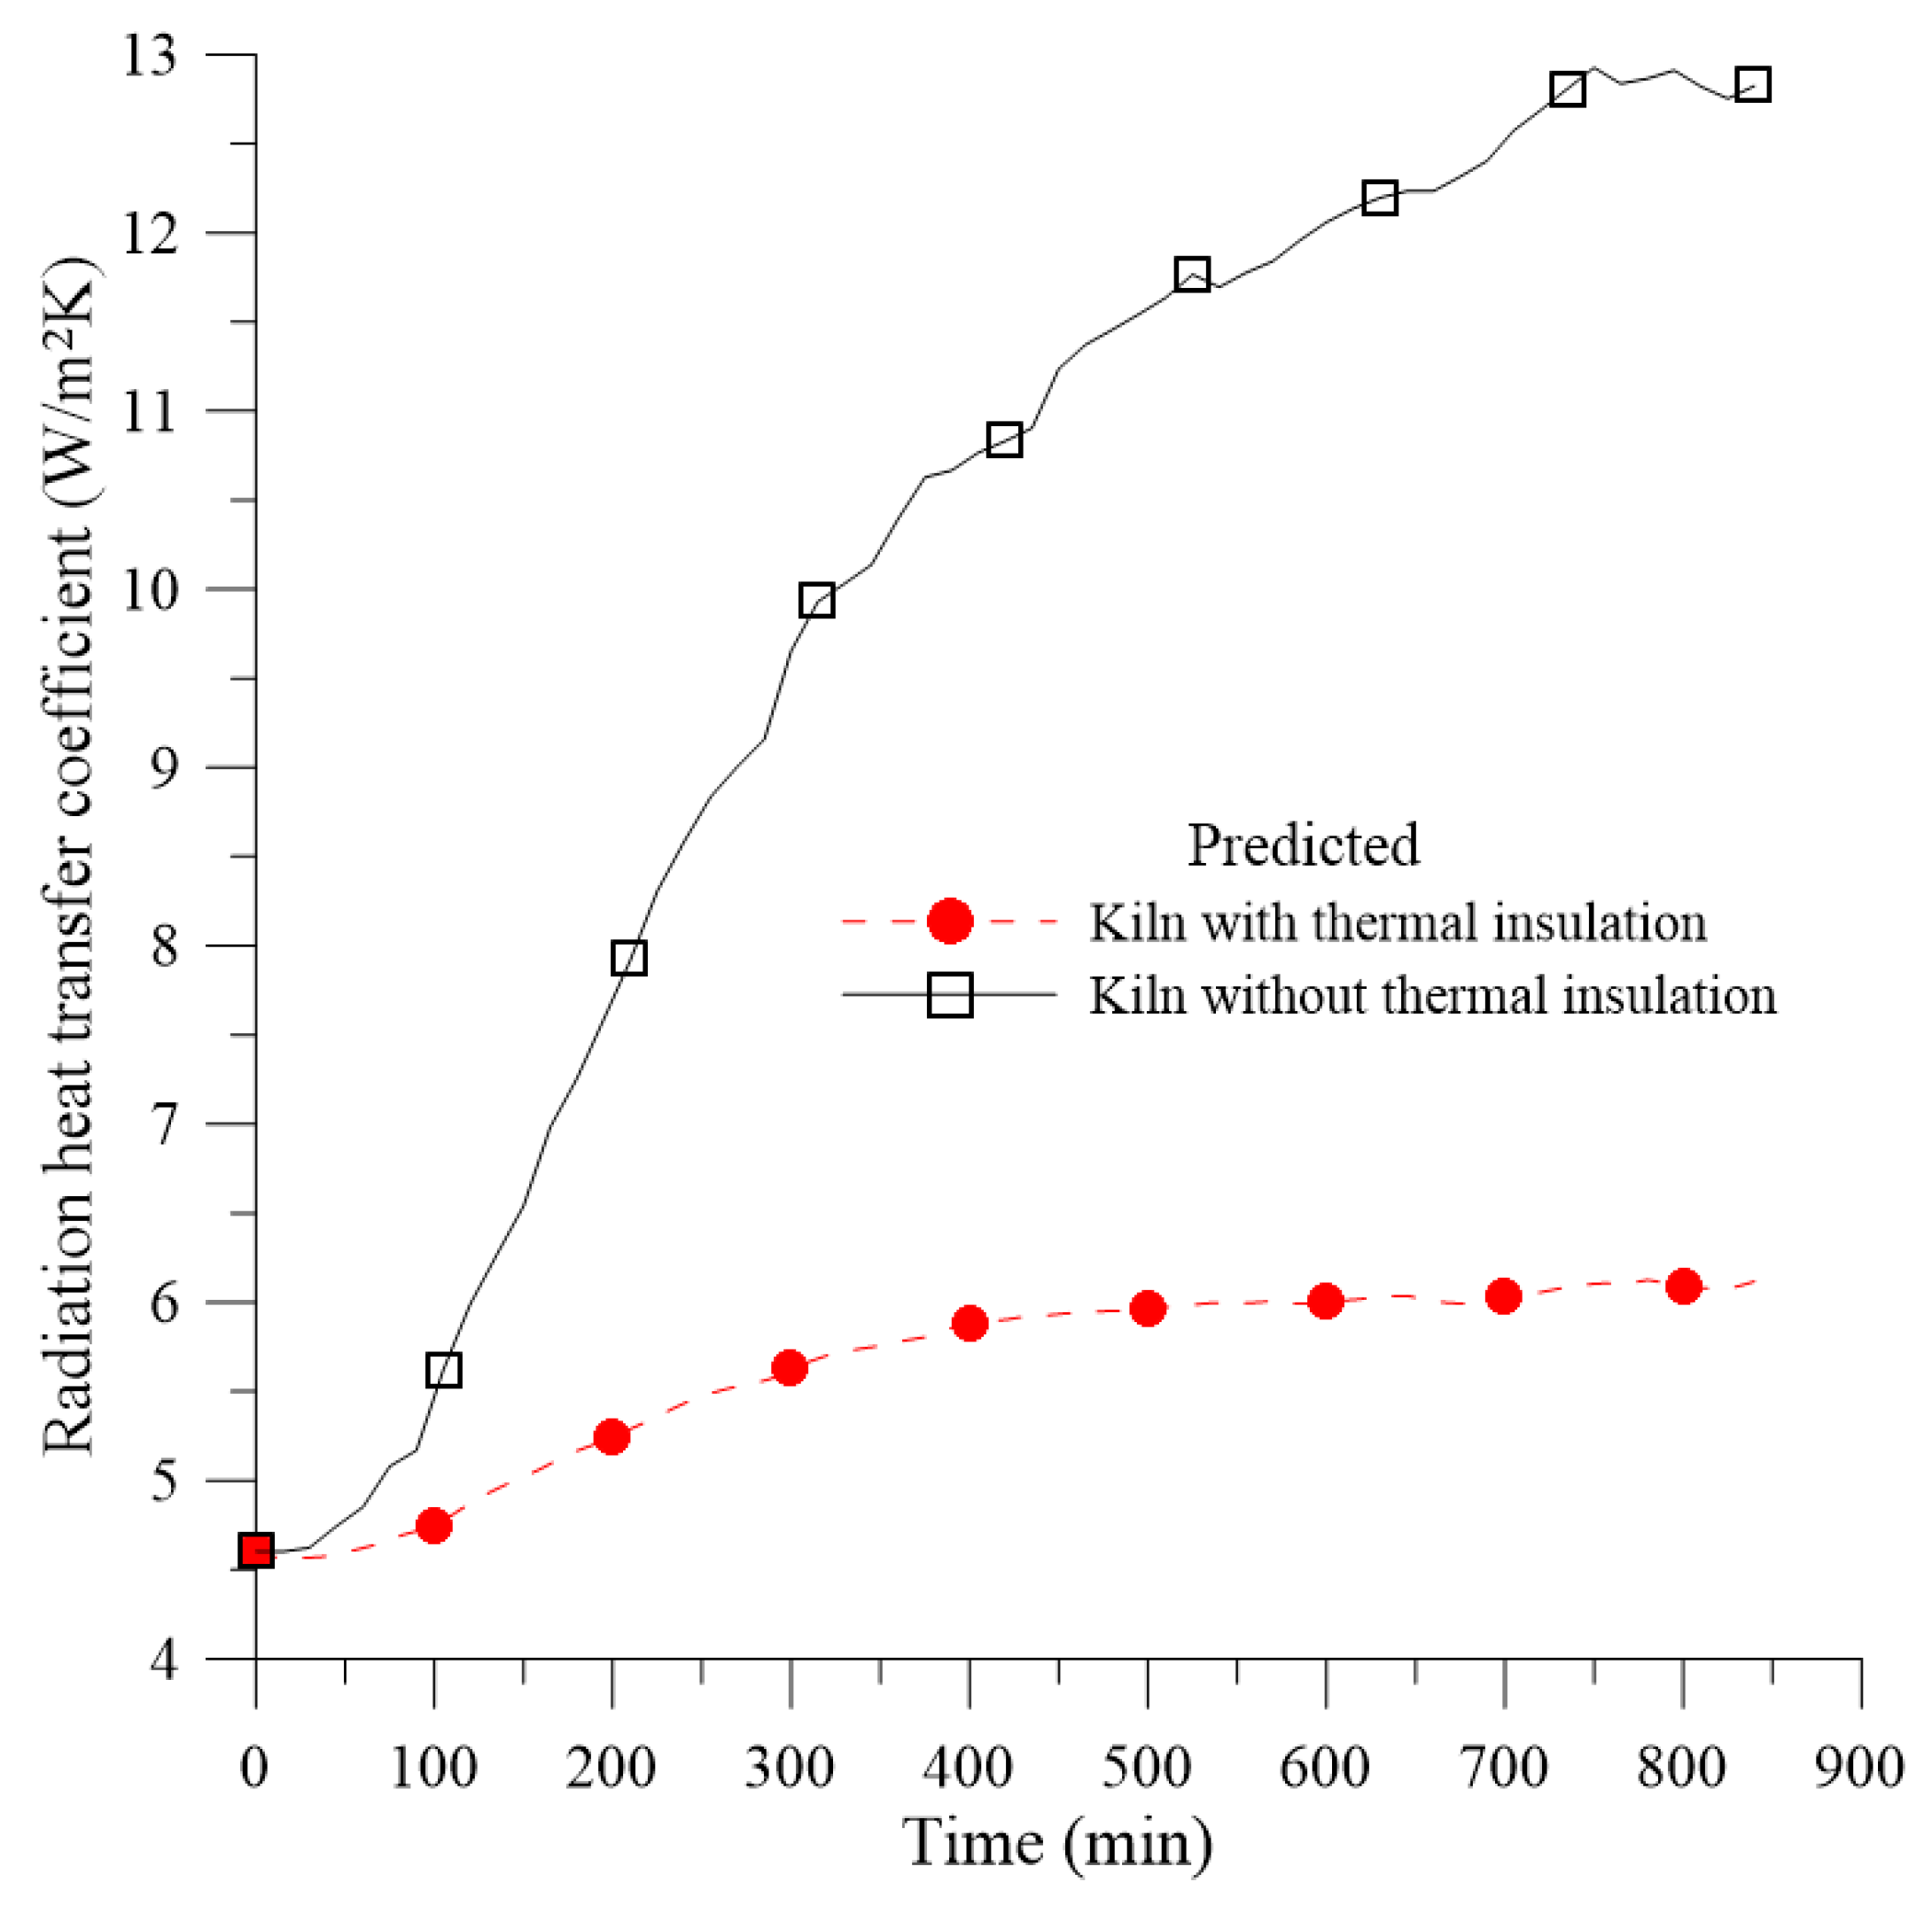
The heat lost by radiation is given by Equation (18), as follows:
q rad = A   ×   ε   ×   σ   ×   ( T s , ext 4 T sur 4 ) ,
where A is the sum of the areas of the outer sidewalls of the kiln, ε is the emissivity of the refractory brick surface (ε = 0.75 [47]), σ is the Stefan-Boltzmann constant (σ = 5.67 × 10⁻⁸ W/(m2.K4)), and Ts,ext and T s u r are the absolute temperatures of the outer surface of the kiln and the surroundings, respectively.
Heat lost by radiation is usually expressed similarly to heat lost by convection, as shown in Equation (19):
q rad = A   ×   h ¯ r   ×   ( T s , ext T sur ) ,
where, from Equation (18), the radiation heat transfer coefficient, h ¯ r , is given by Equation (20):
h ¯ r = ε   ×   σ   ×   ( T s , ext + T sur ) ( T s , ext 2 T sur 2 ) .
To determine the energy lost by the base/ceiling assembly, the system was modeled as a semi-infinite solid, which provides a useful idealization for the transient response of a finite solid, such as a thick slab [45]. For such modeling, temperatures at distant points, both below the base and above the dome (curved portion) of the kiln, are considered to be essentially unaffected by the change in surface conditions. Using the case of a constant surface temperature, which is more appropriate for the analysis presented here, the heat transfer rate lost by the base/ceiling assembly is given by Equation (21), as follows:
q lost base / ceiling = k s   ×   A base / ceiling   ×   ( T average   T ) π α   ×   Δ t ,
where k s = 0.16 W / mK is the thermal conductivity of the material,   A base / ceiling = 4.50   m 2 is the base/ceiling assembly area, α = k s / ρ c p = 1.3   ×   10 7 m 2 / s is the thermal diffusivity of the material, and T average represents the average temperature of the base and the ceiling of the kiln, which is calculated by Equation (10).
For the present case, the thermal properties of the sand were used, which was the predominant material used in the construction of the kiln base and in the region between the dome and the ceiling of the kiln. The sand was used to reduce heat losses to the environment.
Equations (1) to (21) were solved for each of the 234 time steps of the heating and cooling processes of the kiln without insulation using the Microsoft Excel software. As a result, all the heat transfer rates that occurred throughout all the heating and cooling steps of the kiln were identified. In addition, the total energy and the rate at which energy was supplied by the combustion gases as a function of the processing time were calculated.

2.3.2. Kiln with Thermal Insulation

In addition to performing the thermal analysis of the kiln as it was constructed (without thermal insulation), this work aims to verify the influence of the use of thermal insulation for the sidewalls of the equipment by quantifying the new heat losses and temperature distributions in the thermal insulation as well as the global energy gain that it provides for the system.
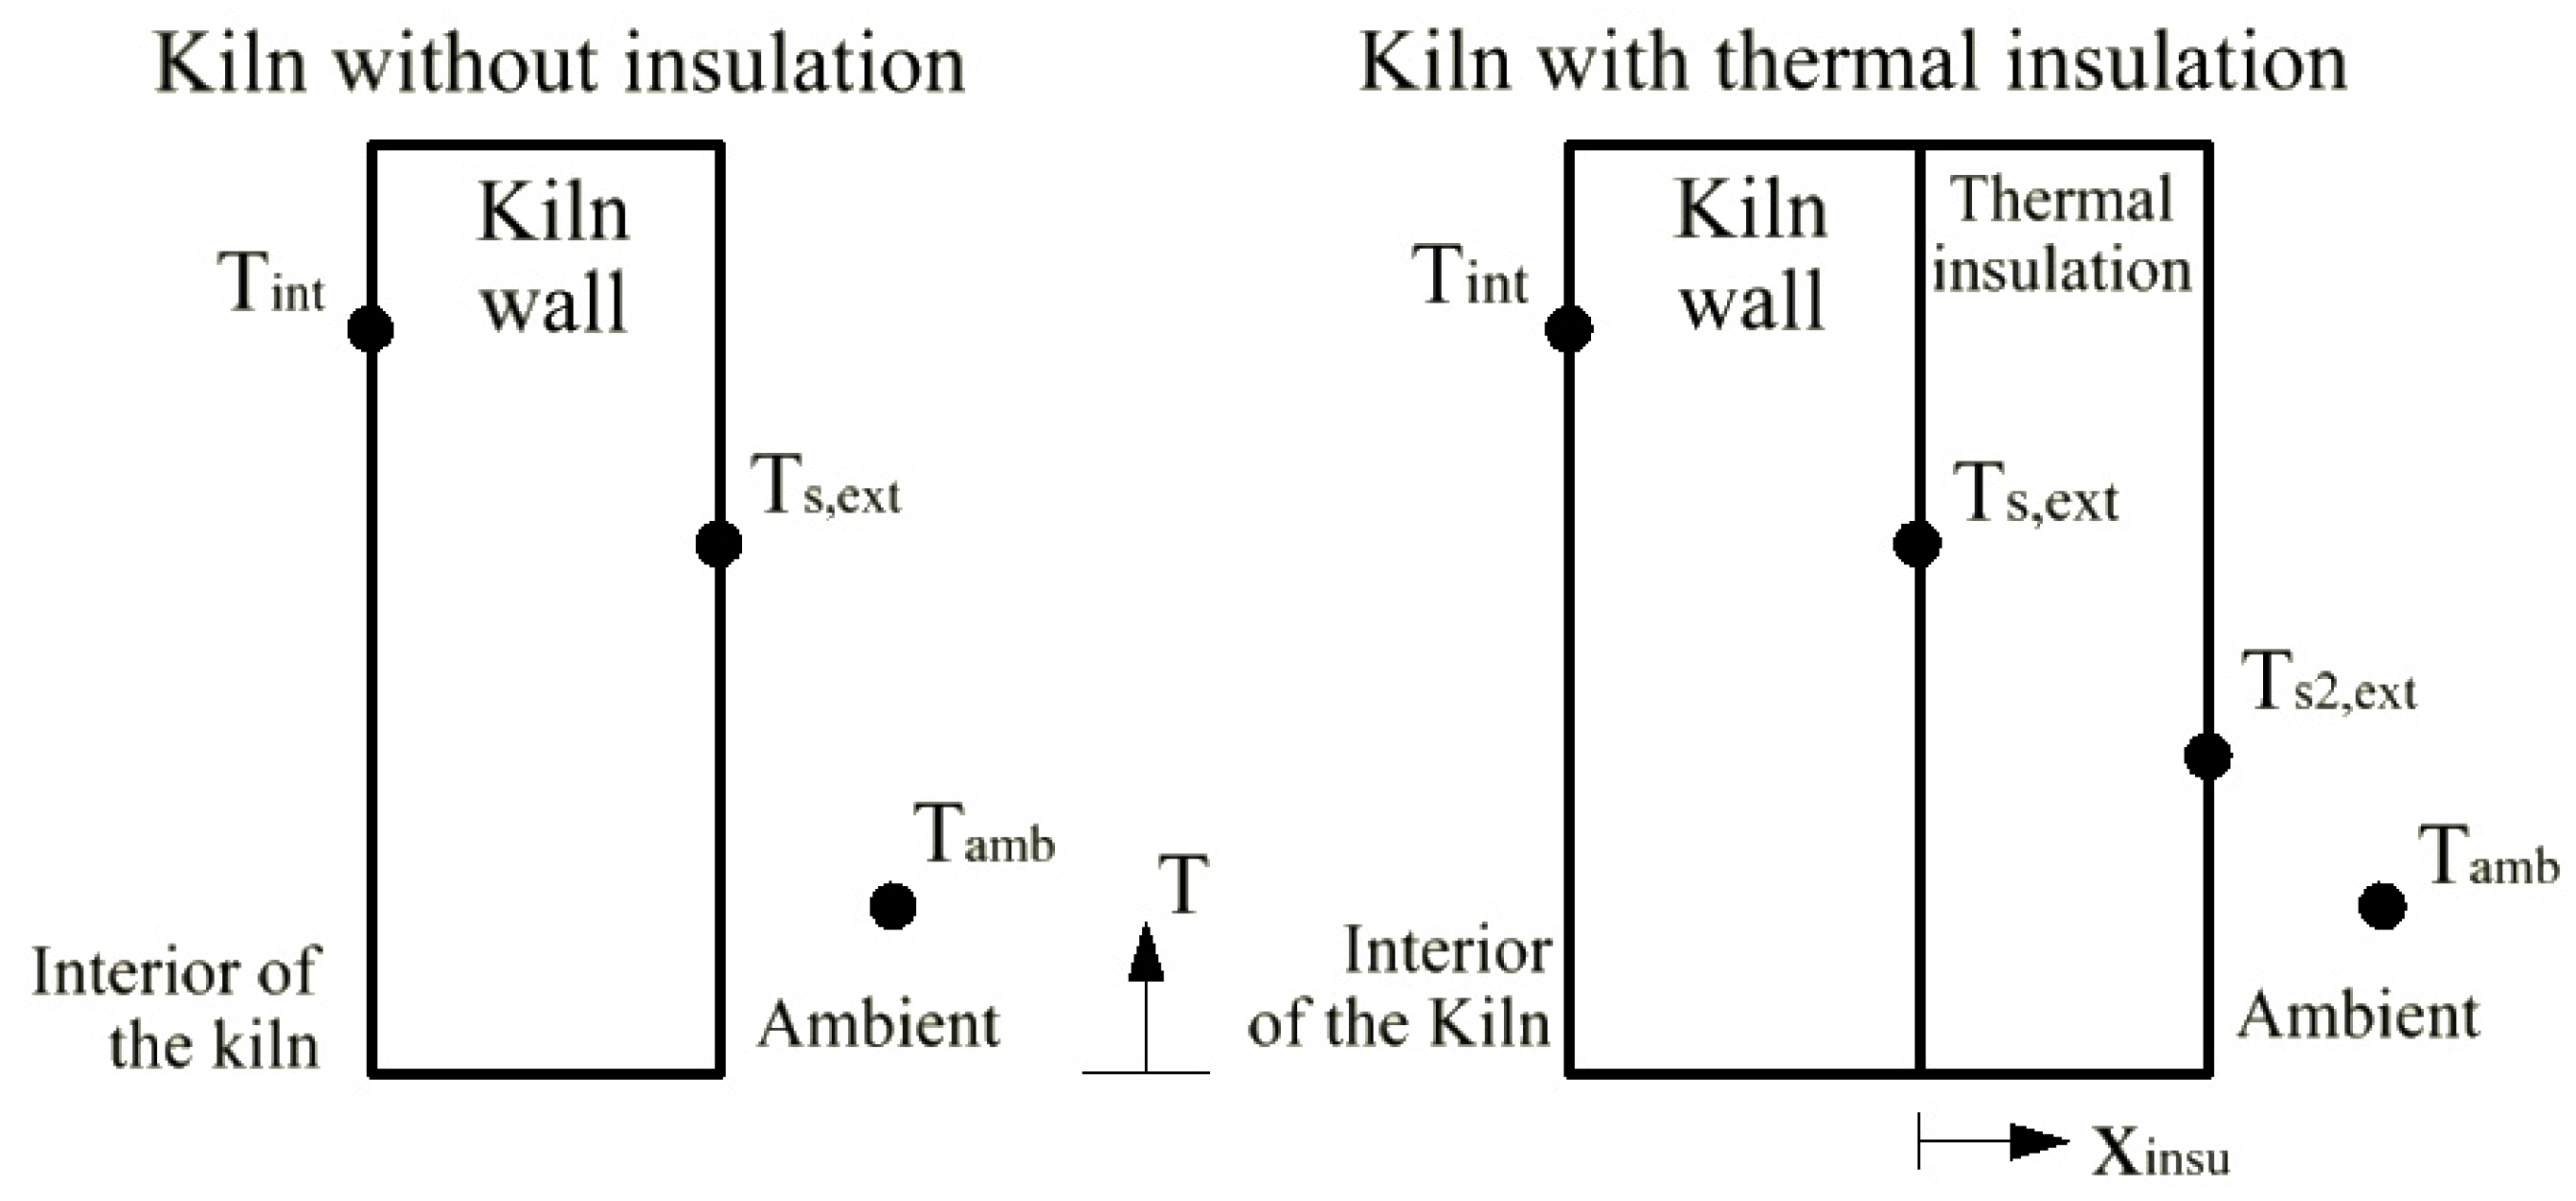
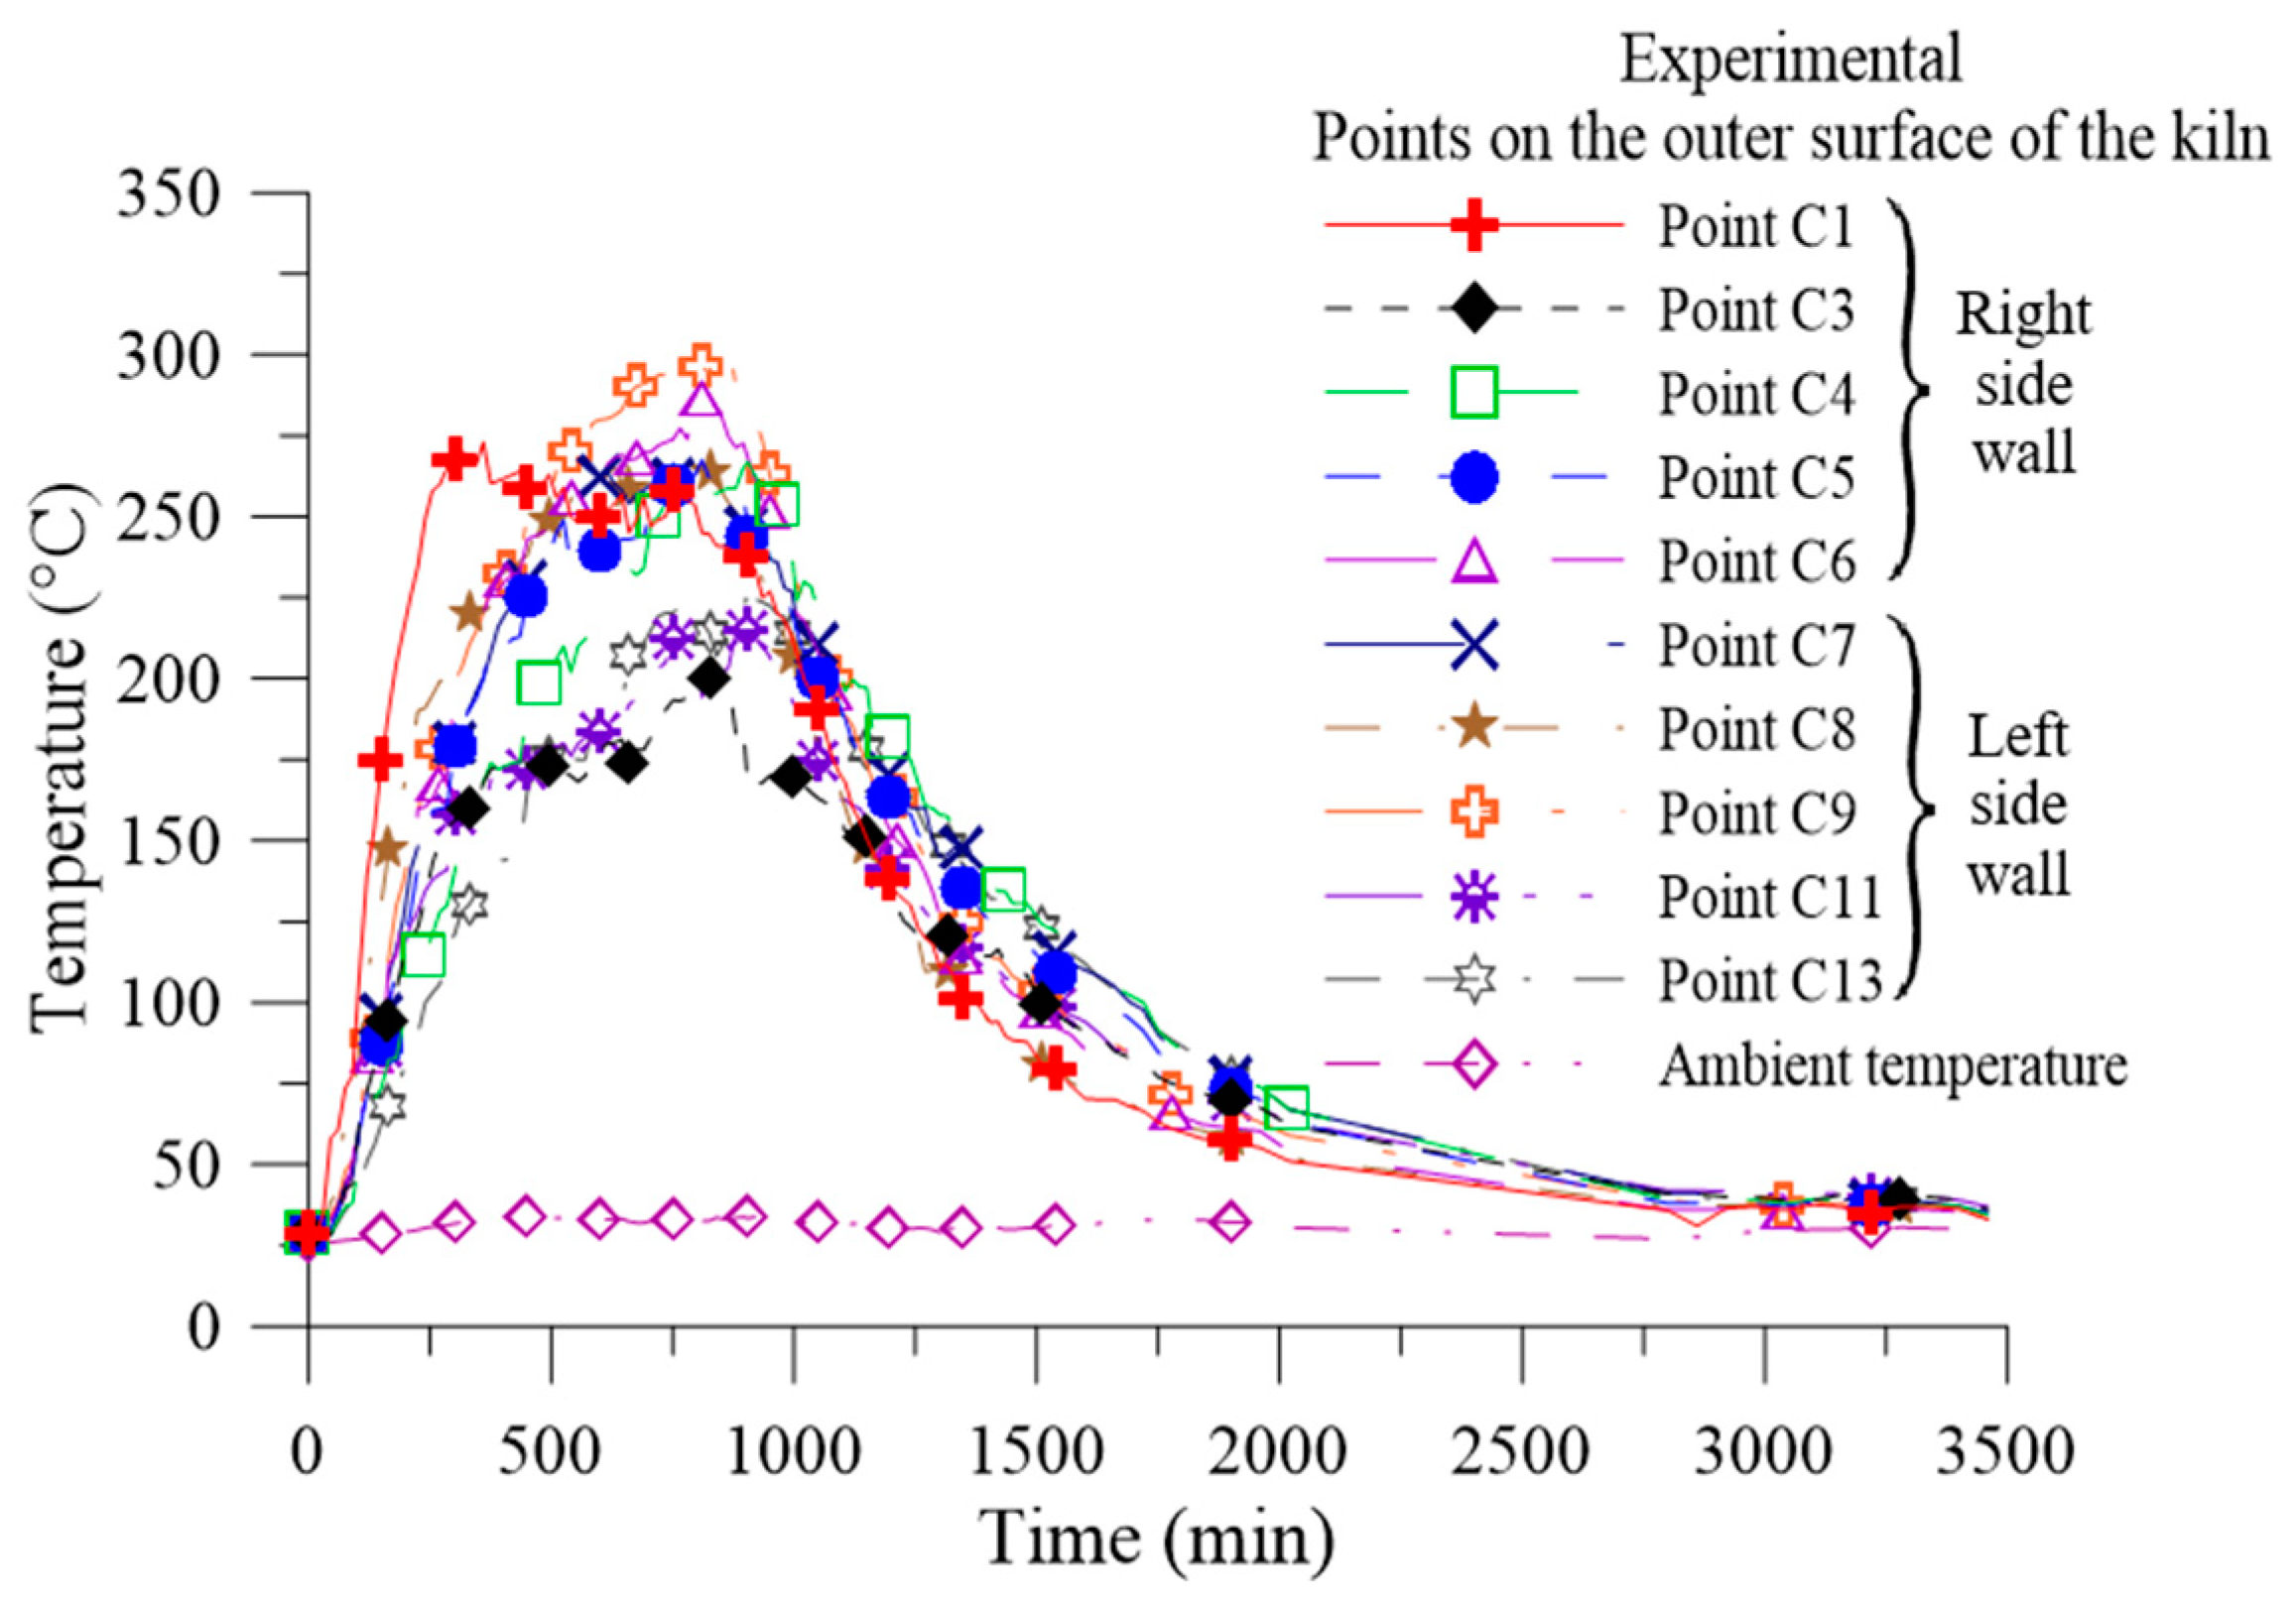
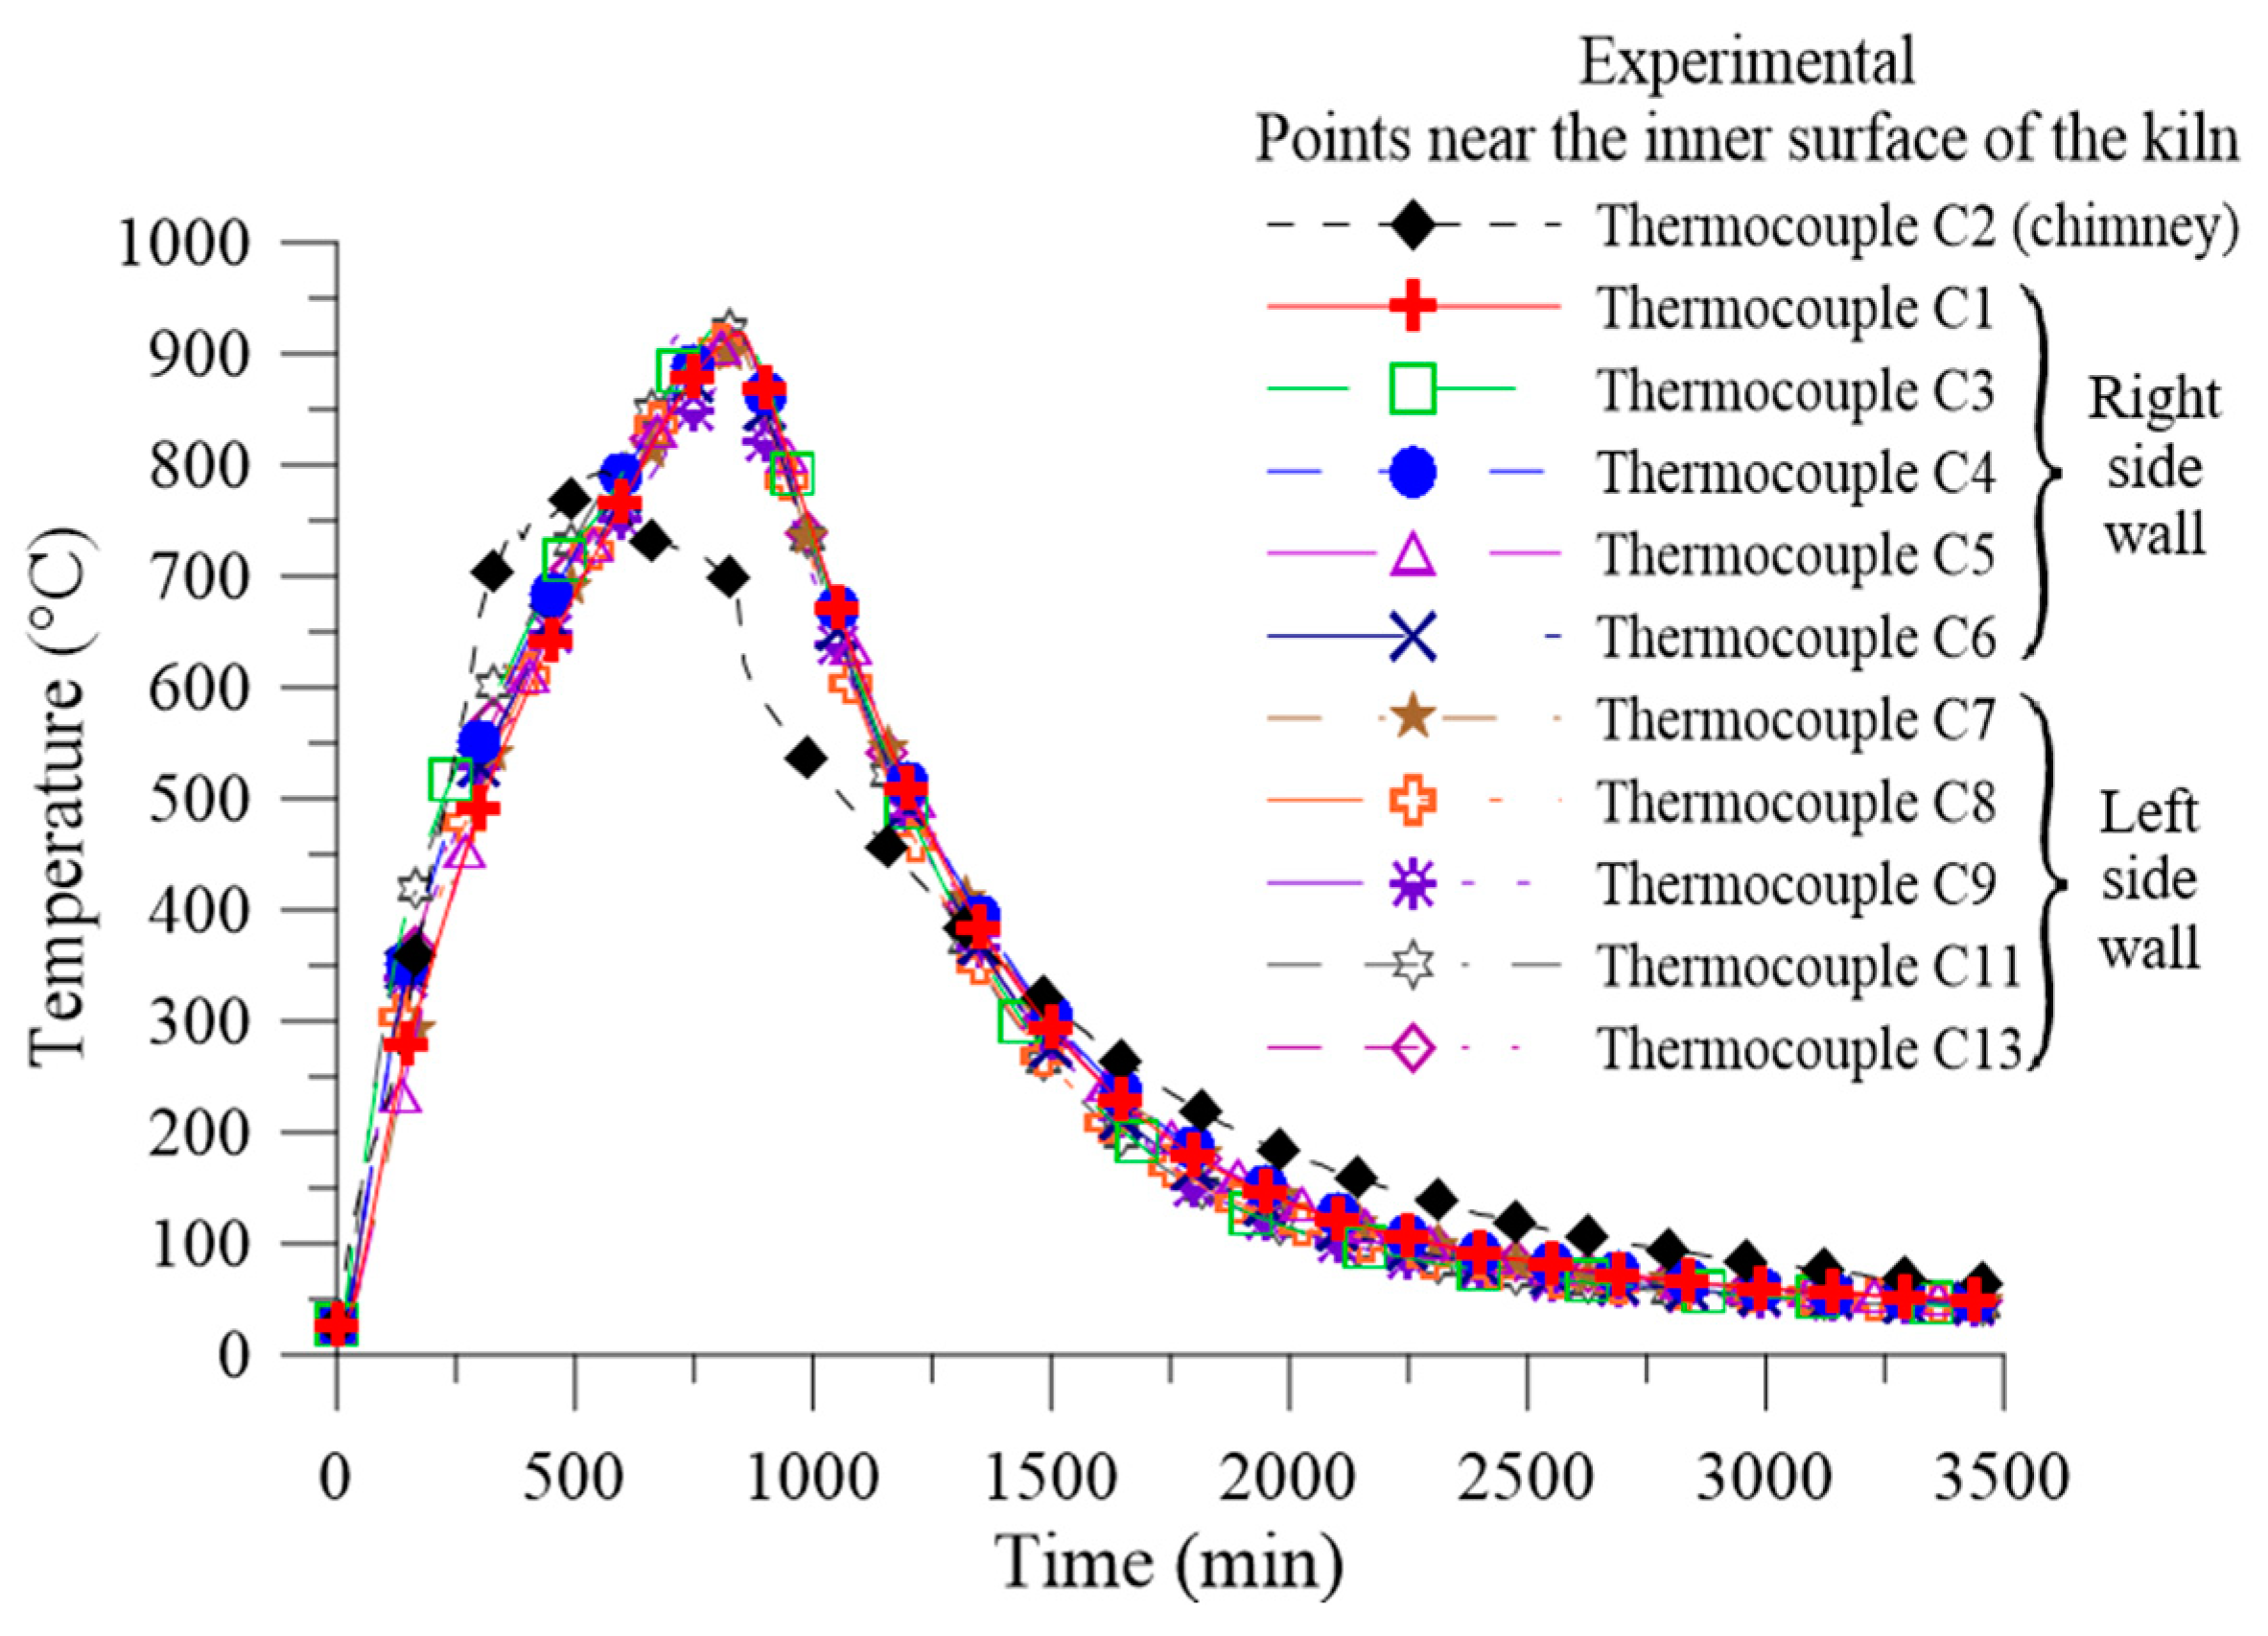
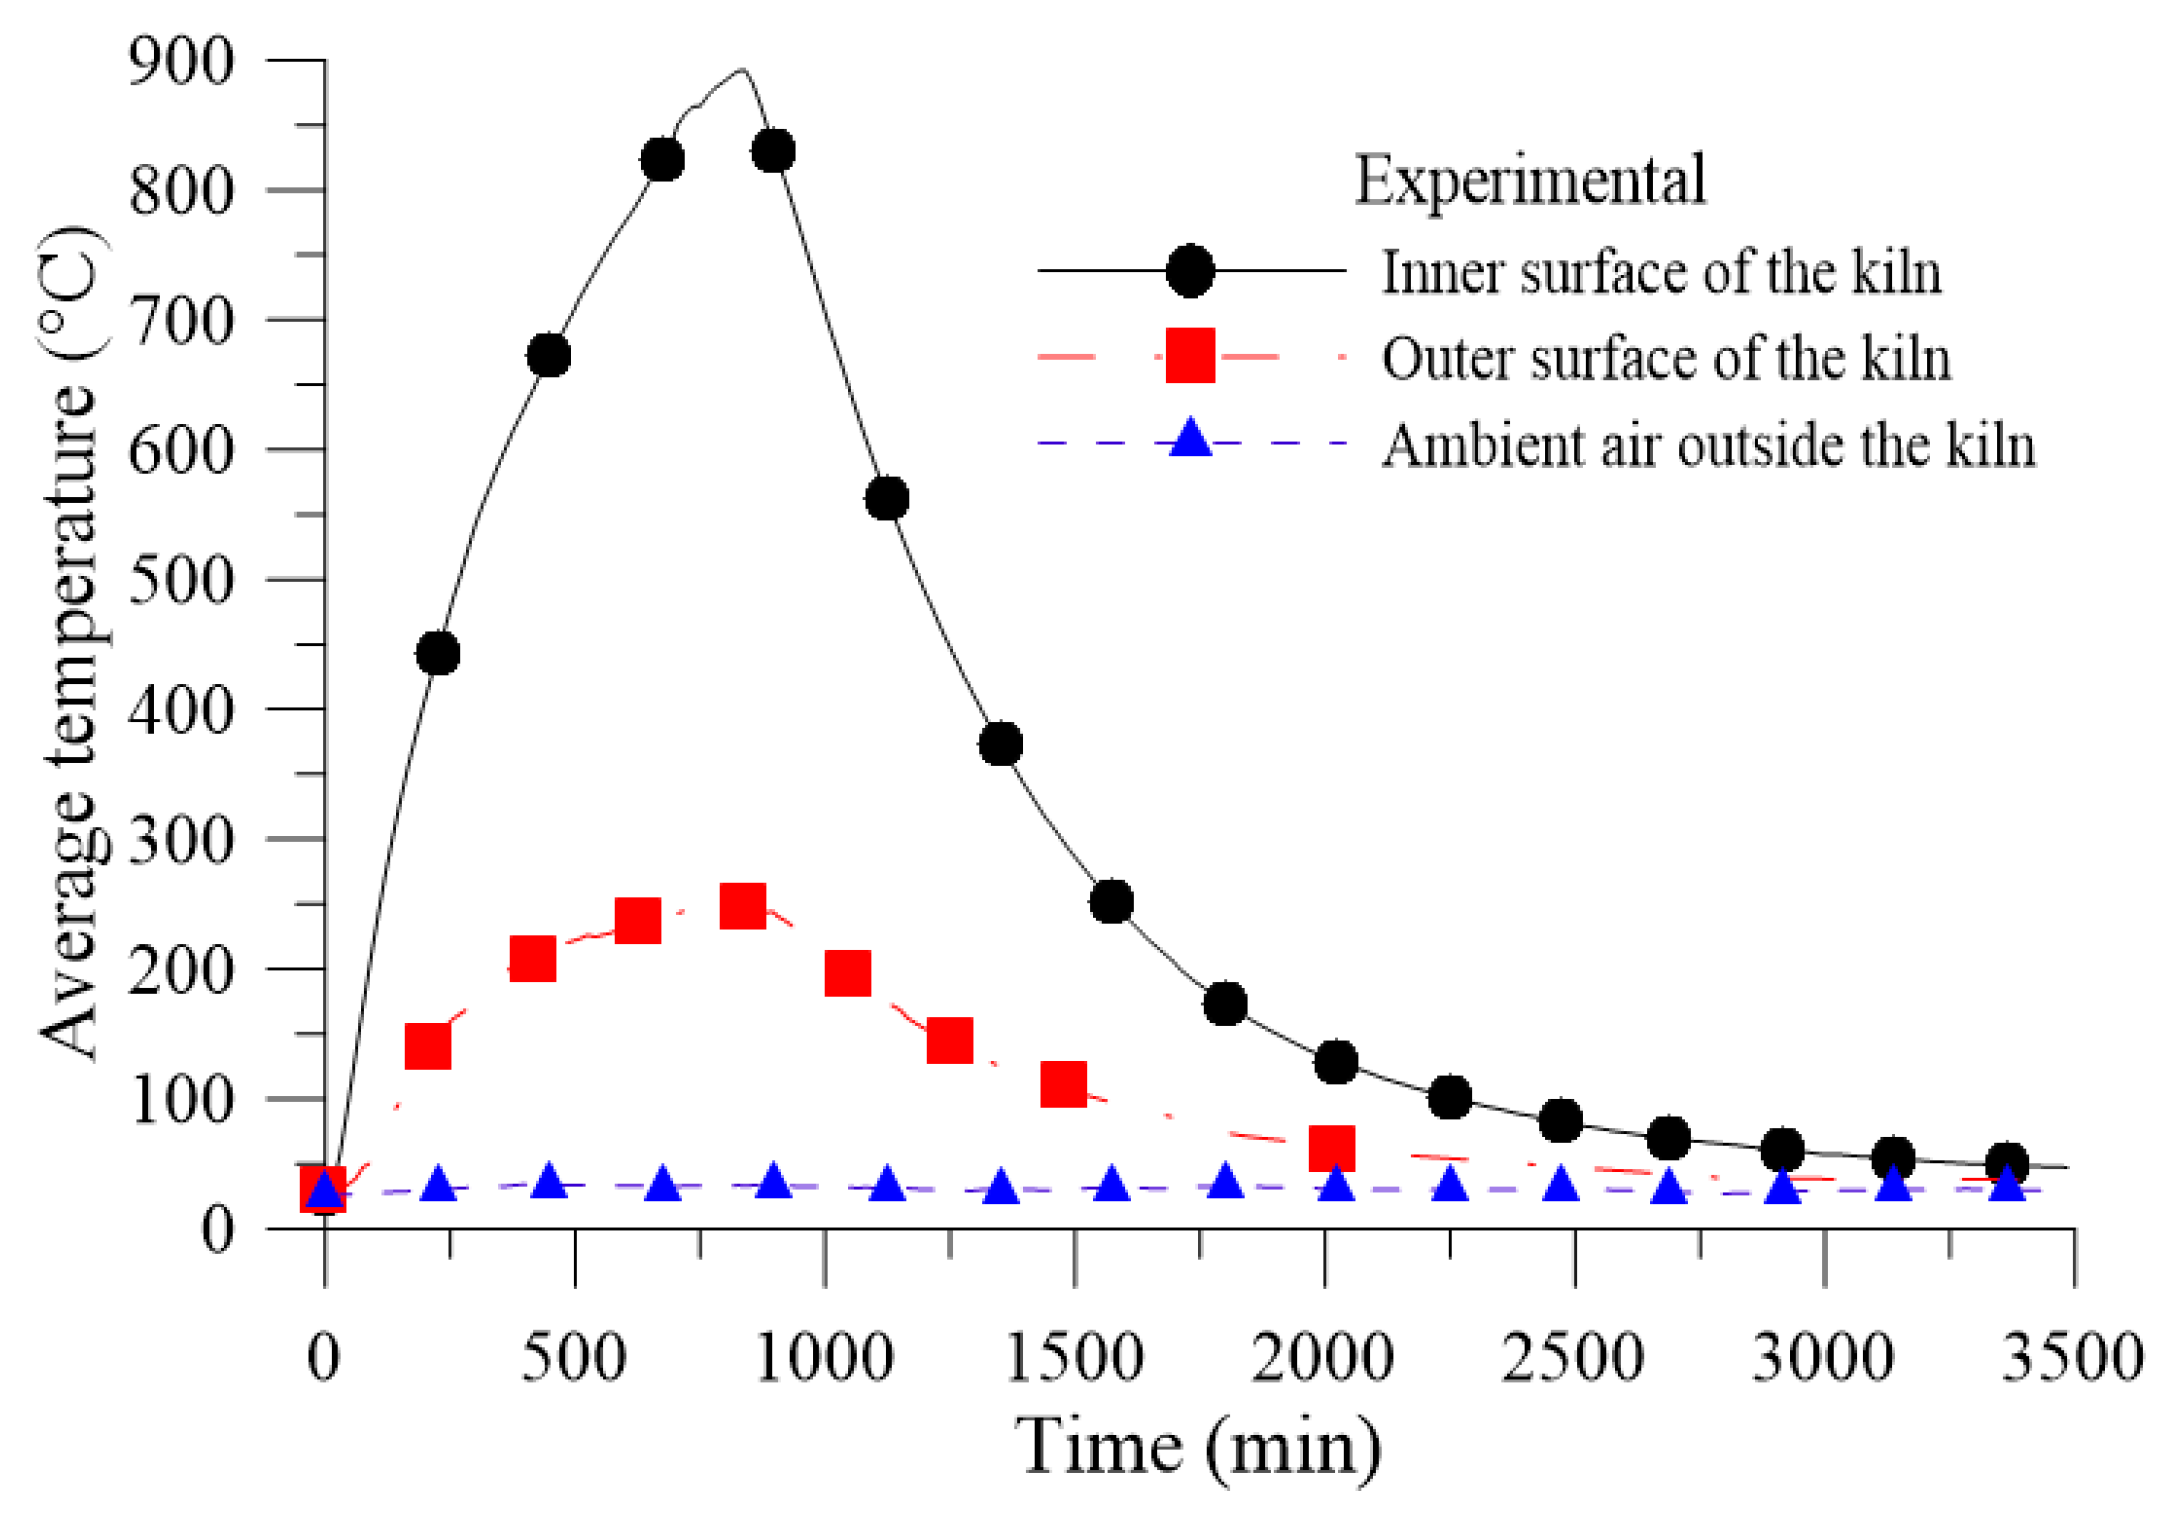
In order to conduct such an analysis, the internal (Tint) and external (Ts,ext) temperatures of the sidewalls of the kiln with thermal insulation during heating were considered to be the same as those obtained for the experiment with the kiln without thermal insulation, as indicated in Figure 4. This ensures that the firing curve was the same for both analyzed cases.
With this new configuration, the external temperature of the insulation, Ts2,ext, is unknown, thus not allowing the determination of the amount of heat lost by convection and radiation to the surroundings. Therefore, it must be determined.
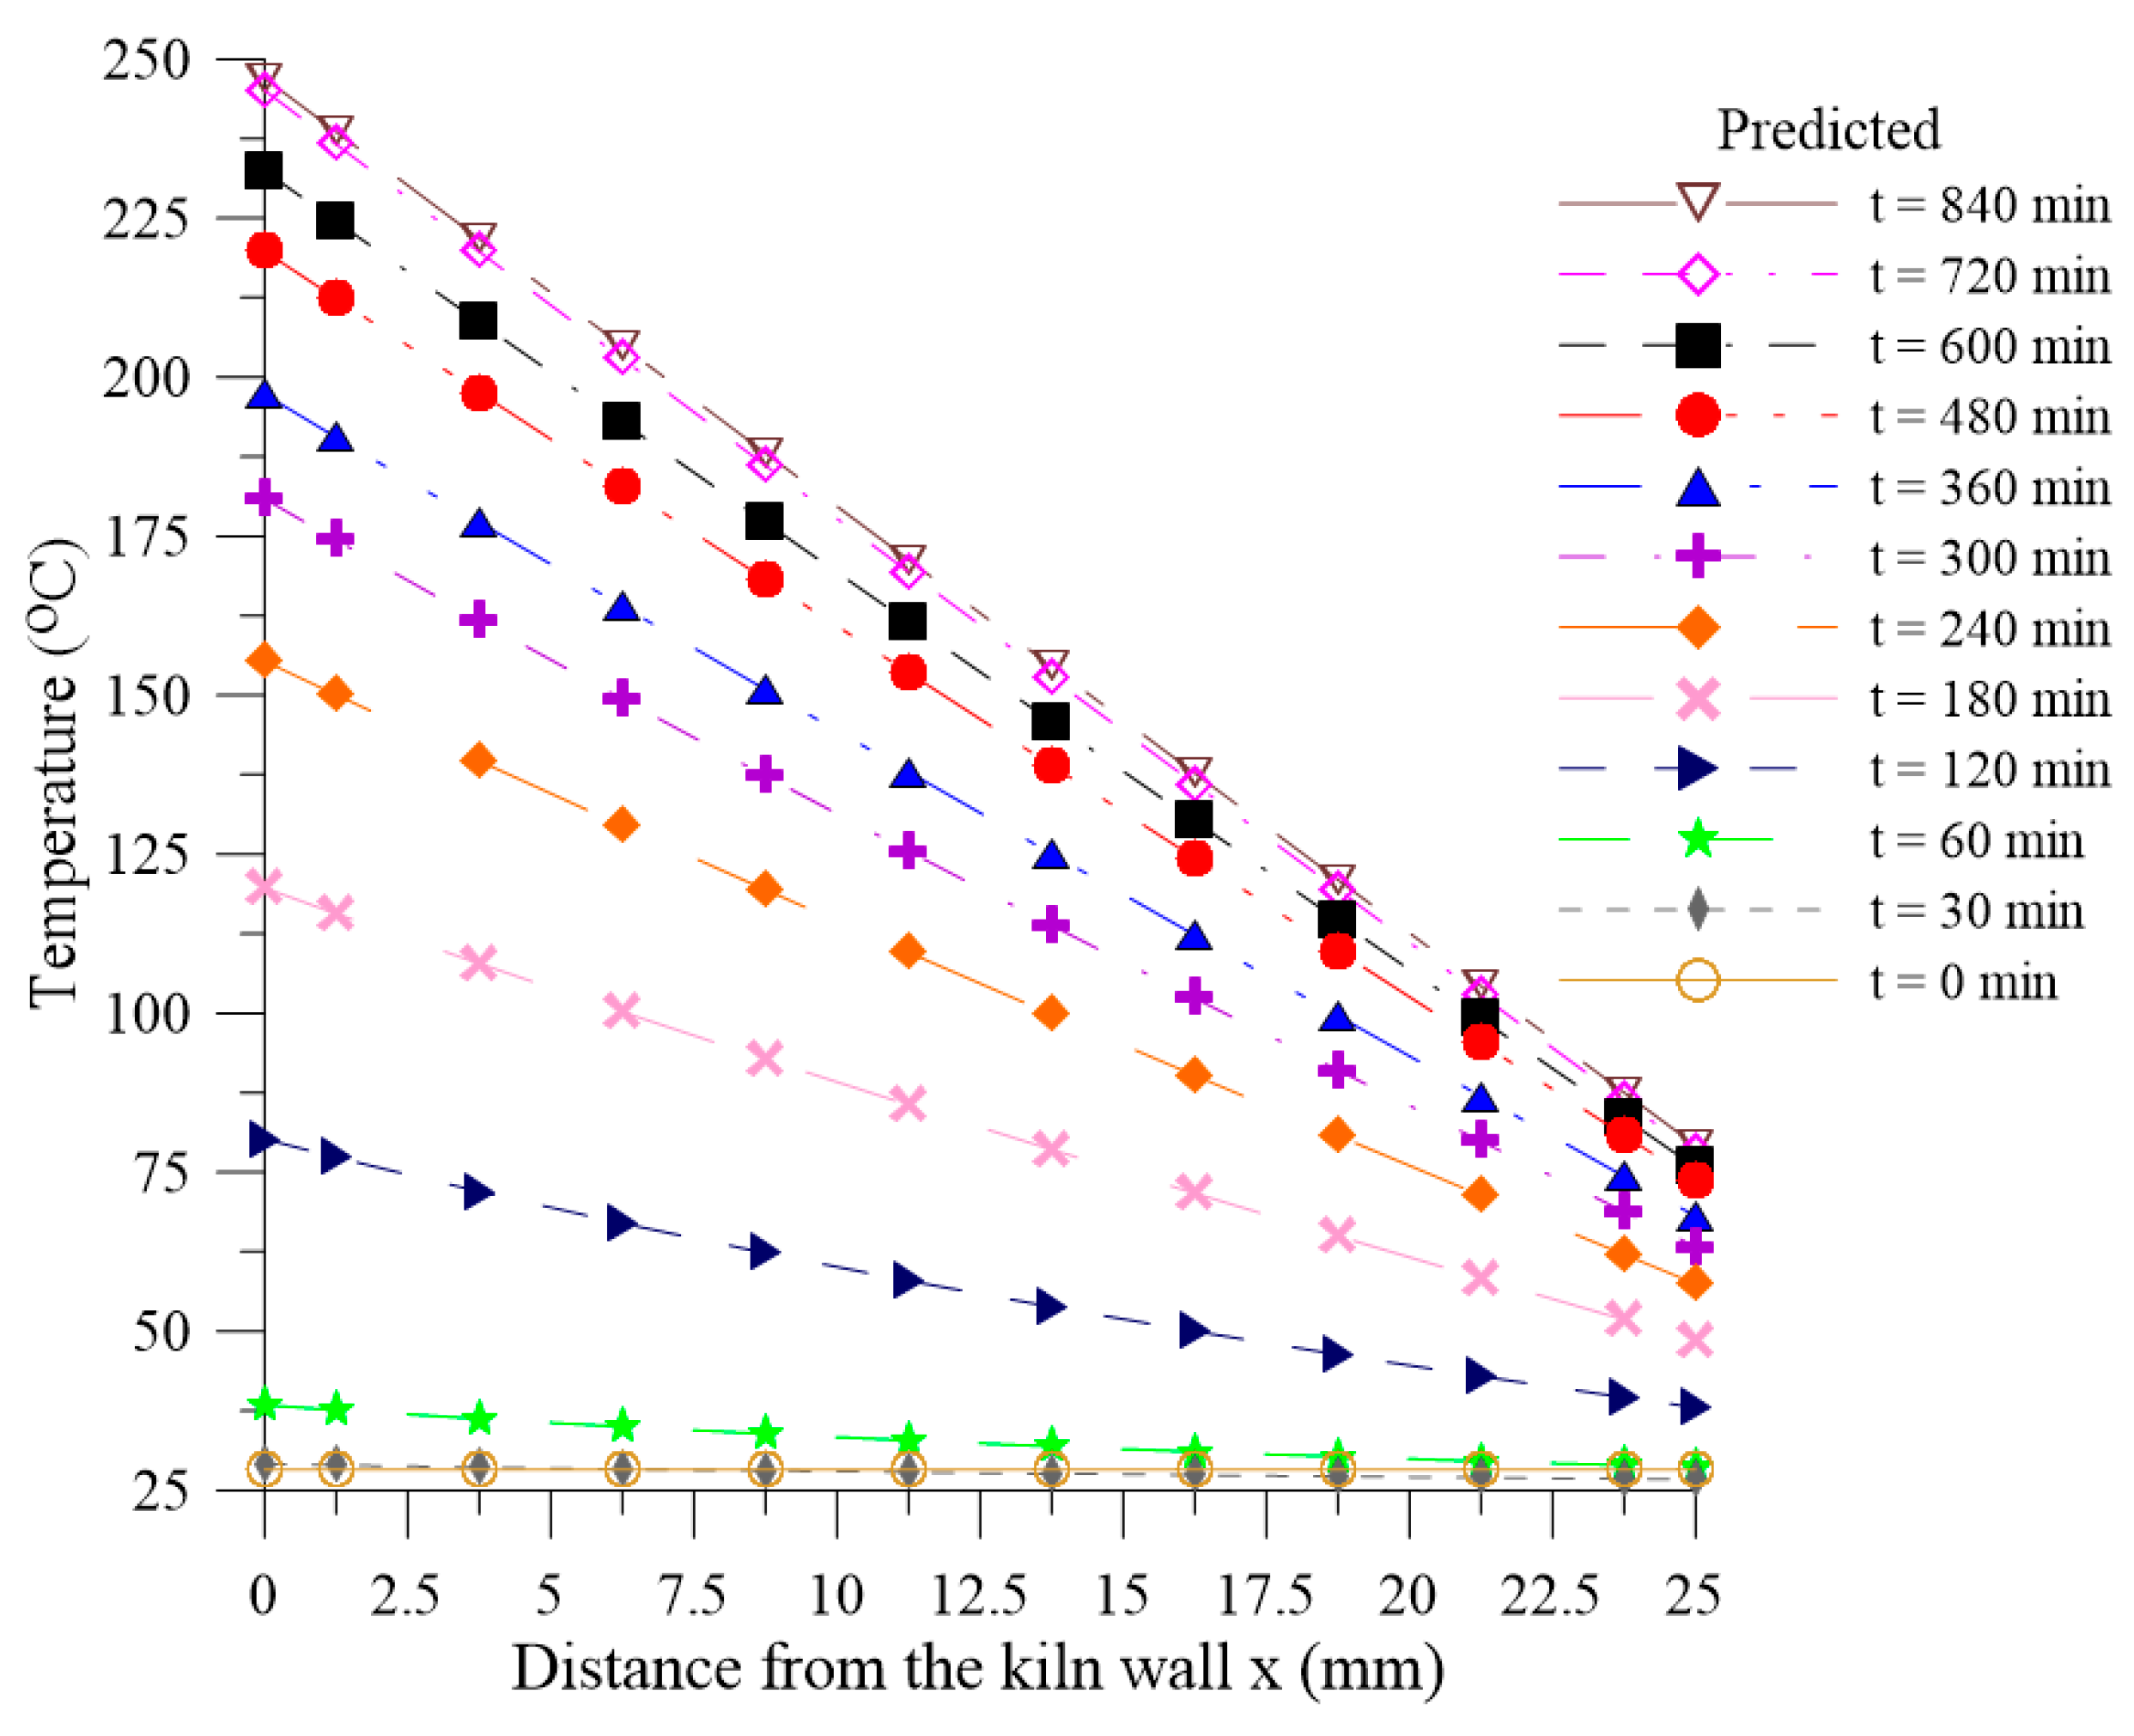
The type of thermal insulation analyzed was the Ceramic Fiber–LD–1200 with a thickness of 25 mm. Table 1 shows the thermal conductivity of the insulation as a function of the temperature, as well as the density, specific heat, emissivity, and recommended temperature range.
For this, it was assumed that the heat transferred inside the thermal insulation is given by pure conduction. In this case, the general differential equation for one-dimensional and transient heat conduction is governed by Equation (22), as follows:
ρ c p T t = x ( k T x ) + S ,
where ρ, cp, k, T, and S are the density, specific heat, thermal conductivity, temperature, and the source term, respectively, of the thermal insulation. For cases of heat transfer, the term source represents the rate at which energy is generated per unit volume [48].
The following initial and boundary conditions were used to model the heat transfer in thermal insulation:
(a)
Initial condition:
T ( x , t = 0 ) = T s , ext ( t = 0 ) = 28.26   o C .
(b)
Boundary condition on the wall of the kiln (x = 0):
T ( x = 0 , t ) = T s , ext ( t ) .
(c)
Boundary condition on the outer surface of the insulation (x = L):
k iso dT dx | x   =   L = ( h ¯ c + h ¯ r ) ( T s 2 , ext T amb ) ,
where Tamb = T = Tsur.
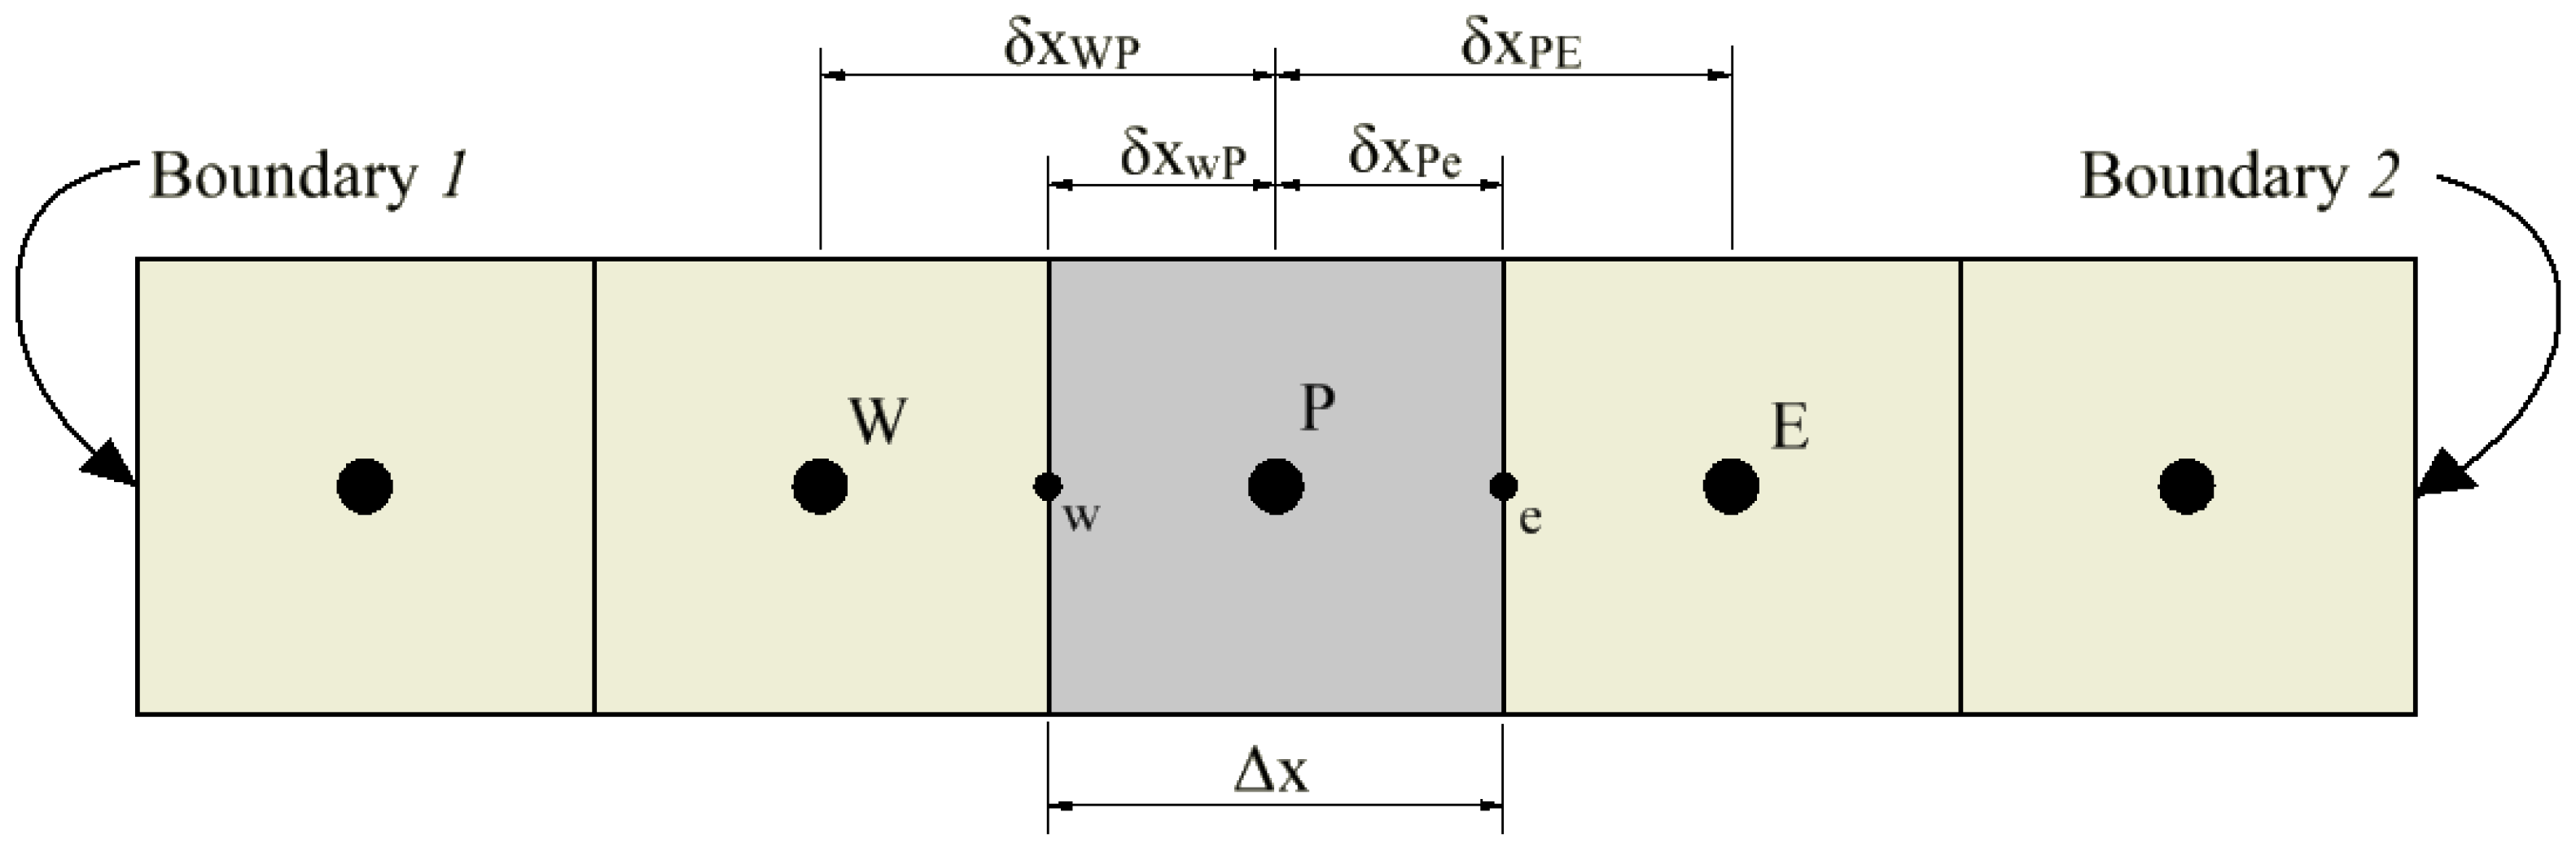
The numerical method used to solve Equation (22) was based on finite volume formulation. This method consists of dividing the domain into discrete sub-domains or control volumes and integrating the differential equation (Equation (22)) under each of these sub-domains and over time in order to obtain a set of algebraic equations relating the control volumes of the domain. For this, the domain of the thermal insulation was considered as being divided into five control volumes, as shown in Figure 5. The centroid of the control volume analyzed, in this case the third one, is always identified by the letter, P. The centroids of the west and east control volumes of this are identified by W and E, respectively. Similarly, the west and east faces of the analyzed control volume are identified by w and e. The distance between the west and east faces are identified by Δx, and represents the length of the control volume, P. The distances between the centroids, W and P, and between P and E are identified by δ x WP and δ x PE , respectively. Similarly, the distances between the face, w, and the centroid, P, and between P and the face, e, are identified by δ x wP and δ x Pe , respectively.
The discretization was done in such a way that the west face of the first control volume and the east face of the last control volume are coincident with the domain boundaries, x = 0 and x = L, respectively, ensuring that all control volumes are whole and of the same size (Δx).
Integrating Equation (22) on a given central control volume and over a time interval from t to Δt, the following equation can be formed:
t t   +   Δ t w e ρ c p T t dxdt = t t   +   Δ t w e x ( k T x ) dxdt + t t   +   Δ t w e Sdxdt .
As this is a transient problem, in this research, the fully implicit discretization scheme was used [48,49,50]. Disregarding the term source, and solving the integrals of Equation (26), we have the discretized equation for the control volumes of the computational domain, as follows:
a P T P = a E T E + a W T W + a P 0 T P 0 + S u ,
where:
a P = a E + a W + a P 0 S P .
The values of the coefficients, a E ,   a W ,   a P 0 ,   S u , and S P , for each control volume are shown in Table 2.
The variables, kw, ke, kf1, and kf2, are, respectively, the thermal conductivities in the faces west, east, west of the first control volume, and east of the last control volume. For simplification, these values of thermal conductivity were considered as constants for all control volumes at a given time, but changing from one instant to another as a function of the average temperature of the thermal insulation, according to Equation (29):
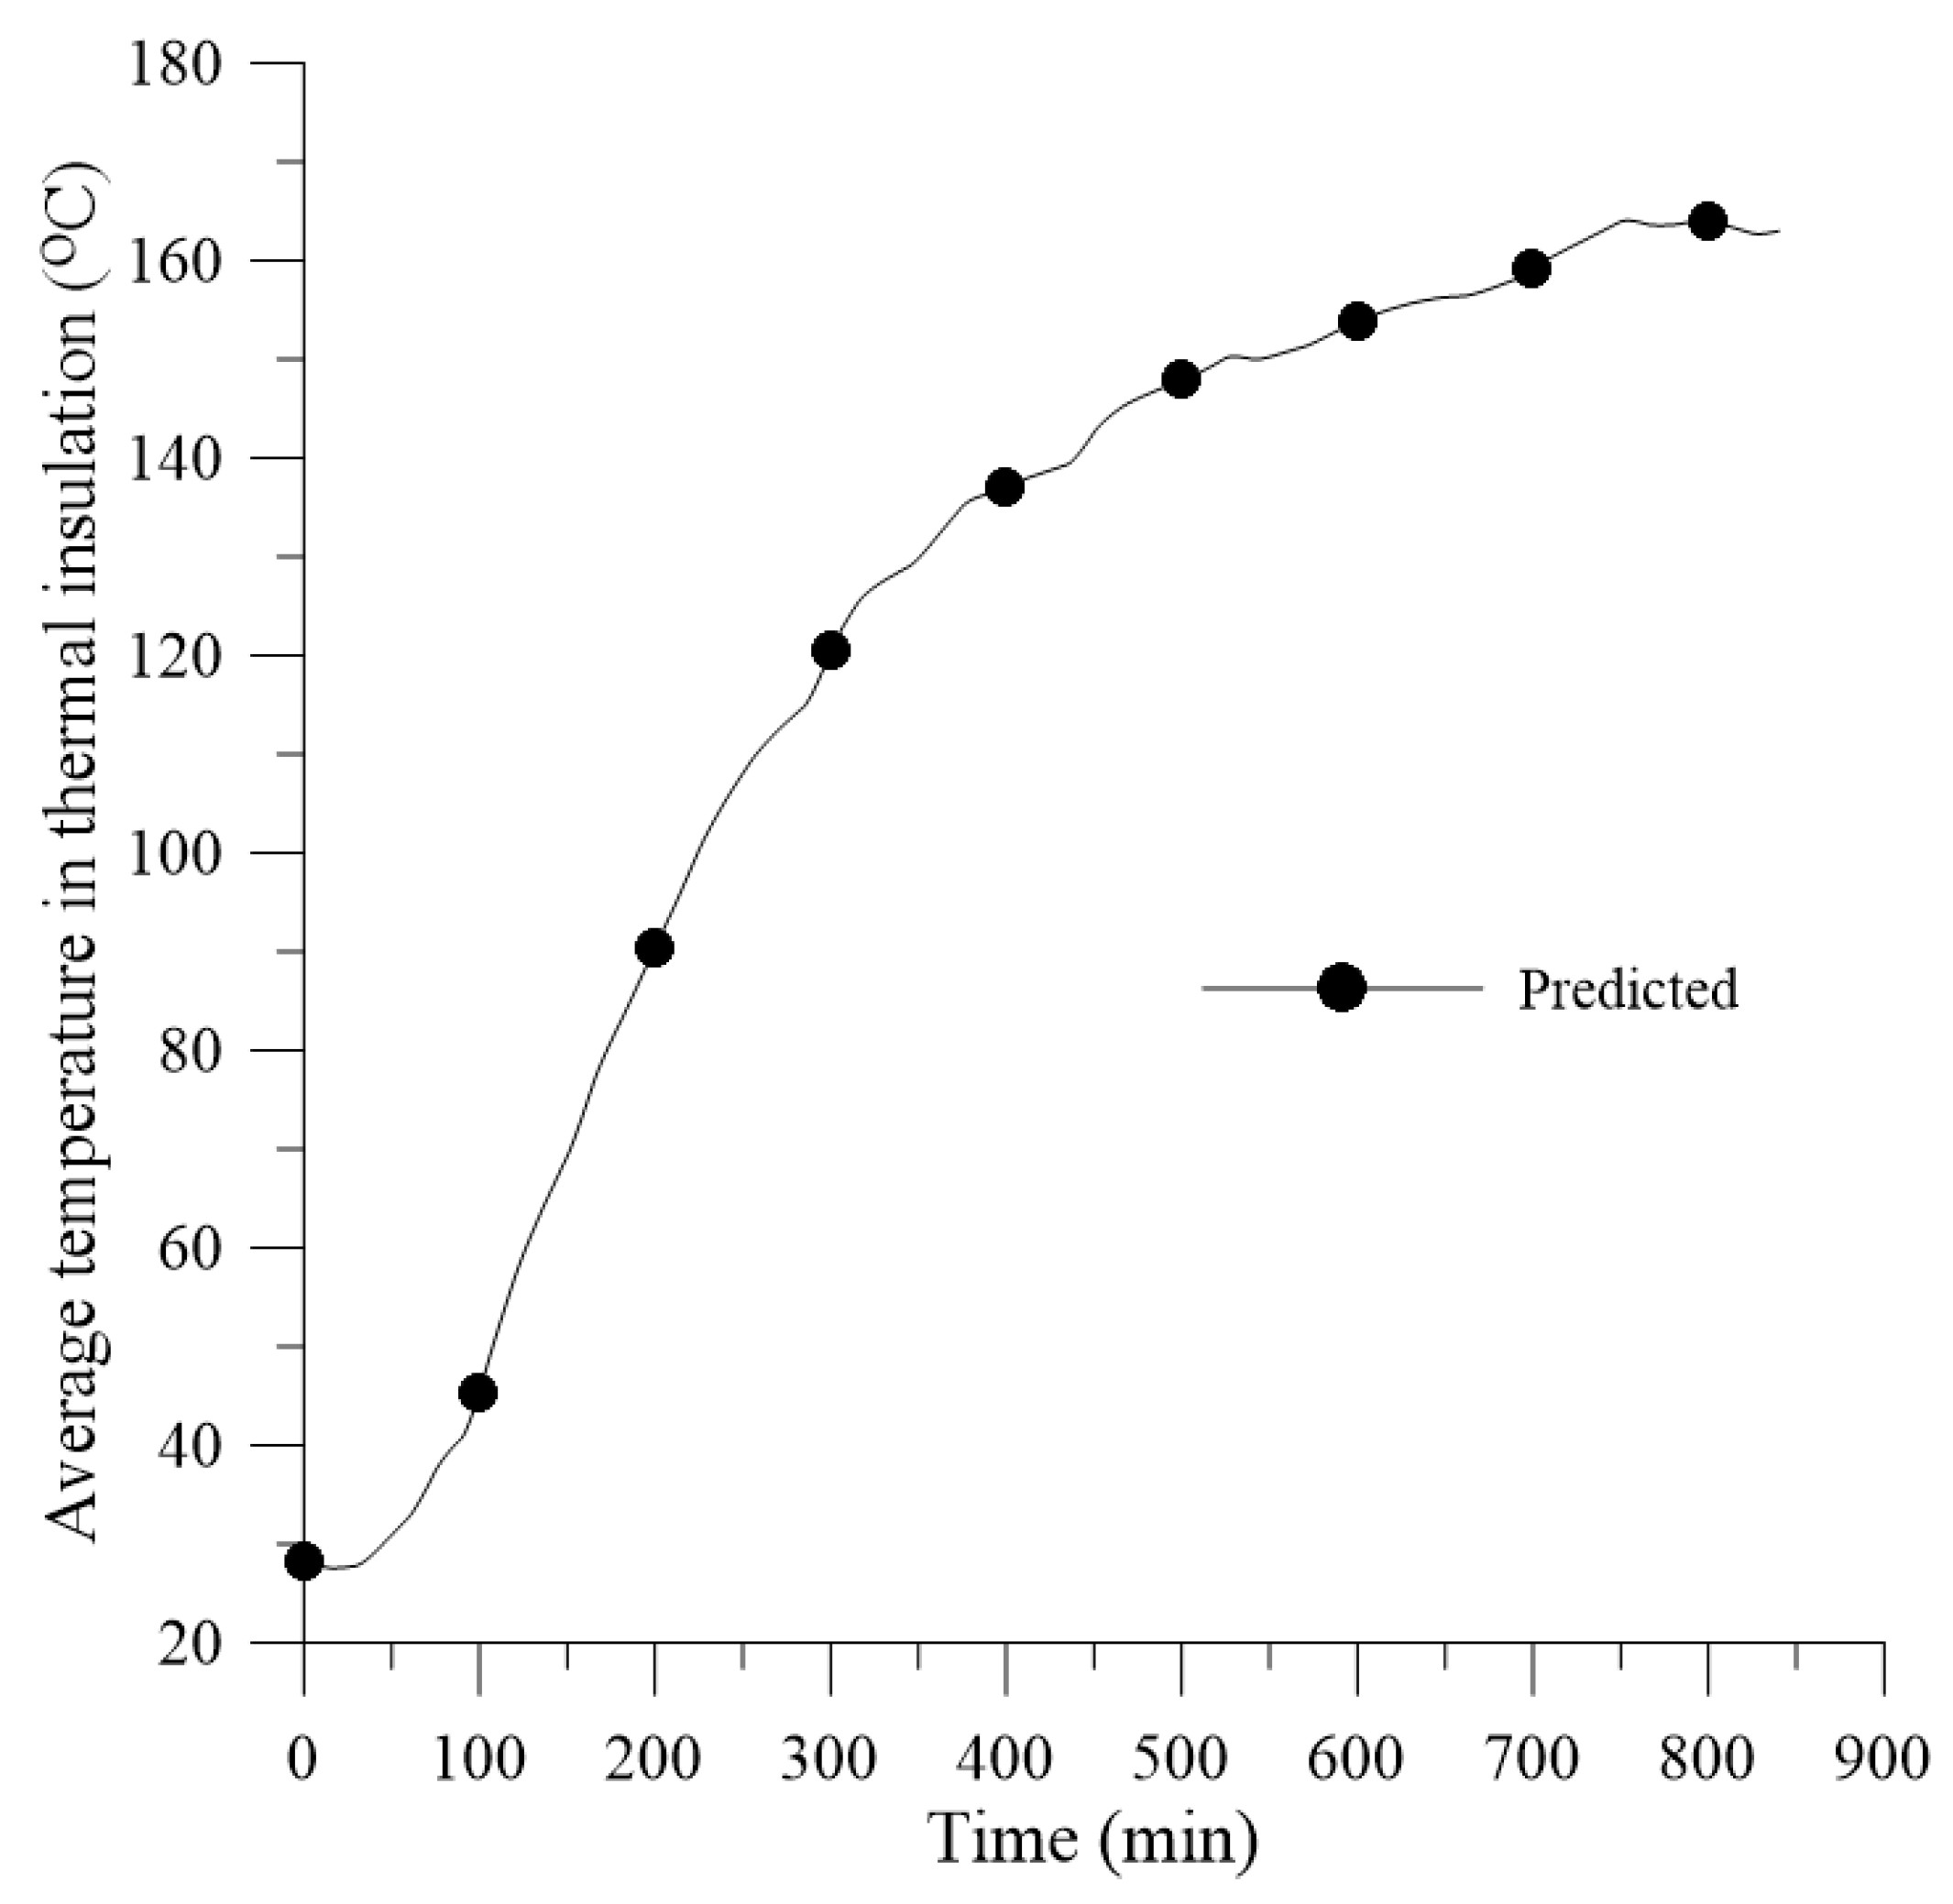
k w ( t ) = k e ( t ) = k f 1 ( t ) = k f 2 ( t ) = k ( t ) = f [ T med ( t ) ] ,
where T med ( t ) = 1 N i   =   1 N T i ( t ) is the average temperature of the thermal insulation at time t, N is the number of control volumes, and T i ( t ) is the temperature at the control volume, I, at time t. It is important to state that Equation (27) was applied to each control volume. This generated a system of linear algebraic equations that must be solved at each instant of time. For this, the iterative calculation available in Microsoft Excel software was enabled.
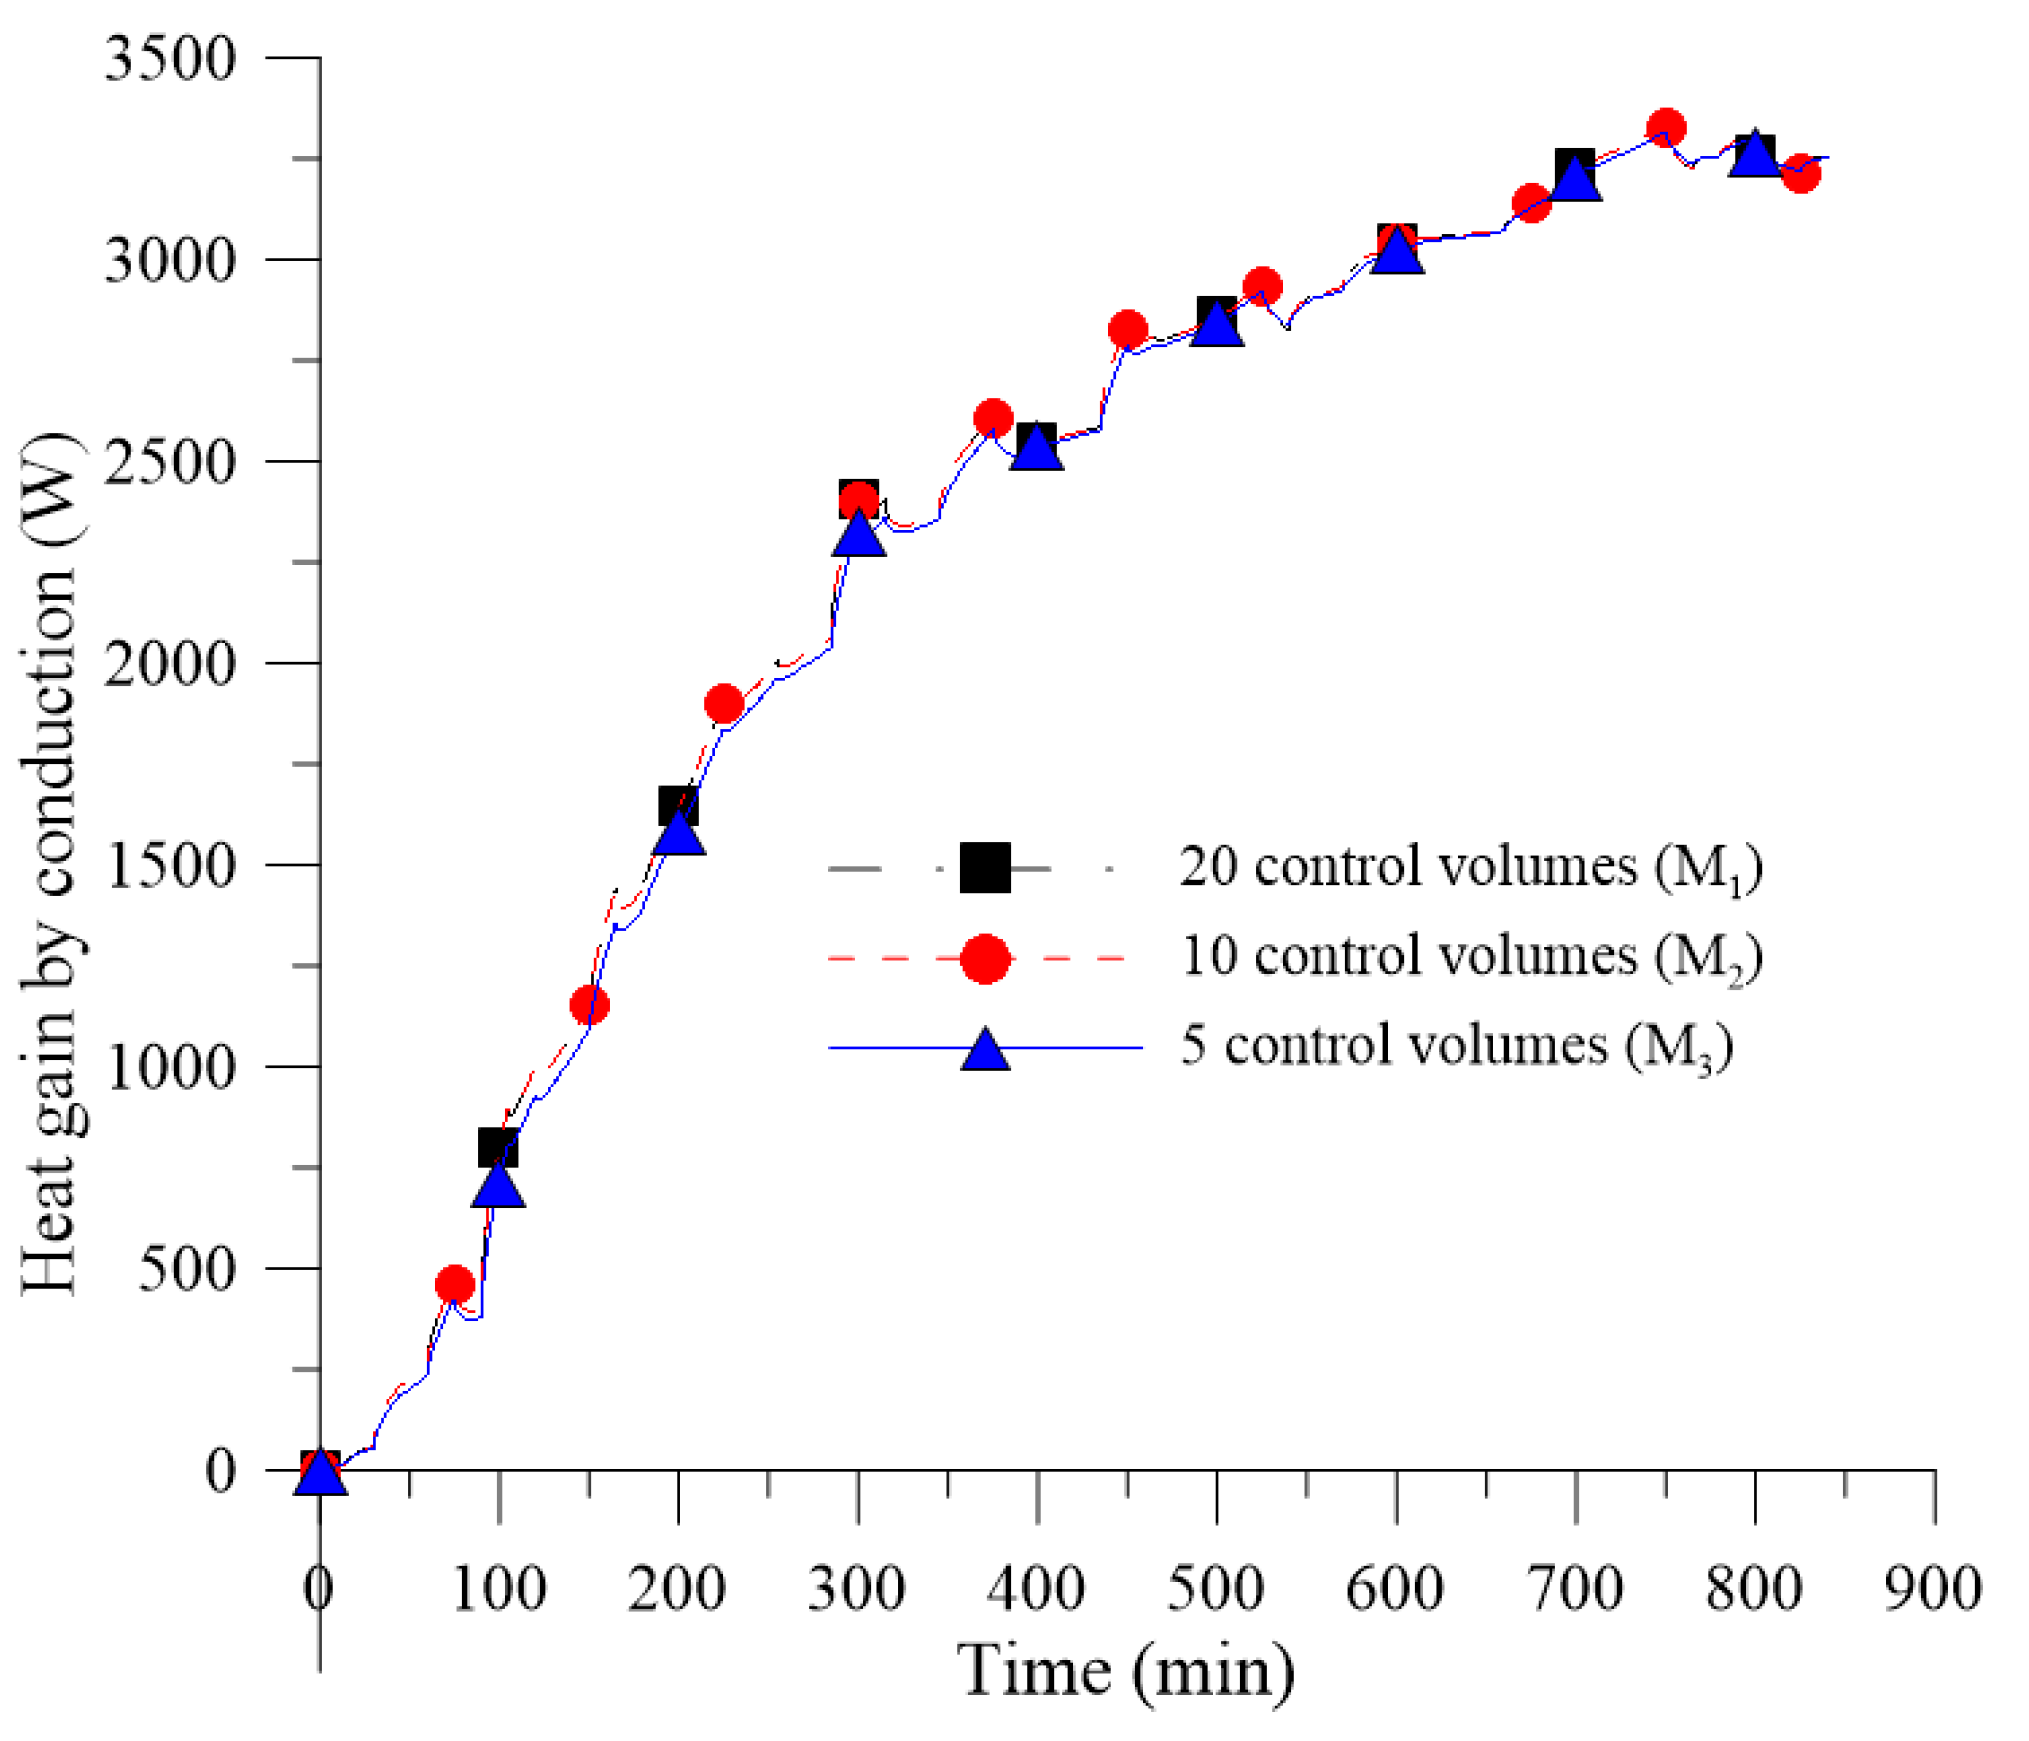
To ensure that the results obtained were independent of the number of control volumes, a mesh convergence and time step refinement study were performed.
The mesh convergence analysis for the thermally insulated kiln was performed using the methodology proposed by Celik [51], based on Richardson's extrapolation [52,53]. Celik [51] provides specific guidelines for the estimation of discretization errors in computational fluid dynamics simulations for situations with or without experimental data for comparison. Using this methodology, it is possible to estimate the exact solution from the extrapolation of the solutions of the existing meshes, as well as to determine the ideal mesh through the calculation of the grid convergence index (GCI). The entire procedure for such an analysis will be described in the following.
Initially, one should determine a representative mesh size, l, according to Equation (30):
l = ( 1 N i   =   1 N Δ V i ) 1 3 ,
where N is the number of mesh elements used for the computational calculation and ΔV is the volume occupied by element i.
For the case of one-dimensional meshes, we have:
l = 1 N i   =   1 N Δ x i ,
where N is the number of mesh elements used for the computational calculation and Δx is the length of the control volume, i.
Celik [51] recommends making three meshes with a refinement factor, r = lcourse/lfine, greater than 1.3. l1 and l3 are the representative sizes of the most refined and coarser meshes, respectively. With these parameters, r21 and r32 parameters are defined by Equations (32) and (33):
r 21 = l 2 l 1 ,
r 32 = l 3 l 2 .
Also, let ϕ1, ϕ2, and ϕ3 be the results of a given response variable for the respective meshes.
With this, it is possible to calculate the apparent order, p, required for the calculation of the extrapolated solution (l = 0) and grid convergence index (GCI), using Equations (34)–(36), as follows:
p = 1 ln ( r 21 ) | ln | ε 32 ε 21 | + q ( p ) | ,
q ( p ) = ln ( r 21 p s r 32 p s ) ,
s = sin al   ( ε 32 ε 21 ) ,
where ε32 = ϕ3 − ϕ2, ε21 = ϕ2 − ϕ1. If ε 32 / ε 21 > 0 , then s = 1 . Similarly, if ε 32 / ε 21 < 0 , then s = 1 . Equations (37) to (39) can be solved using an iterative method. It is observed that q(p) = 0 for r21 = r32.
To verify the apparent convergence condition of the solution, we used Equation (37), as follows:
C = ϕ 2     ϕ 1 ϕ 3     ϕ 2 .
Based on the value of C, the convergence condition can be classified according to Table 3 [54]. According to Almohammadi [54], for the Richardson extrapolation method to be valid, it is necessary to obtain a monotonic convergence condition for the analyzed variable.
The extrapolated solution was determined according to Equation (38), as follows:
ϕ ext 21 = ( r 21 ) p ϕ 1     ϕ 2 ( r 21 ) p     1 .
The approximate relative error between the meshes, for the variable, ϕ , was also determined according to Equations (39) and (40):
e a 21 = | ϕ 1     ϕ 2 ϕ 1 | ,
e a 32 = | ϕ 2     ϕ 3 ϕ 2 | .
In this way, the grid convergence index (GCI) was calculated using Equations (41) and (42), as follows:
GCI 21 = 1.25 e a 21 ( r 21 ) p     1 ,
GCI 32 = 1.25 e a 32 ( r 32 ) p     1 .
To apply this method, it is necessary to ensure that the meshes are within the asymptotic range. Roache [55] reports that in cases where the exact solution is not known, the formula given by Equation (43) can be used to indicate that the asymptotic interval has been reached:
GCI 32 = ( r 21 ) p GCI 21 .
For this analysis, the conduction energy gain by the thermal insulation, or energy entering the thermal insulation, in the heating phase of the kiln ( Q in insu ), was considered as a response variable (ϕ) and calculated using the numerical integration known as the composite trapezoid rule, according to Equation (44):
Q in insu = t   =   a t   =   b q in insu ( t ) dt = ( b     a ) n   ×   { [ q in insu ( a ) + q in insu ( b ) 2 ]   +   i   =   1 n     1 q in insu ( t i ) } ,
where:
q in insu = k insu A dT dx | x   =   0 ,
where a is the initial time instant (a = 0 s), b is the time instant when the kiln is turned off (b = 840 min), and n represents the number of time steps in the heating step. q in insu ( a ) , q in insu ( b ) e q in insu ( i ) are the rates of energy entering the thermal insulation by conduction at the time instants, a, b, and i, respectively.
In order to ensure that the results obtained by the finite volume method are reliable, it is useful to calculate the global energy balance in the thermal insulation (Equation (46)). This ensures that the rate of energy entering the thermal insulation ( q in insu ) is equal to the rate of energy leaving the thermal insulation ( q out insu ) plus the rate of energy stored in the insulation ( E ˙ st insu ) at each time step.
q in insu ( t ) [ q out insu ( t )   + E ˙ st insu ( t ) ] = 0 .
Replacing the terms for each variable, we have Equation (47), as follows:
k iso A dT dx | x = 0 [ ( h ¯ c + h ¯ r )   ×   A   ×   ( T s 2 , ext T amb ) + ρ iso   ×   A   ×   L iso   ×   c p iso   ×   Δ T med iso Δ t ] = 0 ,
where kiso, ρiso,   c p iso , and Liso, are the thermal conductivity, density, specific heat, and thickness of the thermal insulation, respectively, according to Table 1.
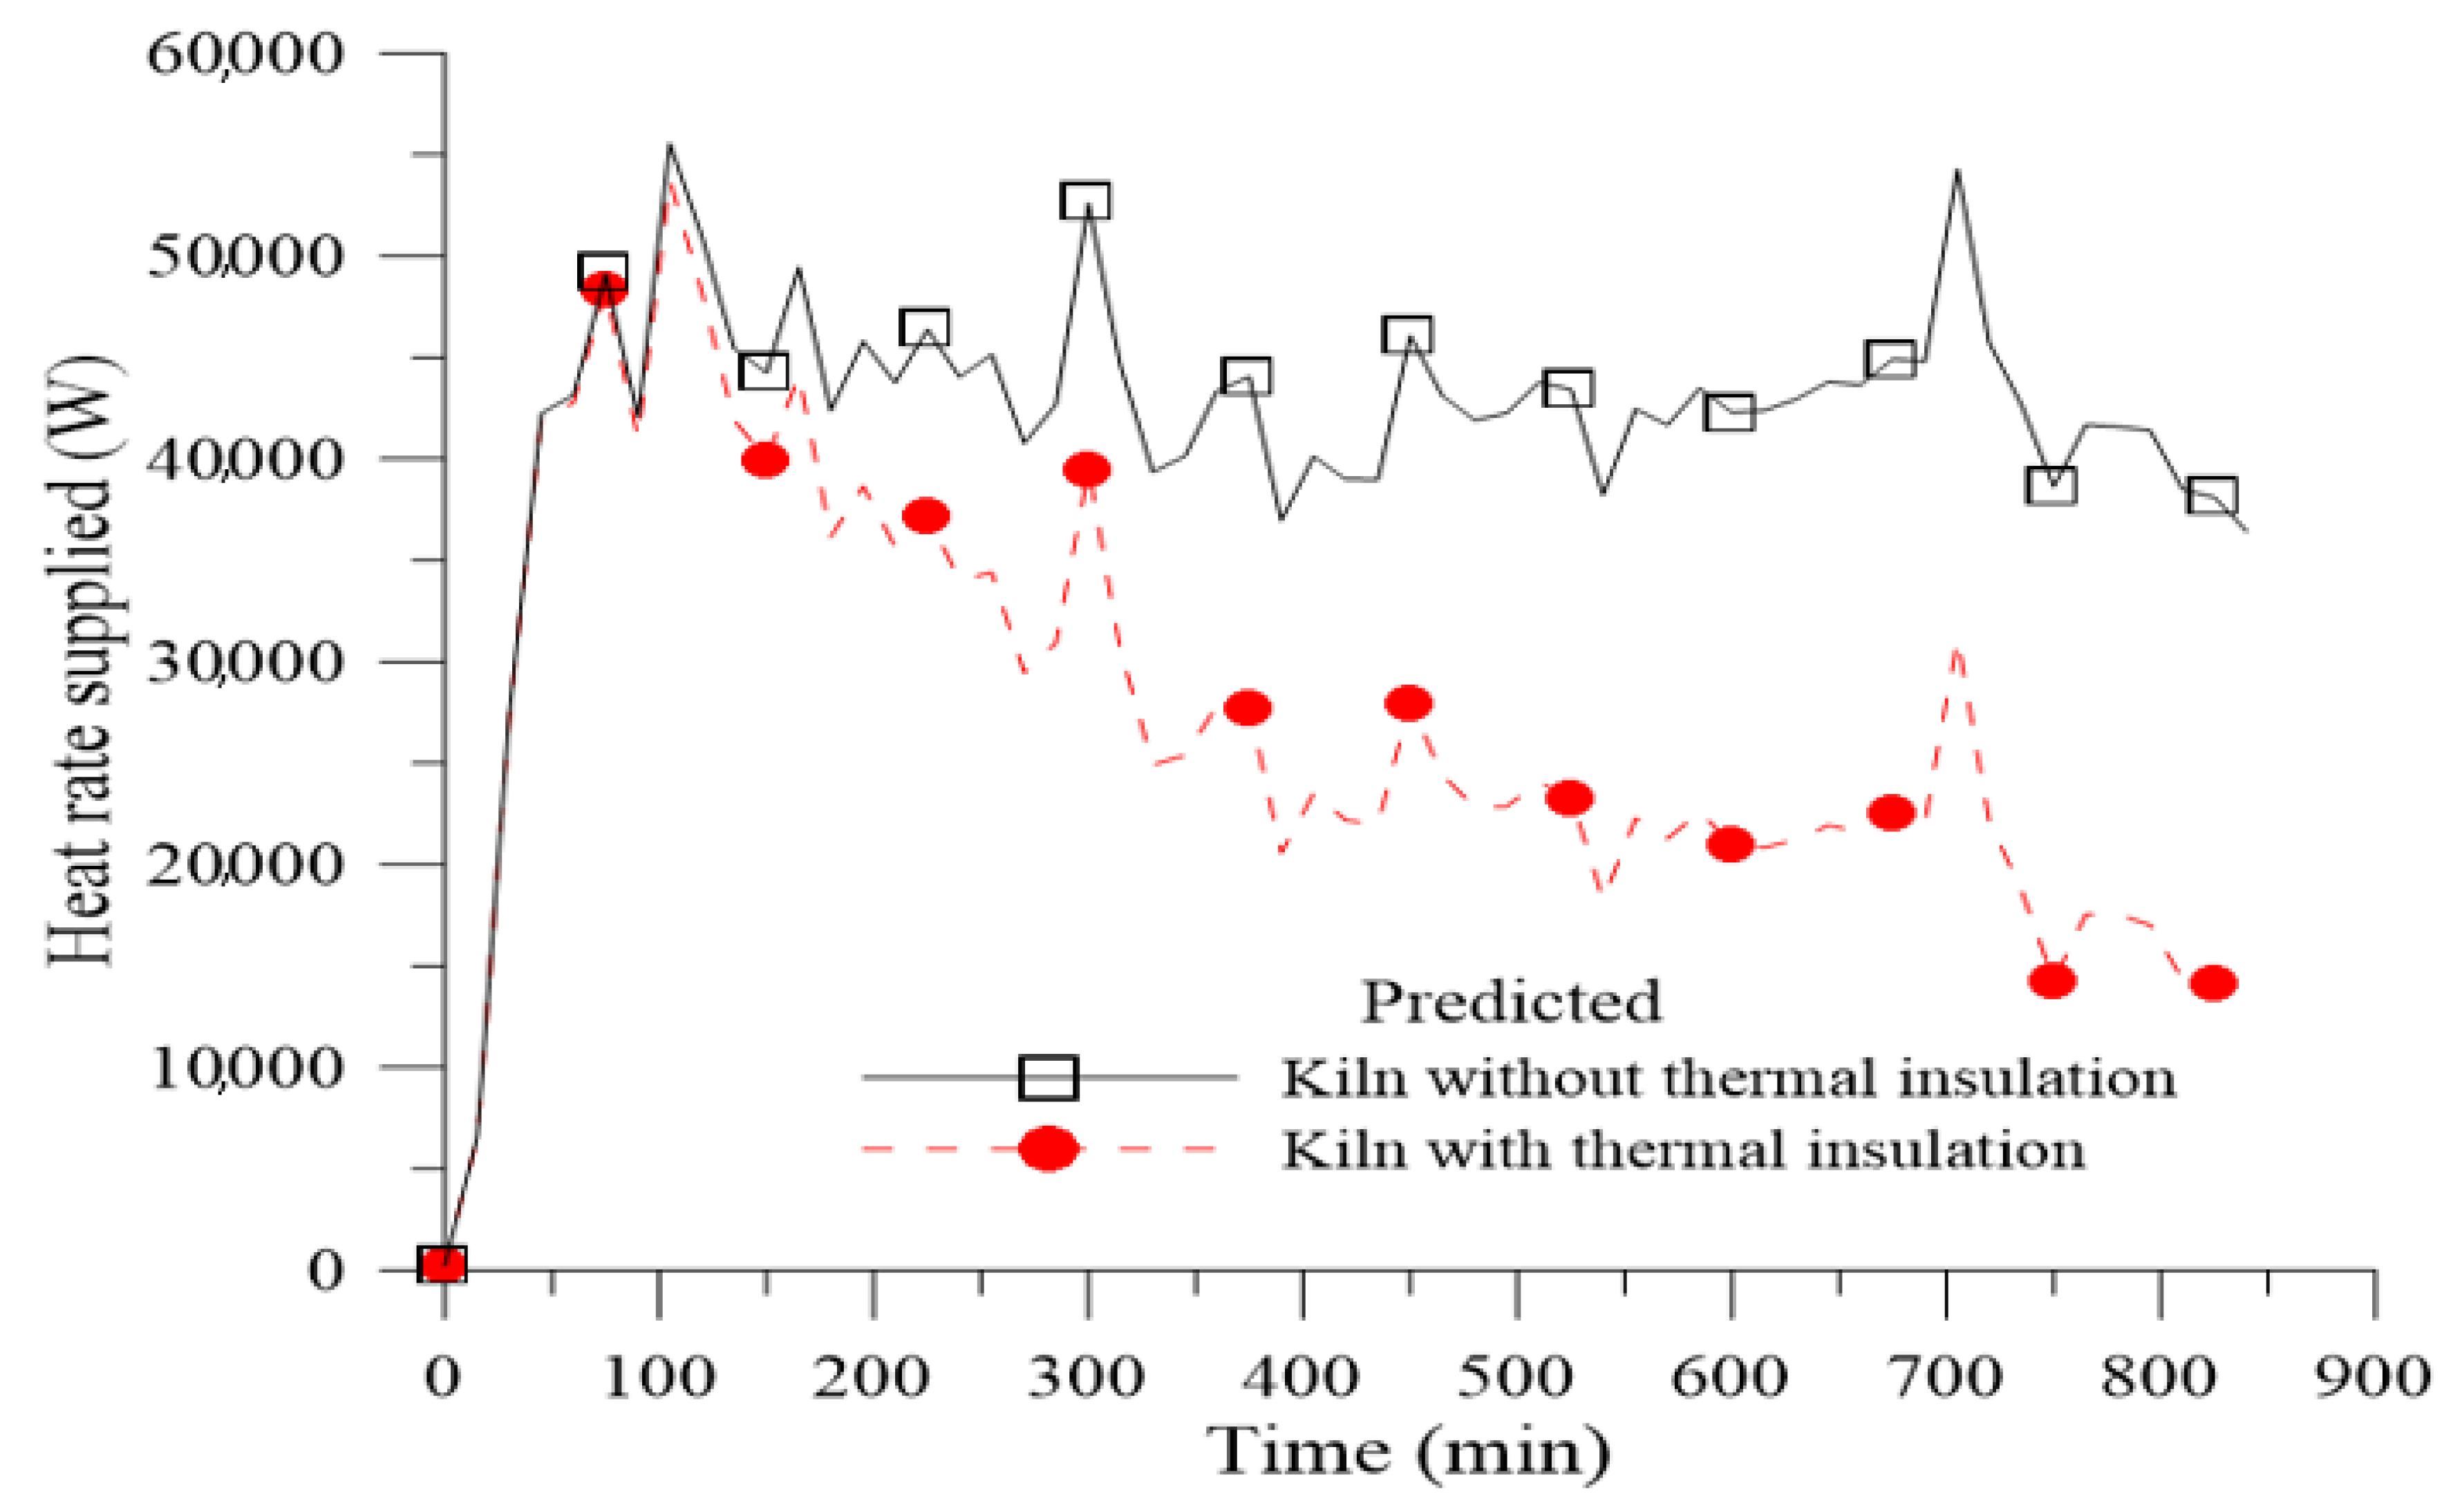
In order to quantify the influence of the thermal insulation on the kiln efficiency, the global energy gain variable is used, which can be calculated by Equation (48), as follows:
Global   Energy   Gain = ( 1 E supplied insu E supplied ) · 100 % ,
where E supplied and E supplied insu are the energies supplied during the heating process for the kiln without and with thermal insulation, respectively. The parameter, E ˙ supplied insu , is given by:
E ˙ supplied insu = E ˙ st + q lost base / insu + q out insu + E ˙ st insu .
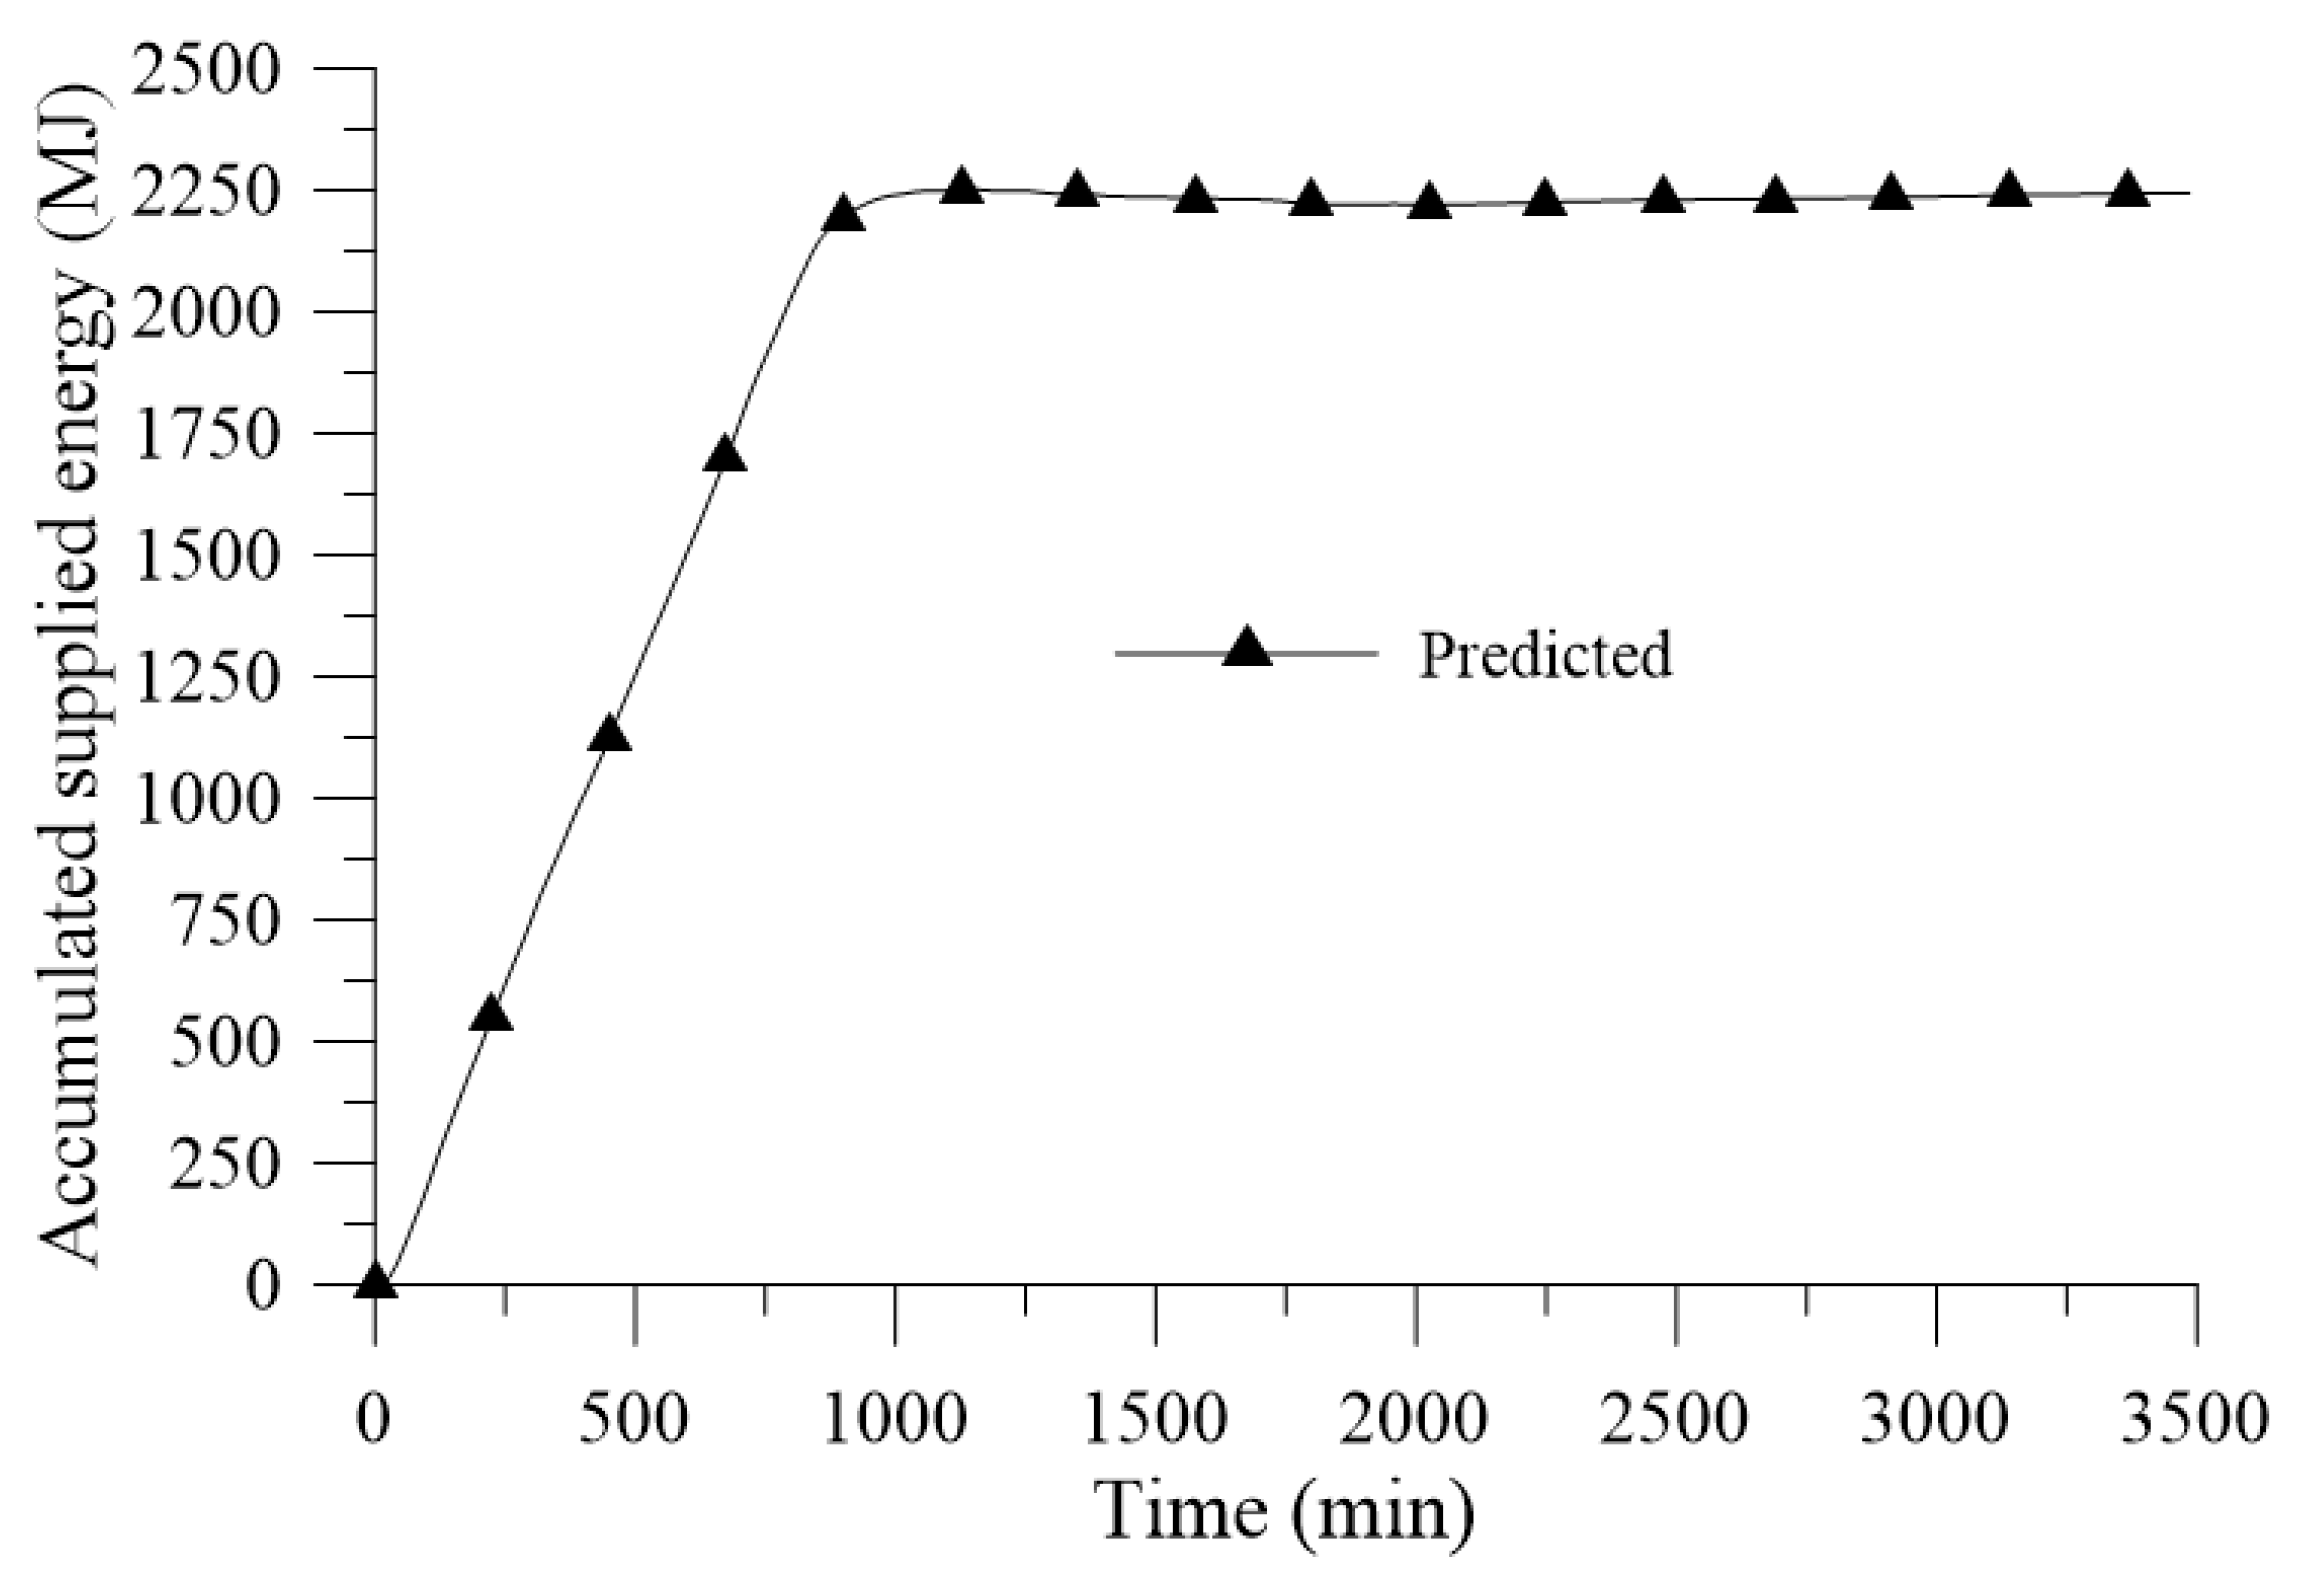
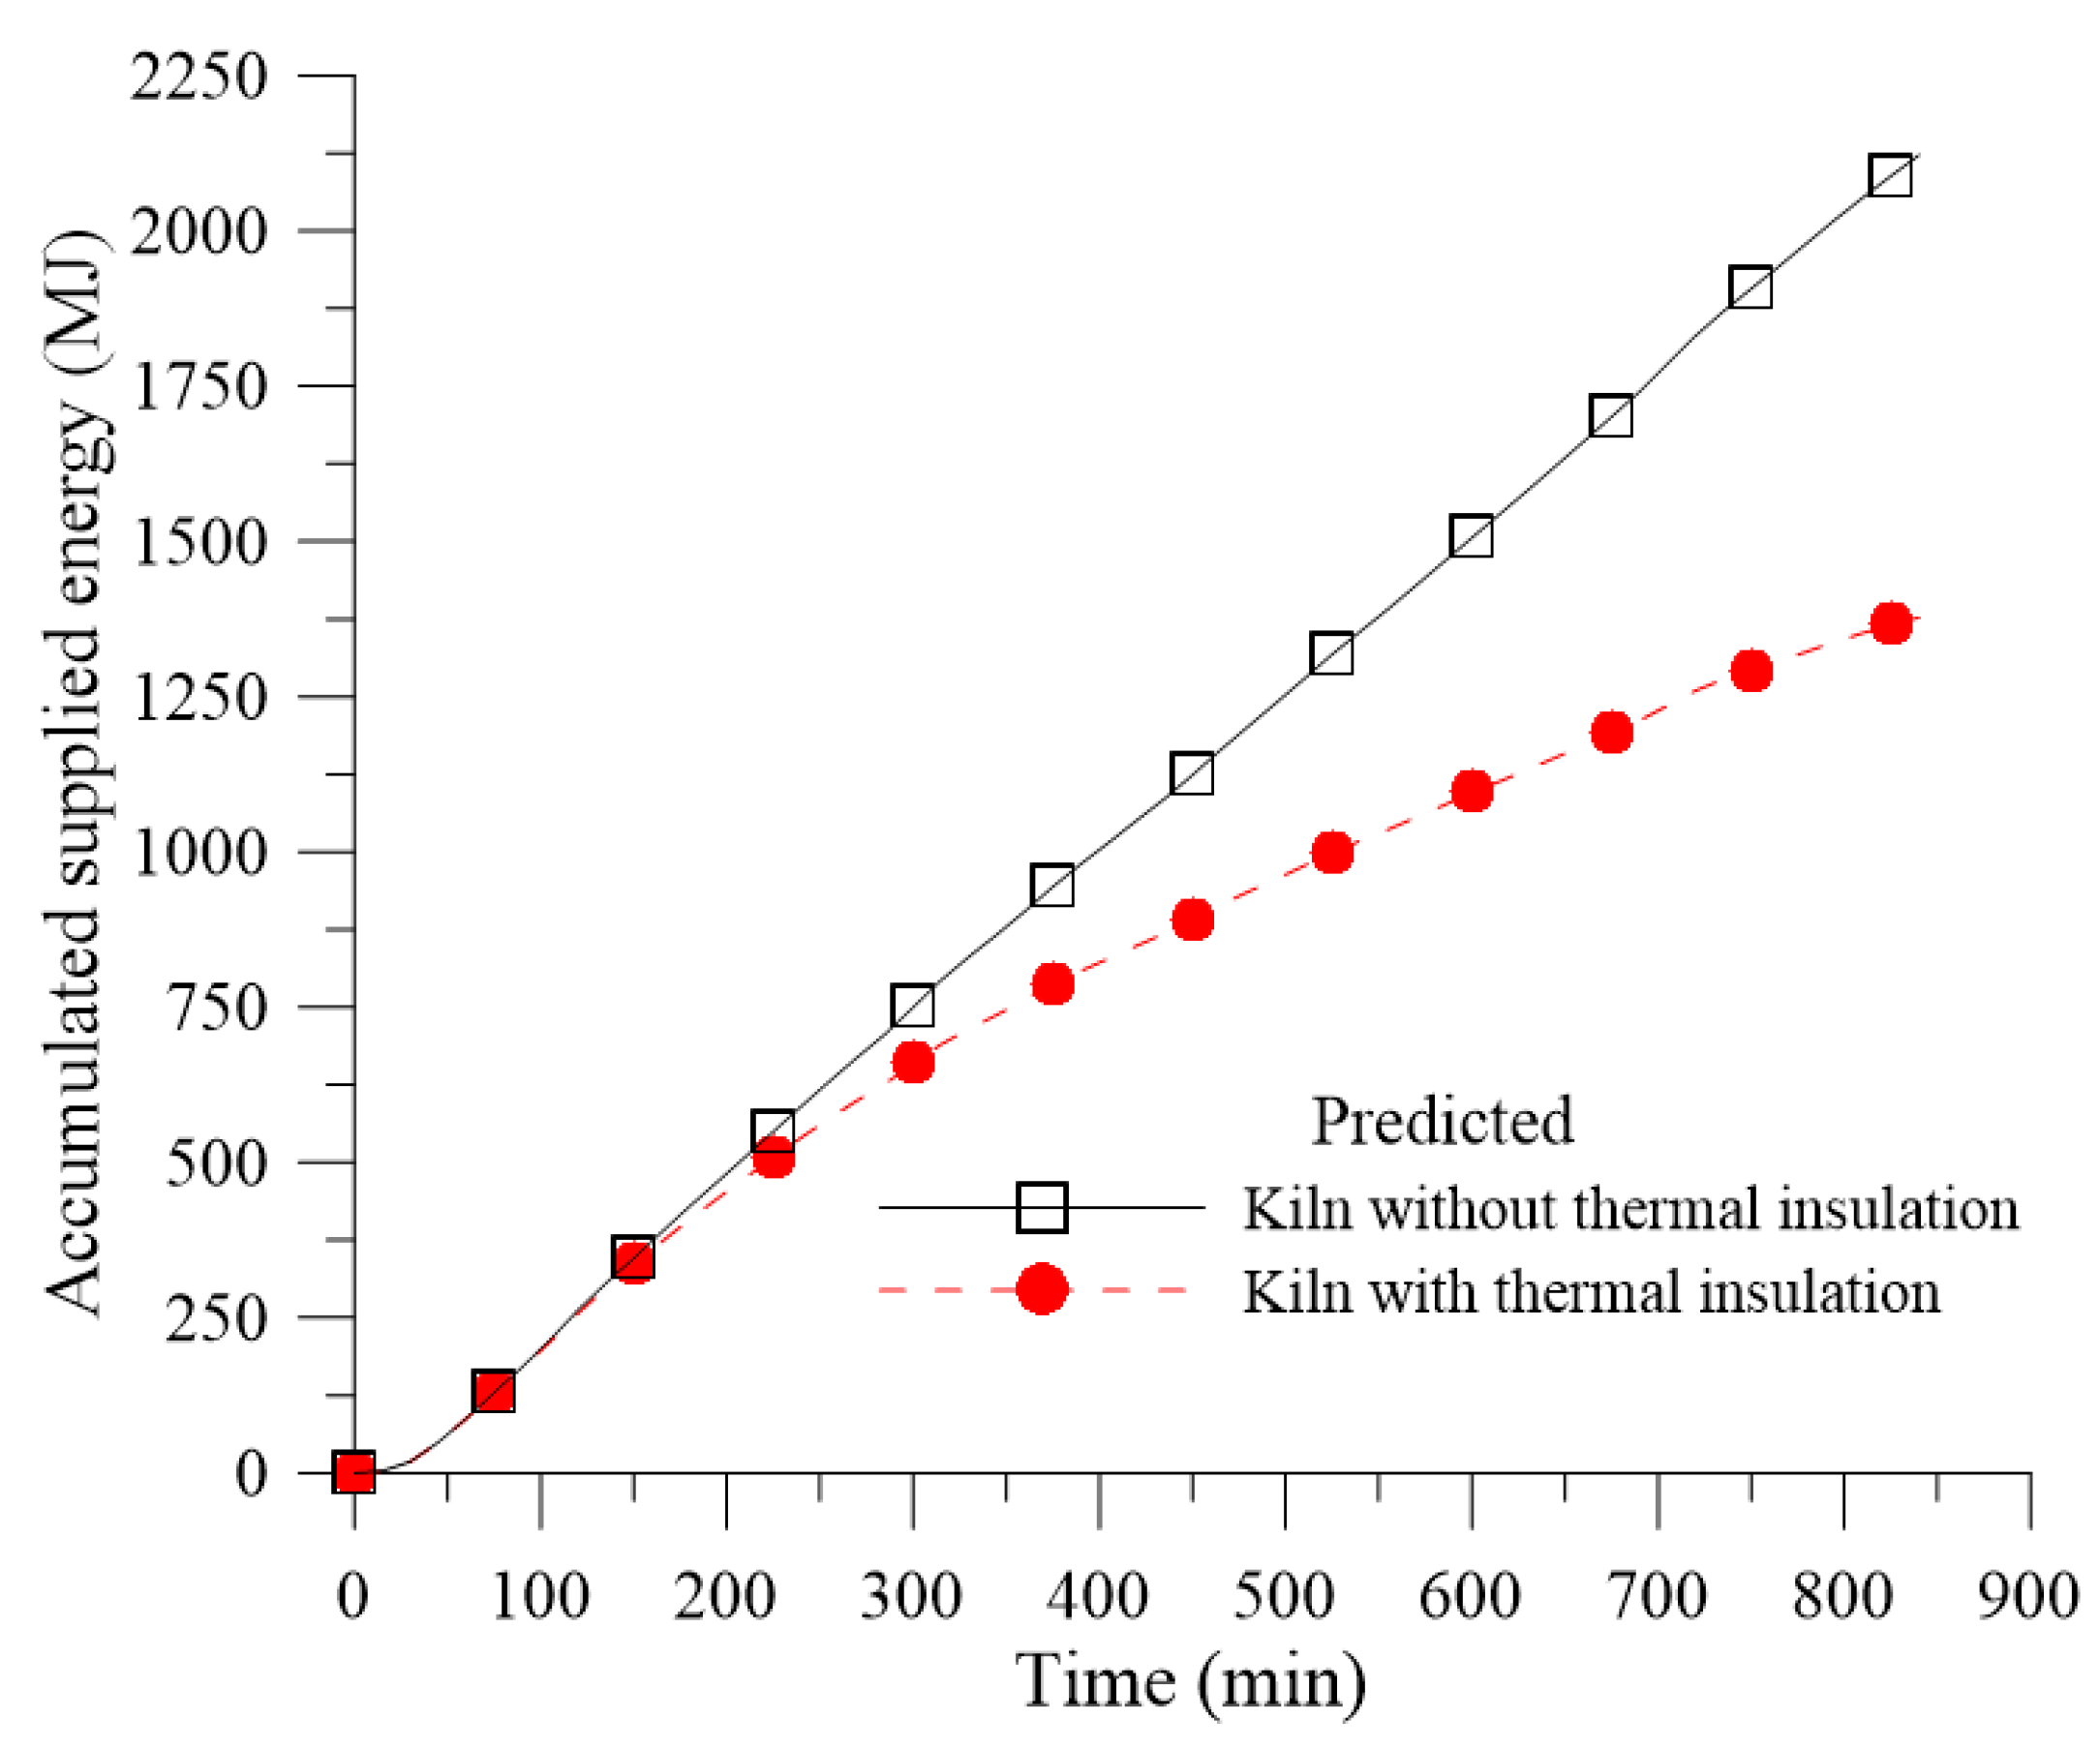
In order to determine such values, it is necessary to calculate the definite integral of the variables of E ˙ supplied (Equation (2)) and E ˙ supplied insu (Equation (49)) during the heating time interval of the kiln.
Using the composite trapezoid rule mentioned before, the accumulated energy supplied, E supplied , during the heating process can be determined according to Equation (50), as follows:
E supplied = t   =   a t   =   b E ˙ supplied ( t ) dt = ( b     a ) n   ×   { [ E ˙ supplied ( a ) + E ˙ supplied ( b ) 2 ] + i   =   1 n     1 E ˙ supplied ( t i ) } ,
where a is the initial time instant (a = 0 s), b is the last time instant of the heating step, and n represents the number of time steps in the heating step. E ˙ supplied ( a ) , E ˙ supplied ( b ) e E ˙ supplied ( i ) are the heat rates supplied at the time instants, a, b, and i, respectively. E supplied insu can be calculated in a similar way from Equation (50).

3. Results and Discussion

3.1. Kiln without Thermal Insulation

Figure 6 shows the temperatures obtained in the outer sidewalls of the kiln, as well as the ambient temperature in the surroundings of the kiln/dryer, as a function of the processing time. From the analysis of this figure, it can be observed that the maximum temperature reached was 303.7 °C, at point C9 at 840 min of the process (Figure 2). There is a temperature variation in the outer surfaces of the kiln of approximately 74 °C.
Figure 7 shows the internal temperature of the kiln at several points, as a function of the processing time. It was verified that the maximum temperature reached inside the kiln was 941.62 °C in t = 825 min. The temperatures read in several points within the kiln are very close, except for the one read on the thermocouple, C2, located in the chimney. This shows a very uniform heating inside the kiln, which allows adequate drying and firing, and the production of better quality products. It is worth noting that the heating step lasted 840 min.
Figure 8 shows the average temperatures of the inner and outer surfaces of the kiln as well as the temperature of the surrounding air in the kiln/dryer vicinity. These curves were used for the thermal analysis presented here.
The results of the heat lost by the kiln throughout the process are plotted in Figure 9. From the analysis of this figure, it was observed that the greatest heat lost occurs by radiation from the sidewalls (50%), followed by the heat lost by convection (27%), also by the sidewalls. In this way, the heat lost by the base/ceiling assembly is the least expressive (23%). It is important to note that the percentages presented above were calculated for the instant of time, t = 840 min, when the kiln was turned off.
Figure 10 illustrates the heat transfer rate lost from the sidewalls, base, and ceiling of the kiln, predicted by the proposed mathematical modeling. This result is obtained by summing the radiation and convection heat losses. From the analysis of this figure, it was verified that the heat lost by the sidewalls of the kiln is significantly greater when compared to the heat lost by the base/ceiling assembly during most of the process. Thus, to improve the efficiency of the kiln, it is necessary to define alternatives to reduce the heat lost by the sidewalls.
Figure 11 shows the specific heat flux lost by the sidewalls and by the base/ceiling assembly. From the analysis of this figure, it was observed that the heat flux per area unit lost by the base/ceiling assembly is higher than the convection heat flux lost by the sidewalls, although the convection heat transfer rate is higher (Figure 9). This is explained by the fact that the heat transfer area of the sidewalls is larger than the area of the base/ceiling assembly. The radiation heat flux lost remains the most significant, representing 46% of the total heat flux at time, t = 840 min, followed by the conduction heat flux lost by the base/ceiling assembly (30%) and convection by the sidewalls (24%). However, it can be observed that the heat flux losses by the base/ceiling assembly exceed the others for times greater than 1250 min.
Figure 12 shows that the heat flux lost by the sidewalls is significantly higher when compared to the heat flux lost by the base/ceiling assembly in most of the process, representing 70% of the total heat flux for time, t = 840 min.
Figure 13 illustrates all the heat transfer rates that occurred throughout the kiln/dryer heating and cooling processes. It is noted that the heat transfer rate to heat the air inside the kiln is insignificant as compared to the heat transfer rates required to heat the sidewalls and the base/ceiling assembly. This is due to the high density and specific heat of the refractory brick, which makes it have a greater energy storage capacity compared to atmospheric air.
It is also observed that while the heat losses have positive values for all the time instants of the heating and cooling process, the variables, q heat sidewalls and q heat base / ceiling , show negative values from approximately 840 min when the heating system was turned off. From this moment, the kiln cooling process begins, causing the average temperature variations in the kiln walls to be less than zero (ΔTaverage < 0), thus justifying the negative values found for such variables. This can be best seen by observing Equations (7) and (8).
Figure 14 illustrates the heat rate supplied to the kiln as a function of time, which, according to Equation (2), is obtained by summing each of the terms of Equations 3 and 4; that is, the sum of all values shown in Figure 13.
After analyzing Figure 14, it was verified that the proposed methodology is coherent with the physical reality of the problem, since the energy rate that is provided, obtained by the energy balance shown in Equation (2), approaches zero for instants of time after the kiln was turned off.
It is noticed that there were oscillations in the heat rate supplied during the heating process of the kiln. Possible causes for such oscillations are the accuracy of the experimental measurements, variations in the gas flow rate throughout the kiln during the heating process, consideration of the one-dimensional energy transfer model, and non-measurable losses, such as heat losses, due to cracking in the kiln and improper door closing.
It was also verified that at 840 min when the kiln heating is stopped the energy supplied to the kiln that is predicted by the model does not abruptly decrease to zero. The possible causes for this behavior can be attributed to the considerations of a linear distribution of temperature in the kiln walls, and the semi-infinite solid in the ceiling of the kiln.
Figure 15 shows the accumulated supplied energy as a function of time (Equation (50)). Such a curve was obtained by integrating in time the supplied heat rate curve (Figure 14). It was observed that although the supplied heat rate curve presented oscillations during the heating step (Figure 14), its integral exhibits linear growth behavior during the heating stage, an expected result for the integration of positive and constant functions. It was observed that in the cooling stage (after 1000 min) the accumulated supplied energy remains close to a constant value as expected.

3.2. Kiln with Thermal Insulation

For this analysis, initially, a mesh convergence study representing the thermal isolator was done. Table 4 shows the number of control volumes in each numerical mesh used. The meshes were named M1, M2, and M3. In order to facilitate calculations and to satisfy the recommendations proposed by Celik [50], the size of the meshes was defined, such that r21 = r32 = 2. It is important to note that all analyzes were performed using the same time step (Δt = 0.1 min).
Figure 16 shows the heat conduction gain by the thermal insulation as a function of the heating time for different types of numerical mesh. It was verified after analyzing this figure that similar results were obtained for all meshes. It is worth noting that the response variable used to perform the mesh convergence analysis was the conduction energy gain by the thermal insulation during the kiln heating process ( Q in insu ). Such values were obtained by integrating the conduction heat gain from the initial time to the time when the heating was stopped (Equations (44) and (45)), which is represented by the area below the curves shown in Figure 16. The values of this variable for each mesh are reported in Table 5.
Figure 17 shows the global energy balance in the thermal insulation as a function of time for the three meshes analyzed. It can be observed that the energy balance is not satisfied for the mesh containing 5-control volume at most instants of time. However, the 10- and 20-control volume meshes presented values lower than 10−9 for the global energy balance in the thermal insulation during the entire heating process (Equation (46)), considering a convergence criteria for the finite volume numerical method of 10−7.
Table 5 presents the results of the mesh convergence study for the variable in analysis. The value of the parameter, C, in the table indicates monotonic convergence, since its value is in the interval between 0 and 1, ensuring that the Richardson extrapolation method is applicable to the variable of interest [54]. One can observe a reduction in the convergence condition, since GCI21 < GCI32, which indicates that the dependence of the results with the size of the mesh control volumes was reduced and approaches a mesh independent solution, since the values of GCI21 and GCI32 are within the 10% limit as reported by Celik and Karatekin [56]. It is also possible to state that the asymptotic range was reached and that the extrapolated solution is close to the exact solution for this variable due to the proximity of the values of GCI 32 and ( r 21 ) p GCI 21 .
Figure 18 shows the results obtained for the conduction energy gain by the thermal insulation during the kiln heating process as a function of the control volume length or representative mesh size (l). The extrapolated solution ( ϕ ext 21 ) is indicated by the point at which the curve intercepts the vertical axis in the graph. These results indicate that when refining the meshes, the solution approaches the asymptotic value of the extrapolated solution, and the solution of the M1 mesh (1 = 1.25 mm) presented the closest results to the extrapolated solution. Due to the proximity between the extrapolated solution and the solutions for the meshes, M1 and M2, and taking into account the total simulation time, the mesh with 10 control volumes (M2) was chosen for further analysis.
After choosing the numerical mesh appropriate to the process, a time step independence analysis for the same variable was performed. Figure 19 illustrates the conduction heat gain by the thermal insulation as a function of the heating time for three distinct time steps. Calculating the integral of the functions, according to Equations (44) and (45), we obtained the conduction energy gain by the thermal insulation during the kiln heating process ( Q in insu ).
Table 6 presents the results of the time step independence study for the variable in analysis. For this analysis, 10-control volume meshes were used. It was observed that the absolute error of the response variable between the time steps of 0.1 min and 1 min was considerably smaller when compared to the absolute error between the time steps of 1 min and 15 min. This, combined with the reduction of the simulation time, justifies the use of a 10-control volume mesh and a time step of Δt = 1 min.
Figure 20 shows the temperature as a function of time for various positions inside the thermal insulation. The curve, x = 0 mm, is the temperature at the west boundary of the first control volume, Ts,ext, while the curve, x = 25 mm, refers to the temperature at the east boundary of the last control volume, Ts2,ext (Figure 4). Moreover, the curve referring to the position, x = 0 mm, represents the temperature distribution in the external wall of the kiln without insulation, thus being one of the boundary conditions of the physical problem for the kiln with thermal insulation. It was observed that the temperature gradient in the thermal insulation increases with the advancement of time and that the variation in the surface temperature outside the insulation (x = 25 mm) is considerably smaller when compared to the situation of the kiln without thermal insulation (x = 0 mm). It is worth noting the importance of the insulation, in terms of the reduction in the convection and radiation heat losses, in the external wall of the thermal insulation and the operational safety, thus minimizing the effects caused by accidental burns when in operation.
Figure 21 shows the temperature profile in the thermal insulation for several instants of time. It was observed that for any instant of time, the further from the kiln wall (x = 0 mm), the lower the temperature. As expected, the heat transfer occurred from the kiln wall (x = 0 mm) to the opposite end of the insulation (x = 25 mm) in contact with the external environment. It was also possible to observe that the curves approach straight lines as the process progressed. This was because of the low contribution of the stored energy rate in the thermal insulation when compared to the heat gain by the kiln wall in the final instants of the heating process.
Figure 22 shows the average temperature in the thermal insulation throughout the entire heating step. Such a value was calculated from the arithmetic mean of the temperatures obtained at the centers of each of the 10 control volumes at each time step. This result is of great importance because, as mentioned previously, the thermal conductivity of the insulation for each control volume at a given time instant was calculated iteratively as a function of the average temperature in the thermal insulation at the same instant of time.
Figure 23 shows a comparison between the convective heat transfer coefficient at the surface of the kiln with and without thermal insulation as a function of time during the entire heating step. The thermophysical properties of the thermal diffusivity (α), kinematic viscosity (ν), Prandtl number (Pr), and the coefficient of volumetric expansion (β) tend to increase the convection heat transfer coefficient value for the kiln with thermal insulation due to a lower film temperature (Tf). The smaller difference between the ambient air temperature and the surface of the thermal insulation, as well as the reduction of the thermal conductivity of the fluid (kf), make the convective heat transfer coefficient for the kiln with thermal insulation lower than that for the kiln without thermal insulation.
Figure 24 shows a comparison between the radiation heat transfer coefficient for the kiln with and without thermal insulation as a function of time during the heating step. From Equation (20), it can be seen that the radiation heat transfer coefficient depends strongly on the temperatures of the outer surface of the thermal insulation and the surroundings, so that the difference between the heat transfer coefficients by radiation for kilns with and without isolation is much more significant when compared to the difference obtained for the convective heat transfer coefficients previously analyzed (Figure 23). It was observed that the two curves start at the same point. This is only possible due to the fact that the values of the emissivity of the insulating material and of the refractory brick being considered as equal.
Figure 25 illustrates the heat transfer rates that occurred in the thermal insulation during the heating step. It was observed that as in the case of the kiln without thermal insulation, the heat lost by radiation was higher than the heat lost by convection. The stored energy rate in the thermal insulation is more significant in the initial instants of the process, since the temperature variations in the kiln walls and, consequently, in the thermal insulation occurred more intensely.
Figure 26 shows a comparison between the heat rates that must be supplied for the kiln with and without thermal insulation as a function of time. It was observed that up to approximately 100 min, the heat rates are very close. From this moment, the insulated kiln needs lower energy rates to ensure the same firing curve during the heating step.
Figure 27 illustrates a comparison between the accumulated supplied energy as a function of time for the kiln with and without thermal insulation. These curves were obtained by integrating the curves of the heat transfer rates that must be supplied to the kiln for the cases with and without thermal insulation. It is evident that there was a significant reduction in the energy that must be supplied to the kiln when it was insulated with 25 mm of ceramic fiber, thus increasing its thermal efficiency.
Table 7 compares the energies lost by the sidewalls to the kilns with and without thermal insulation during the heating step (up to t = 840 min). It was observed that the percentage referring to the heat lost by radiation decreased for the case of the kiln with thermal insulation. This is due to a significant reduction in the radiation heat transfer coefficient (Figure 24) when compared to the reduction of the convective heat transfer coefficient (Figure 23), in addition to the appearance of a new term: Energy stored in the thermal insulation. It was also observed that there was a significant reduction of the total energy lost by the sidewalls of the kiln, from 859.81 MJ to 109.35 MJ, a reduction of 87.28%.
Table 8 reports a comparison between the supplied energy, the global energy gain, and the external surface temperature for the kilns with and without thermal insulation. It was observed that the energy lost by the sidewalls for the insulated kiln was reduced by 87.28%, however, the global energy gain was much lower at 35.09%. This is due to the fact that heat lost from the base/ceiling assembly as well as the rate of energy stored in the sidewalls, base, and ceiling of the kiln remains unchanged from one configuration to the other. Another fact that can be observed is that with the addition of the thermal insulation, there was a significant reduction in the maximum external surface temperature of the film. This fact reduces the thermal discomfort as well as the risk of accidents for the kiln operator, as already mentioned.
Although the study was conducted in a pilot-scale kiln developed for research purposes, the results presented here for the equipment can be used to qualitatively analyze the influence of thermal insulation applied in similar industrial kilns (upscale).

4. Conclusions

In this work, an analysis of the heat transfer occurring in an intermittent ceramic kiln with and without thermal insulation was carried out. The proposed methodology can easily be applied in similar processes, with knowledge of the internal and external surface temperatures of the kiln, as well as the air temperature and velocity conditions in the surroundings of the equipment.
From the obtained results, we conclude that:
  • For the kiln without thermal insulation, the radiation and convection heat losses by the sidewalls are significantly higher when compared to the heat lost by the base/ceiling assembly of the kiln.
  • The energy required to heat the sidewalls, base, and ceiling of the kiln was considerably high, especially in the initial instants of the heating process.
  • The methodology proposed for the kiln without thermal insulation was satisfactory since the heat rate supplied to the kiln approached zero for instants of time after the equipment was turned off, and all results were based in the experimental data.
  • For the insulated kiln, the application of 25 mm thick ceramic fiber in the sidewalls was sufficient to provide an energy gain of approximately 35%.
  • The use of thermal insulation in kilns contributes to a reduction in energy consumption and, consequently, promotes economic and environmental gains.
  • With the use of thermal insulation, it was possible to reduce the maximum external surface temperature from 249.34 °C to approximately 79.47 °C, reducing the thermal discomfort and the risks of work accidents when in operation.
The main contribution of this work is that the methodology presented here can be used to calculate the heat transfer occurring during the heating and cooling process of any intermittent kiln. Moreover, it can be used as a decision-making tool in the choice of the type and thickness of thermal insulation that is able to provide the desired energy gain for the equipment, with a better cost–benefit analysis of the installation. The great advantage of the mathematical procedure presented in this work when compared with CFD analysis using commercial software, such as Ansys Fluent and Ansys CFX, is the low computational time.

Author Contributions

All the authors contributed to the development, analysis, writing, and revision of the paper.

Funding

This research was funded by FAPESQ, CNPq (grant number: 307414/2018-3), CAPES, and FINEP (Brazilian research Agencies).

Acknowledgments

The authors thank to Brazilian Research Agencies for financial support and the researchers of the references cited in the text that helped in the improvement.

Conflicts of Interest

The authors declare no conflict of interest.

References

  1. Silva, V.S.; Delgado, J.; Barbosa de Lima, W.M.P.; Barbosa de Lima, A.G. Heat and Mass Transfer in Holed Ceramic Material Using Lumped Model. Diffus. Found. 2016, 7, 30–52. [Google Scholar] [CrossRef]
  2. Brongniart, A. Traité Des Arts Céramiques Ou Des Poteries Considérées Dans Leur Histoire, Leur Pratique et Leur Théorie. Bechet; Mathias. 1844, Volume 2. Available online: https://gallica.bnf.fr/ark:/12148/bpt6k619378 (accessed on 24 April 2019).
  3. Boch, P.; Niepce, J.-C. Ceramic Materials: Processes, Properties, and Applications; ISTE Limited: Newport Beach, USA, 2006; ISBN 13: 978-1-905209-23-1. [Google Scholar]
  4. Santos, G.M.d. Study of the Thermal Behavior of a Tunnel Kiln Applied to the Red Ceramic Industry. Master’s Thesis, Federal University of Santa Catarina, Florianópolis, Santa Catarina, Brazil, 2001. (In Portuguese). [Google Scholar]
  5. Barbosa Da Silva, J.; Almeida, G.S.; Barbosa de Lima, W.C.P.; Neves, G.A.; de Lima, A.G.B. Heat and Mass Diffusion Including Shrinkage and Hygrothermal Stress during Drying of Holed Ceramics Bricks. Defect Diffus. Forum 2011, 312, 971–976. [Google Scholar] [CrossRef]
  6. Barbosa da Silva, J.; Almeida, G.S.; Neves, G.A.; Barbosa de Lima, W.C.P.; de Farias Neto, S.R.; de Lima, A.G.B. Heat and Mass Transfer and Volume Variations during Drying of Industrial Ceramic Bricks: An Experimental Investigation. Defect Diffus. Forum 2012, 326, 267–272. [Google Scholar] [CrossRef]
  7. Batista, V.R.; Nascimento, J.J.S.; LIMA, A. Drying and Volumetric Retraction of Solid and Hollow Ceramic Bricks: A Theoretical and Experimental Investigation. Matéria 2009, 14. (In Portuguese) [Google Scholar] [CrossRef]
  8. Cadé, M.A.; Nascimento, J.J.S.; Lima, A.G.B. Drying of Holed Ceramic Bricks: An Approach by Finite-Volumes. Matéria 2005, 10, 443–453. (In Portuguese) [Google Scholar]
  9. Almeida, G.S.; Fernandes, M.A.F.; Fernandes, J.N.; Neves, G.A.; Barbosa de Lima, W.M.P.; de Lima, A.G.B. Drying of Industrial Ceramic Bricks: An Experimental Investigation in Oven. Defect Diffus. Forum 2014, 353, 116–120. [Google Scholar] [CrossRef] [Green Version]
  10. da Silva Almeida, G.; da Silva, J.B.; e Silva, C.J.; Swarnakar, R.; de Araújo Neves, G.; de Lima, A.G.B. Heat and Mass Transport in an Industrial Tunnel Dryer: Modeling and Simulation Applied to Hollow Bricks. Appl. Therm. Eng. 2013, 55, 78–86. [Google Scholar] [CrossRef]
  11. Teixeira de Brito, M.K.; Teixeira de Almeida, D.B.; Barbosa de Lima, A.G.; Almeida Rocha, L.; Santana de Lima, E.; Barbosa de Oliveira, V.A. Heat and Mass Transfer during Drying of Clay Ceramic Materials: A Three-Dimensional Analytical Study. Diffus. Found. 2016, 10, 93–106. [Google Scholar] [CrossRef]
  12. Itaya, Y.; Uchiyama, S.; Hatano, S.; Mori, S. Drying Enhancement of Clay Slab by Microwave Heating. Dry. Technol. 2005, 23, 1243–1255. [Google Scholar] [CrossRef]
  13. Batista, V.R.; Nascimento, J.J.S.; Lima, A.G.B. Drying and Firing of Solid and Hollow Ceramic Bricks Including Dimensional Variations and Structural Damage. Rev. Eletrôn. Mater. Process. 2008, 3, 46–61. (In Portuguese) [Google Scholar]
  14. Araújo, M.V.; Delgado, J.; Barbosa de Lima, A.G. On the Use of CFD in Thermal Analysis of Industrial Hollow Ceramic Brick. Diffus. Found. 2016, 10, 70–82. [Google Scholar] [CrossRef]
  15. Keum, Y.T.; Jeong, J.H.; Auh, K.H. Finite-Element Simulation of Ceramic Drying Processes. Model. Simul. Mater. Sci. Eng. 2000, 8, 541. [Google Scholar] [CrossRef]
  16. Khalili, K.; Bagherian, M.; Khisheh, S. Numerical Simulation of Drying Ceramic Using Finite Element and Machine Vision. Procedia Technol. 2014, 12, 388–393. [Google Scholar] [CrossRef] [Green Version]
  17. Itaya, Y.; Taniguchi, S.; Hasatani, M. A Numerical Study of Transient Deformation and Stress Behavior of a Clay Slab during Drying. Dry. Technol. 1997, 15, 1–21. [Google Scholar] [CrossRef]
  18. Hasatani, M.; Ltaya, Y.; Muroie, K.; Taniguchi, S. Contraction characlfrlstlcs of molded ceramics during drying. Dry. Technol. 1993, 11, 815–830. [Google Scholar] [CrossRef]
  19. Banaszak, J.; Kowalski, S.J. Theoretical and Experimental Analysis of Stresses and Fractures in Clay like Materials during Drying. Chem. Eng. Process. Process Intensif. 2005, 44, 497–503. [Google Scholar] [CrossRef]
  20. Itaya, Y.; Mabuchi, S.; Hasatani, M. Deformation Behavior of Ceramic Slabs by Nonuniform Drying. Dry. Technol. 1995, 13, 801–819. [Google Scholar] [CrossRef]
  21. Itaya, Y.; Mori, S.; Hasatani, M. Effect of Intermittent Heating on Drying-Induced Strain-Stress of Molded Clay. Dry. Technol. 1999, 17, 1261–1271. [Google Scholar] [CrossRef]
  22. ltaya, Y.; Hasatani, M. R & D Needs-Drying of Ceramics. Dry. Technol. 1996, 14, 1301–1313. [Google Scholar] [CrossRef]
  23. De Lima, A.G.B.; da Silva, J.B.; Almeida, G.S.; Nascimento, J.J.S.; Tavares, F.V.S.; Silva, V.S. Clay Products Convective Drying: Foundations, Modeling and Applications. In Drying and Energy Technologies Advanced Structured Materials; Delgado, J., Lima, A., Eds.; Springer: Cham, Germany, 2016; Volume 63, pp. 43–70. [Google Scholar]
  24. Su, S.-L. Modeling of Multi-Phase Moisture Transfer and Induced Stress in Drying Clay Bricks. Appl. Clay Sci. 1997, 12, 189–207. [Google Scholar] [CrossRef]
  25. Araújo, M.V.; Santos, R.S.; da Silva, R.M.; Barbosa de Lima, A.G. Drying of Industrial Hollow Ceramic Brick: Analysis of the Moisture Content and Temperature Parameters. Defect Diffus. Forum 2017, 380, 72–78. [Google Scholar] [CrossRef]
  26. Augier, F.; Coumans, W.J.; Hugget, A.; Kaasschieter, E.F. On the Risk of Cracking in Clay Drying. Chem. Eng. J. 2002, 86, 133–138. [Google Scholar] [CrossRef]
  27. Itaya, Y.; Okouchi, K.; Mori, S. Effect of Heating Modes on Internal Strain–stress Formation during Drying of Molded Ceramics. Dry. Technol. 2001, 19, 1491–1504. [Google Scholar] [CrossRef]
  28. Itaya, Y.; Uchiyama, S.; Mori, S. Internal Heating Effect and Enhancement of Drying of Ceramics by Microwave Heating with Dynamic Control. Transp. Porous Media 2007, 66, 29–42. [Google Scholar] [CrossRef]
  29. Crasta, G.P. Costs and revenues of the Italian ceramic industry. Ceram. World Rev. 2006, 16, 46–50. (In Italian) [Google Scholar]
  30. Alves, H.J.; Melchiades, F.G.; Boschi, A.O. Initial Survey of the Consumption of Thermal and Electrical Energy in the Brazilian Ceramic Tile Industry. Cerâmica Ind. 2007, 12, 17–21. (In Portuguese) [Google Scholar]
  31. Alves, H.J.; Melchiades, F.G.; Boschi, A.O. Consumption of Natural Gas in Brazilian Ceramic Tile Industry. Cerâmica 2008, 54, 326–331. (In Portuguese) [Google Scholar] [CrossRef]
  32. Yu, B. Dynamic Modeling of a Tunnel Kiln. Heat Transf. Eng. 1994, 15, 39–53. [Google Scholar] [CrossRef]
  33. Nicolau, V.d.P.; Dadam, A.P. Numerical and Experimental Thermal Analysis of a Tunnel Kiln Used in Ceramic Production. J. Brazil. Soc. Mech. Sci. Eng. 2009, 31, 297–304. [Google Scholar] [CrossRef]
  34. Mezquita, A.; Boix, J.; Monfort, E.; Mallol, G. Energy Saving in Ceramic Tile Kilns: Cooling Gas Heat Recovery. Appl. Therm. Eng. 2014, 65, 102–110. [Google Scholar] [CrossRef]
  35. Soussi, N.; Kriaa, W.; Mhiri, H.; Bournot, P. Reduction of the Energy Consumption of a Tunnel Kiln by Optimization of the Recovered Air Mass Flow from the Cooling Zone to the Firing Zone. Appl. Therm. Eng. 2017, 124, 1382–1391. [Google Scholar] [CrossRef]
  36. Hadała, B.; Malinowski, Z.; Rywotycki, M. Energy Losses from the Furnace Chamber Walls during Heating and Heat Treatment of Heavy Forgings. Energy 2017, 139, 298–314. [Google Scholar] [CrossRef]
  37. Abbassi, A.; Khoshmanesh, K. Numerical Simulation and Experimental Analysis of an Industrial Glass Melting Furnace. Appl. Therm. Eng. 2008, 28, 450–459. [Google Scholar] [CrossRef]
  38. Chen, W.-H.; Chung, Y.C.; Liu, J.L. Analysis on Energy Consumption and Performance of Reheating Furnaces in a Hot Strip Mill. Int. Commun. Heat Mass Transf. 2005, 32, 695–706. [Google Scholar] [CrossRef]
  39. Dugwell, D.R.; Oakley, D.E. A Model of Heat Transfer in Tunnel Kilns Used for Firing Refractories. Int. J. Heat Mass Transf. 1988, 31, 2381–2390. [Google Scholar] [CrossRef]
  40. Han, S.H.; Chang, D.; Huh, C. Efficiency Analysis of Radiative Slab Heating in a Walking-Beam-Type Reheating Furnace. Energy 2011, 36, 1265–1272. [Google Scholar] [CrossRef]
  41. Milani, M.; Montorsi, L.; Stefani, M.; Saponelli, R.; Lizzano, M. Numerical Analysis of an Entire Ceramic Kiln under Actual Operating Conditions for the Energy Efficiency Improvement. J. Environ. Manag. 2017, 203, 1026–1037. [Google Scholar] [CrossRef]
  42. Oba, R.; Possamai, T.S.; Nicolau, V.P. Thermal Analysis of a Tunnel Kiln Used to Produce Roof Tiles. Appl. Therm. Eng. 2014, 63, 59–65. [Google Scholar] [CrossRef]
  43. Refaey, H.A.; Abdel-Aziz, A.A.; Ali, R.K.; Abdelrahman, H.E.; Salem, M.R. Augmentation of Convective Heat Transfer in the Cooling Zone of Brick Tunnel Kiln Using Guide Vanes: An Experimental Study. Int. J. Therm. Sci. 2017, 122, 172–185. [Google Scholar] [CrossRef]
  44. Refaey, H.A.; Abdel-Aziz, A.A.; Salem, M.R.; Abdelrahman, H.E.; Al-Dosoky, M.W. Thermal Performance Augmentation in the Cooling Zone of Brick Tunnel Kiln with Two Types of Guide Vanes. Int. J. Therm. Sci. 2018, 130, 264–277. [Google Scholar] [CrossRef]
  45. Bergman, T.L.; Incropera, F.P.; DeWitt, D.P.; Lavine, A.S. Fundamentals of Heat and Mass Transfer, 7th ed.; John Wiley & Sons: Hoboken, NJ, USA, 2011; ISBN 978-0470-50197-9. [Google Scholar]
  46. Churchill, S.W.; Chu, H.H.S. Correlating Equations for Laminar and Turbulent Free Convection from a Vertical Plate. Int. J. Heat Mass Transf. 1975, 18, 1323–1329. [Google Scholar] [CrossRef]
  47. The Engineering ToolBox. Available online: https://www.engineeringtoolbox.com/emissivity-coefficients-d_447.html (accessed on 1 April 2019).
  48. Patankar, S. Numerical Heat Transfer and Fluid Flow; CRC Press: Boca Raton, FL, USA, 1980. [Google Scholar]
  49. Smith, G.D. Numerical Solution of Partial Differential Equations: Finite Difference Methods, 3rd ed.; Oxford University Press: New York, NY, USA, 1985; ISBN 0-19-859641-3. [Google Scholar]
  50. Versteeg, H.K.; Malalasekera, W. An Introduction to Computational Fluid Dynamics, The Finite Volume Method, 2nd ed.; Pearson Education Limited: Harlow, UK, 2007; ISBN 978-0-13-127498-3. [Google Scholar]
  51. Celik, I.B.; Ghia, U.; Roache, P.J. Procedure for Estimation and Reporting of Uncertainty Due to Discretization in CFD Applications. J. Fluids Eng. Trans. ASME 2008, 130. [Google Scholar] [CrossRef]
  52. Richardson, L.F.; Gaunt, J.A., VIII. The Deferred Approach to the Limit. Philos. T. R. Soc. Lond. 1927, 226, 299–361. [Google Scholar] [CrossRef]
  53. Richardson, L.F., IX. The Approximate Arithmetical Solution by Finite Differences of Physical Problems Involving Differential Equations, with an Application to the Stresses in a Masonry Dam. Philos. T. R. Soc. Lond. 1911, 210, 307–357. [Google Scholar] [CrossRef] [Green Version]
  54. Almohammadi, K.M.; Ingham, D.B.; Ma, L.; Pourkashan, M. Computational Fluid Dynamics (CFD) Mesh Independency Techniques for a Straight Blade Vertical Axis Wind Turbine. Energy 2013, 58, 483–493. [Google Scholar] [CrossRef]
  55. Roache, P.J. Perspective: A Method for Uniform Reporting of Grid Refinement Studies. J. Fluids Eng. 1994, 116, 405–413. [Google Scholar] [CrossRef]
  56. Celik, I.; Karatekin, O. Numerical Experiments on Application of Richardson Extrapolation with Nonuniform Grids. J. Fluids Eng. 1997, 119, 584–590. [Google Scholar] [CrossRef]
Figure 1. Intermittent ceramic kiln used in the study.
Energies 12 01568 g001
Figure 2. Scheme showing the position of the thermocouples on the right (a) and left (b) sidewall of the kiln.
Energies 12 01568 g002
Figure 3. View of the kiln and control volumes in the sidewalls, base, and ceiling of the equipment.
Energies 12 01568 g003
Figure 4. Considerations for the analysis of the kiln with thermal insulation.
Energies 12 01568 g004
Figure 5. Control volume used in the discretization.
Energies 12 01568 g005
Figure 6. Outer surface temperature of the kiln and air as a function of time.
Energies 12 01568 g006
Figure 7. Temperature near the inner surface of the kiln and chimney as a function of time.
Energies 12 01568 g007
Figure 8. Temperatures of the kiln's internal and external surfaces, and ambient surroundings of the kiln as a function of time.
Energies 12 01568 g008
Figure 9. Heat losses of the kiln as a function of time.
Energies 12 01568 g009
Figure 10. Comparison between the heat losses by the sidewalls and the base/ceiling assembly of the kiln as a function of time.
Energies 12 01568 g010
Figure 11. Specific heat flux lost by the kiln as a function of time.
Energies 12 01568 g011
Figure 12. Comparison between the specific heat fluxes lost by the sidewalls and the base/ceiling assembly of the kiln as a function of time.
Energies 12 01568 g012
Figure 13. Heat transfer rates in the kiln without thermal insulation.
Energies 12 01568 g013
Figure 14. Heat rate supplied to the kiln as a function of time.
Energies 12 01568 g014
Figure 15. Accumulated energy supplied to the kiln as a function of time.
Energies 12 01568 g015
Figure 16. Conduction heat gain by the thermal insulation as a function of time for different meshes.
Energies 12 01568 g016
Figure 17. Global energy balance in thermal insulation as a function of time for different meshes.
Energies 12 01568 g017
Figure 18. Conduction energy gain by the thermal insulation during the heating process as a function of the mesh parameter (l).
Energies 12 01568 g018
Figure 19. Conduction heat gain by the thermal insulation as a function of the time for different time steps.
Energies 12 01568 g019
Figure 20. Temperature inside the thermal insulation as a function of time.
Energies 12 01568 g020
Figure 21. Temperature inside the thermal insulation for several instants of time.
Energies 12 01568 g021
Figure 22. Average temperature inside the thermal insulation during the heating process.
Energies 12 01568 g022
Figure 23. Convective heat transfer coefficient for the kiln with and without thermal insulation as a function of time.
Energies 12 01568 g023
Figure 24. Radiation heat transfer coefficients for the kiln with and without thermal insulation as a function of time.
Energies 12 01568 g024
Figure 25. Heat transfer rates in the thermal insulation as a function of time.
Energies 12 01568 g025
Figure 26. Heat rates supplied for the kiln with and without thermal insulation as a function of time.
Energies 12 01568 g026
Figure 27. Accumulated energy supplied for the kiln with and without thermal insulation as a function of time.
Energies 12 01568 g027
Table 1. Properties and application range of Ceramic Fiber–LD–1200 as a function of the operating temperature.
PropertiesOperating Temperature (°C)Application Range
050100150200250300350400
Thermal conductivity (W/mK)0.06300.06650.07000.07350.07700.08280.08850.09430.1000up to 1200 °C
Density (kg/m3)240
Specific heat (J/kg·K)1110
Emissivity0.75
Table 2. Coefficients of the discretized equation for each control volume.
Control Volume a E a W a P 0 S u S P
Left boundary k e δ x PE 0 ρ c p Δ x Δ t k f 1 δ x wP T s , ext k f 1 δ x wP
Central k e δ x PE k w δ x WP ρ c p Δ x Δ t 0 0
Right boundary 0 k w δ x WP ρ c p Δ x Δ t h ¯ c + h ¯ r 1 + ( h ¯ c + h ¯ r ) δ   x   Pe k f 2 T amb h ¯ c + h ¯ r 1 + ( h ¯ c + h ¯ r ) δ   x   Pe k f 2
Table 3. Convergence conditions as a function of the C value of the Equation (37) [54].
RangeConvergence condition
C > 1Monotonic divergence
0 < C < 1Monotonic convergence
−1 < C < 0Oscillatory convergence
C < −1Oscillatory divergence
Table 4. Details of the meshes used in the mesh refinement study.
MeshNumber of Control Volumesl (mm) (Equation (33))
M1201.25
M2102.5
M355
Table 5. Data of the mesh convergence study for conduction energy gain by the thermal insulation during the kiln heating process variable.
L (mm)ϕ1 (MJ)ϕ2 (MJ)ϕ3 (MJ)Cϕ21ext (J)ICM21ICM32(r21)pICM21
25 mm115,119115,114113,9053.98 × 10−3115,1192.08 × 10−75.24 × 10−55.24 × 10−5
Table 6. Data of the time step independence study for the conduction energy gain variable during the heating process.
Δt = 0.1 minΔt = 1 minΔt = 15 minε12 = ϕ1 − ϕ2 (MJ)ε23 = ϕ2 − ϕ3 (MJ)
ϕ1 (MJ)ϕ2 (MJ)ϕ3 (MJ)
115.1142115.1128115.09640.00140.0164
Table 7. Comparison between the energies lost by the sidewalls for the kiln with and without thermal insulation during the heating step.
CaseEnergy
Heat Transfer ModeMJ%
Kiln without thermal insulationLost by convection317.7536.96
Lost by radiation542.0663.04
Total859.81100.00
Kiln with thermal insulationLost by convection44.7140.89
Lost by radiation57.9152.95
Stored in the thermal insulation6.736.16
Total109.35100.00
Table 8. Kiln’s performance data with and without thermal insulation.
Case Supplied Energy (MJ)Global Energy Gain (%)Maximum External Temperature (°C)
Kiln without thermal insulation2121.87-249.34
Kiln with thermal insulation1377.2235.09%79.47

