Particle Simulation Model for Self-Field Magnetoplasmadynamic Thruster

College of Aerospace Science and Engineering, National University of Defense Technology, Changsha 410073, China
*
Authors to whom correspondence should be addressed.
Energies 2019, 12(8), 1579; https://0-doi-org.brum.beds.ac.uk/10.3390/en12081579
Submission received: 13 March 2019
/
Revised: 22 April 2019
/
Accepted: 23 April 2019
/
Published: 25 April 2019
Abstract
:In order to clarify the discharge principle of the self-field magnetoplasmadynamic thruster (MPDT), a two-dimensional axisymmetric particle-in-cell/Monte Carlo collision (PIC/MCC) model is proposed. The spatial distribution and the collision characteristics of discharge plasma were calculated using this model. In addition, the influence of the operation parameters on the plasma was analyzed including the voltage and mass flow rate. The effectiveness of the model was verified by comparison to the experimentally induced magnetic field. It was found that the electrons were mainly accelerated by the electric field in the cathode sheath and the electric field shielding effect of plasma was obvious in the bulk plasma region. Due to the pinch effect, the charged particles were constrained near the cathode. The results of the present work implied that the PIC/MCC model provides an approach to investigate the plasma distribution and a kinetic description of particles for the discharge of the self-field MPDT.
1. Introduction
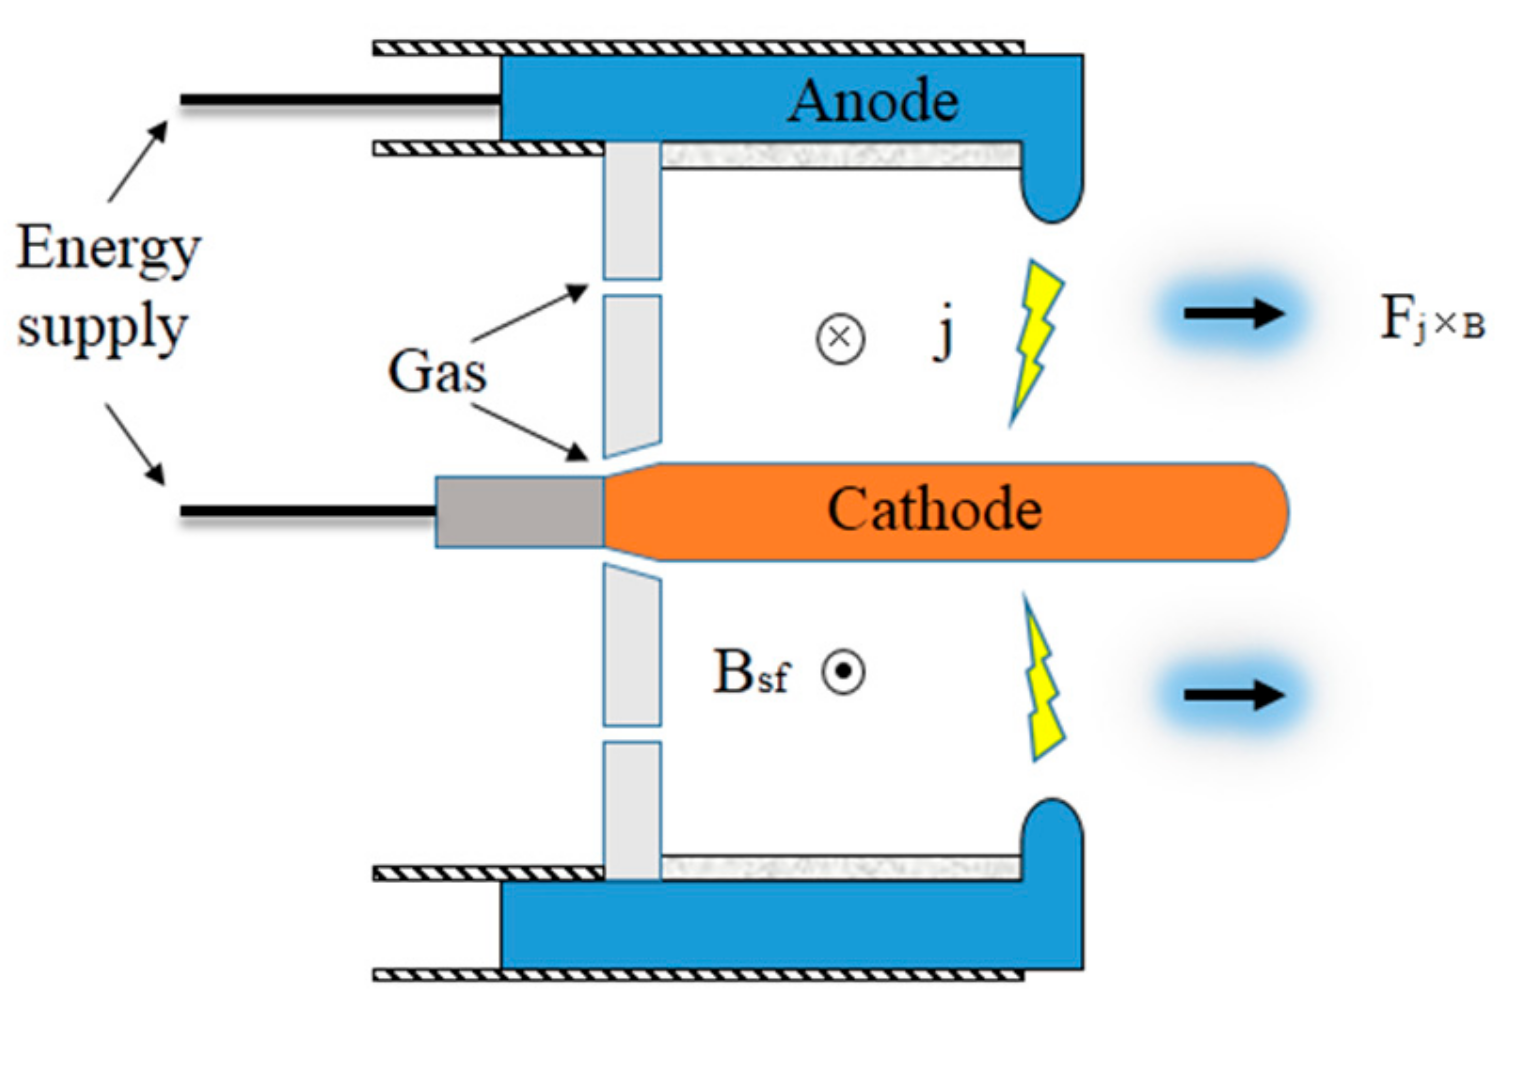
Magnetoplasmadynamic thrusters (MPDTs) have been one of the most competitive accelerators for space propulsion application such as deep space exploration, orbit transfer, etc. However, improvement of the self-field MPDT’s performance is seriously restricted by low efficiency—about 30% [1,2,3]. A typical self-field MPDT consists of a central cathode with a coaxial annular anode, shown in Figure 1. The characteristic feature of the self-field MPDT is that the magnetic field Bsf is induced by the discharge current j. The electromagnetic force Fj×B is generated by coupling the discharge current and induced magnetic field in the azimuthal direction. The gas propellant is heated, ionized, and accelerated by the effect of electrothermal or electromagnetic exhaust as high-enthalpy plasma, approximately tens of kilometers per second eventually. It is extremely difficult to improve thruster performance without a profound insight into such a complicated process.
In order to obtain a comprehensive understanding of the self-field MPDT, many models have been developed for the analysis of discharge plasma. Itsuro et al. [4] calculated the current distribution on the electrodes of self-field MPDTs by non-dimensional Ohm’s law and Maxwell’s equations, with the assumption of small magnetic Reynolds number. The results showed that the current density near the cathode tip has a large value than other positions because of the cathode spot discharge mode. But the assumption of uniform distribution of discharge plasma limits its application, especially in finding the distribution properties of plasma. To predict the performance of self-field steady-state MPDTs, Michael [5] developed a fully two-dimensional magnetohydrodynamics (MHD) code. The predictions of the model were in a good agreement with experimental results with different current and mass flow rates. Yet, a single fluid and single temperature approximation in this model did not capture the entire details of all the particles in the discharge plasma. Edgar [6] showed the spatial distribution of the current density at high and low current levels over the electrode surfaces through simple relations for the scaling of performance parameters. In order to simulate the flow field of the self-field MPDT, Sankaran et al. [7] presented an advanced code based on two-temperature MHD equations. The calculated results matched with the experimental values within 2%. However, the absence of the electrode voltage fall in the simulation caused an incomplete calculation results to compare with the measured total voltage directly. Jorg [8] described the plasma flow by a series of conservation equations. The effort by Kubota [9] was aimed at modeling and simulating the processes of self-field MPDT, which analyzed the ionization and acceleration processed in the wide operation range. Xisto et al. [10,11] developed a two-dimensional model based on the MHD equations for the simulation of self-field MPDT. This model is used to detect the influence of electrodes on the discharge current or efficiency of the thrusters. Nevertheless, such a set of complicated MHD equations are based on the hypothesis of continuum theory or some empirical coefficients of plasma, which would inevitably cause discrepancies with actual results.
Besides, these several codes based on the MHD approach cannot capture the kinetic description and the interactions of plasma particles, and unless additional boundary conditions [5] of electrodes’ sheath are added, few of these models can describe the distribution properties of discharge plasma near the electrodes. Fortunately, the particle-in-cell (PIC) [12,13] method has been widely used to solve the above issues. Tang et al. [14,15,16] introduced a particle-in-cell with Monte Carlo collision (PIC/MCC) model to simulate the physical processes, acceleration mechanisms, and energy conversion of applied-field MPDT. Yet, until now, there were few published particle models for the simulation of the discharge processes in self-field MPDT.
In this paper, a PIC/MCC simulation model is developed to investigate the characteristics of the discharge plasma in self-field MPDT. In Section 2, the basic theory of the model is described. Section 3 details the results and discussions of discharge plasma in self-field MPDTs. Finally, Section 4 presents the conclusions of this article.
2. Model Description
2.1. Particle-in-Cell Method
Typically, induced magnetic fields play an important role in pushing charged particles during the discharge of self-field MPDT. In our PIC model, the electromagnetic algorithm [17] was used as the field solver. However, it is really complex to solve the full Maxwell equations. Considering that the change of the electric field or magnetic field is not obvious at all in a quasi-steady working condition of the thruster, the equations can be simplified as follows:
where is the charge quantity of electrons and ions. As is known, the relation between electric field and potential can be described by the equation , so Poisson’s equation can be expressed as:
Normally, the charged particles appear as an irregular distribution inside the spatial grids and they should be allocated onto the grid nodes by a weighting method. In the present model, an area weighting (first-order) [17] method was used to relocate the charge density onto the calculation nodes. Eventually, the outline of solving the electric field can proceeded from:
As for the solution of the magnetic field, the process of the self-induced component is the main section of the calculation. As Equation (1) described, the self-magnetic field is induced by the discharge current density, and the relation between magnetic field and magnetic vector potential can be expressed by the equation . The different components of magnetic vector potential can be obtained by the following equation:
Consequently, the magnet field can be acquired from:
Electrons or ions in discharge plasma are driven by the Lorentz force in the electromagnetic field. Absolutely, this process can be described through Newton’s laws of motion according to the following equation:
Certainly, some skills of computation must be used to solve the equations just like the leap-frog algorithm [17], which describes the half- or integral-time difference between position and velocity in finite-difference equations.
2.2. Monte Carlo Collision
The collision phenomenon of plasma particles is an extremely important physical process to maintain the discharge. In the present model, the Monte Carlo collision (MCC) procedure was coupled to the PIC algorithms to describe the gas discharge process in MPDTs. In a general definition, the collision frequency and collision probability P during a period of can be expressed, respectively, as:
where are the density of the target particles, collision cross-section, and the velocities of incident particles, respectively. However, it is really time consuming that the collisional processes of all the particles in each time-step must be calculated. Fortunately, a flexible collisional process called null collision [18] was developed which defines a frequency and the maximum collision probability . In this method, just a smaller number of particles are chosen as collision sample and it can be expressed as:
where . If a particle is chosen, the collision type can be judged from [19]:
where R is a random number between 0 and 1. Now, we can execute the procedure of Monte Carlo collision as:
Next, we deal with the collision dynamics of incident particles. Under realistic conditions, there are many types of collisions that change particles’ energy, momentum, and the state of excitation or charge. The main collision processes of discharge in self-field MPDT include elastic scattering, excitation, ionization, momentum exchange, and charge exchange. Considering the large neutral-to-electron mass ratio and the low temperature of gas particles, the momentum of the neutral is assumed to be unchanged in the interaction between electron and neutral. Under this assumption, only the velocities and scattering angles of new electrons need to be solved after collisions. However, the ions and the neutral atoms have the same mass which results in the above assumption being inappropriate. For the charge exchange collisions, it can be simplified as the exchange of velocities [20], and the momentum conservation law was applied to find the velocities and angles for the momentum exchange collisions. A list [17,18,19,20,21,22] of characteristics for particles are summarized in the Table 1. and are energies of the scattered, incident, secondary electron, excitation threshold, ionization threshold, and scattering angle. is a known function and R is a random number between 0 and 1.
2.3. Physical Processes of a Self-Field MPDT
The details of physical progresses are so complicated that few studies to date have presented thorough theories, especially for the acceleration mechanisms in self-field MPDTs. It includes a series of phenomena between electrodes during the discharge, such as electron thermionic emission of the cathode, gas ionization, species transport in plasma, behavior of electrodes’ sheaths, secondary electron emission, cathode erosion, etc. This paper mainly presents the analysis of three zones: bulk plasma column, anode, and cathode sheaths.
2.3.1. Cathode Thermionic Emission
In general, the temperature of a cathode will reach 3000K in stable working condition. At such high temperatures, electrons trapped in the metal can acquire enough thermal energy to escape from the metal, which is called cathode thermionic emission. The thermionic current density is given by the Richardson–Dushmann equation [23]:
where A is the emission parameter of metal, is the work function, E is the electric field between electrodes, and T is the temperature of the cathode surface. Compared with thermal emission, the field emission effect is weak enough to be neglected in our model. As per the description in Reference [24], the cathode was fabricated from 2% thoriated tungsten and the thorium will evaporate in a very short period of time after triggering. Therefore, the tungsten’s work function is the realistic value of the cathode material’s work function during the steady-state discharge phase. For the tungsten,. The experimental temperature ranges from 2600 K to 3200 K at the tip and midpoint of the cathode, respectively. In order to simplify the calculation, the cathode surface temperature was assumed a uniform and typical value, and T = 3000 K was chosen. Similarly, cathode erosion was not considered in this simulation model.
2.3.2. Cathode Sheath
The electrons emitted from the cathode surface accelerate into the sheath area, which is located next to the cathode [25]. The cathode sheath voltage drop is ordinarily comparable to the ionization threshold of the discharge gas. In fact, the cathode voltage’s fall plays a significant role in sustaining the sufficient energy of electrons for gas ionization in a steady-state discharge MPDT. In other words, the cathode sheath is a region of potential and density gradients. At the same time, as the transport of electrons, the ions move towards the cathode from the arc column and interact with the cathode surface eventually. Consequently, secondary electrons will be emitted by energetic ions’ impact on the cathode surface. However, the secondary electrons’ current is relatively small compared with the discharge current and it is ignored in the present model.
2.3.3. Anode Sheath
Unlike the cathode sheath, the anode sheath contains a relatively large potential drop within a short distance. Although the anode fall voltage is usually less than the ionization potential, the electrons accelerate towards the anode under the action of electric field. As a result, the anode temperature is typically higher than that of the cathode and anode spots appear especially in extremely high current density. Studies [25] have shown that anodes can operate in the diffuse attachment mode when the current density is below , and in spot mode while the current density reaches . Typical experimental results [1] have shown that cathode current density is about 150 for most of the MPDT’s current level. Therefore, the homogeneous or diffuse electrode attachment is the main mode in our simulation model.
2.3.4. Bulk Plasma
The bulk plasma region is usually regarded as quasi-neutral group of particles, including a large number of neutral atoms, ions, and electrons. Actually, electrons accelerated by cathode sheath potential drop reach the ionization threshold energy of argon gas propellant in this paper. This region is also the main area of interaction between different particles. The background gas pressure was 0.01 Pa in our model. Considering the close relationship between collision frequency and particle density, the interactions between charged particles and neutral atoms were the predominant processes rather than the Coulomb collisions between charged particles. Table 2 displays a list of processes of interaction in the present model. At last, different cross-section must be known before the calculation of collision which can be acquired from References [26,27,28].
2.4. Computational Method
Actually, the PIC/MCC method causes a huge computational cost on account of the space–time scale limit [17,18,20]. These constraints mainly consist of the Courant–Friedrichs–Lewy (CFL) condition—the error limitation of the leap-frog method and fine grid instability—which restrict the grid length and time-step by following requirement:
where is a simple harmonic oscillator frequency of plasma electron, is plasma Debye length, c is the speed of light. In the discharge chamber of the thruster, the electron density is on the order of 1018 to 1020 m−3 measured in previous experiments and the electron temperature is of the order of 1 eV hypothetically. Thus, the electron oscillation frequency and Debye length could be estimated about 1012 Hz and 10−6 m respectively from the following formula:
Consequently, there will be more than one hundred million (108) simulation steps (about 10−12s in a step) and billions of particles to be tracked every simulation step. In order to reduce the amount of calculation, the particles pushed by electromagnetic field are widely substituted by super particles, which have the same charge-to-mass ratio with a single particle. In addition, the dimension of thruster is scaled down as [13] in this model. The scaling schemes of the relevant physical quantities are listed in Table 3.
3. Results and Discussion
The simulated MPDT in the present model reported by Gallimore [1] is a quasi-steady self-field cylinder axisymmetric geometry using an argon propellant at a power level of approximately hundreds of kilowatts. For a description of the thruster in the experiments, it consists of a 1-cm radius central cathode with an inner radius of 7.5 cm and an outer radius of 9.5 cm coaxial annular anode. The argon propellant was ionized through the interaction with the discharge current in the chamber after injection from an insulating plate. Because the reduction factor was 0.01, all of the thruster dimensions were scaled using the scaling schemes in Table 3. The calculated area was a square region with axial and radial values of 1.2 mm, shown in Figure 2a. The number of grids in both directions were 120 × 120. That is to say, the grid size Δz = Δr = 0.01 mm. The time-step of the simulation was Δt = 1.4 × 10⁻¹⁴s, which satisfied the constraints in Section 2.4. The whole simulation time was 1.4 × 10⁻⁸s, including 106 steps.
Considering the axial symmetry of the geometry, two dimensions in space, and three dimensions in velocity (2D3V) PIC/MCC code (written in Python) was developed in the present model neglecting the azimuthal position of the quantities. The simulation region was the discharge chamber, where neutral particles are ionized and accelerated.
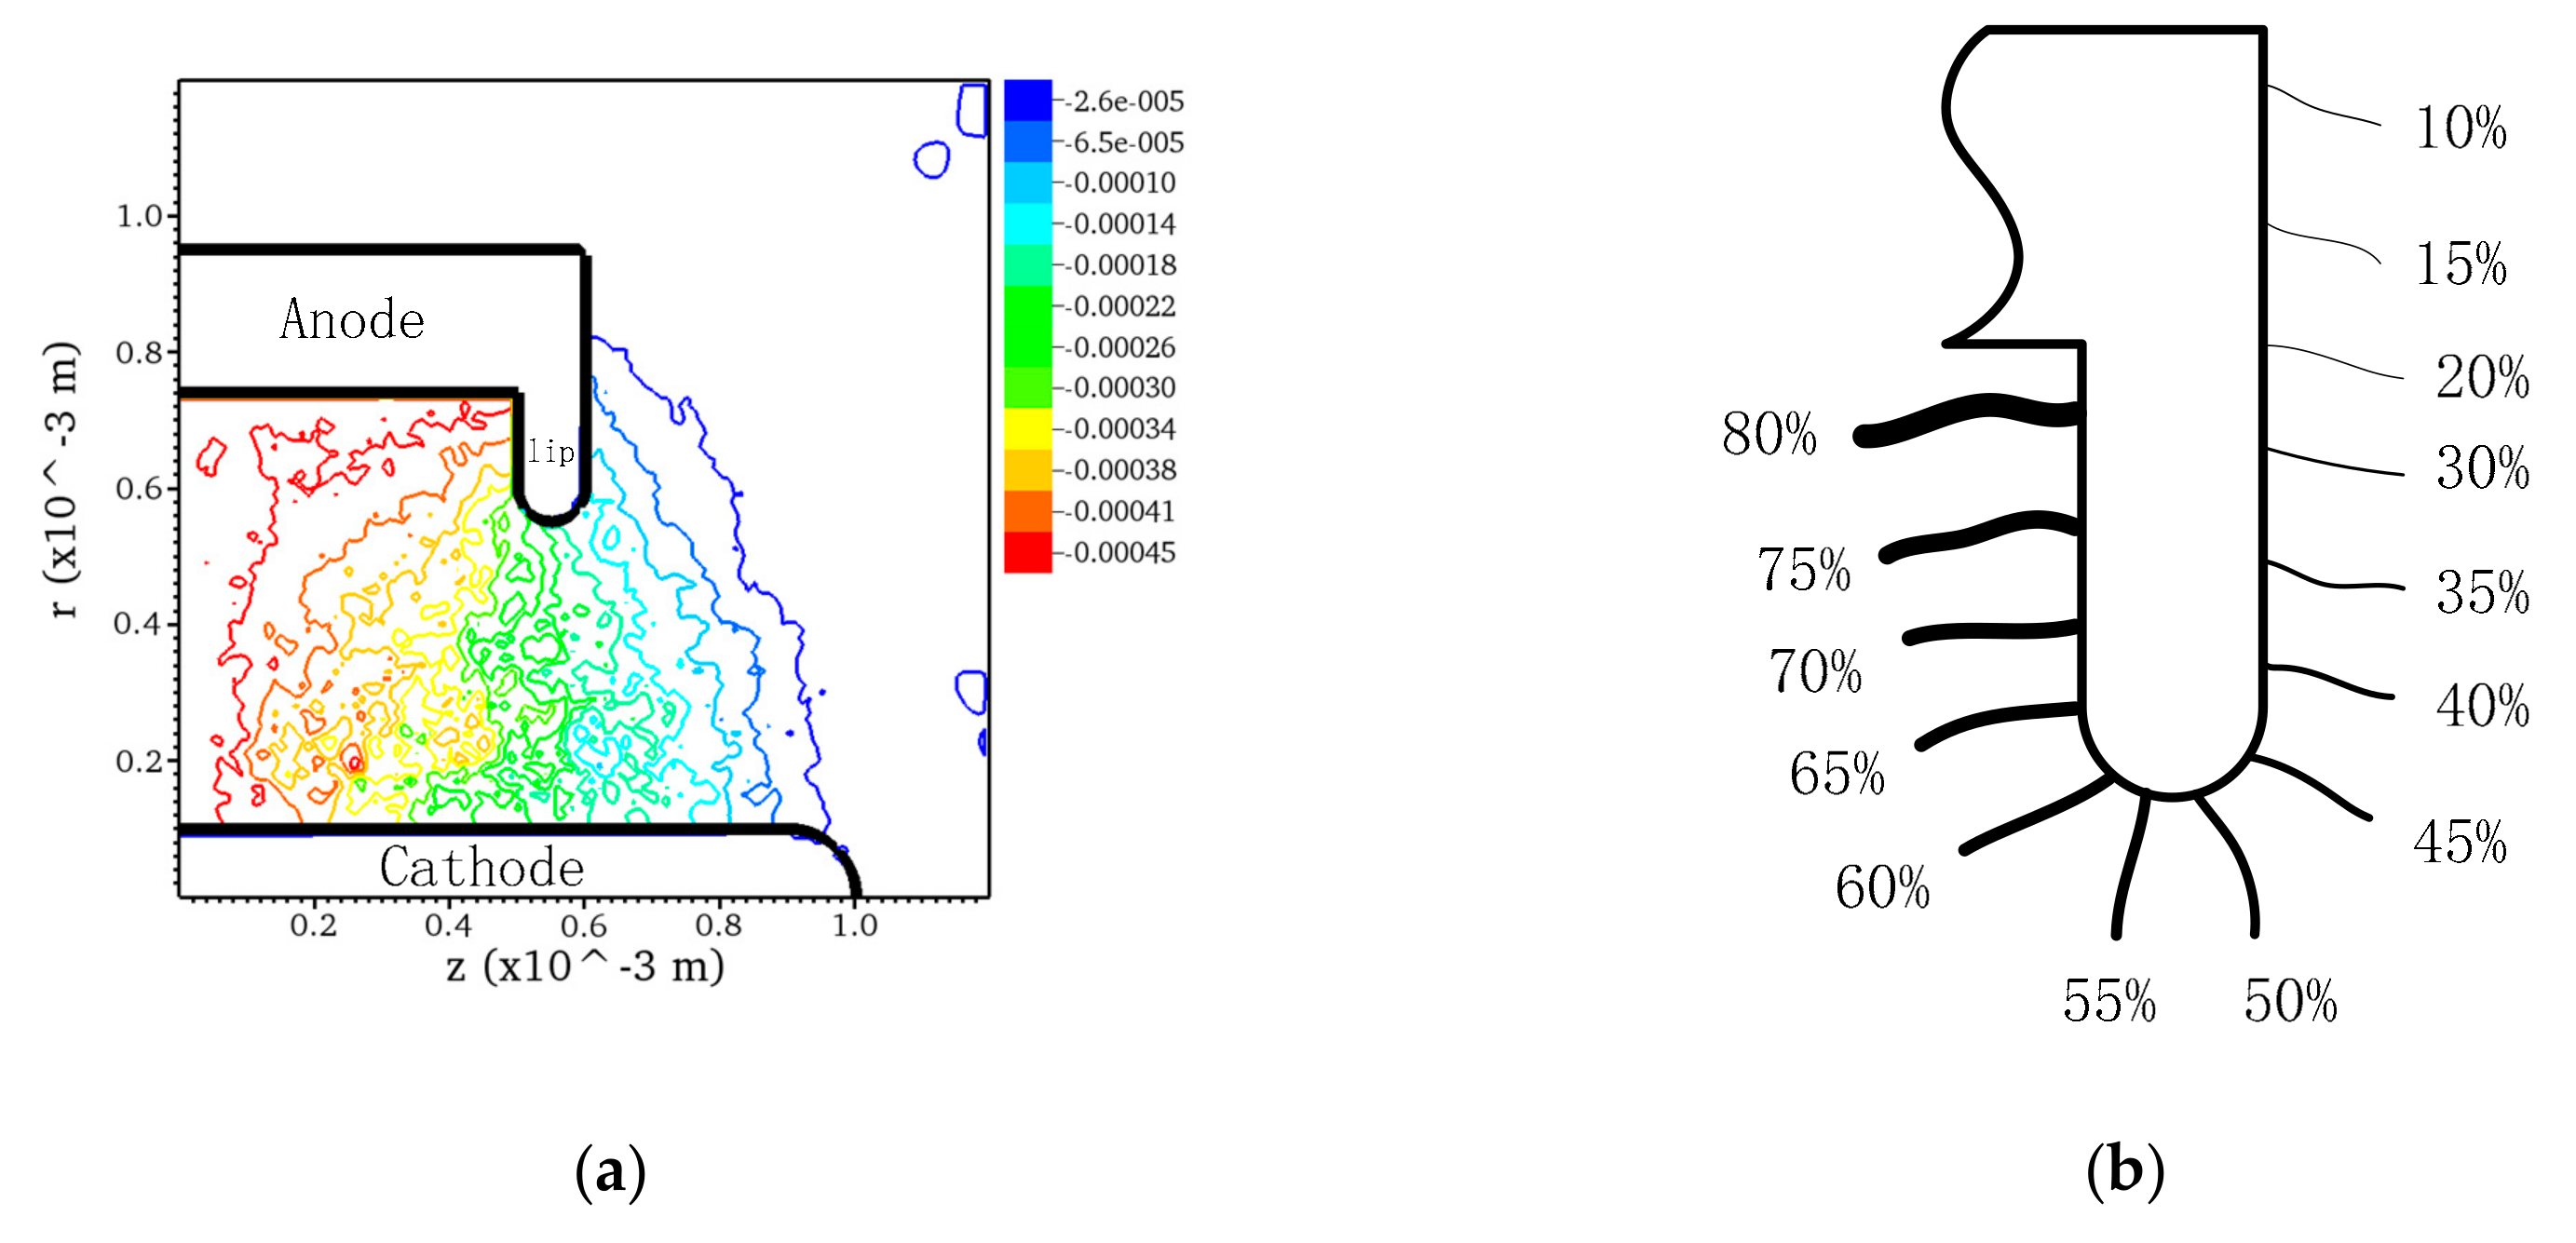
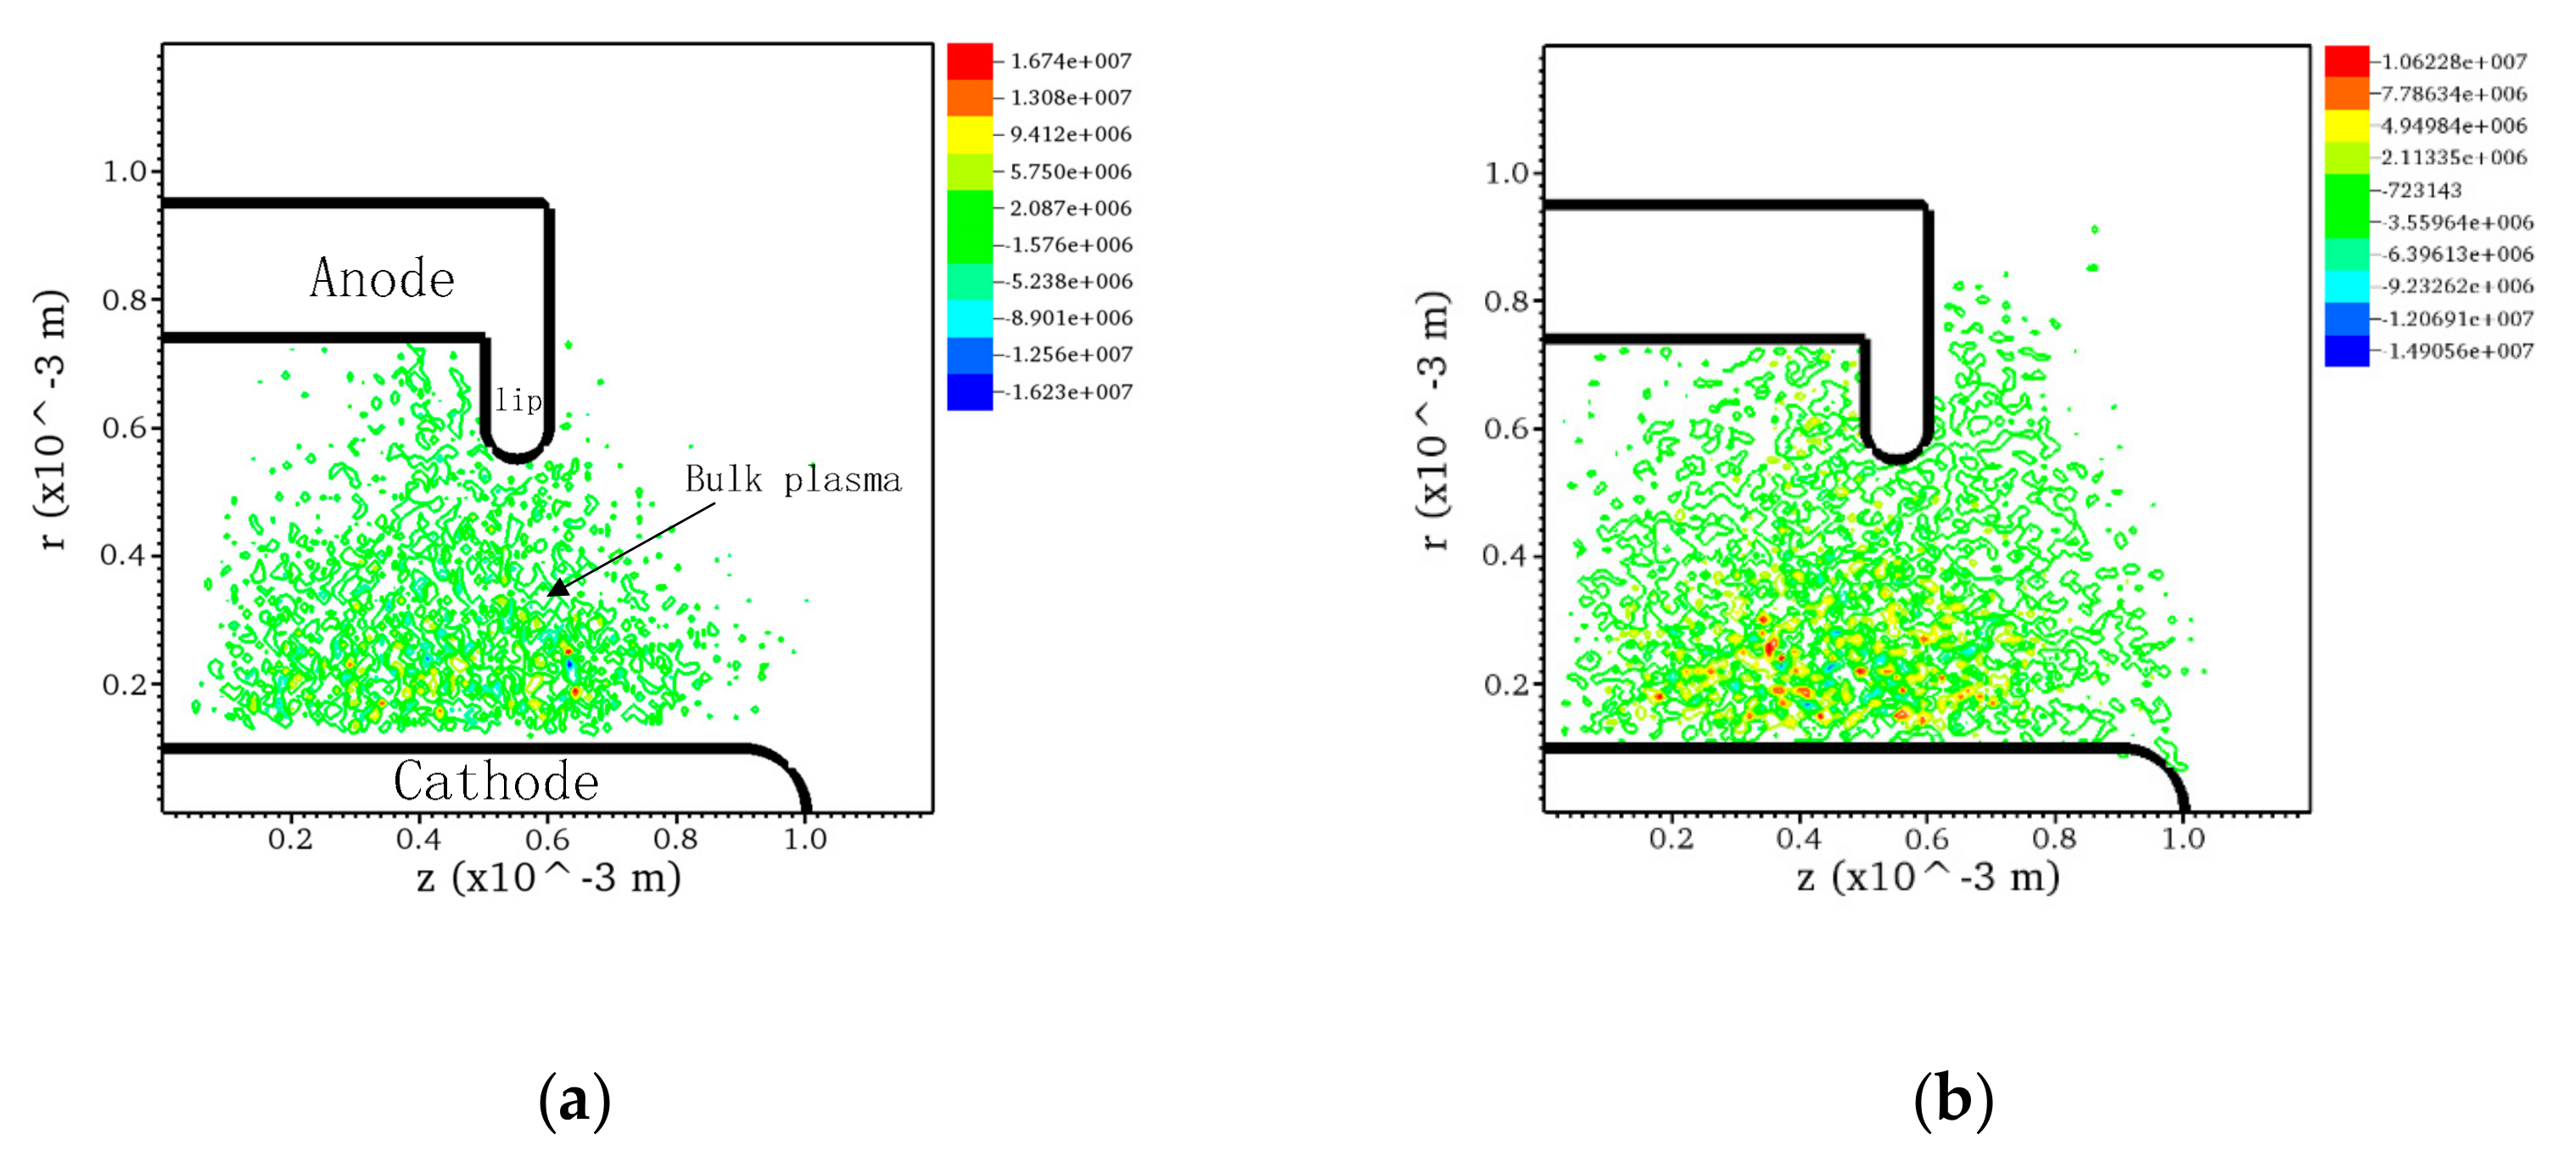
Figure 2 shows the comparison of the induced magnetic field distribution between the calculated value and the experimental value. Figure 2b shows the experimental current contours in Reference [1]. As described in Reference [1], these current contours were obtained by measured magnetic fields using Ampere’s law. So, these percentages illustrated in the graph represent the relative proportion of the magnetic fields at different locations. In order to display the magnitude of the magnetic fields, we calculated the value of the magnetic fields directly in Figure 2a. As can be seen from the figure, the magnetic field on the side of the discharge chamber at the position of the anode lip was the largest. This is because the induced magnetic field generated by the charged particles was in the same direction at this position, which was in the direction perpendicular to the z–r surface. In this case, the discharge current is 400A and the maximum induced magnetic field is 4.5 gauss. Along the anode lip outward, the magnetic field decreases gradually. This indicates that the direction of induced magnetic field was reversed as the position changes, weakening the whole magnetic field at the middle or right position. The magnetic field outside the anode lip was small, indicating that the current was small in this region. The calculated distribution of the induced magnetic field was basically consistent with the experimental value, which verifies the correctness of the model.
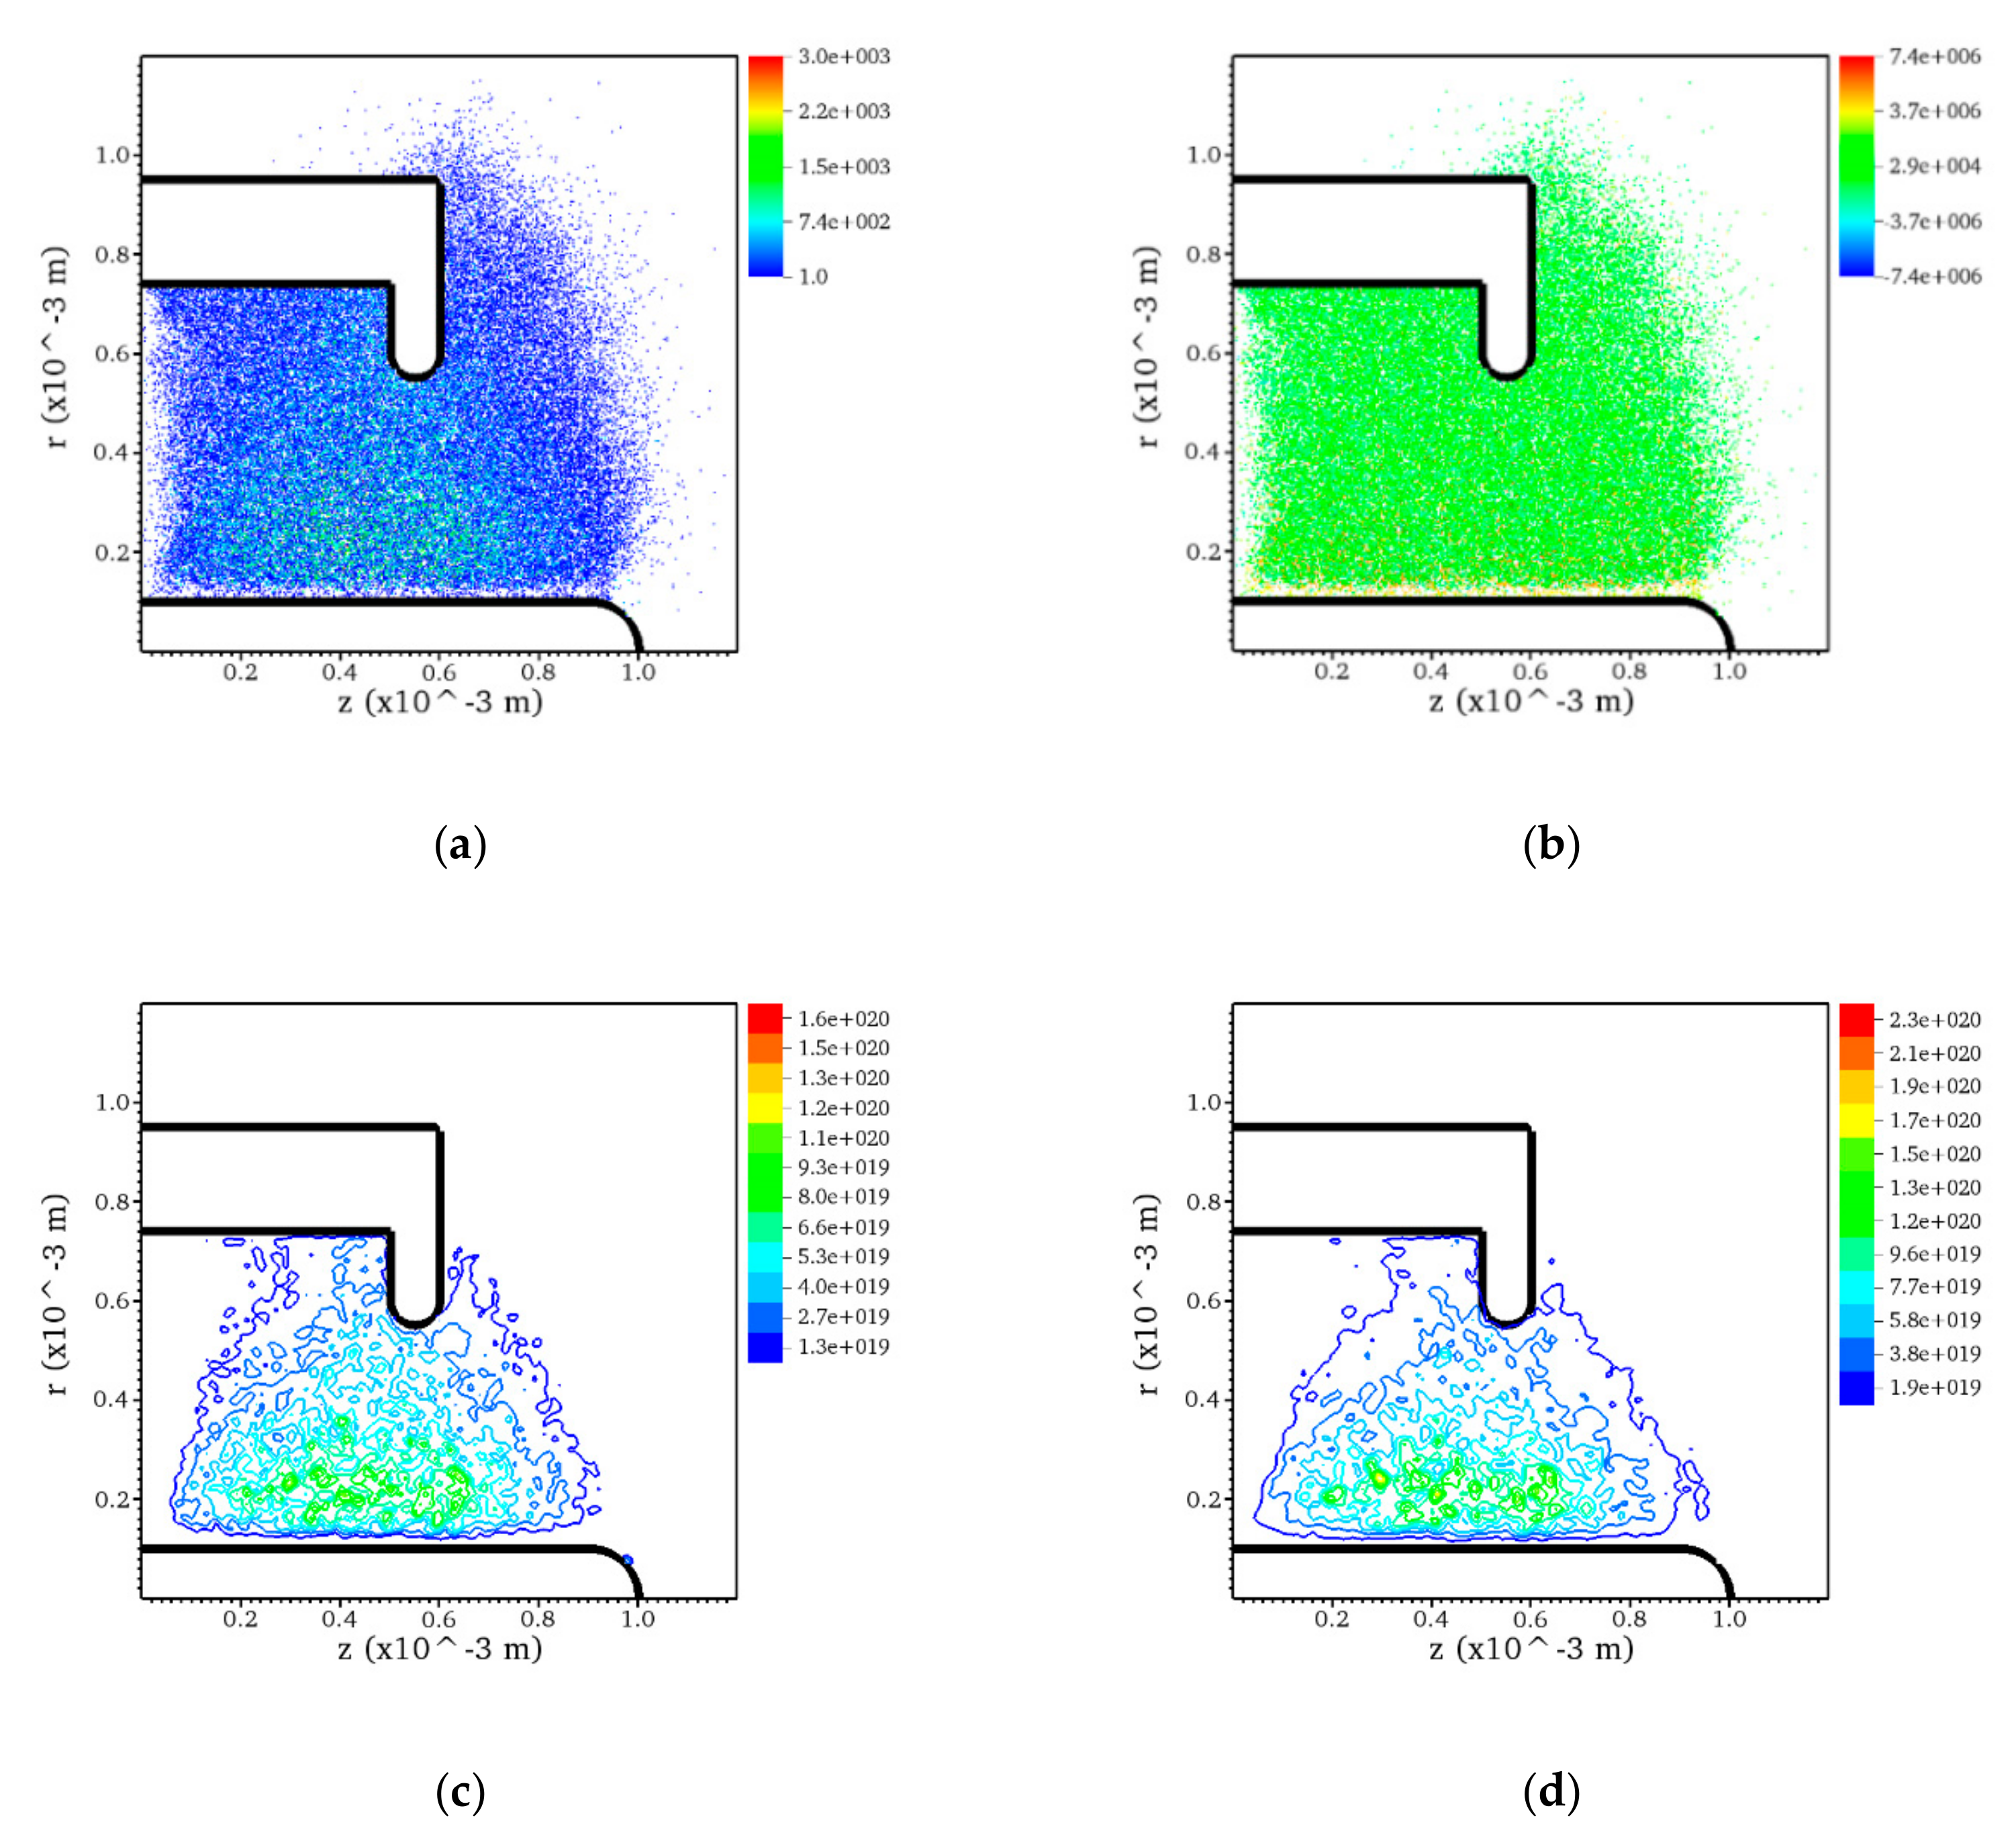
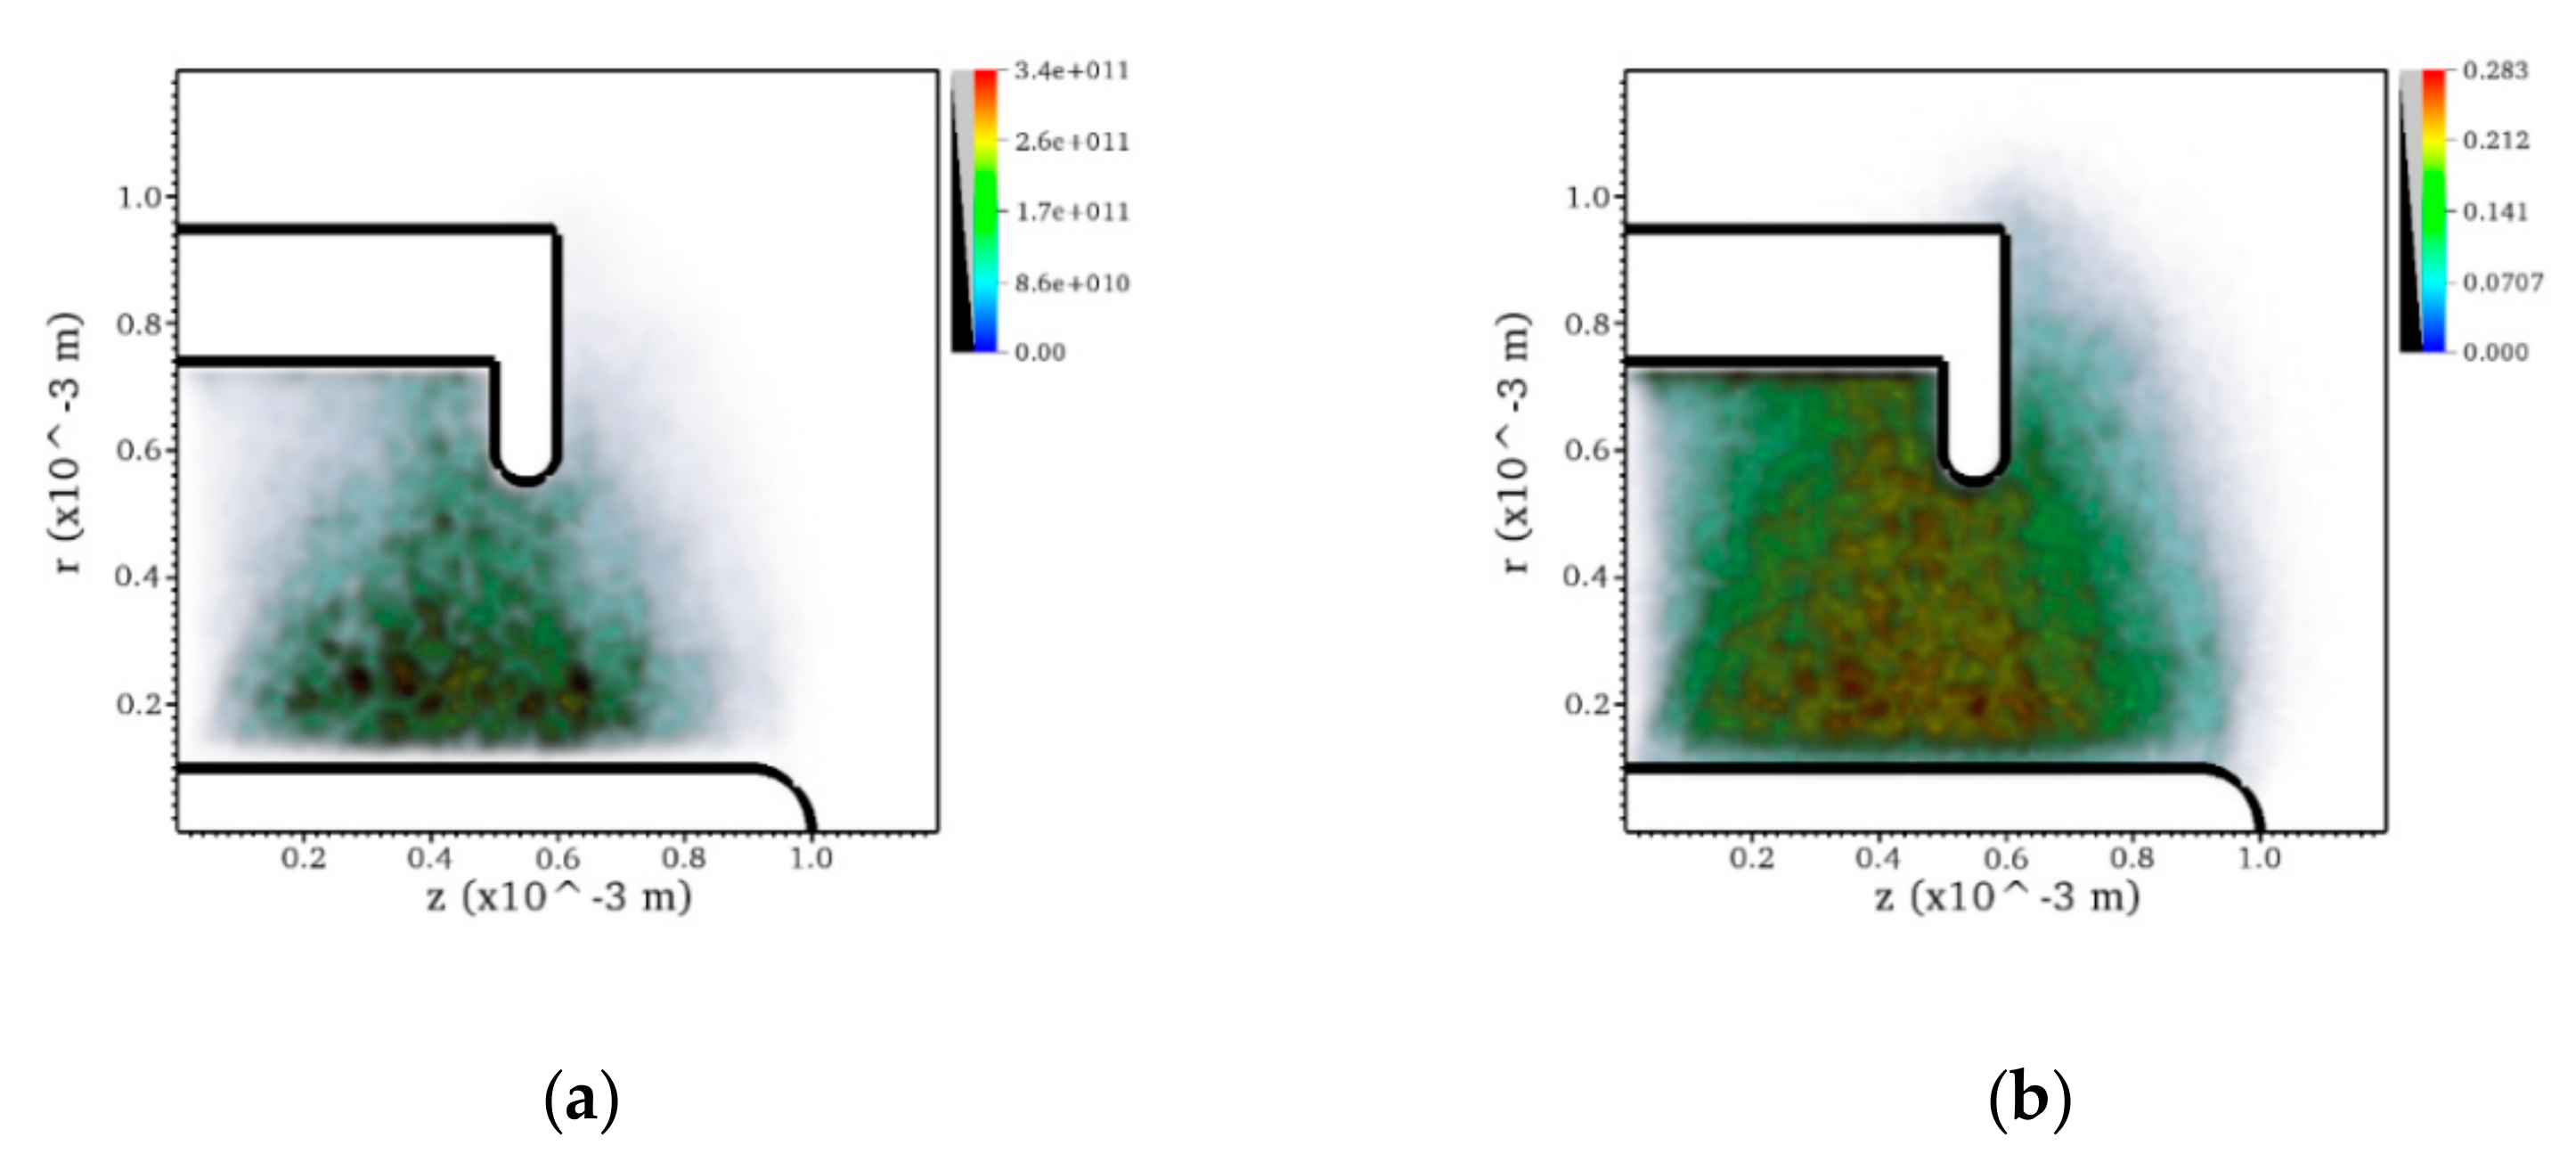
The distribution of electrons’ weight, radial velocity, number density, and ions number density are shown in Figure 3. The input parameters of the simulation are presented as the following. The simulation results are at 5 × 10⁻⁹s in a quasi-steady discharge process. Tthe voltage was set as 100 V and the discharge current as 400 A. The Ar gas mass flow rate was 4 g/s and the particle weight was 106. Most variable weight of the electrons range from 1 to 1000, which have 106 real electrons in every super-particle. From Figure 3b, the electrons’ velocities, at about 106 m/s in the cathode vicinity, are higher than other regions. It can clearly be seen from the Figure 3c,d that the number densities of charged particles in the cathode vicinity are far less than that in the bulk plasma.
Considering the distribution of the electrons’ radial velocity, we can guess that the electrons emitted from the cathode were accelerated by the strong electric field in the cathode sheath. With the increase in the velocity, the electrons’ energy gradually reached the ionization threshold of the gas. In this process, electrons transfer kinetic energy to ions. So, the velocity of electrons in the bulk plasma was less than that in the cathode sheath. The main accelerating region of the electrons was the cathode sheath. In the bulk plasma region, the electron and ion number density near the cathode sheath was the highest with an order of magnitude of 1020 m−3.
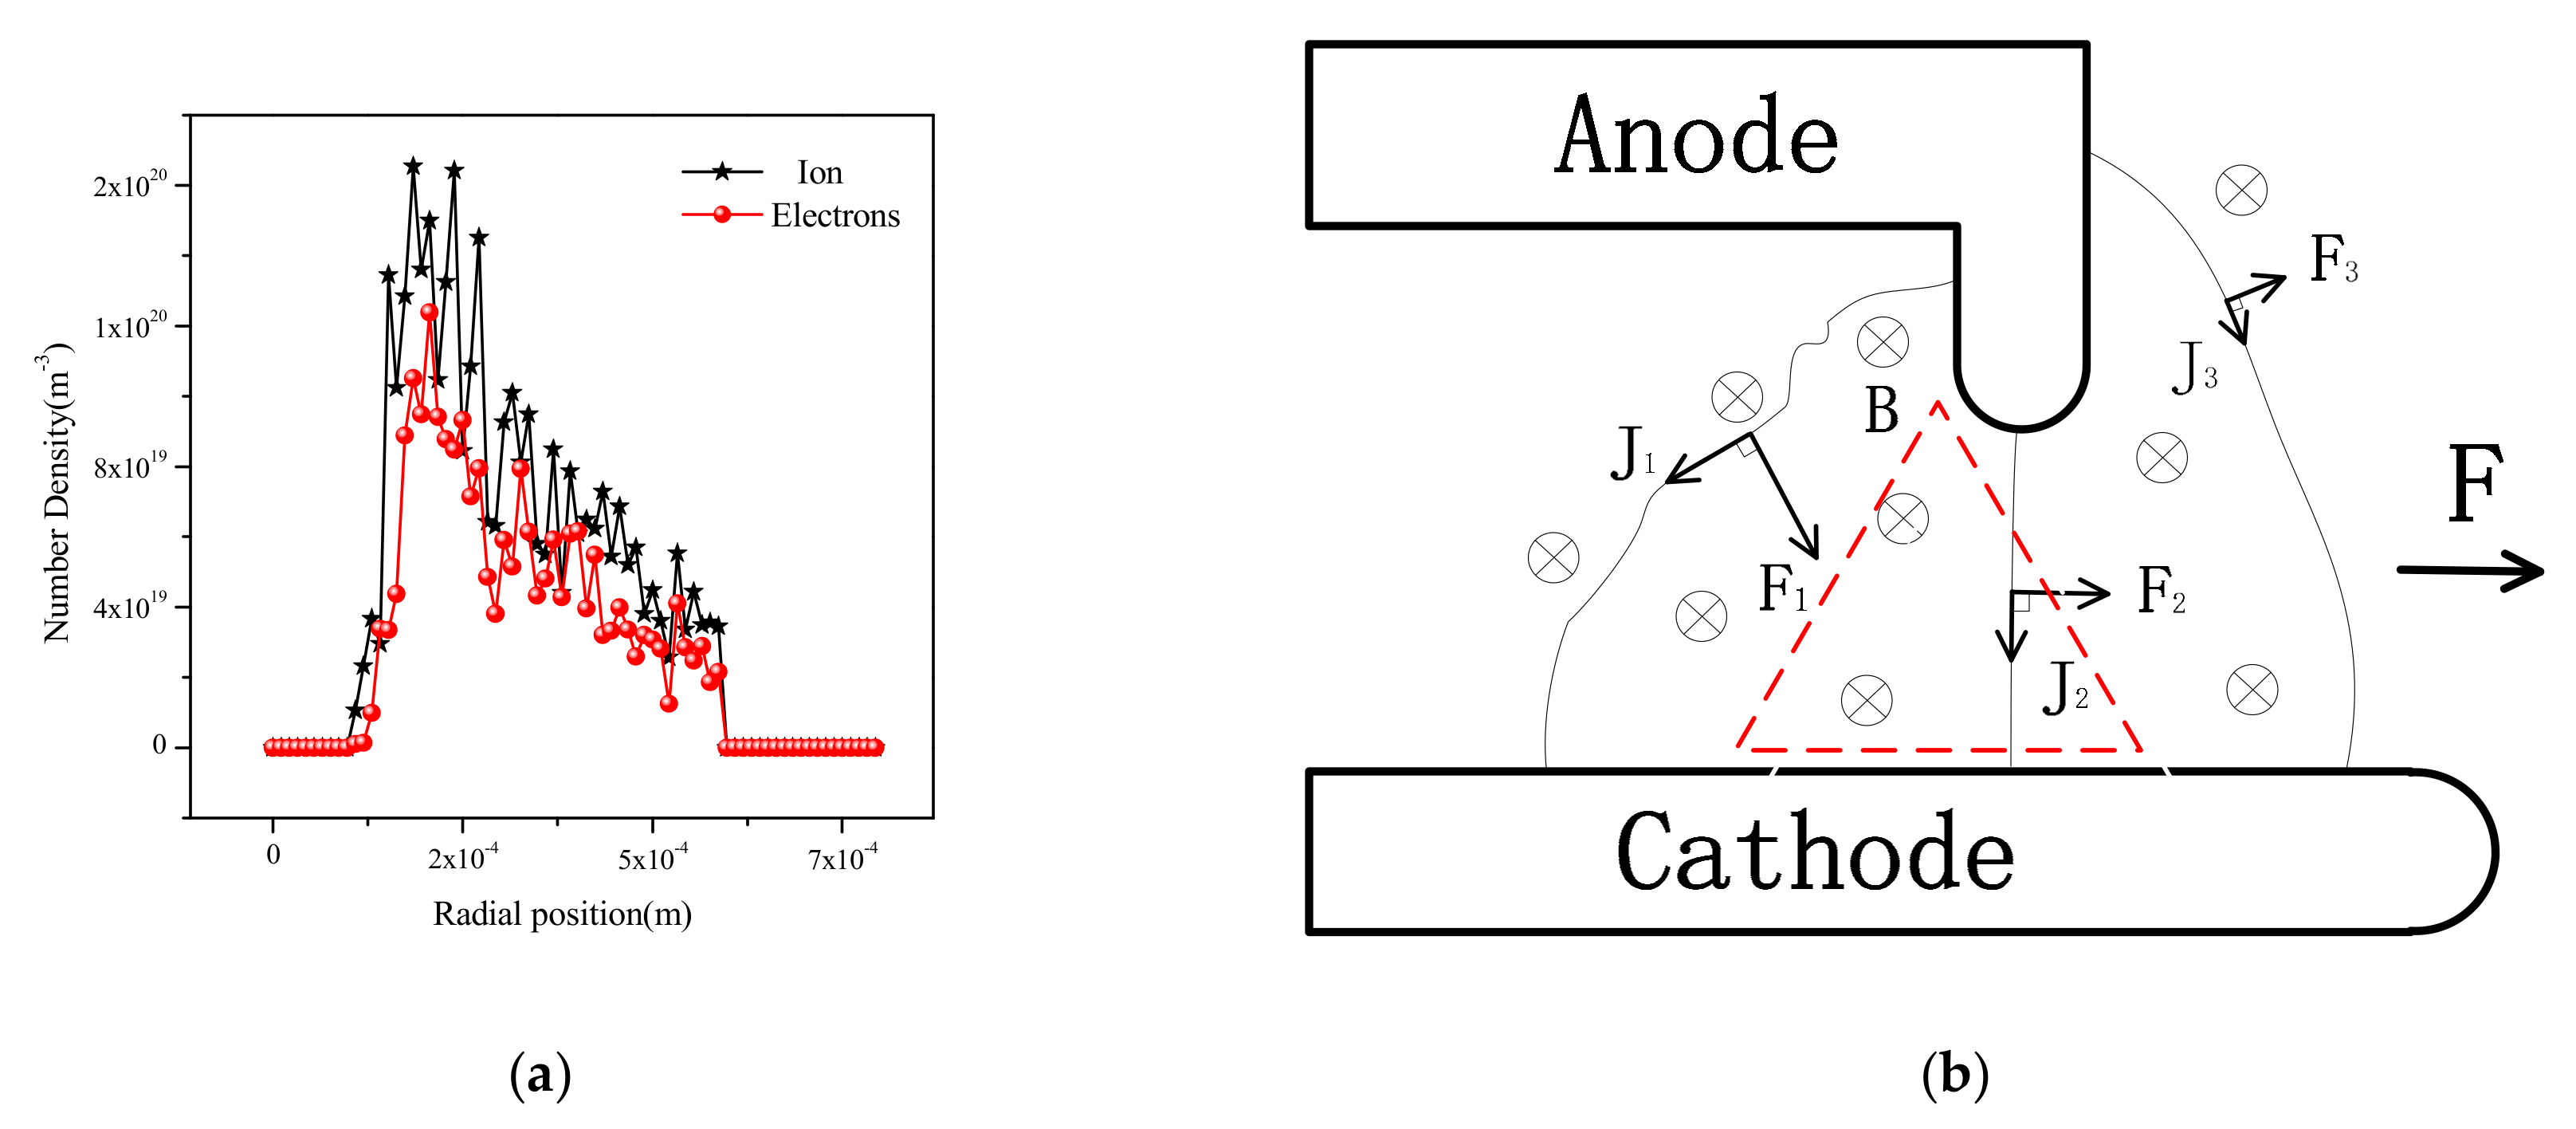
In order to visualize the particle density intuitively, the distribution curve of electrons’ and ions’ number density at the axial position of the middle anode lip, about 5.5 × 10⁻⁴ m were calculated in Figure 4a. The radial position of 0 was the axis of the axisymmetric model. The left and right ends of the curve were the cathode and anode, respectively. In the cathode sheath, the number of particles changed significantly, and the actual width of the sheath was about 5 mm. As the distance increased from the cathode surface, the number density of the charged particles gradually decreased.
As shown in Figure 4b, the Lorenz force was perpendicular to the current and the induced magnetic field, respectively. The left sectional force F1 on the current was the biggest. Because the trend of the force on the left side of the anode lip was downward, the charged particles were constrained in the red triangle region marked between anode lip and cathode. This phenomenon confirms the pinch effect of the self-field magnetic field of quasi-steady MPDT. Although the force F3 had the opposite effect of the pinch effect, it is so small compared to F1 and can be ignored. Comparing the number density between electrons and ions, the latter was higher than the former by almost all points. This is because the electrons were much faster than the ions at the whole position.
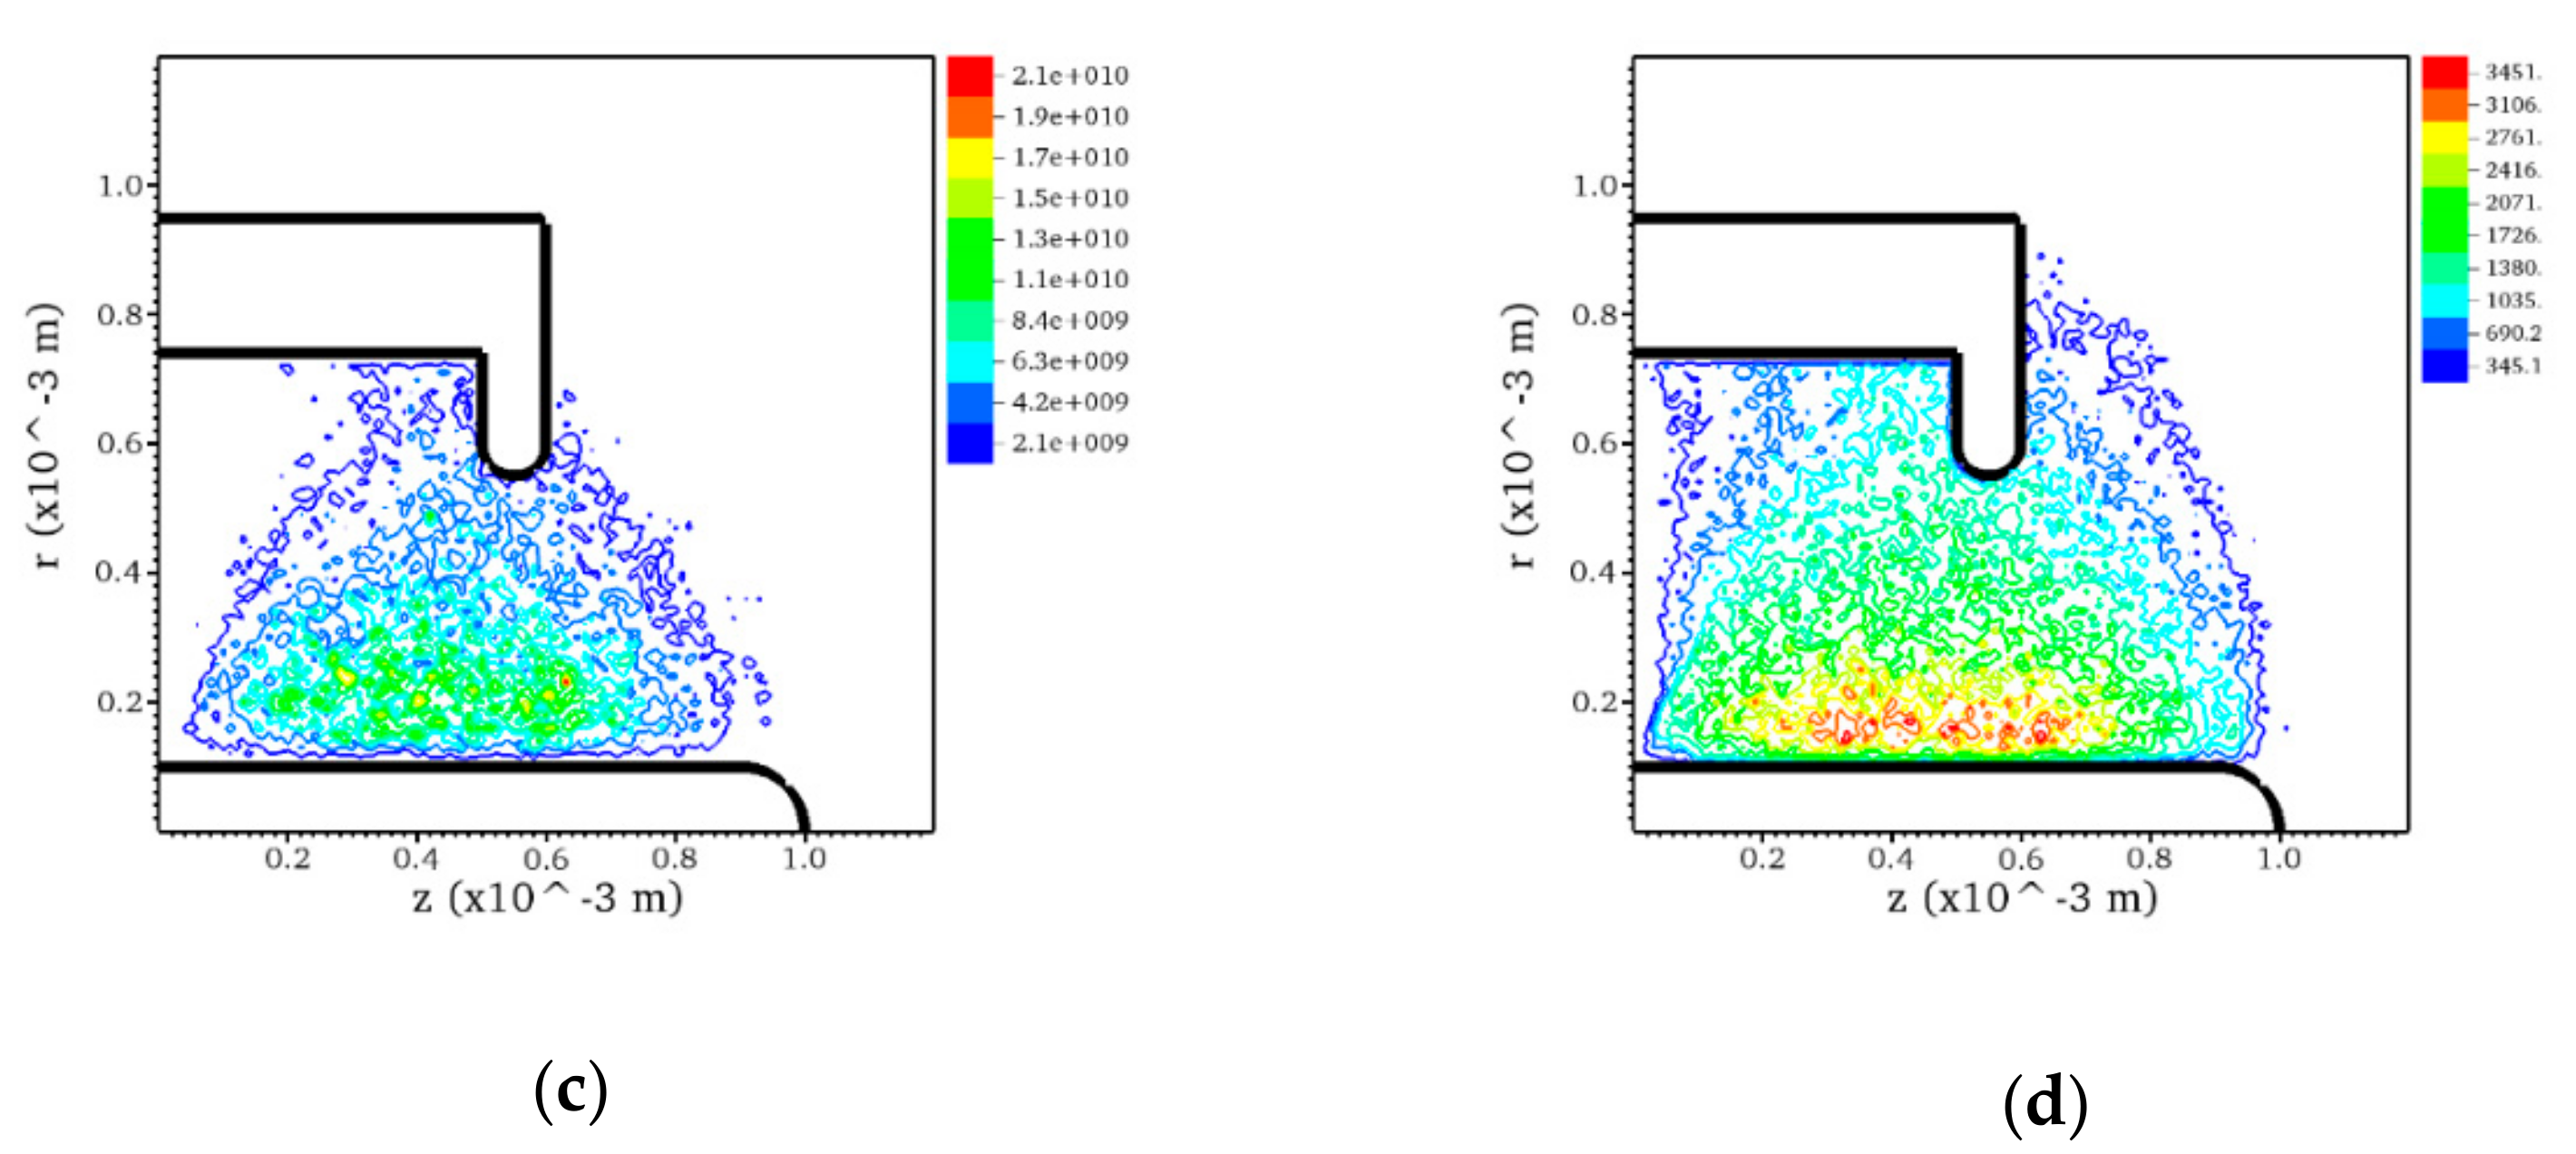
Figure 5 shows the contour plots of axial and radial current density. Among them, the axial current was mainly distributed in the bulk plasma and the left side of the anode lip, while the radial current distribution was more extensive, covering the entire surface of the anode lip. Since the radial current is the main component of the discharge current, the radial current density was greater than the axial current density. The average radial current density at the lower anode lip in Figure 5b is about 100 A/cm2, which is in good agreement with the experimental value in the literature [1]. In fact, the current density in the bulk plasma region was greater than that near both the cathode and the anode.
To explore the collision characteristics of discharge plasma, we calculated the event number and the heavy particles energy of elastic and ionization collisions in Figure 6, respectively. Comparing Figure 6a,c elastic collisions (event number about 1011 each cell) occurred one order of magnitude more frequently than ionization collisions (event number about 1010 each cell). However, the energy transferred to heavy particles through elastic collisions (about 0.1 eV) was 3~4 orders of magnitude lower than that obtained in ionization collisions. In other words, compared with ionization collision, the contribution of elastic collision to thrust can be neglected, which reflects the important role of gas ionization in the thrust generation.
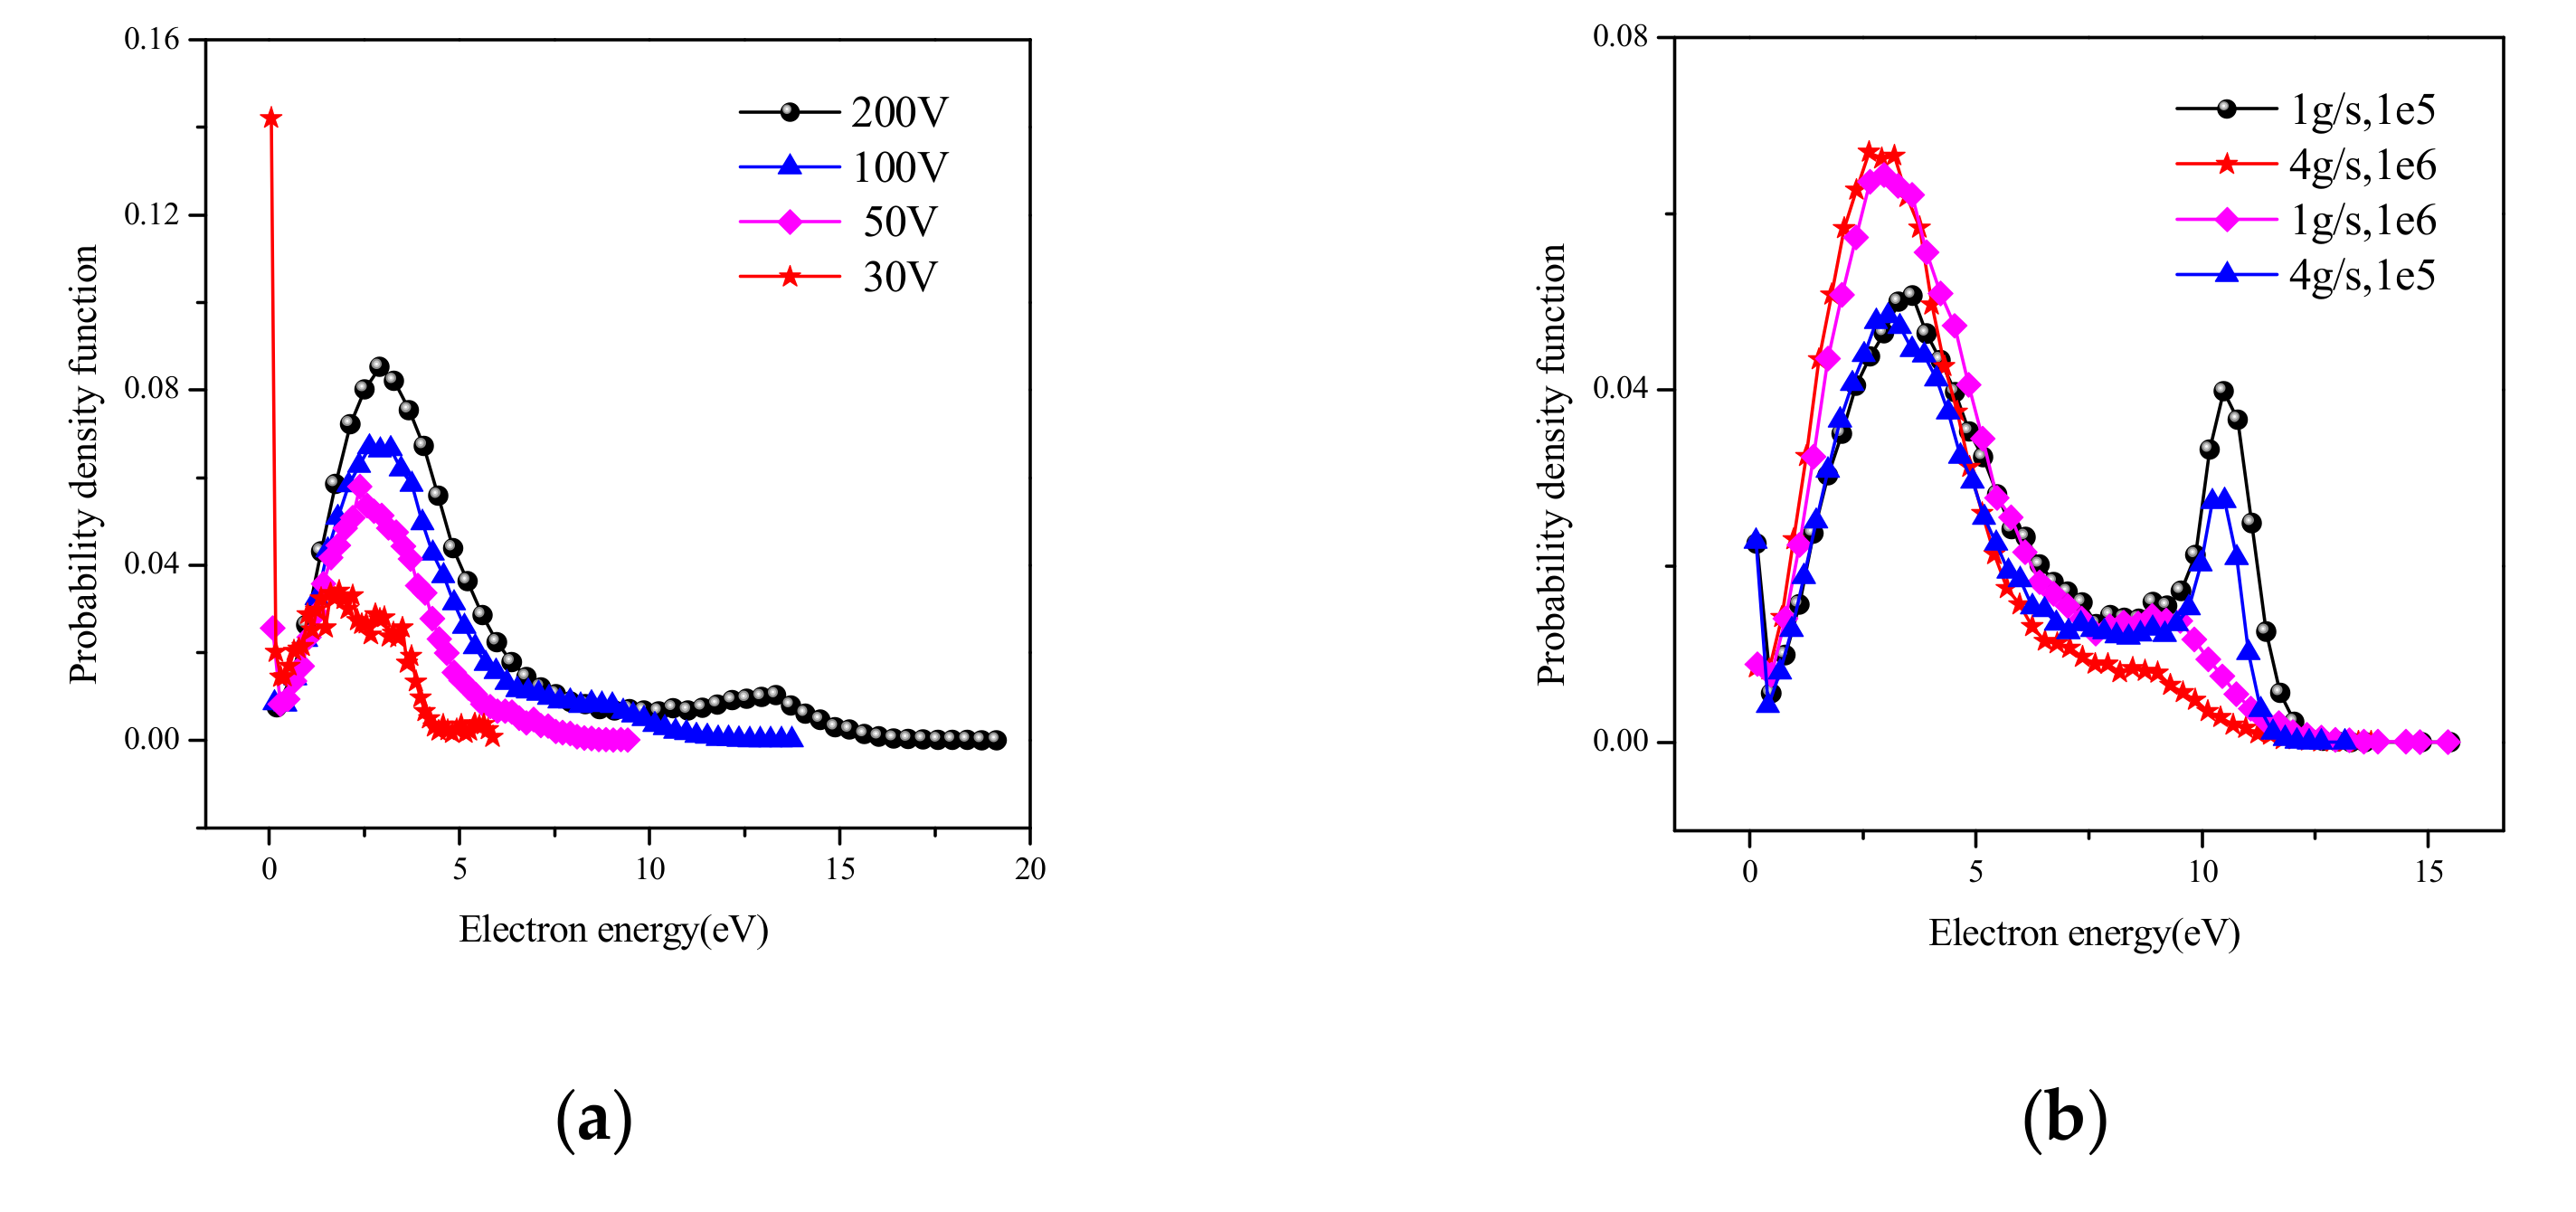
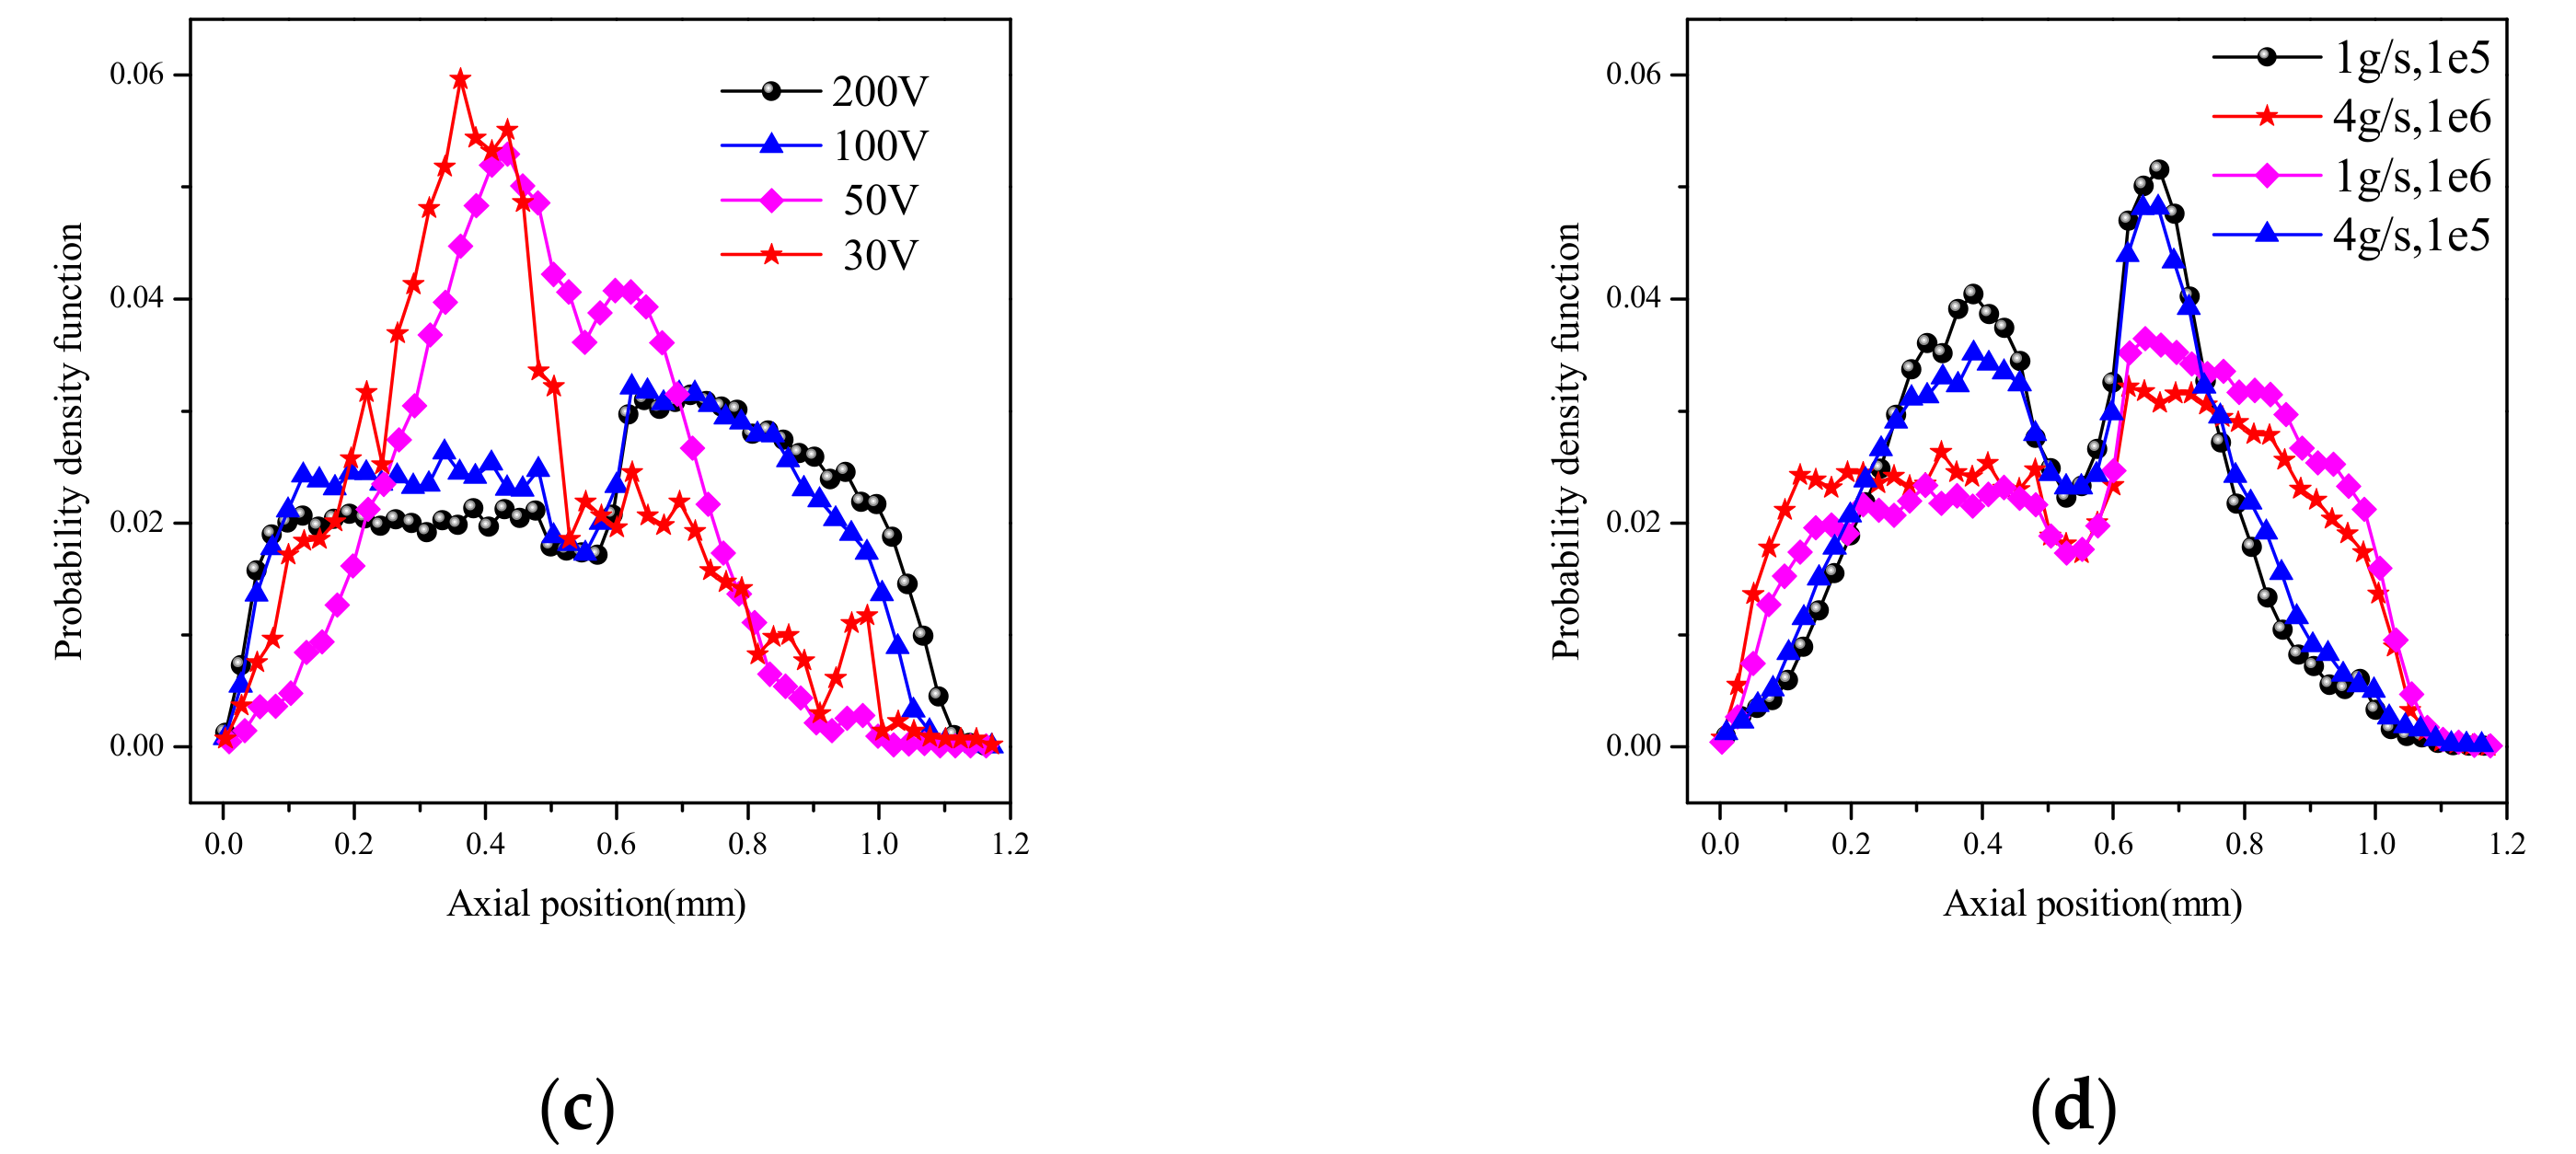
Figure 7 presents a brief description of the electron’s probability density function with velocity and axial position in different operations of the discharge. The mass flow rate of Ar gas is 4 g/s and the particle weight was 106 in Figure 7a,c. The voltage was 100 V and the discharge current was 400 A in Figure 7b,d. In Figure 7a, it was clearly that the greater the voltage, the greater the electrons’ velocity. In addition, more electrons were in a high velocity state with voltage 200 V. The probability density value with velocity below 106 m/s exceeded 15%, which means that the shielding electric field in the bulk plasma region plays a significant role. With the increase of discharge voltage, the acceleration effect of the electric field is enhanced, and the number of high velocity electrons increases. However, with the same condition, the number of high velocity electrons decreases with the increase of mass flow rate shown in Figure 7b. Therefore, it can be concluded that the higher the ionization degree of the gas, the more obvious the acceleration of electrons. Besides, the results also show that the electron weight affects the electron velocity distribution. The smaller the weight of the variable electron, the faster the particle, but the total energy of the particle is the same.
In Figure 7c, most electrons were distributed in the axial coordinate from 0.2 mm to 0.8 mm when the voltage was 30V and 50V, and it appears to be the highest in the middle, gradually decreasing to both sides. As the voltage increases, more electrons were distributed on both sides, which shows more even distribution with the voltages of 100 V and 200 V. In the same way, in Figure 7d, the electrons’ probability appears more uniform in the axial direction with electron weight at 106 rather than that at 105. In a word, with the high voltage and particle weight, the distribution of the electrons was more uniform in the axial direction.
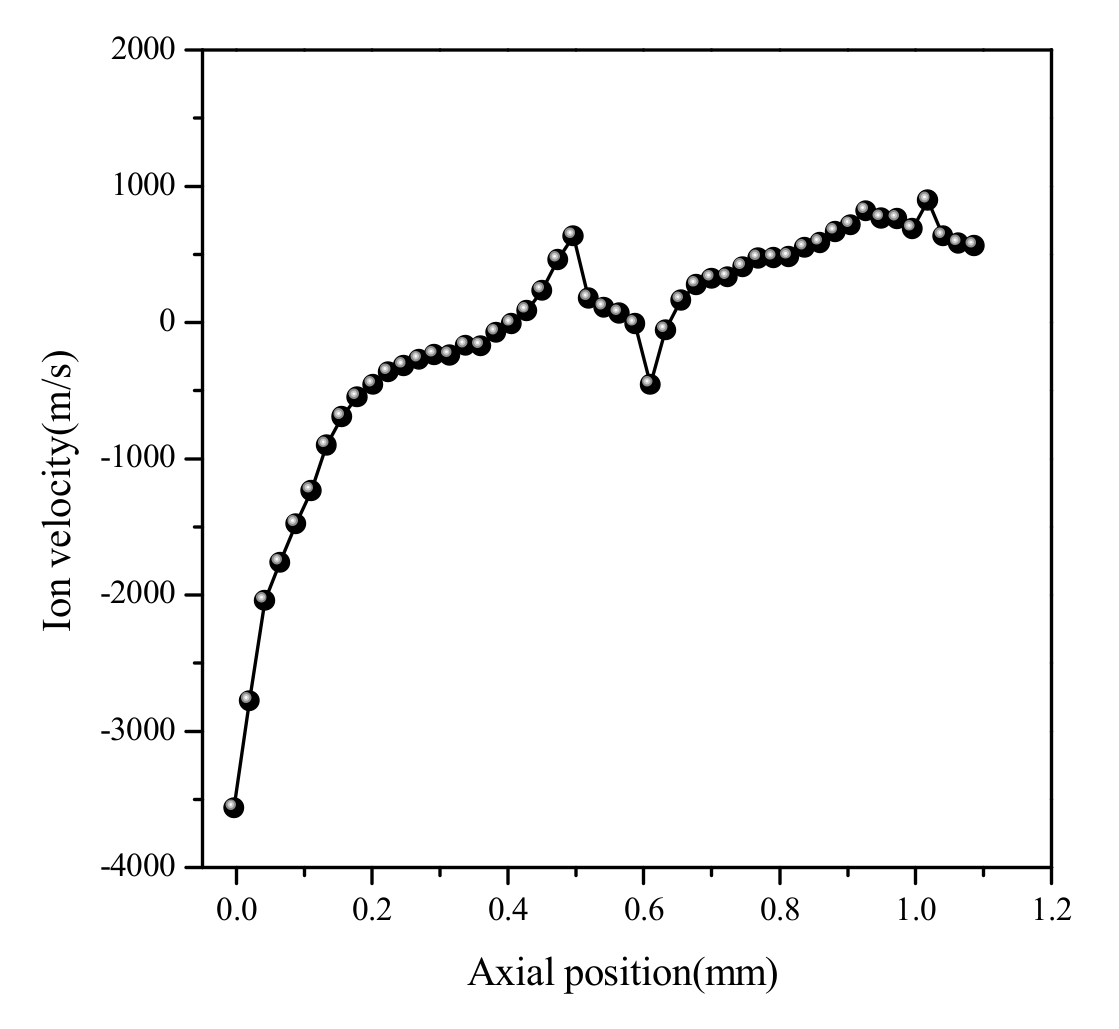
Ion velocity is an important parameter for evaluating the performance of the thruster. We calculate the ions’ axial average velocity of the self-field MPDT using the model shown in Figure 8. As we can see, the value of the velocity was negative in the left part of the discharge chamber. As the position moved to the right, the speed increased. In the plume region, the velocity was positive and continued to increase, which proves the acceleration effect of the electromagnetic field on the ions. As we can see from Figure 8, the ions showed obviously lower axial average velocity at the axial position of the anode lip, especially on the left side of the anode lip. In addition, we can also find a similar effect in Figure 2a. The direction of the force on the current was pointing to cathode at the left of anode lip. These phenomena indicate that the anode lip prevents the ions from ejecting the discharge chamber to some extent.
Figure 9 shows the contour plot of the electric field at a quasi steady-state discharge time. It can be seen that the electric field of the cathode sheath was much larger than that of other positions. The sheath extends about 5–10 mm outward from the cathode surface. Compared with the electric field of the sheath, the electric field in the bulk plasma region was almost unchanged, which reflects the shielding effect of the plasma on the electric field. It has to be mentioned that there was a strong change of the electric field within a small distance on the surface of anode lip, which was caused by the anode sheath. Although the grid near the anode was not encrypted in the simulation program, the electric field of the anode sheath could still be simulated, which proves that the model has the ability to solve the behavior of the anode sheath.
4. Conclusions
This paper presents a PIC/MCC simulation model for the discharge process of the self-field MPDT. The distribution of the magnetic field induced by the discharge current was calculated, which was in good agreement with the experimental value. The model was used to simulate the distribution characteristics of the discharge plasma. The results show that the charged particles were mainly distributed in a triangle region between the cathode and anode lip. In addition, due to the pinch effect of the self-field magnetic field, the charged particles were constrained in the cathode area by the radial Lorentz force. To explore the collision characteristic, the event number and the transfer energy of elastic and ionization collisions were analyzed. The discharge process is summarized as the following: the electrons emitted from the cathode were accelerated by the strong electric field in the cathode sheath. At the bulk plasma region, the collisions included elastic, excitation, and ionization, and they were carried out between electrons and neutral particles. Among them, elastic collision was the most frequent while ionization collisions played a major role in thrust generation. In addition, the model can simulate the electric field near the electrode not only for the cathode but also the anode. This model can be used for the structural design and parameter optimization of self-field MPDTs in future studies.
Author Contributions
Conceptualization, J.L.; Data curation, Y.C.; Formal analysis, Y.Z.; Investigation, X.D.; Supervision, J.W.; Writing—review & editing, J.L.
Funding
This work was supported by National Natural Science Foundation of China (Grant No. 11772354).
Conflicts of Interest
The authors declare no conflict of interest.
Nomenclature
| B | magnetic field, Tesla |
| Bsf | induced magnetic field, Tesla |
| Bf | known function for gas, for argon Bf = 10eV |
| c | speed of light, m/s |
| E | electric field, V/m |
| Esc | energies of the scattered particles, eV |
| Einc | energies of the incident particles, eV |
| Ese | energies of the secondary electrons, eV |
| Eex | excitation threshold of gas, eV |
| Eiz | ionization threshold of gas, eV |
| j | discharge current, A |
| J | current density, A/m2 |
| Jth | thermionic current density, A/m2 |
| n | density of particles, /m2 |
| ni | number of ions |
| ne | number of electrons |
| N | number of all particles |
| Ncoll | random colliding particles |
| P | collision probability |
| Pmax | maximum collision probability |
| R | random number between 0 and 1 |
| T | temperature of cathode surface, K |
| v | velocity of particles, m/s |
| Vsc | velocity of scattered particles, m/s |
| Vinc | velocity of incident particles, m/s |
| ρq | charge quantity, C |
| νcoll | collision frequency |
| νmax | maximum collision frequency |
| σ | collision cross section, m2 |
| χ | scattering angle |
| ωpe | plasma frequency |
| λDe | Debye length, m |
References
- Gallimor, D.; Kelly, A.J.; Jahn, R.G. Anode Power Deposition in Quasisteady magnetoplasmadynamic thrusters. J. Propuls. Power. 1992, 8, 1224–1231. [Google Scholar] [CrossRef]
- Gallimore, A.D.; Kelly, A.J.; Jahn, R.G. Anode power deposition in MPD thrusters. J. Propuls. Power. 1993, 9, 361–368. [Google Scholar]
- Myers, R.M.; Kelly, A.J.; Jahn, R.G. Energy deposition in low-power coaxial plasma thrusters. J. Propuls. Power. 1990, 7, 732–739. [Google Scholar]
- Itsuro, K.; Kyoichiro, T.; Masafumi, T. Current Distribution on the Electrodes of MPD Arcjets. AIAA J. 1982, 20, 889–892. [Google Scholar]
- Michael, R.L. Numerical Simulation of Self-Field MPD Thrusters. NASA Contractor Rep. 1991, AIAA-91-2341. [Google Scholar]
- Edgar, C. Scaling of Thrust in Self-Field Magnetoplasmadynamic Thrusters. J. Propul. Power 1998, 14, 744–753. [Google Scholar]
- Sankaran, K.; Choueiri, E.Y.; Jardin, S.C. Comparison of Simulated Magnetoplasmadynamic Thruster Flowfields to Experimental Measurements. J. Propul. Power. 2005, 21, 129–138. [Google Scholar] [CrossRef]
- Jorg, H.; Monika, A.K. Numerical and Experimental Investigation of the Current Distribution in Self-Field Magnetoplasmadynamic Thrusters. J. Propul. Power. 2005, 21, 119–128. [Google Scholar]
- Kubota, K.; Funaki, I.; Okuno, Y. Numerical Investigation of Ionization and Acceleration Processed in a Self-Field MPD Thruster. In The 29th International Electric Propulsion Conference; Princeton University: Princeton, NJ, USA, 2005; 089. [Google Scholar]
- Xisto, C.M.; Páscoa, J.C.; Oliveira, P.J. A pressure-based high resolution numerical method for resistive MHD. J. Comput. Phys. 2014, 275, 323–345. [Google Scholar]
- Xisto, C.M.; Páscoa, J.C.; Oliveira, P.J. Numerical analysis of real gas MHD flow on two-dimensional self-field MPD thrusters. Acta Astronaut. 2015, 112, 89–101. [Google Scholar] [CrossRef]
- Szabo, J.J. Fully kinetic numerical modeling of a plasma thruster. Ph.D. Thesis, Massachusetts Institute of Technology, Boston, MA, USA, 2001. [Google Scholar]
- Taccogna, F.; Longo, S.; Capitelli, M. Self-similarity in Hall plasma discharges: Applications to particle models. Phys. Plasmas 2005, 12, 1–9. [Google Scholar] [CrossRef]
- Tang, H.B.; Cheng, J.; Liu, C.; York, T.M. Study of Applied Magnetic Field Magnetoplasmadynamic Thrusters with Particle-in-cell and Monte Carlo Collision. II. Investigation of Acceleration Mechanisms. Phys. Plasmas 2012, 19, 1–11. [Google Scholar] [CrossRef]
- Li, M.; Tang, H.-B.; Ren, J.-X.; York, T.M. Modeling of Plasma Processes in the Slowly Diverging magnetic Fields at the Exit of an Applied-field Magnetoplasmadynamic Thruster. Phys. Plasmas. 2013, 20. [Google Scholar] [CrossRef]
- Cheng, J.; Tang, H.B.; York, T.M. Energy conversion and transfer for plasmas in a magnetic expansion configuration. Phys. Plasmas. 2014, 21, 1–13. [Google Scholar] [CrossRef]
- Birdsall, C.K.; Langdon, A.B. Plasma Physics via Computer Simulation; Adam Hilger: Bristol, UK, 1991. [Google Scholar]
- Vahedi, V.; Surendra, M. A Monte Carlo collision model for the particle-in-cell method: Applications to argon and oxygen discharges. Comput. Phys. Commun. 1995, 87, 179–198. [Google Scholar] [CrossRef]
- Tskhakaya, D.; Matyash, K.; Schneider, R.; Taccogna, F. The Particle-In-Cell Method. Contrib. Plasma Phys. 2007, 47, 563–594. [Google Scholar] [CrossRef]
- Hong-Yu, W.; Wei, J.; Peng, S.; Ling-Bao, K. On the energy conservation electrostatic particle-in-cell Monte Carlo simulation Benchmark and application to the radio frequency discharges. Chin. Phys. B. 2014, 23, 1–9. [Google Scholar]
- Birdsall, C.K. Particle-in-cell Charged-Particle Simulations, plus Monte Carlo Collisions with Neutral Atoms, PIC-MCC. IEEE Trans. Plamsa Sci. 1991, 19, 65–85. [Google Scholar] [CrossRef]
- Verboncoeur, J.P. Particle simulation of plasmas: Review and advances. Plasma Phys. Control. Fusion 2005, 47, A231–A260. [Google Scholar] [CrossRef]
- Kaminsky, M. Atomic and Ionic Impact Phenomena on Metal Surfaces; American Elsevier: New York, NY, USA, 1968. [Google Scholar]
- Myers, R.M.; Suzuki, N.; Kelly, A.J.; Jahn, R.G. Cathode phenomena in a low-power magnetoplasmadynamic thruster. J. Propuls. Power. 1991, 7, 760–766. [Google Scholar] [CrossRef]
- Reece Roth, J. Industrial Plasma Engineering, Volume 1: Principles; IOP Publishing: London, UK, 1994. [Google Scholar]
- Puech, V.; Torchin, L. Collision cross sections and electron swarm parameters in argon. J. Phys. D Appl. Phys. 1986, 19, 2309–2323. [Google Scholar] [CrossRef]
- Yanguas-Gil, A.; Cotrino, J.; Alves, L.L. An update of argon inelastic cross sections for plasma discharges. J. Phys. D Appl. Phys. 2005, 38, 1588–1598. [Google Scholar] [CrossRef]
- Phelps, V. The application of scattering cross sections to ion flux models in discharge sheaths. J. Appl. Phys. 1994, 76, 747–753. [Google Scholar] [CrossRef]
Figure 1.
Schematic of self-field magnetoplasmadynamic thruster (MPDT).

Figure 2.
Induced magnetic field (Tesla) contour: (a) calculated and (b) measured (400A, 100V, 4 g/s).
Figure 2.
Induced magnetic field (Tesla) contour: (a) calculated and (b) measured (400A, 100V, 4 g/s).

Figure 3.
Distribution of (a) electrons’ weight; (b) electrons’ radial velocity (m/s), (c) electrons’ number density (/m3), AND (d) ions’ number density (/m3), (400 A, 100 V, 4 g/s, the particle weight was 106, 5 × 10⁻⁹s).
Figure 3.
Distribution of (a) electrons’ weight; (b) electrons’ radial velocity (m/s), (c) electrons’ number density (/m3), AND (d) ions’ number density (/m3), (400 A, 100 V, 4 g/s, the particle weight was 106, 5 × 10⁻⁹s).

Figure 4.
Distribution curve of the charged particle number density interelectrode (a) and the relationships among current, magnetic field, and thrust (b), (400 A, 100 V, 4 g/s).
Figure 4.
Distribution curve of the charged particle number density interelectrode (a) and the relationships among current, magnetic field, and thrust (b), (400 A, 100 V, 4 g/s).

Figure 5.
Contour plots of axial (a) and radial (b) current density (A/m2), (400 A, 100 V, 4 g/s, 5 × 10⁻⁹s).
Figure 5.
Contour plots of axial (a) and radial (b) current density (A/m2), (400 A, 100 V, 4 g/s, 5 × 10⁻⁹s).

Figure 6.
Distribution of event number (a) and neutral particles energy (eV) (b) in elastic collision. Distribution of event number (c) and ions particles energy (eV) (d) in ionization collision, (400 A, 100 V, 4 g/s).
Figure 6.
Distribution of event number (a) and neutral particles energy (eV) (b) in elastic collision. Distribution of event number (c) and ions particles energy (eV) (d) in ionization collision, (400 A, 100 V, 4 g/s).


Figure 7.
Probability density function with electron energy in (a) different discharge voltages at 4 g/s, 106 and (b) different mass flow rates or particle weights at 100 V, with axial position in (c) different discharge voltages at 4 g/s, 106 and (d) different mass flow rates or particle weights at 100 V.


Figure 8.
The axial average velocity of ions versus axial position (400 A, 100 V, 4 g/s).

Figure 9.
Contour plot of the electric field (V/m) (400 A, 100 V, 4 g/s).


Table 1.
Summary of the parameter expressions for new particles.
| Particle | Collision Type | ||
|---|---|---|---|
| Electron - Neutral | Elastic | ||
| Excitation | |||
| Ionization | |||
| Ion - Neutral | Momentum exchange | ||
| Charge exchange | |||
Table 2.
Processes of interaction between charged particles and neutral atoms.
| Number | Collision Type | Expressions of Interaction |
|---|---|---|
| 1 | Elastic | |
| 2 | Excitation | |
| 3 | Ionization | |
| 4 | Momentum exchange | |
| 5 | Charge exchange |
Table 3.
The scaling schemes of different parameters.
| Type | Physical Quantities | Original | Scaled |
|---|---|---|---|
| PIC | Length/electrodes radius | L,R | |
| Electric field | E | E | |
| Magnetic field | B | ||
| Velocity | v | ||
| Gyro-radius | r | ||
| MCC | Collision probability | P | P |
| Particle density | n | ||
| Cross-section | |||
| Energy threshold | |||
| Derivations | Mass flow rate | ||
| Current | I | ||
| Electric potential | V | ||
| Thrust | F | ||
| Specific impulse | |||
| Efficiency |
© 2019 by the authors. Licensee MDPI, Basel, Switzerland. This article is an open access article distributed under the terms and conditions of the Creative Commons Attribution (CC BY) license (http://creativecommons.org/licenses/by/4.0/).
Share and Cite
MDPI and ACS Style
Li, J.; Zhang, Y.; Wu, J.; Cheng, Y.; Du, X. Particle Simulation Model for Self-Field Magnetoplasmadynamic Thruster. Energies 2019, 12, 1579. https://0-doi-org.brum.beds.ac.uk/10.3390/en12081579
AMA Style
Li J, Zhang Y, Wu J, Cheng Y, Du X. Particle Simulation Model for Self-Field Magnetoplasmadynamic Thruster. Energies. 2019; 12(8):1579. https://0-doi-org.brum.beds.ac.uk/10.3390/en12081579
Chicago/Turabian StyleLi, Jian, Yu Zhang, Jianjun Wu, Yuqiang Cheng, and Xinru Du. 2019. "Particle Simulation Model for Self-Field Magnetoplasmadynamic Thruster" Energies 12, no. 8: 1579. https://0-doi-org.brum.beds.ac.uk/10.3390/en12081579
Note that from the first issue of 2016, this journal uses article numbers instead of page numbers. See further details here.