Development of a Predictive Model for a Photovoltaic Module’s Surface Temperature


1
Department of Building and Plant Engineering, Hanbat National University, Daejeon 34158, Korea
2
Department of Architectural Engineering, Ulsan University, Ulsan 44610, Korea
*
Author to whom correspondence should be addressed.
Energies 2020, 13(15), 4005; https://0-doi-org.brum.beds.ac.uk/10.3390/en13154005
Submission received: 10 July 2020
/
Revised: 30 July 2020
/
Accepted: 2 August 2020
/
Published: 3 August 2020
(This article belongs to the Special Issue Designing, Modeling and Optimizing Energy and Environmental Systems for Buildings)
Abstract
:PV (photovoltaic) systems are receiving the spotlight in Korea due to the Renewable Energy 3020 Implementation Plan (RE3020), which has the goal of reaching 20% for the proportion of renewable energy generation by 2030. Accordingly, the actual performance evaluation of PV systems to achieve the RE3020 has become more important. PV efficiency is mainly determined by various weather conditions (e.g., solar radiation) that affect the power generation of PV systems. However, the efficiency is also affected by changes in module surface temperature. In particular, the efficiency decreases when the module surface temperature rises. That is, the actual PV efficiency falls short of the rated efficiency. The estimation of module surface temperature is critical for evaluating the actual performance of PV systems. Many studies have been conducted to calculate the surface temperature. However, most of the previous studies focused on calculations of current surface temperatures using current environment data, which means that the previous studies have limitations related to timestep. That is, there is a lack of predictive models that calculate the future surface temperatures by using the current measured data. Therefore, this study developed a predictive model using an ANN (artificial neural network) algorithm to determine the surface temperature of PV modules for a future period of time. Then, this study evaluated the actual performance (i.e., power generation) with the predicted surface temperatures.
1. Introduction
Korea began implementing energy conservation design standards for buildings in 2008 to promote efficient energy management for buildings [1]. The standards were revised in 2018, and Korea was divided into four regions (Central 1, Central 2, Southern, and Jeju Island). The heat transmission coefficient standards for each region were also strengthened in the same year. Accordingly, various standards and laws are being implemented for efficient building energy management. Despite these efforts, the electricity supply and demand trend surpassed 90 million GW in Korea for the first time in 2018 [2]. As a result, renewable energy sources are receiving the spotlight for energy conservation and stable power supply in buildings.
Renewable energy sources include solar, wind, and geothermal power. Among these sources, PV (photovoltaic) systems are widely used because they are easy to use and install, unlike wind and geothermal power. In 2017, the Ministry of Trade, Industry, and Energy reported that PV systems will account for more than 57% of the total renewable energy in Korea by 2030 [3]. Accordingly, PV systems that provide small-footprint installation and distributed power generation are attracting attention in the building sector. Analyzing the amount of power generated by PV systems is also essential to stabilizing smart grids and power systems.
However, PV systems are exposed to and influenced by of the external environment because they are primarily installed outside to collect solar energy. Therefore, changes in module surface temperature affect power generation efficiency. In particular, the power generation efficiency decreases when the module temperature increases [4,5,6,7]. This can lead to inaccurate power generation calculations and system capacity estimations. Eventually, when the power produced by the PV system and the actual energy consumed in the building become unbalanced, a significant load is applied to the power system and results in blackouts. Therefore, analyzing the module surface temperature is essential before evaluating the performance and calculating the power produced by PV systems. Therefore, this study developed and validated a predictive model for the analysis of module surface temperature. The purpose of this study was to analyze the module surface temperature, efficiency, and power generation using this model.
2. Previous Models for the Prediction of PV Module Surface Temperatures
A module’s surface temperature changes according to the influence of various external environmental factors [8,9,10,11,12,13]. Recently, various tests and simulation studies have been conducted to analyze module surface temperature. This study performed a literature review, and Table 1 below summarizes the studies on the prediction and analysis of module surface temperature.
Davis et al. (2001) [14] used the NOCT (nominal operating cell temperature) model to predict a PV panel’s temperature, but the actual temperature was 20 K higher than the prediction made by the model. To improve this, four 1D steady-state heat-transfer models were derived, and the operating cell temperature was calculated. As a result, Model 4 (which reflected the measured horizontal solar radiation) was most accurate in predicting the actual panel temperature and power.
Tamizhmani et al. (2003) [9] predicted module surface temperatures to predict the power generated by PV modules. This study evaluated the accuracy of the module surface temperature according to the combination of five variables (ambient temperature, solar radiation, wind speed, wind direction, and relative humidity). The module surface temperature algorithm produced the most accurate results when considering the ambient temperature, solar radiation, and wind speed (R2 = 0.943).
Garcia and Balenzategui (2004) [15] conducted the application of the International Standards (EN 61215 and EN-61646) to determine the NOCT of a PV device. As a result of the study, it was observed that the inaccuracies of the NOCT value were about ±3 °C. However, they claimed that the inaccuracy did not lead to excessive errors (about ±1.5%) on annual performance estimation.
Mattei et al. (2006) [16] developed a simple model using the energy balance to calculate the PV output power. The simple model included several equations to determine the cell temperature. The authors considered the wind effect on the cell temperature, and they calculated the optimal value of () from experimental data for all wind speeds. They found the optimal value of () was 0.81. With the optimal value, the resultant RMSE of the cell temperature was 2.24 °C. The resultant error was not very low, but it appeared that they were satisfied with the error level that resulted from the simplified model.
Kurtz et al. (2011) [17] analyzed PV module surface temperatures in extreme environments. The module surface temperature algorithm in this study was derived from algorithms proposed in previous studies and used ambient temperature, solar radiation, and wind speed as variables. The PV module surface temperature rose to 75 °C~96 °C in extreme environments.
Brano et al. (2014) [18] predicted module temperatures through an ANN (artificial neural network). This study used power, solar radiation, weighting factor, outdoor air temperature, short circuit current, and open circuit voltage as input data. The measured data of two PV modules (Kyocera, Sanyo) were obtained for the analysis. The developed model showed excellent predictive performance with MAE (mean absolute error) of ±0.23 °C and ±0.11 °C compared to the two modules.
Ceylan et al. (2014) [19] predicted module temperatures using an artificial neural network. System outlet air temperature and solar radiation were used as the input data. As a result, R2 of the ANN prediction model was 0.99, and the module efficiency decreased as the solar radiation increased. The power generated by the applied model was the highest between March and July.
Olukan and Emziane (2014) [20] developed a 3D thermal model to predict PV module temperatures under the environmental conditions in the UAE. This study used the finite element method (FEM) as the prediction method and solar radiation, ambient temperature, wind speed, and heat loss coefficient as the input data. The developed model had the lowest RMSE (root mean squared error) and MBE (mean bias error) compared to the Ross model, PVSYST model, and Homer model.
Ayvazogluyuksel and Filik (2017) [21] forecasted PV power outputs using several different models to calculate a cell’s temperature. For the calculation, they referenced six cell temperature models: Standard, Koehl, Mattei, Skoplaki, Muzathik, and Kurtz. As a result, the accuracy of the Skoplaki model with global solar radiation, ambient temperature, and panel specifications was the highest (2.23 °C of RMSE, 1.09 °C of MBE, and 1.82 °C of MABE (mean absolute bias error)). They concluded that the Skoplaki model provided the closest results to the measured module temperature.
Kamuyu et al. (2018) [22] conducted a study on the module temperature prediction model of floating PV systems. This study used MATLAB to derive an equation to calculate the module temperature based on solar radiation, ambient temperature, wind speed, and water temperature as the input data. As a result, the underwater temperature cooled the module temperature and the floating PV system produced 10% more power than the PV system installed on the surface.
Chayapathy et al. (2019) [23] predicted module temperatures using an artificial neural network. Solar radiation, ambient temperature, wind speed, and module temperature were used as input data. The ANN-based predictive model was developed by using Simulink, and the MAE was 0.9965 °C. As a result, the PV performance decreased as the module temperature increased.
Hegazy et al. (2019) [24] predicted module surface temperatures using an NN (neural network). The predictive model used solar radiation and ambient temperature as input data. The predictive model’s accuracy was about 96% compared to the measured data.
Per the above, various studies associated with the surface temperature of PV modules were reviewed, and the results of the literature review are summarized in Table 1. The ability to forecast power generation is essential for the stabilization of power systems, and module surface temperatures must be considered to estimate power generation more accurately. Several studies have developed algorithms to predict module surface temperatures using measured data. However, most of the prediction methods proposed in previous studies have limitations related to timestep. That is, the proposed algorithms calculated the current PV module surface temperature using current data. However, predictive analyses should be able to predict the future using current and past data. Therefore, this study developed a model that can predict future PV module surface temperatures from current data using measured data. The developed predictive model was also used to examine the efficiency and power generation according to changes in module surface temperature.
3. Methodology
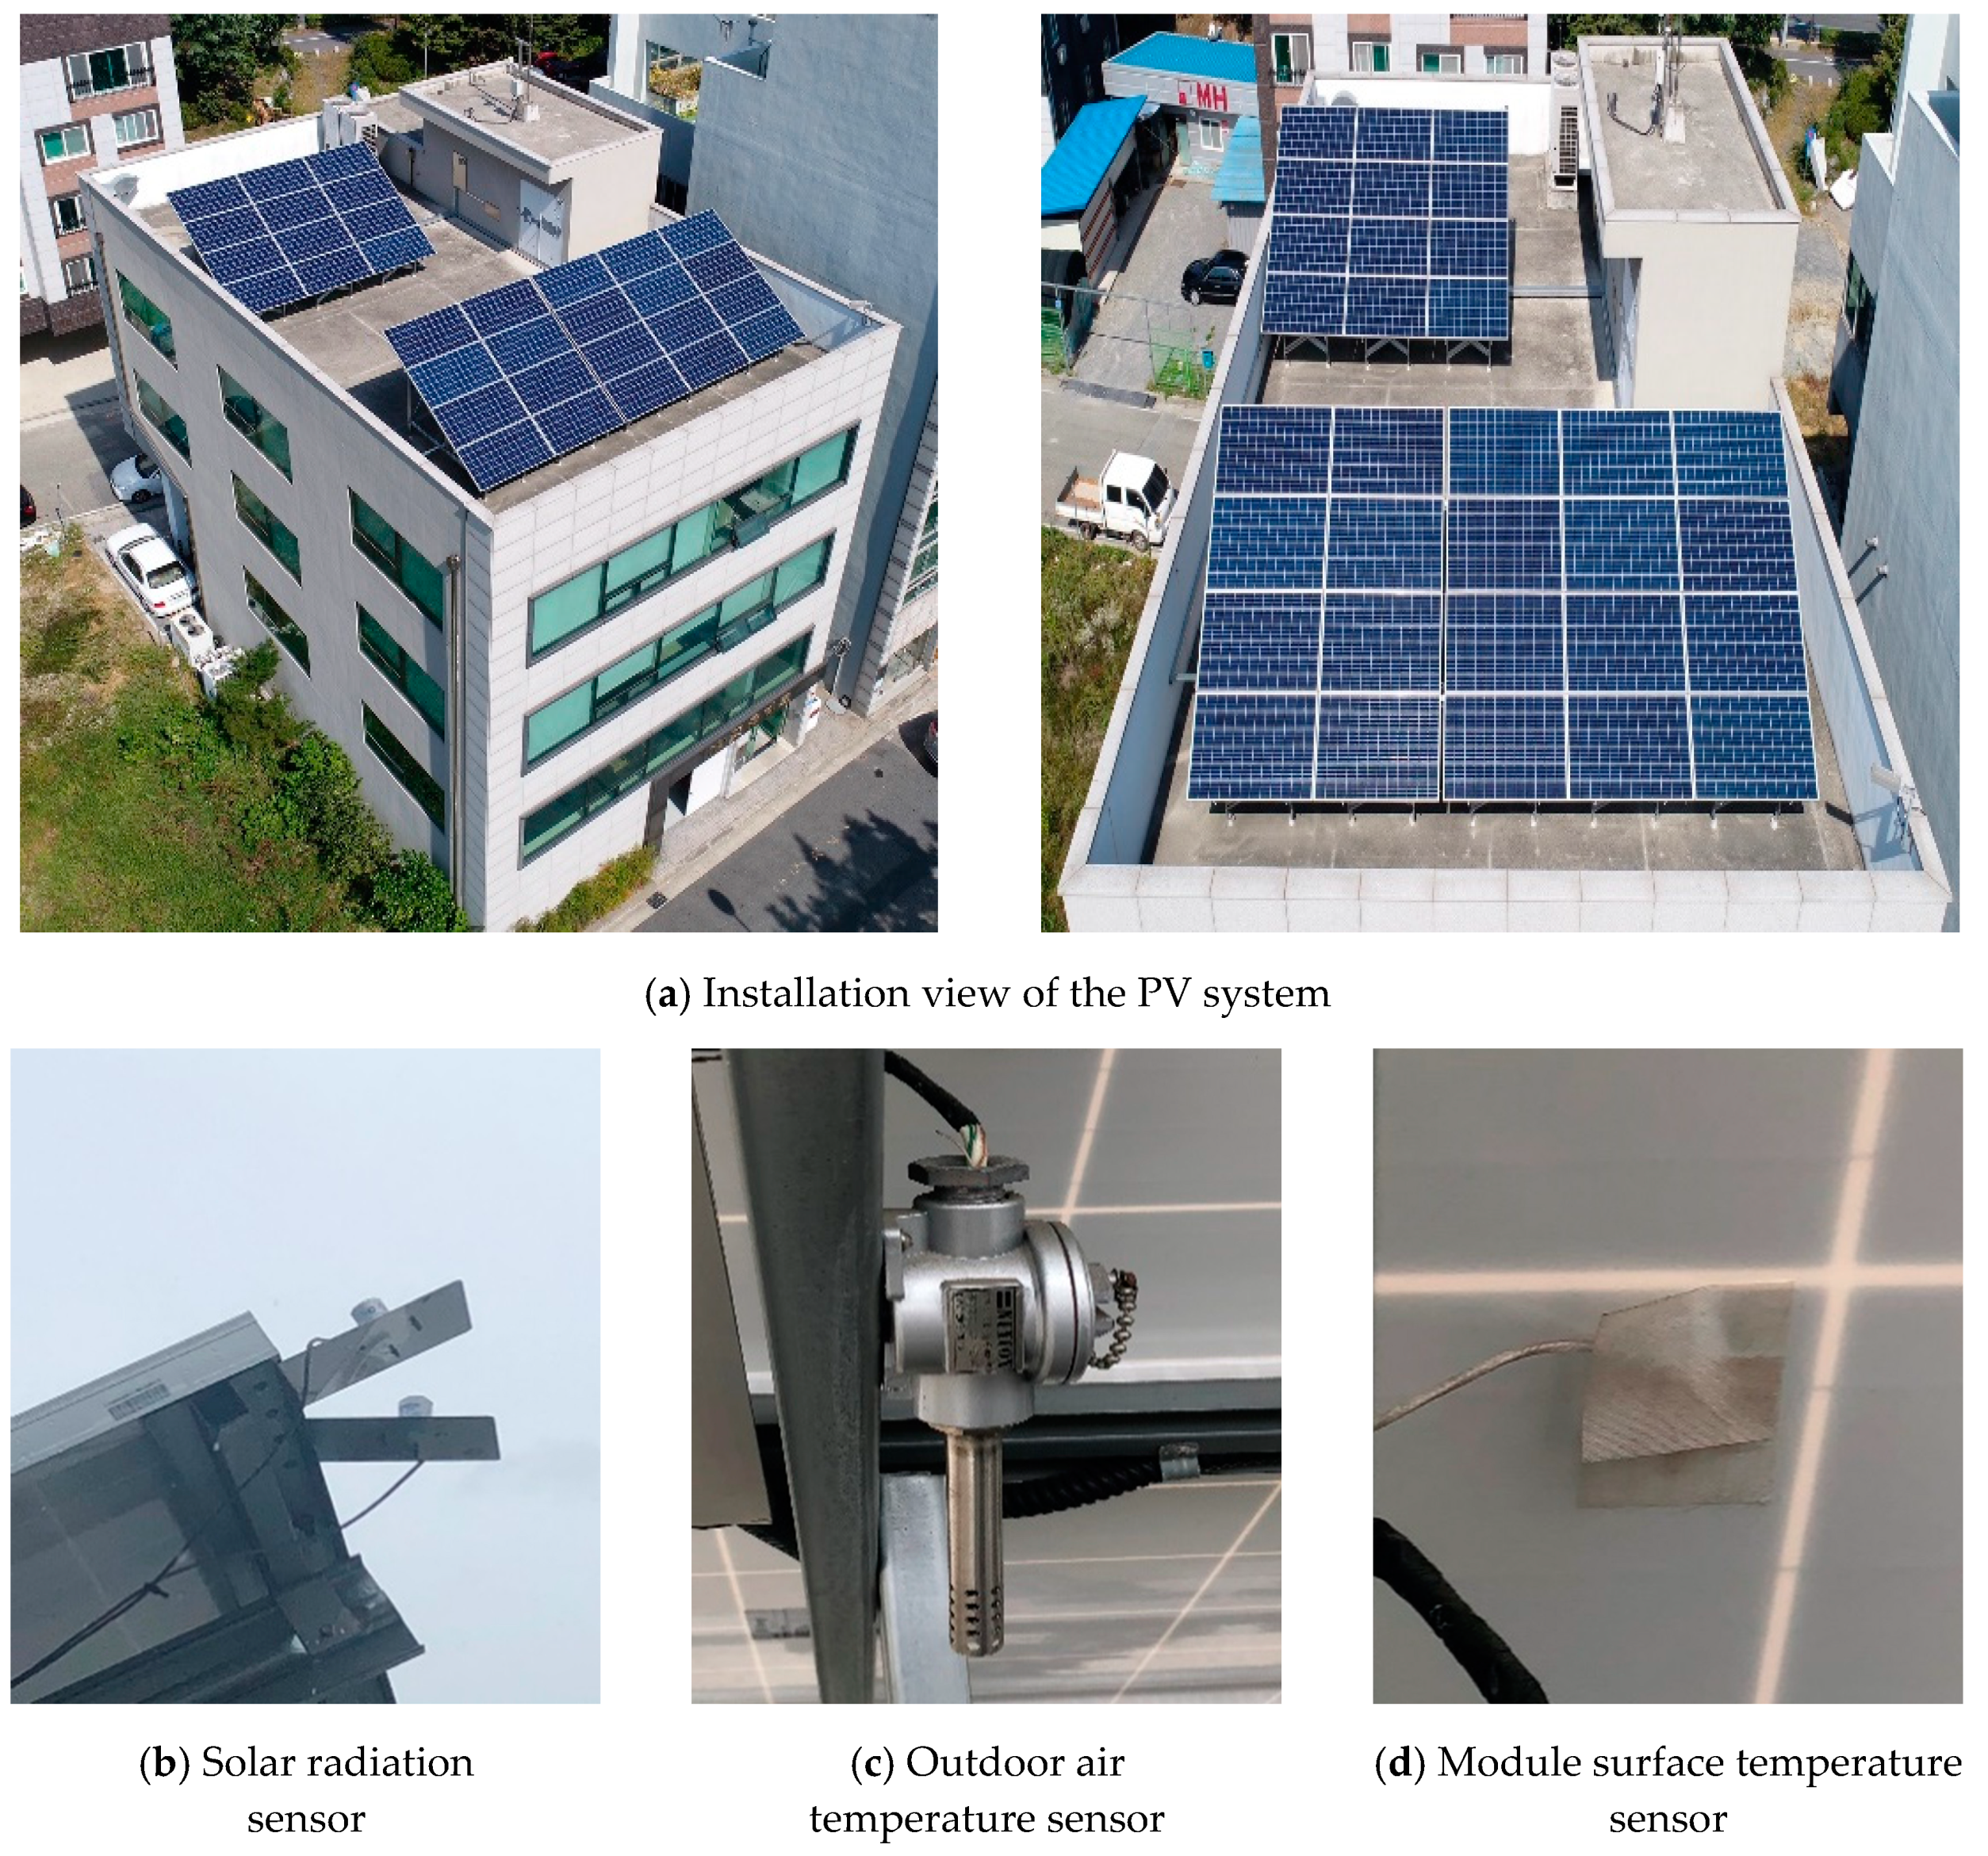
This study developed an ANN-based predictive model using the Neural Network (NN) toolbox in MATLAB [25]. An ANN provides more accurate predictions because it is more adaptable to external changes than are mathematical control models. The developed model was trained by using the Levenberg–Marquardt algorithm (LMA) [26], and six types of measured data (ambient temperature, wind speed, solar radiation, relative humidity, cloud cover, and module surface temperature) were used as the dataset. Seventy percent of the dataset (January 2018—December 2018) was used for training, 15% for validation, and the remaining 15% for the test process. The dataset was composed of hourly data, and Table 2 shows the dataset parameters and value ranges. The measured data of the dataset were collected from a 10 kW rooftop PV installed on Building A in Daejeon (see Figure 1). Table 3 and Table 4 show the system and sensor specifications. In terms of the wind speed, relative humidity, and cloud cover, this study used data measured in Daejeon (2018) from the KMA (Korea meteorological administration) open data portal [27]. The final predictive model was developed through the process of developing and optimizing the initial model.
3.1. Overall Study Process
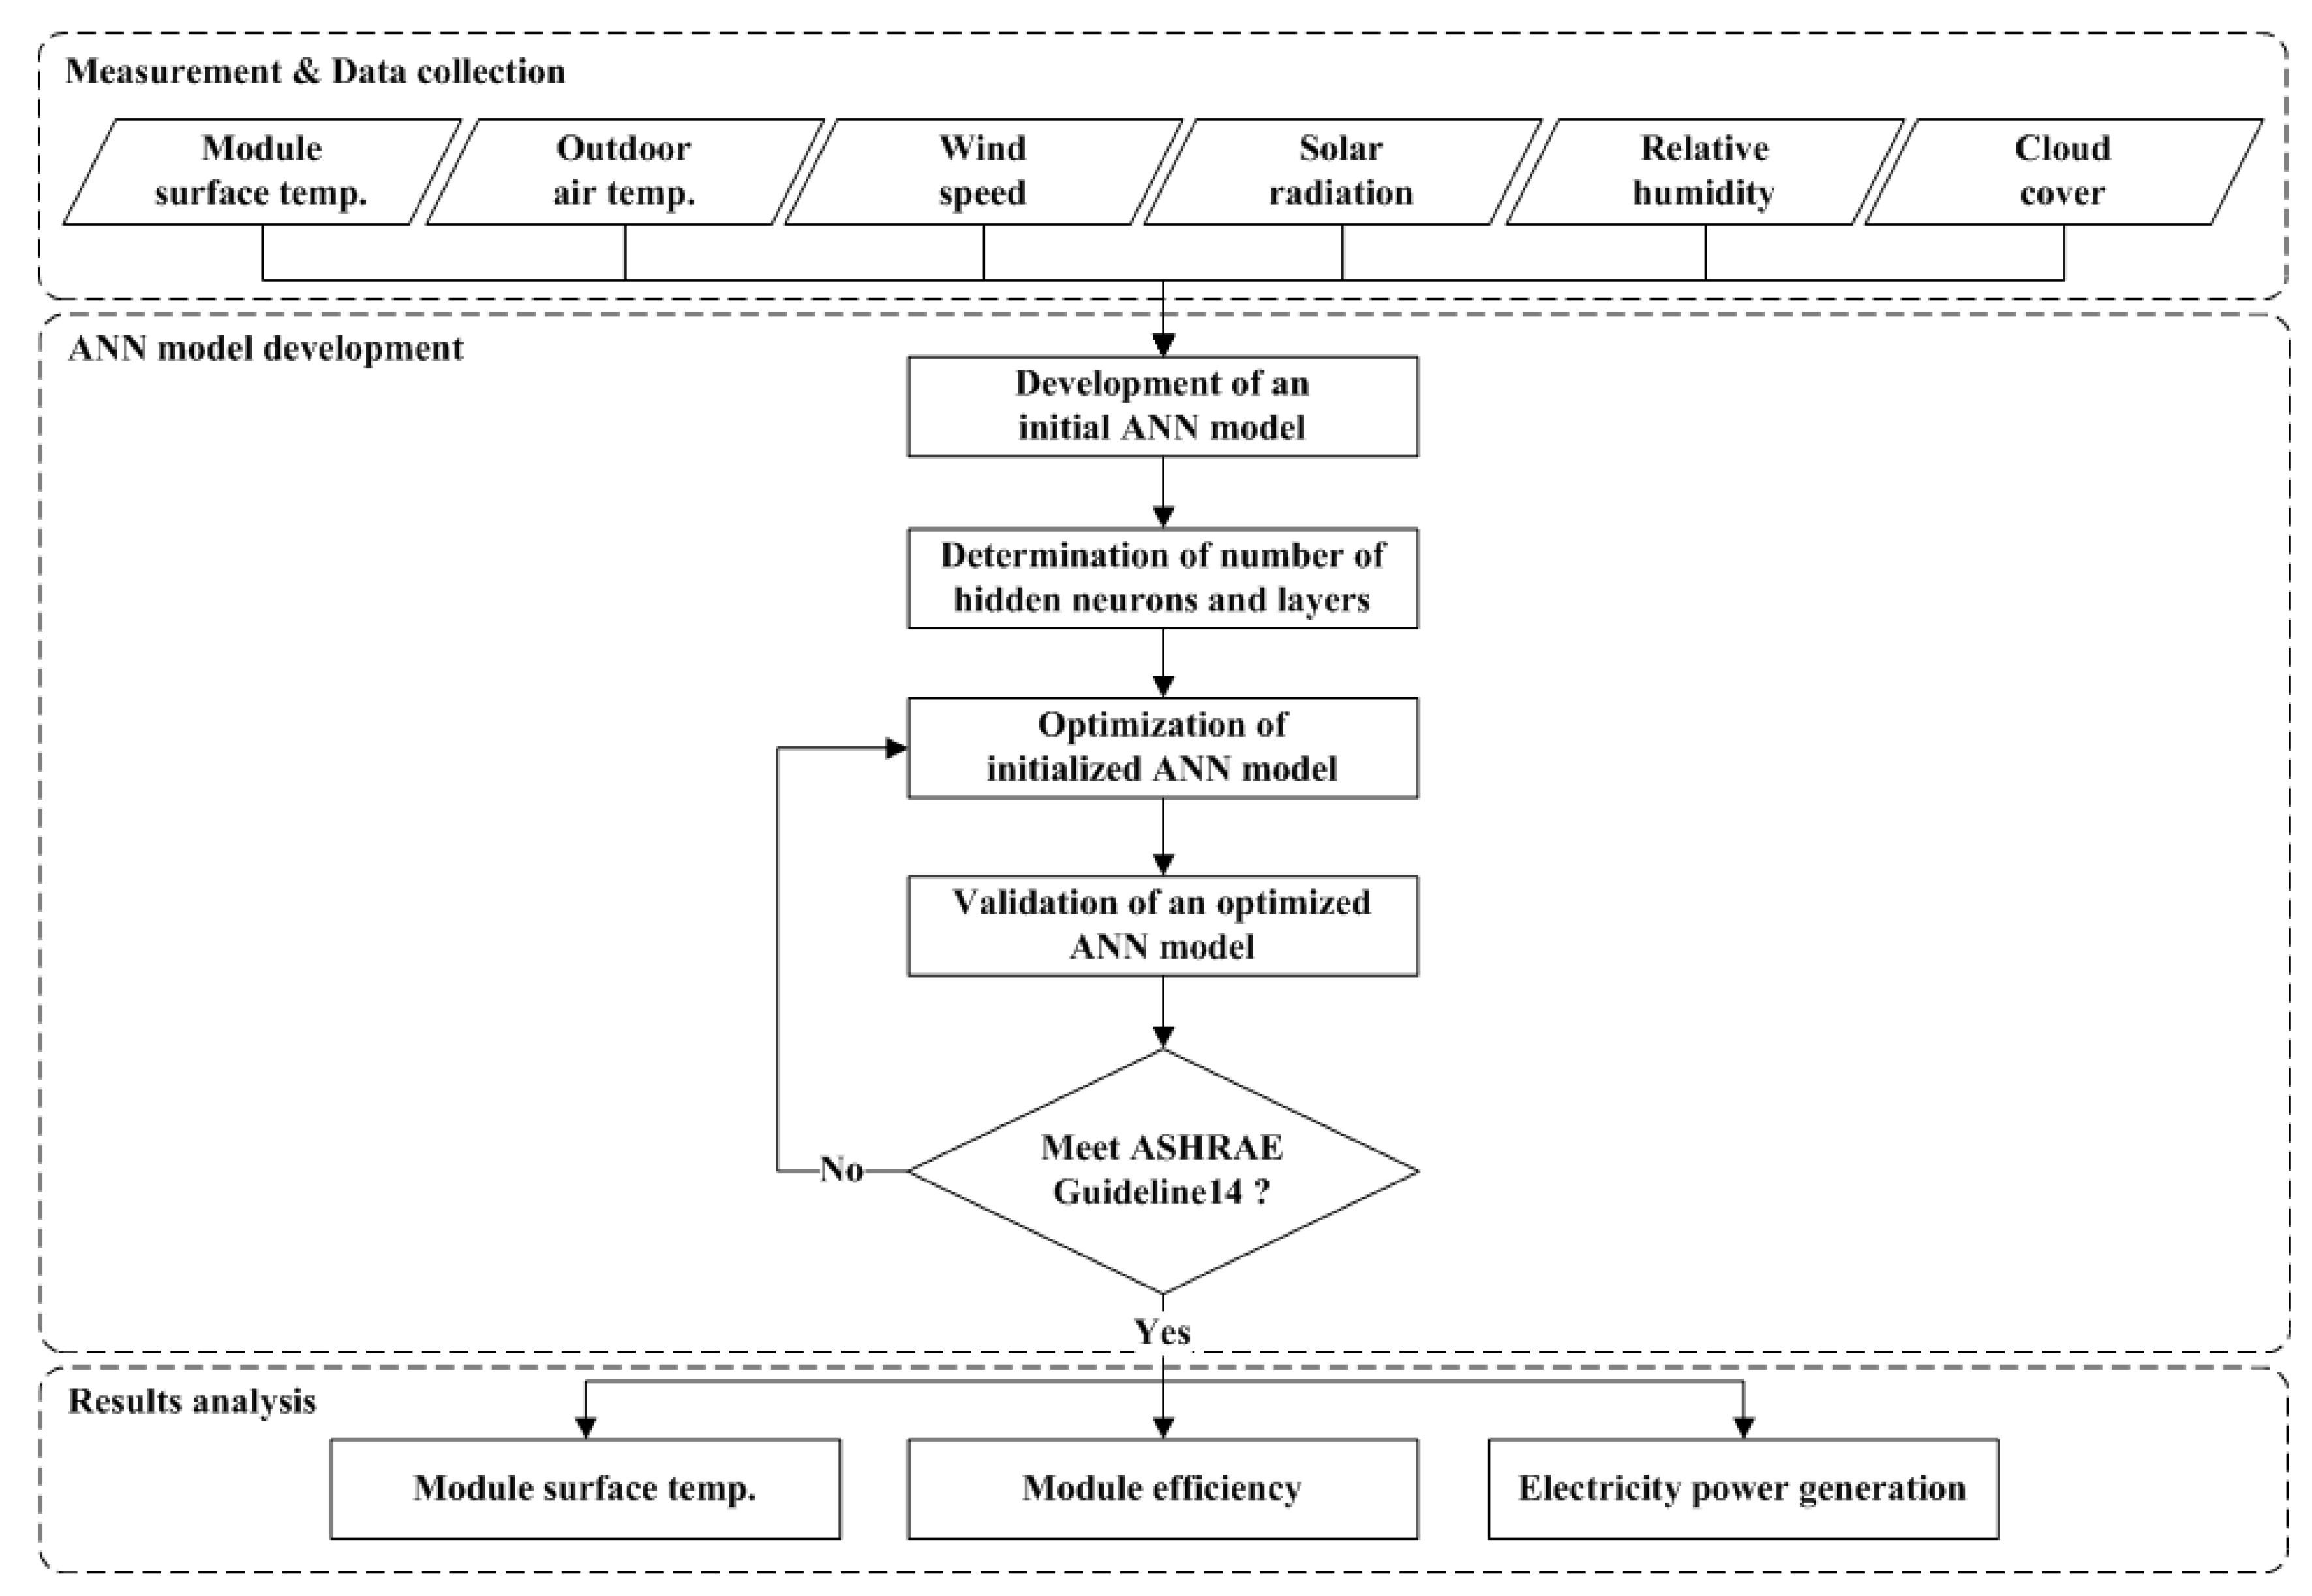
The purpose of this study was to develop a predictive model for PV module surface temperatures to analyze the module surface temperature, efficiency, and power generation. Figure 2 shows the overall study process. The initial predictive model was developed by using a dataset that went through an optimization process. The optimized model then went through a validation process. The model was validated based on ASHRAE (American Society of Heating, Refrigerating and Air-Conditioning Engineers) Guideline 14 [29]. The ASHRAE Guideline 14 was developed to provide standardized guidelines for reliably measuring the energy, demand, and water savings achieved in conservation projects. According to ASHRAE Guideline 14, the accuracy of a predictive model using hourly data must satisfy R2 > 0.75 and cvRMSE (coefficient of variation of the root mean squared error) < 30%. Finally, this study used the developed model to predict module surface temperatures and analyze the efficiency and power generated by the PV system accordingly.
3.2. Development Process of the ANN Model
This study developed a predictive model to calculate PV module surface temperatures for a next timestep using the current measured data. The predictive model was based on the theory of the artificial neural networks (ANN), which simulates the way the human brain analyzes information. Artificial intelligence (AI) has been receiving more attention since it can model complex behavior that traditional engineering methods cannot model. Among the various ANN techniques, this study used the Levenberg–Marquardt algorithm (LMA), which is available in MATLAB software, to develop a predictive model using ANN [26]. The LMA was developed in the early 1960s to resolve nonlinear least squares curve-fitting problems. It is known as a hybrid technique using both the gradient descent method and the Gauss–Newton method to converge to an optimal solution.
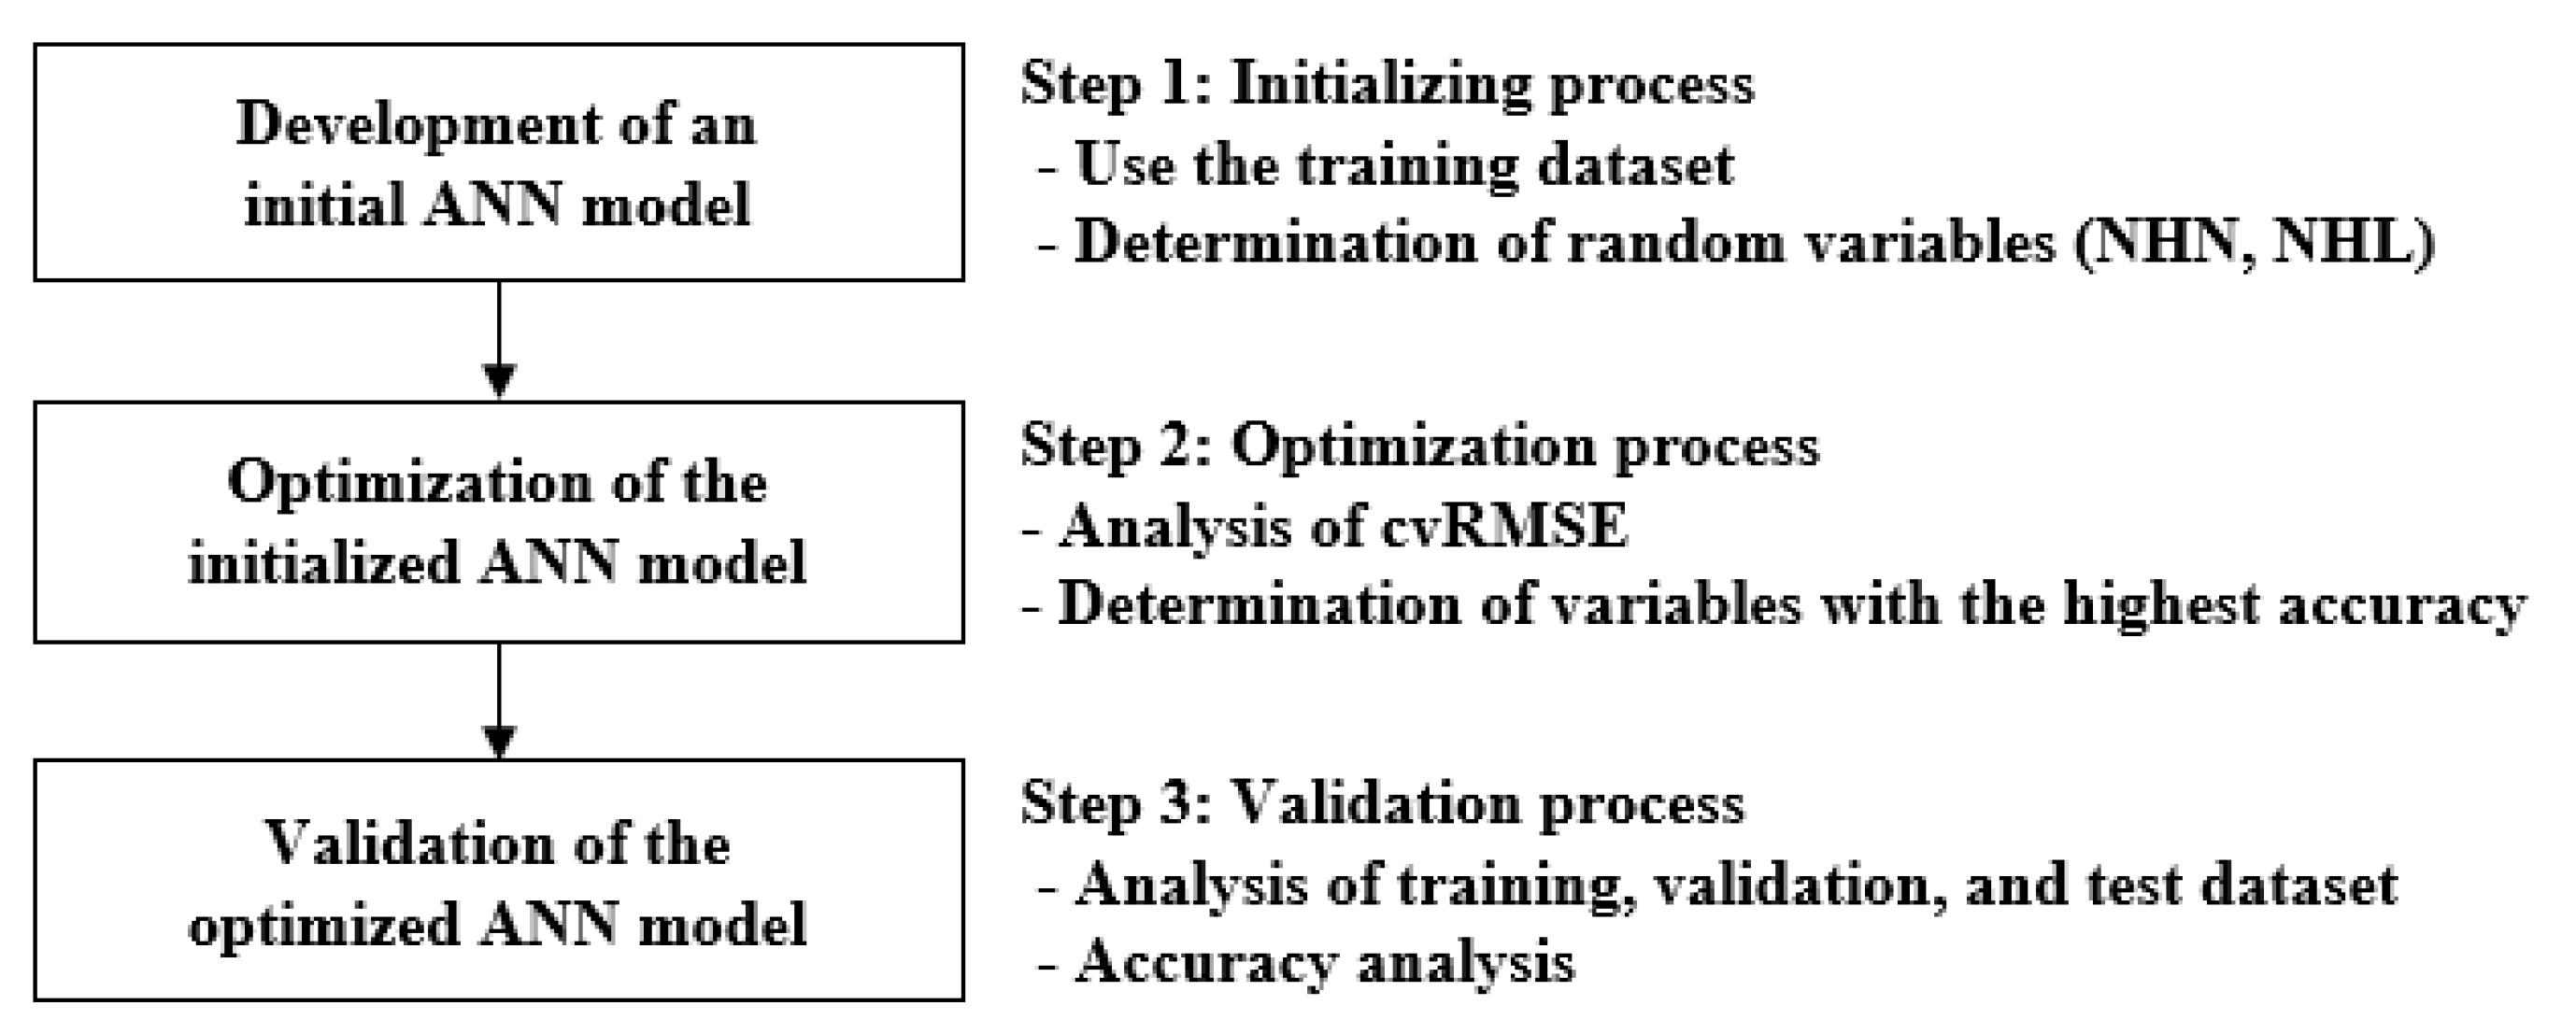
The predictive model of this study was developed through three steps: (1) initial model development, (2) initial model optimization, and (3) optimized model validation (see Figure 3).
The first step was developing an initial predictive model. The initial predictive model was developed by setting a random NHN (number of hidden neurons) and NHL (number of hidden layers).
The second step was optimizing the initial predictive model. The NHN and NHL were re-determined to ensure the predictive performance of the initial model. The R2 value and cvRMSE were analyzed, and the variables (NHN, NHL) with the highest accuracy that also satisfied the reference values required by ASHRAE Guideline 14 were used to optimize the model.
4. Results of the ANN Model
This section describes how the predictive model was developed and explains how it was structured according to the development process. Min–max normalization was used to reflect the input data for training on the same scale. However, this study normalized values between 0.1 and 0.9 to prevent returning 0 and 1 [30]. This is because 0 and 1 may have adverse effects on the prediction. The min–max normalization algorithm shown in Equation (1) was used in this study. The model was used to predict and calculate the module surface temperature, efficiency, and power generation.
where is the normalized data, is the previous data, is the minimum value of previous data, and is the maximum value of previous data [30].
In addition, the predictive model was optimized by evaluating the accuracy by using cvRMSE. Equations (2) and (3) are the RMSE and cvRMSE algorithms, respectively [28].
where is the predicted data, is the measured data, is the number of measured data points, and is the average of the measurement period [28].
4.1. Development of an Initial ANN Model
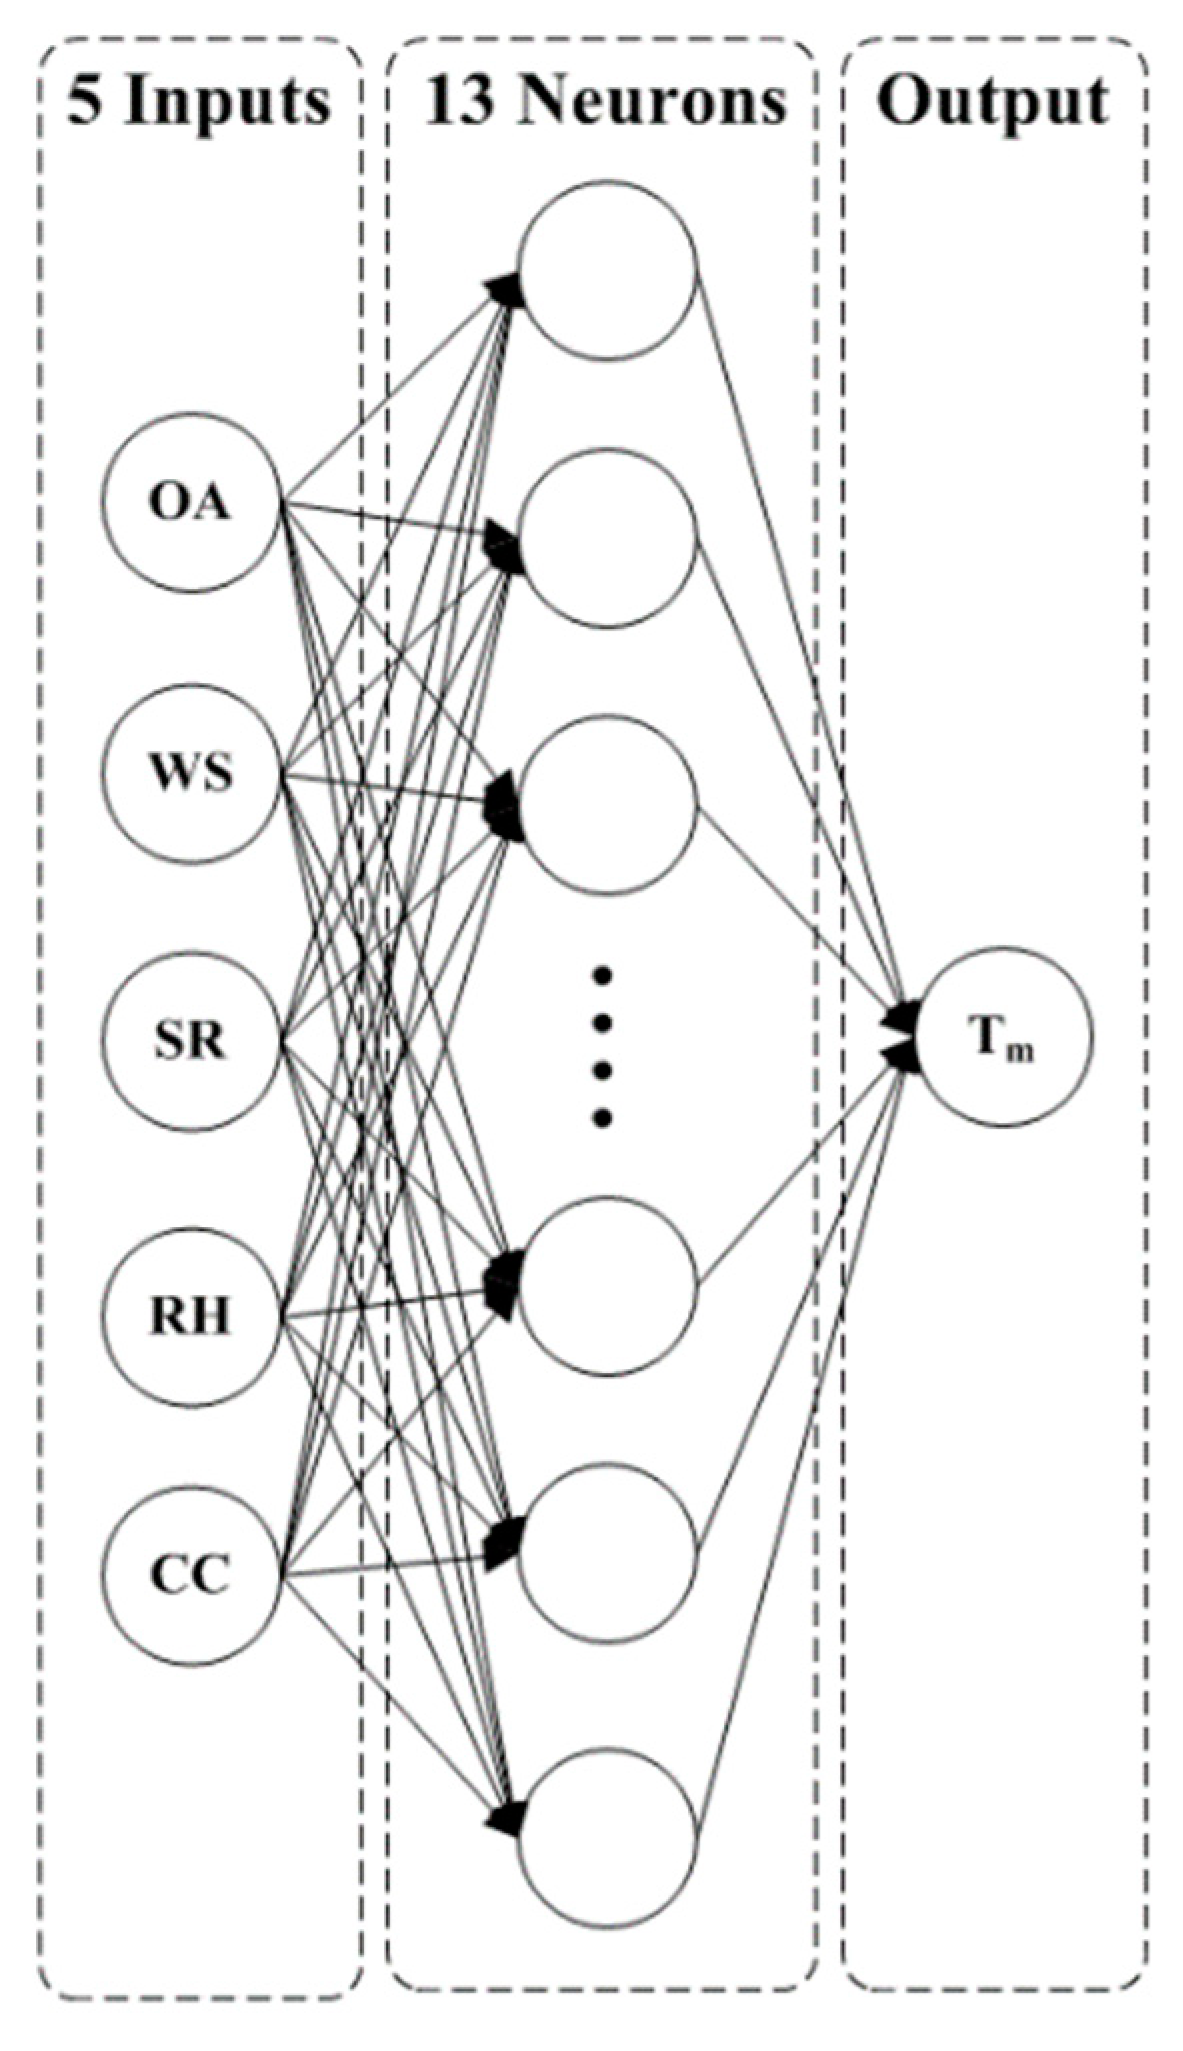
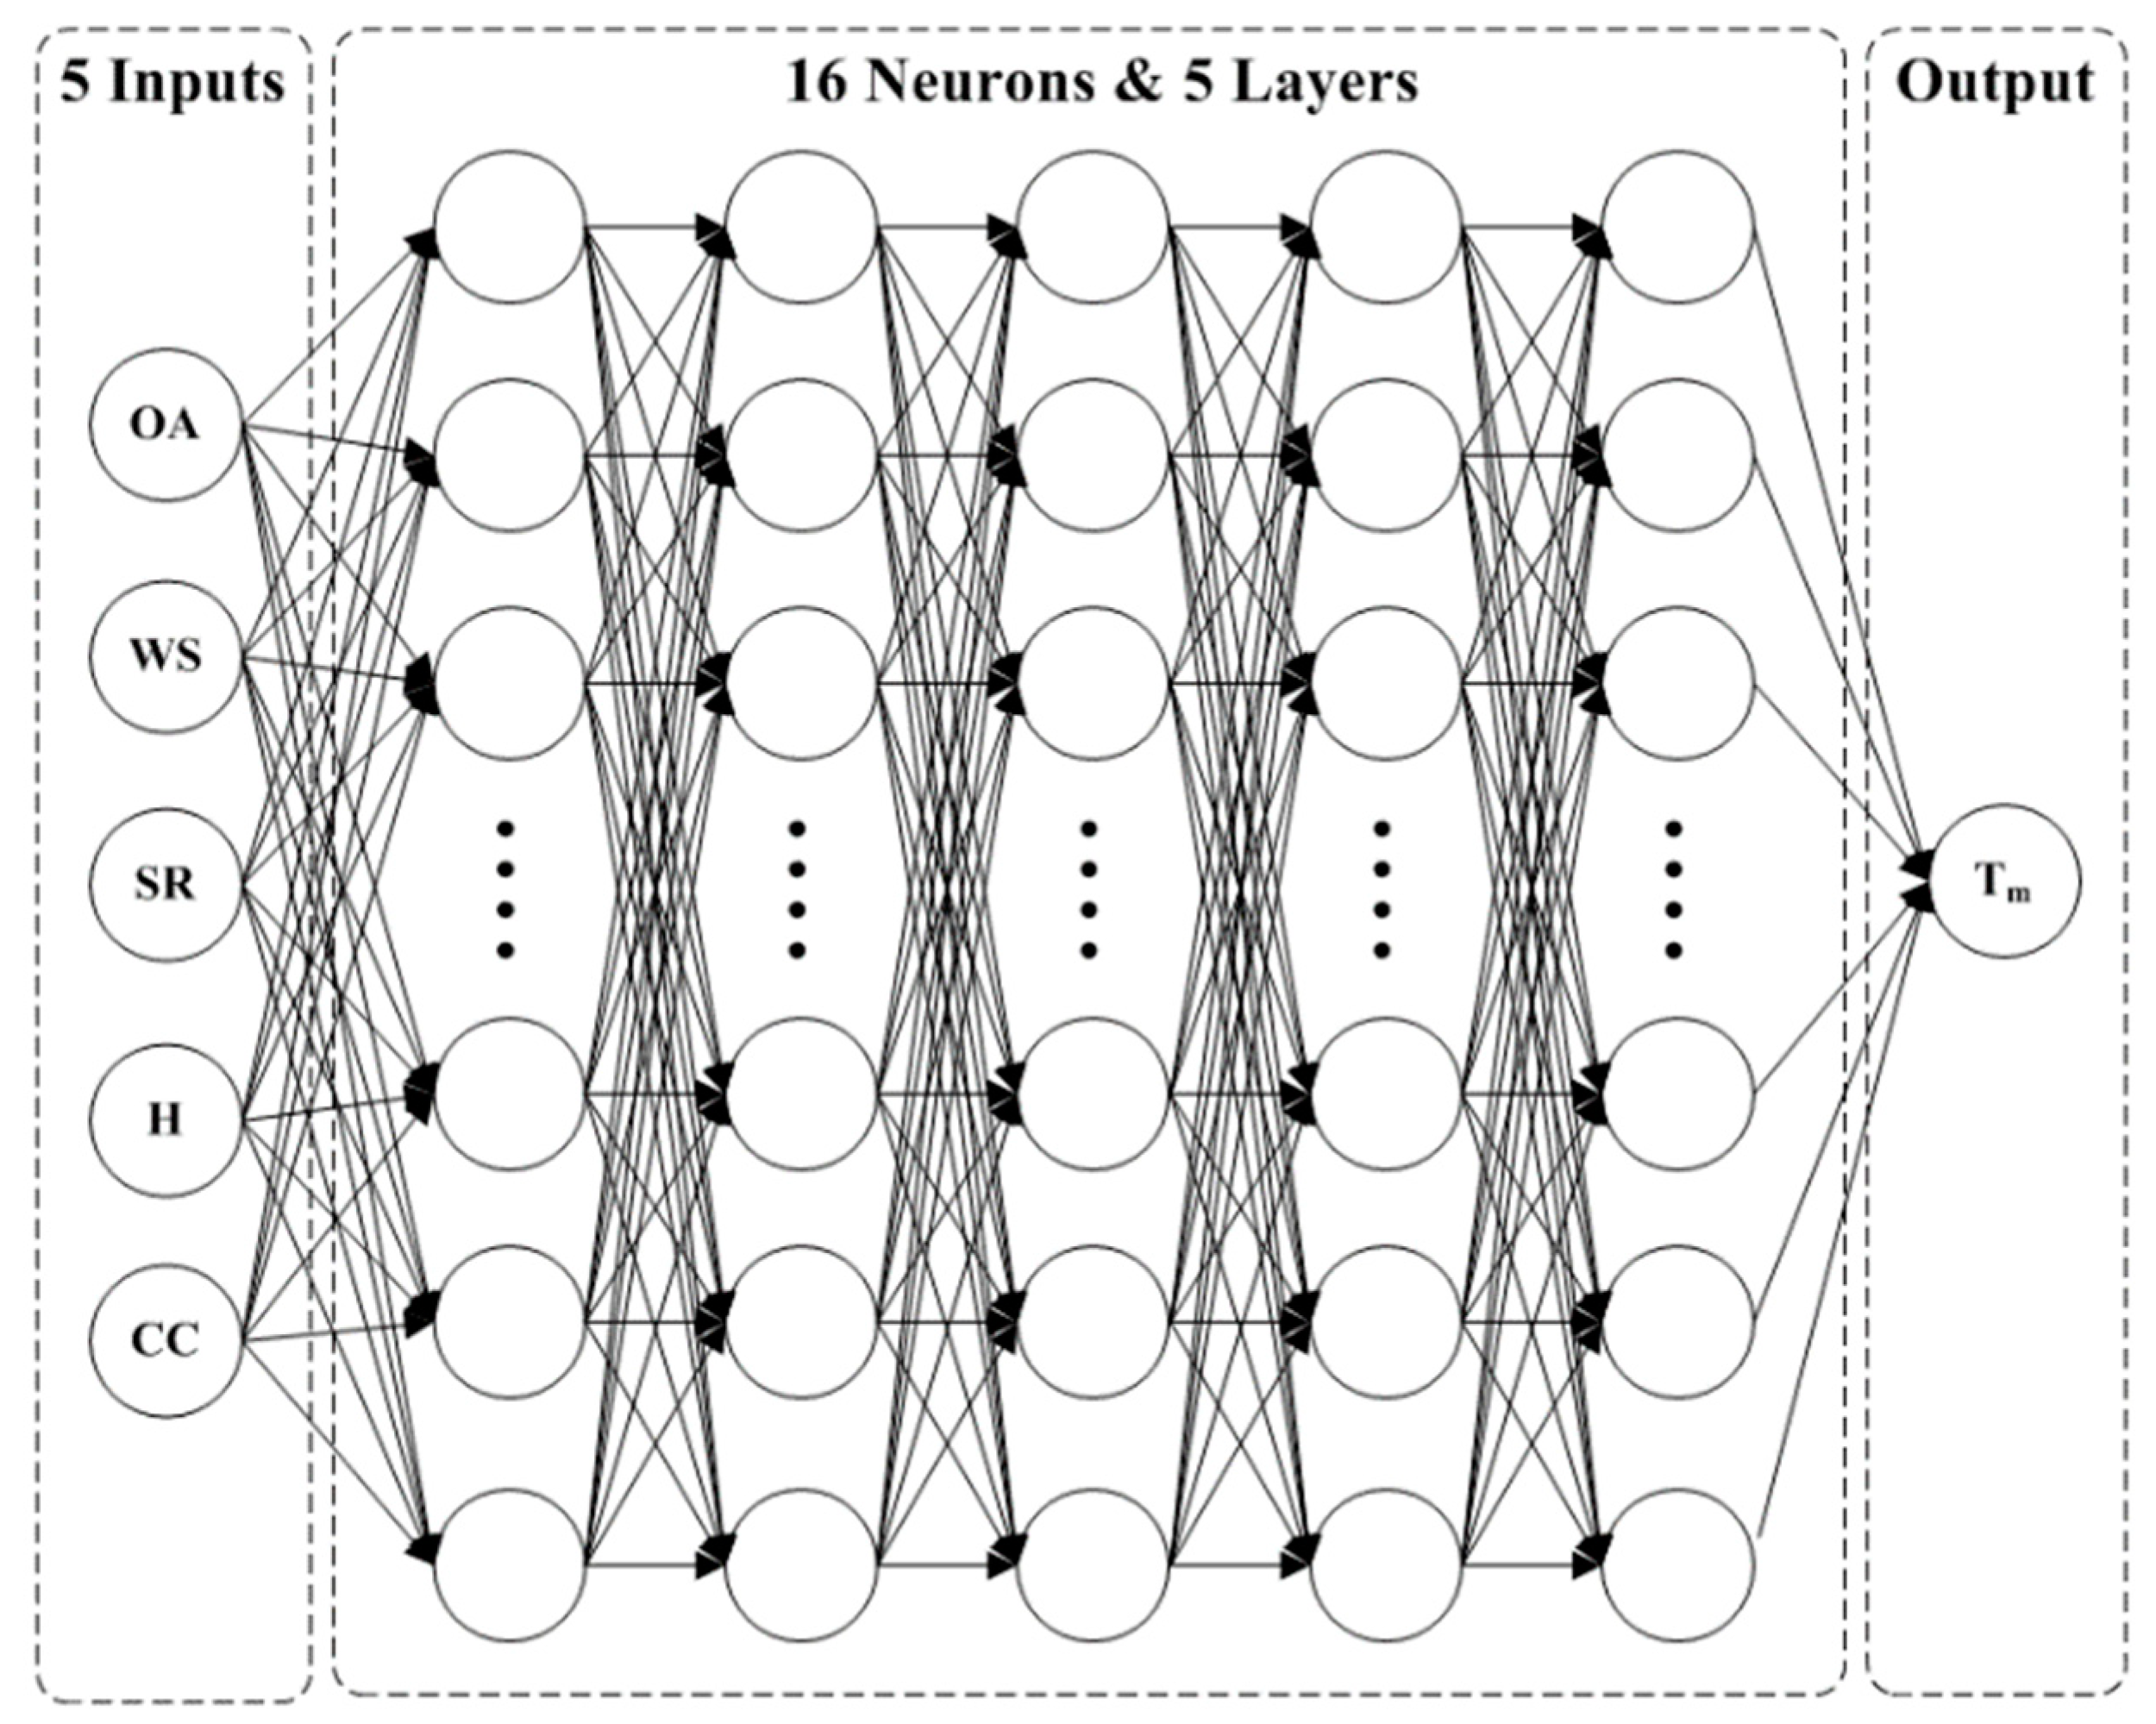
This study developed an initial predictive model using the dataset. The initial model consisted of NHN (=13) and NHL (=1), and the LR (learning rate) and MC (momentum constant) were both set to 0.3 (see Figure 4). Random variables were set by referring to the study by Moon (2015) [30]. The input data consisted of the outdoor air temperature (OA), wind speed (WS), solar radiation (SR), relative humidity (RH), and cloud cover (CC), and the output was the module surface temperature. As a result of developing the predictive model, the cvRMSE of the initial model was 22.00% and satisfied the criteria recommended in ASHRAE Guideline 14. Then, the initial model was optimized to more accurately evaluate predictive performance.
4.2. Optimization of the Initial ANN Model
The initial model went through an optimization process. The cvRMSE was evaluated by changing the NHN and NHL. The optimization process was performed by changing the NHN from 8 to 18 and the NHL from 1 to 5. Table 5 shows the optimization results.
After the optimization process, the model showed the highest accuracy (cvRMSE = 19.81%) when NHN = 16 and NHL = 5, and it satisfied the criteria specified in ASHRAE Guideline 14. The optimized model’s accuracy improved by about 2.19% compared to that of the initial model. Figure 5 shows a diagram of the optimized predictive model.
4.3. Validation of the Optimized ANN Model
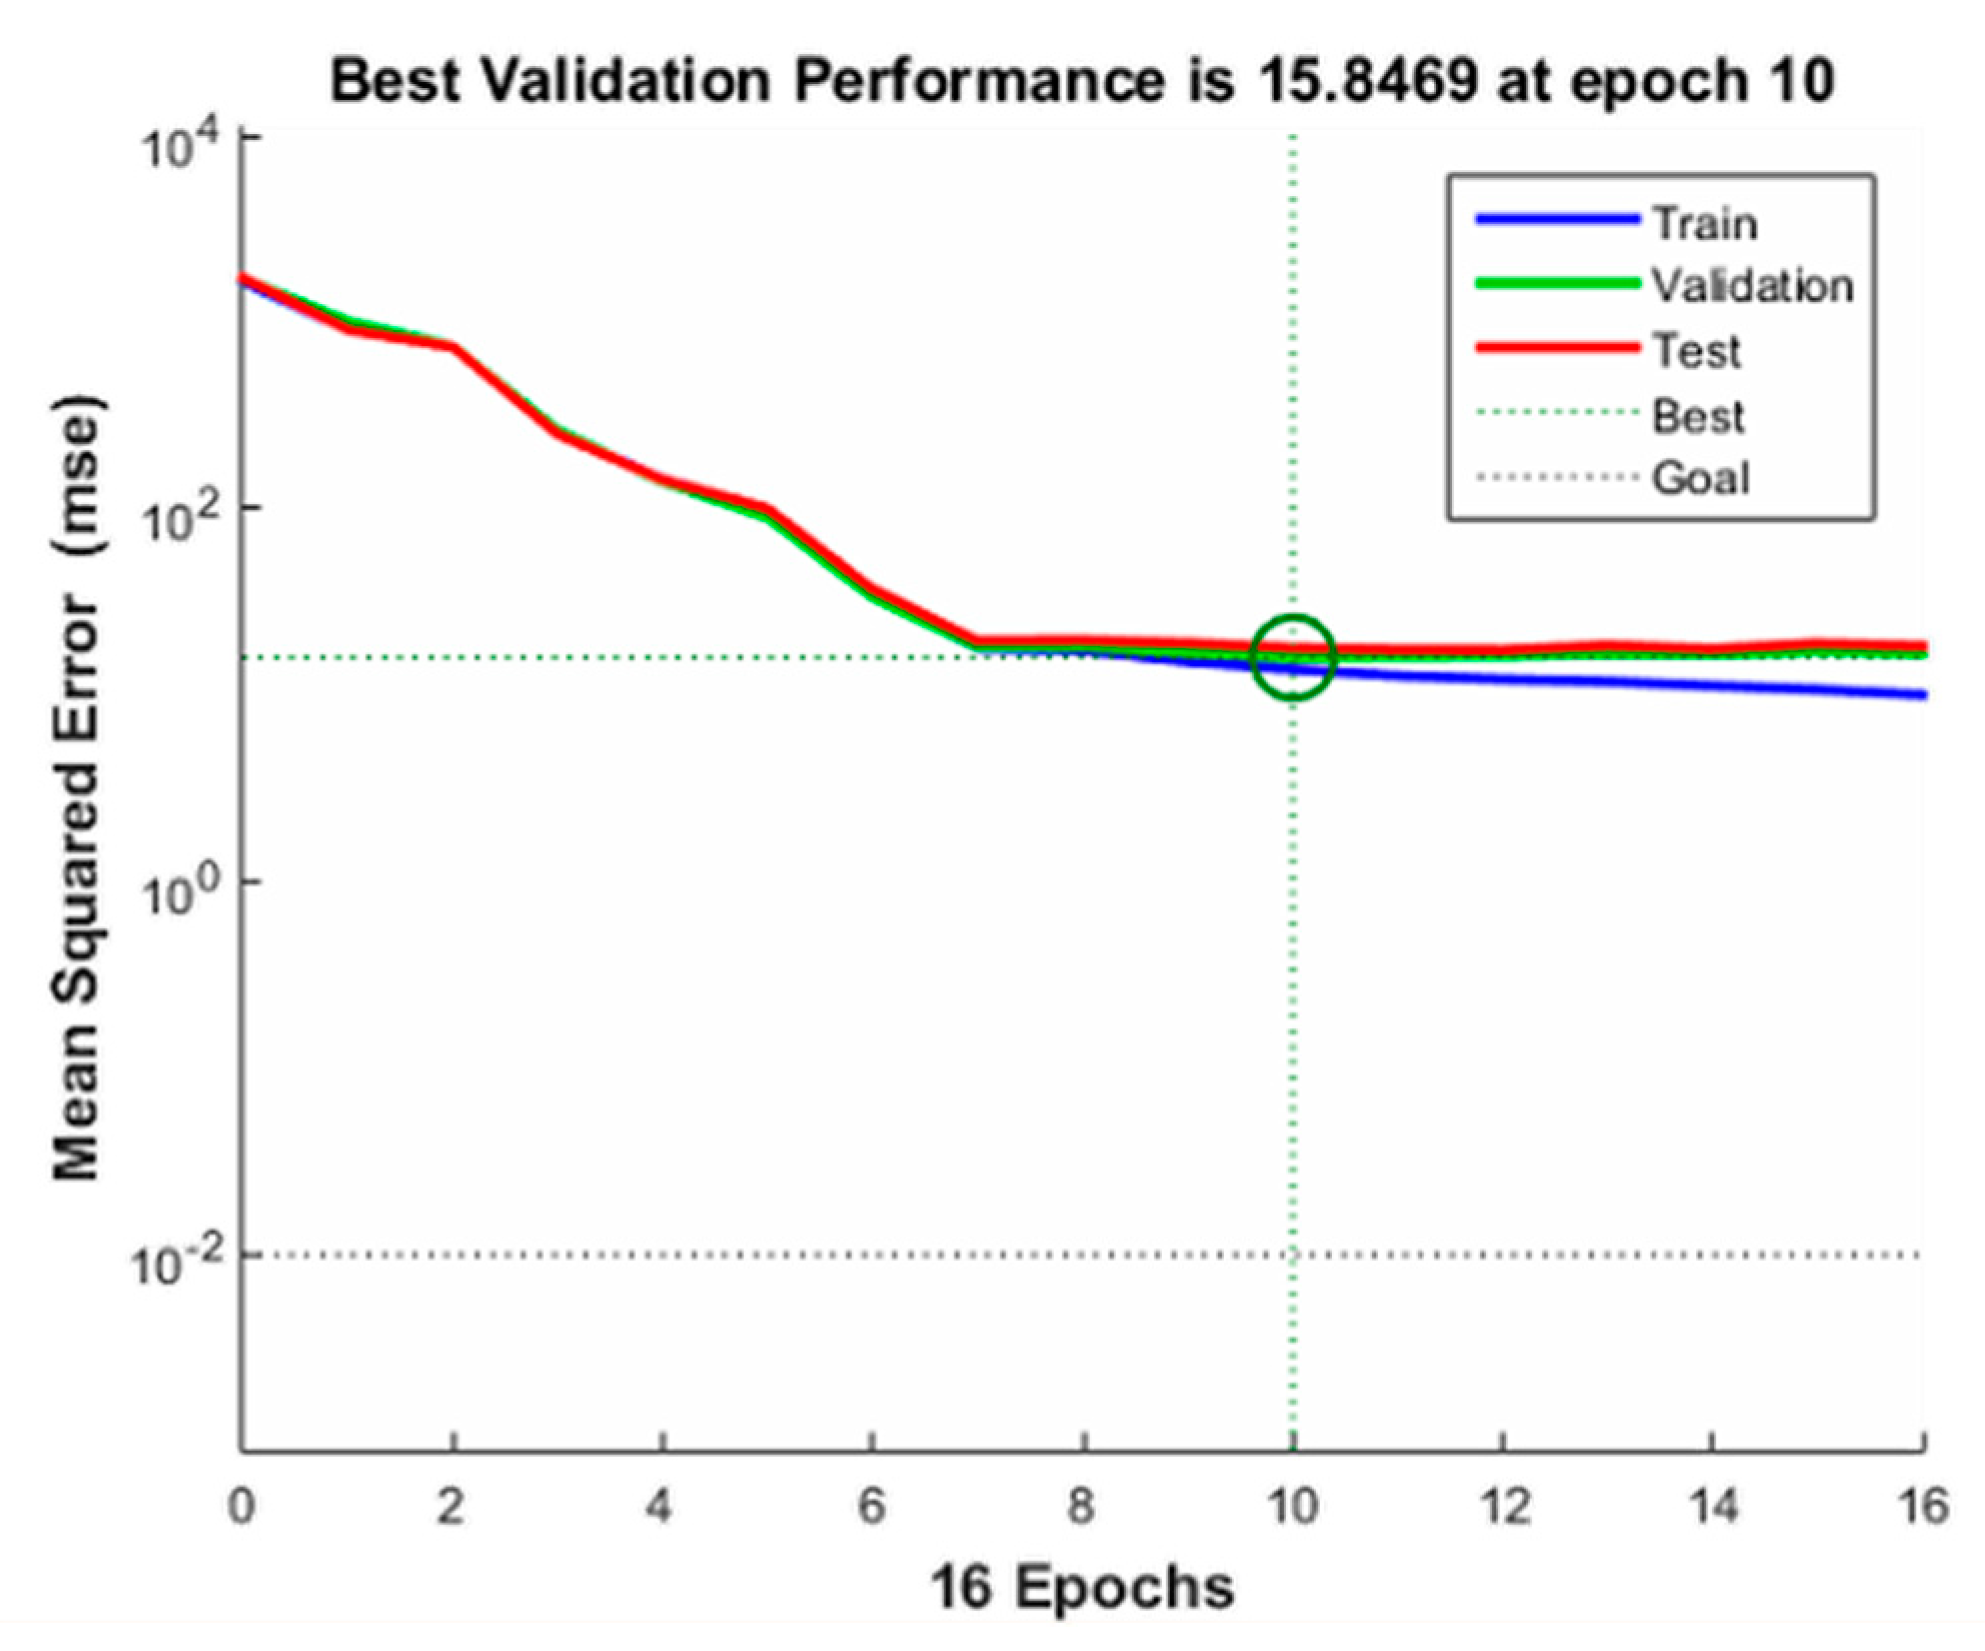
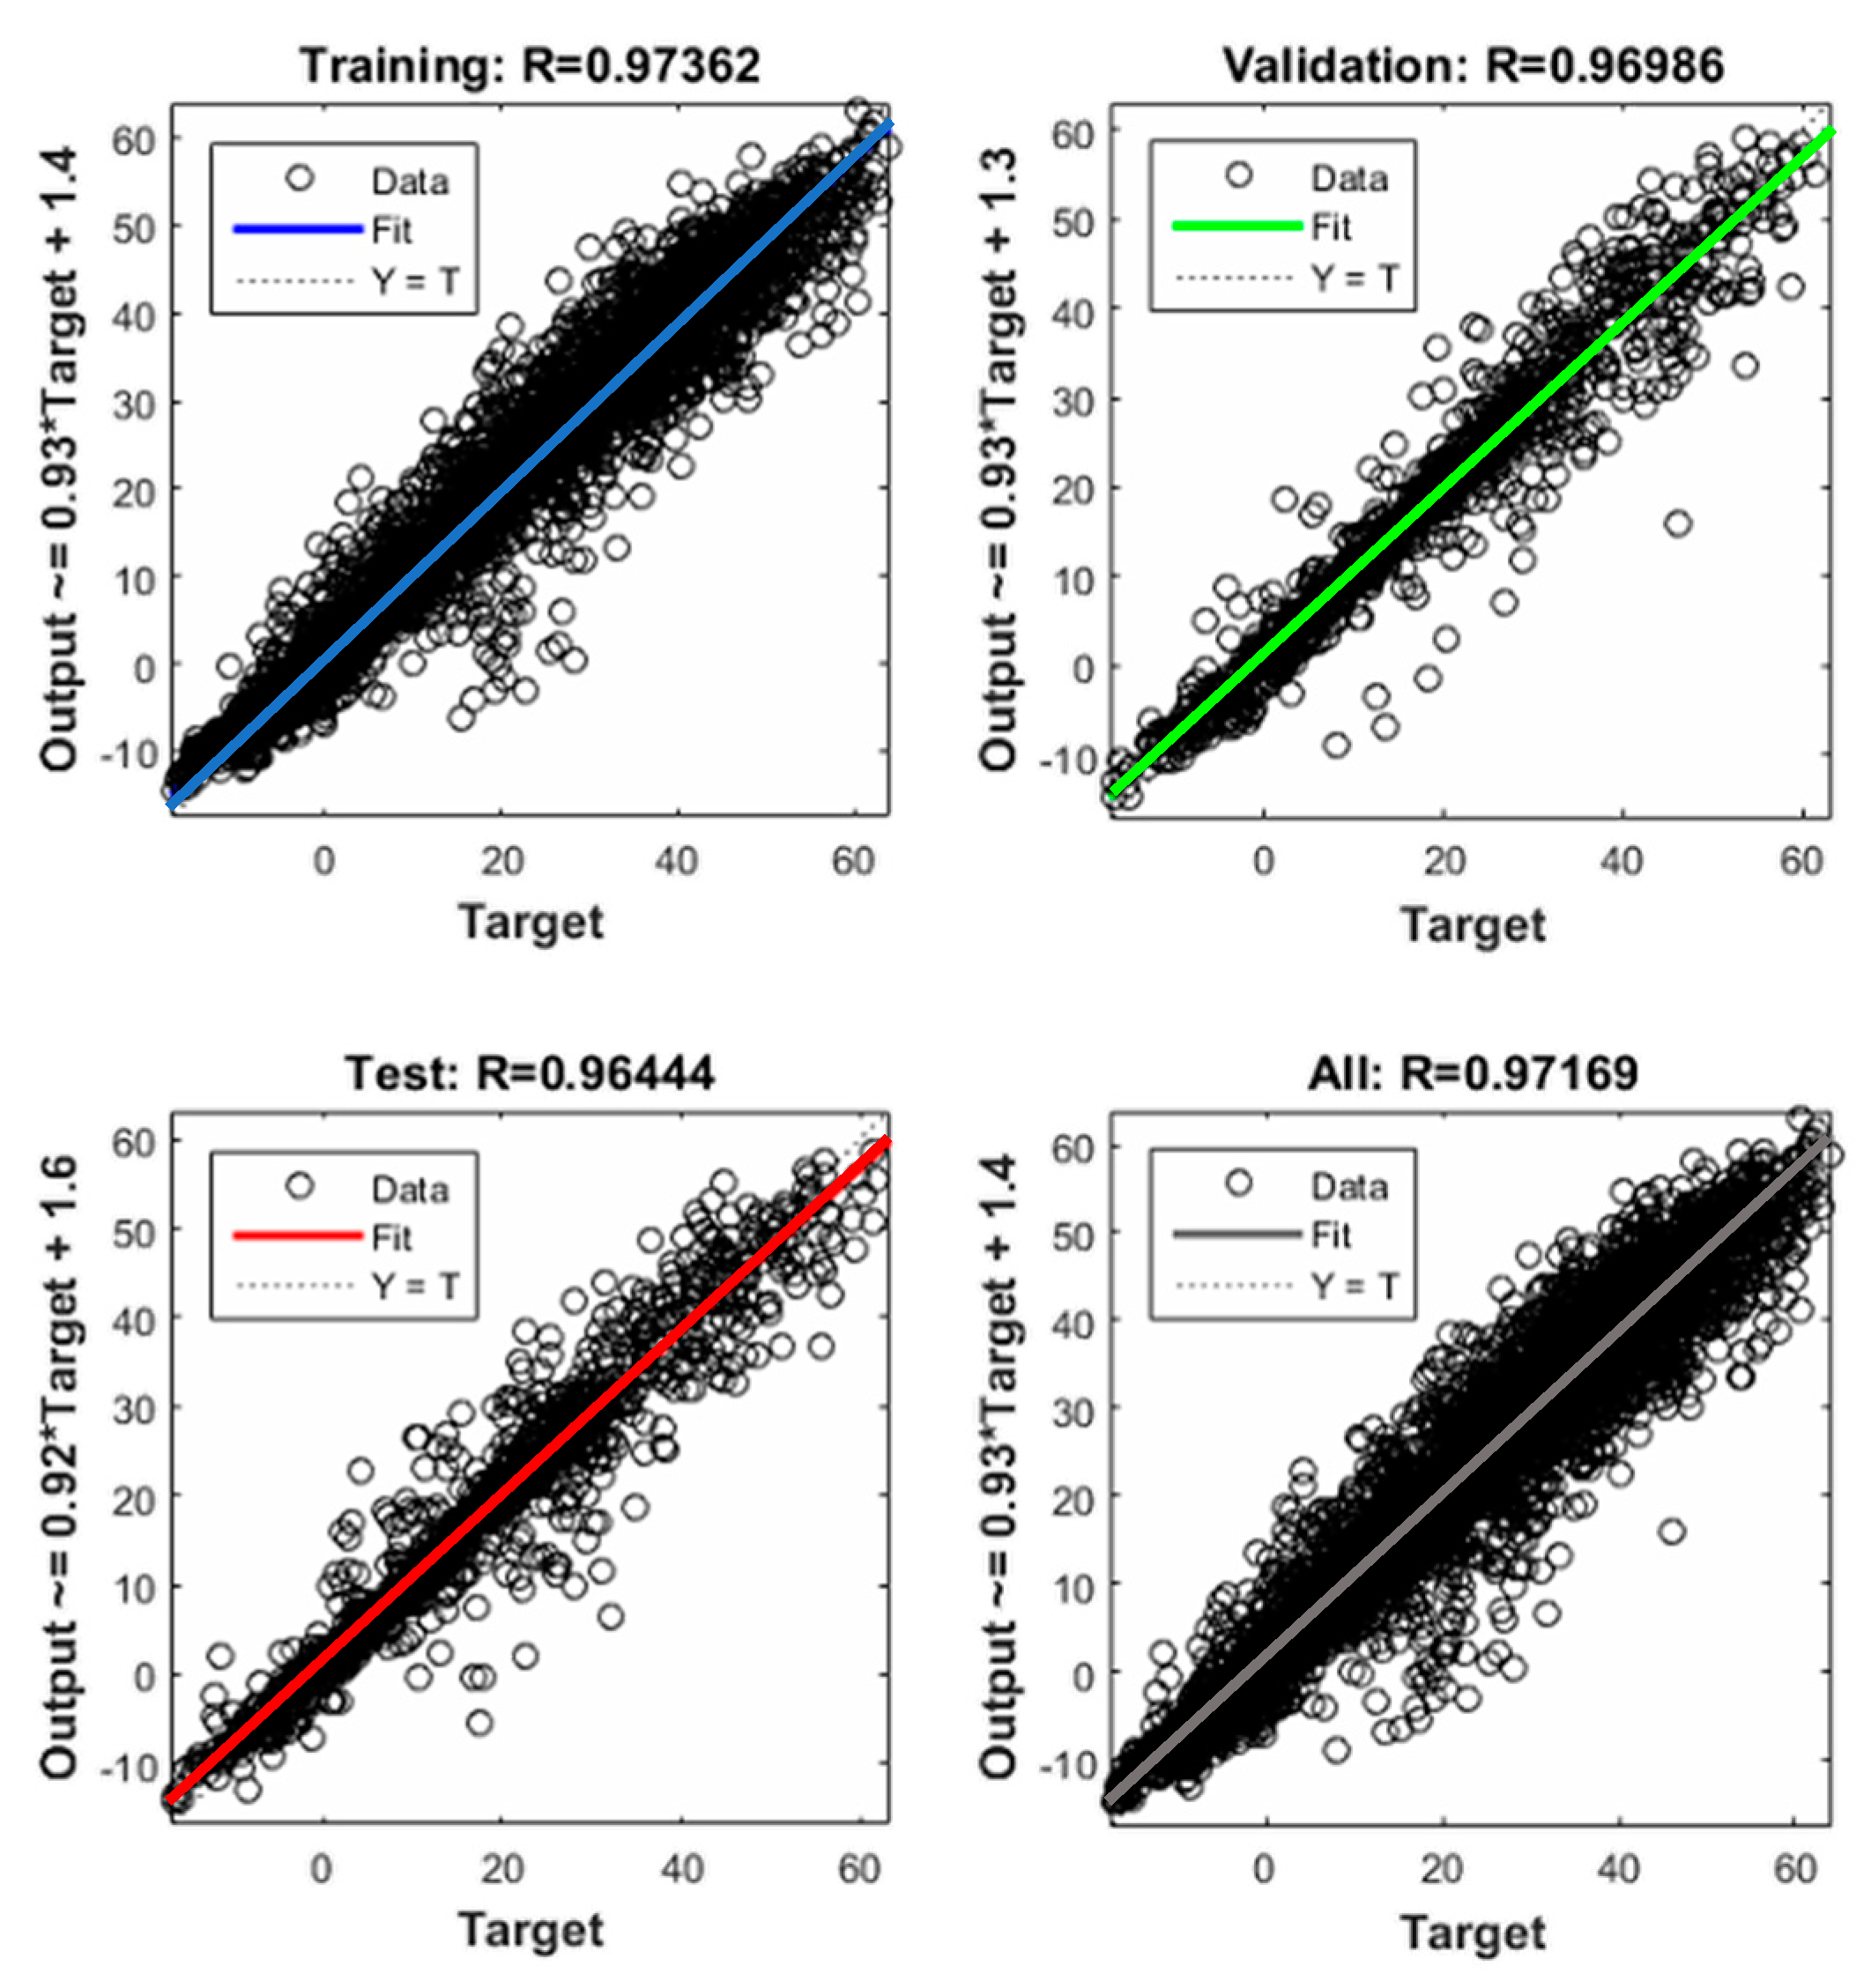
The validation step was performed to confirm the applicability of the optimized predictive model. The output and errors of the training, validation, and test datasets were checked to confirm validation. Figure 6 shows the error (MSE; mean squared error). The MSE of the X-axis is the error and the epochs of the Y-axis are the points at which iterative training stops. Figure 7 shows the result of the regression analysis on the optimized predictive model. The target of the X-axis is the measured data and the output of the Y-axis is the output of the predictive model.
As a result of error analysis, iterative training stopped after 16 iterations. The predictive performance showed the best validation performance in the 10th iteration. The error characteristics of the training, validation, and test datasets also showed similar patterns. This shows that the optimized predictive model will provide high accuracy.
In terms of the regression analysis results, the R2 value was 0.97 for training, 0.97 for validation, 0.96 for test, and 0.97 overall. This shows that the optimized predictive model will predict the measured data with high accuracy.
5. Results Analysis and Discussion
This section discusses the analysis of the module surface temperatures predicted by the optimized model and the efficiency and power generation calculated using the predicted module surface temperatures. The calculated power generation was analyzed by comparing it with the actual power generation data.
5.1. Module Surface Temperature
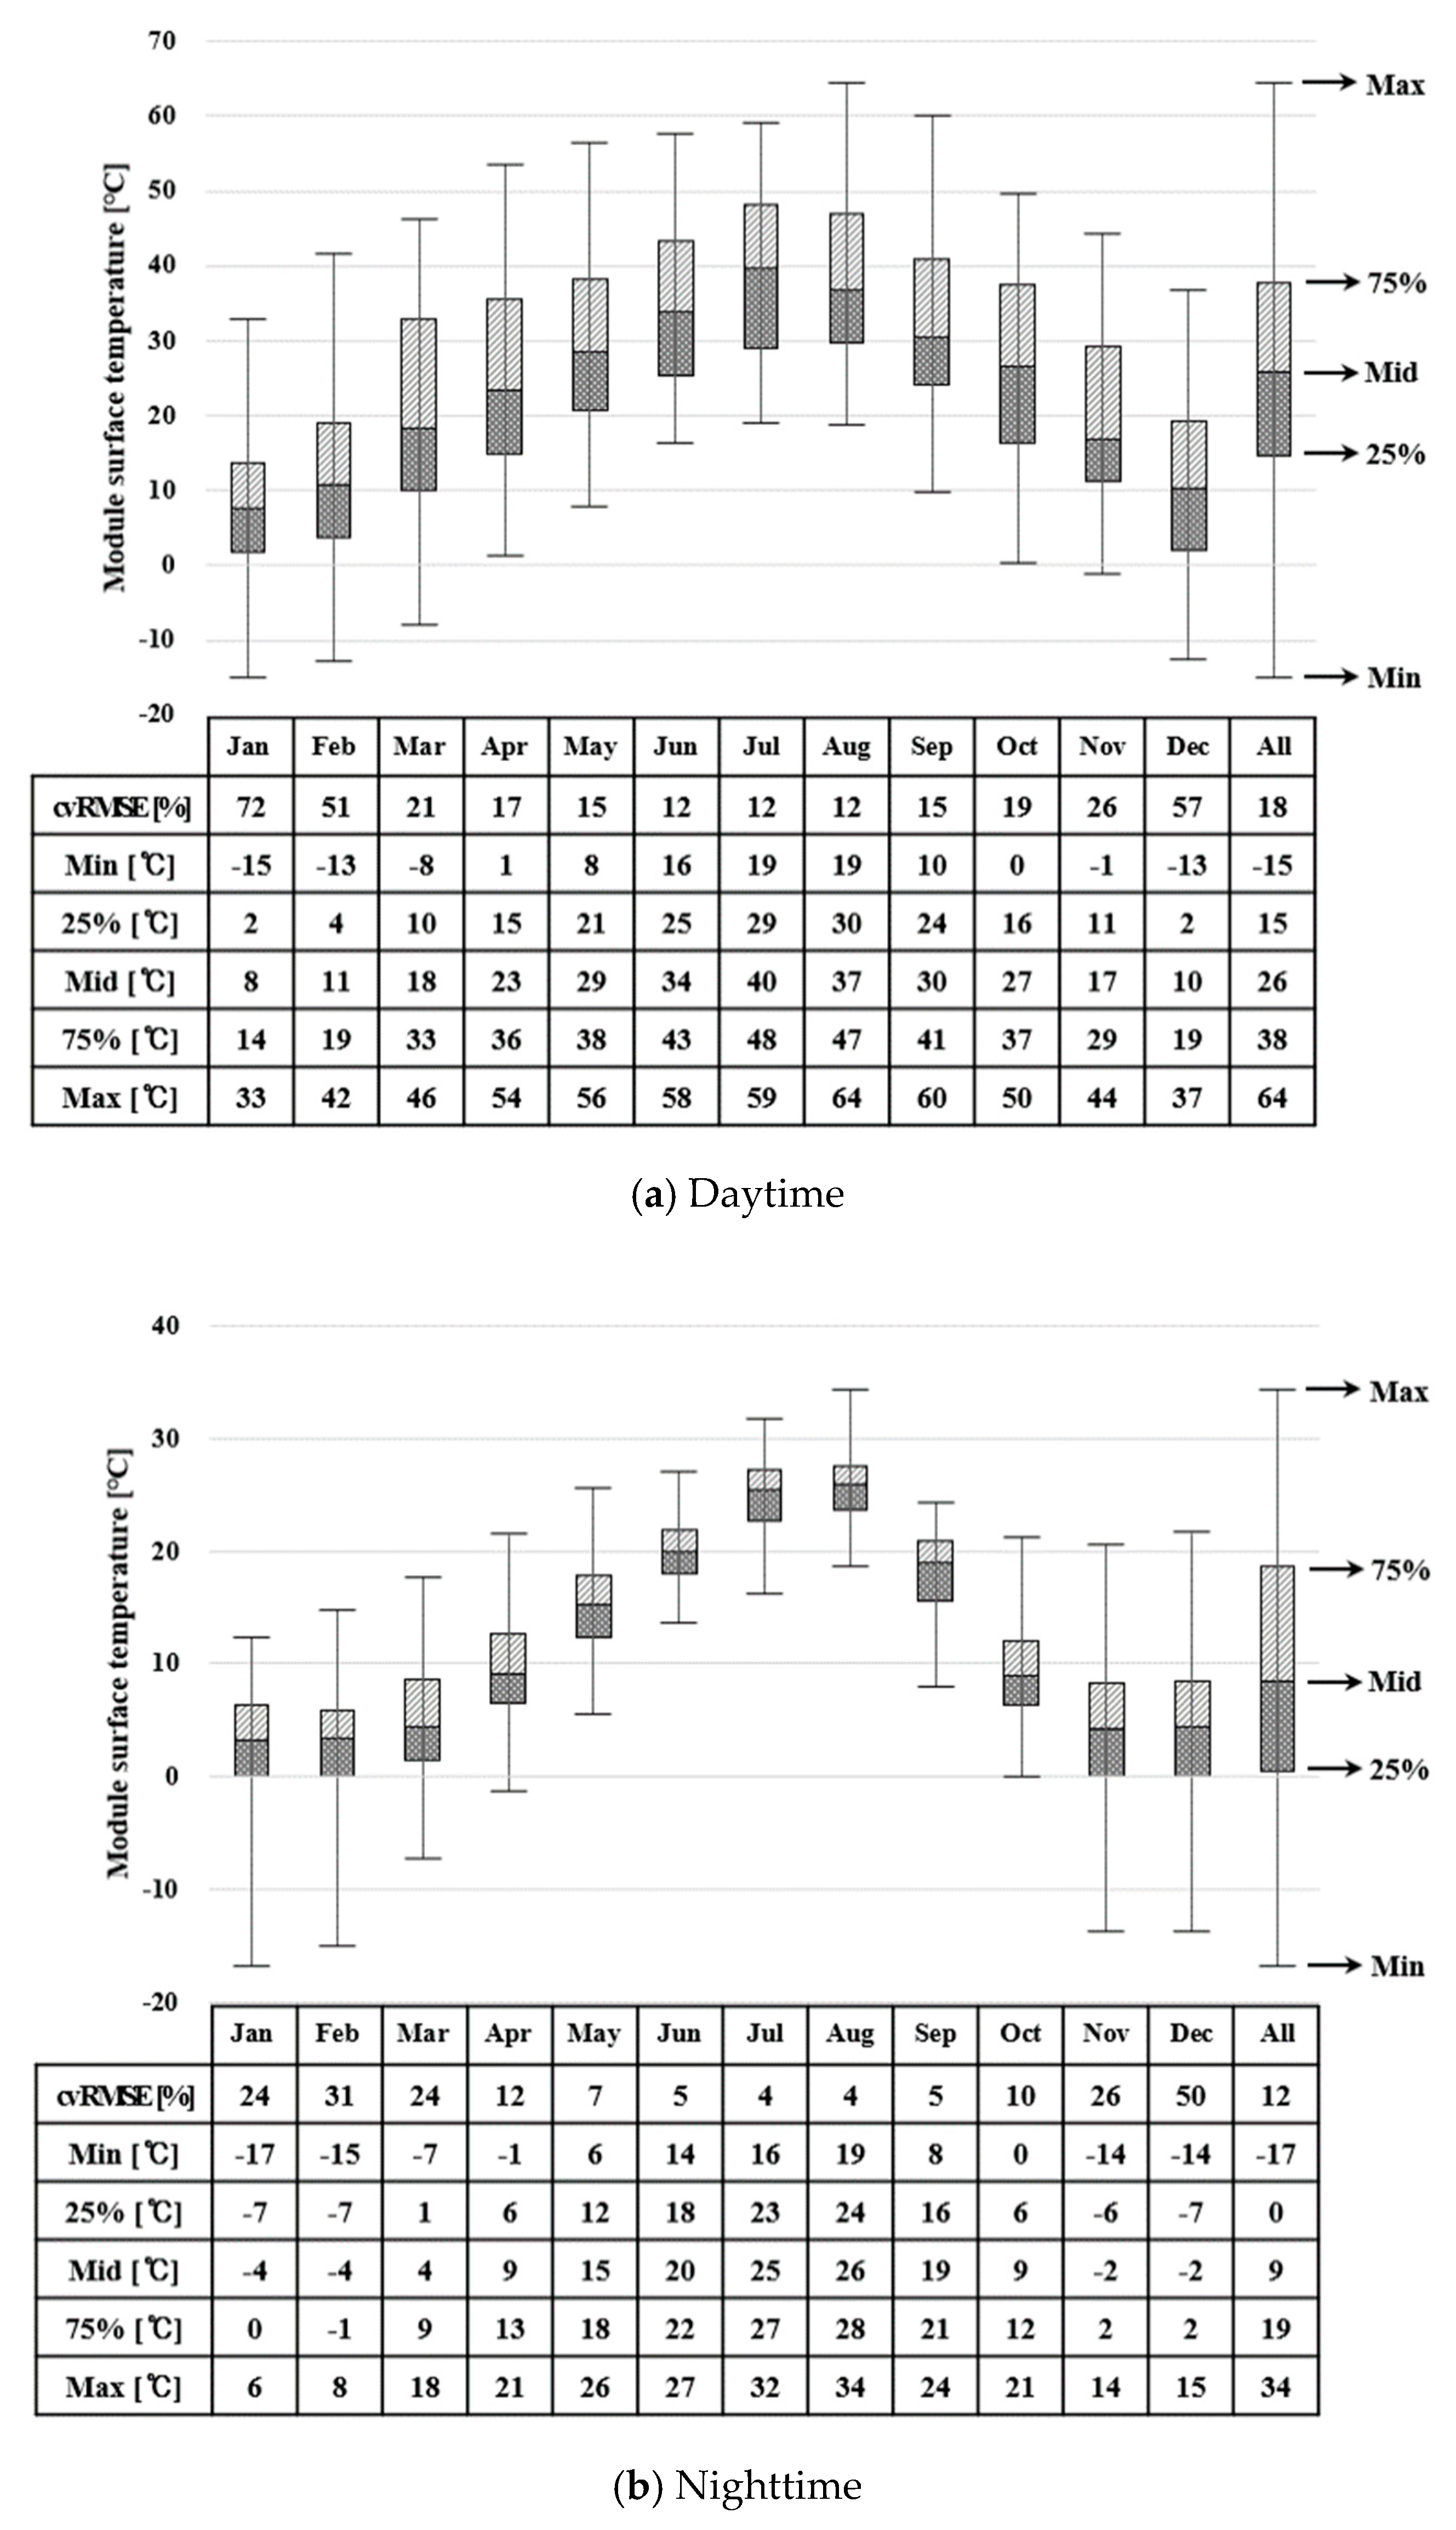
The accuracy of the predicted module surface temperatures was evaluated by comparing them with the measured module surface temperatures. The module surface temperature analysis was performed in the daytime with solar radiation and also in the nighttime without solar radiation. Figure 8 shows the distribution of module surface temperatures and cvRMSE by each month. In the figure, the Min, 25%, Mid, 75%, and Max refer to the minimum, 25% (first quartile value), median, 75% (third quartile value), and maximum values, respectively.
In terms of the distribution of predicted module surface temperatures for the daytime, the cvRMSE was about 18% and satisfied ASHRAE Guideline 14. The 25~75% values of the annual module surface temperature showed a distribution of about 15 °C~38 °C. The accuracy of module surface temperature for winter (January, February, and December) was relatively low. On the other hand, the cvRMSE was about 12~26% for the rest of the year (March–November) and satisfied the criteria specified in ASHRAE Guideline 14.
In terms of the distribution of the predicted module surface temperatures for the nighttime, the cvRMSE was about 12% and satisfied ASHRAE Guideline 14. The 25~75% values of the annual module surface temperature showed a distribution of about 0 °C~19 °C. Unlike the daytime value, the cvRMSE ranged from 4% to 26% and satisfied ASHRAE Guideline 14 during all periods except the months of February and December. The predictive performance of the annual module surface temperature for the nighttime was about 6% higher than that of the daytime and about 8% higher than that of the entire period.
Therefore, the developed model was able to predict the module surface temperatures for the entire period, daytime, and nighttime, among which the predictive performance for nighttime was considered the best.
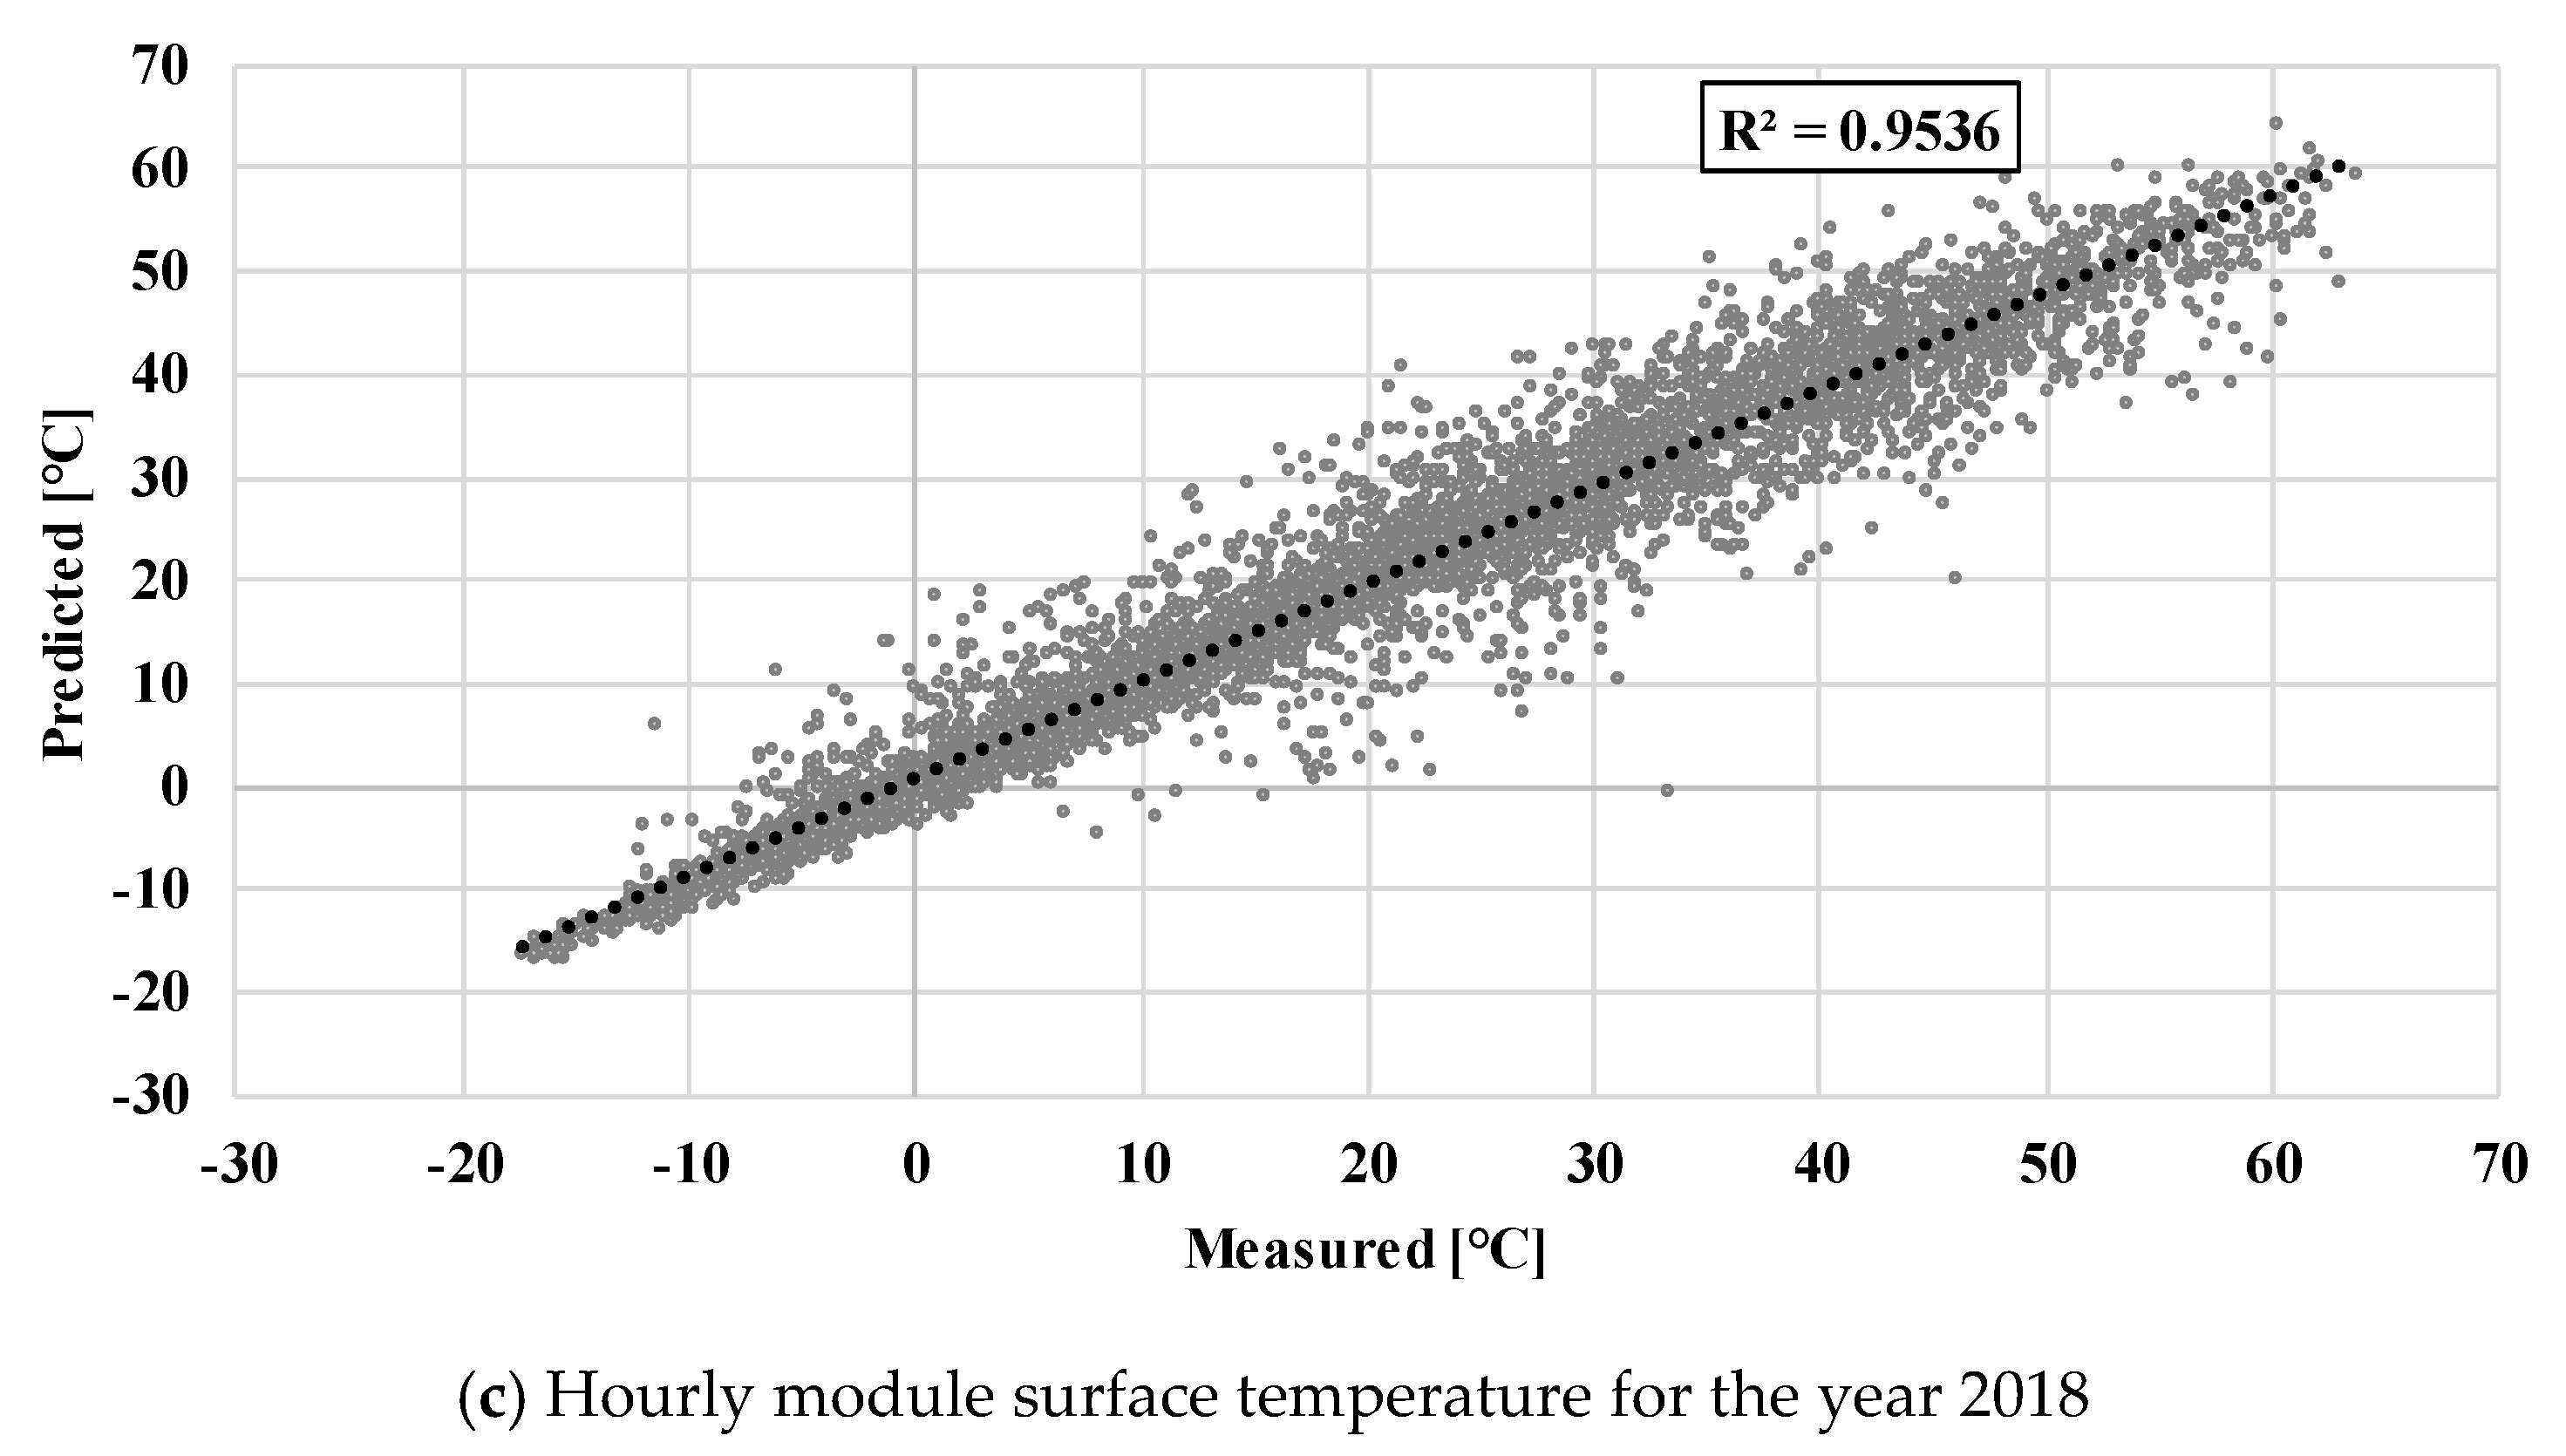
As mentioned above, the accuracy of predicting the module surface temperatures for winter was relatively low. However, the trend of predicted module surface temperature needs to be examined because the results derived from cvRMSE evaluation are numerical indicators. Figure 9 shows graphs comparing the predicted module surface temperatures with the measured data.
Figure 9a compares the hourly module surface temperatures for winter (January). The cvRMSE results show that the predictive performance for January was low but relatively similar to the measured data. Figure 9b compares the hourly module surface temperatures for summer (August). The predicted module temperatures were also similar to the measured data.
Figure 9c shows a graph comparing the hourly module surface temperature for the year 2018. The predicted data were similar to the measured data. The predictive model’s R2 was 0.9536 and predicted the measured data with high accuracy. The results show that the model has excellent performance in predicting module surface temperature.
5.2. Module Efficiency According to the Module Surface Temperature
The results in Section 5.1 show that the developed model has excellent predictive performance. Based on this, the predictive model is expected to show high performance in calculating power generation. As noted in the introduction, the module surface temperature affects the efficiency and power generation of PV systems. In particular, the efficiency of PV systems decreases as the module surface temperature increases. Therefore, this section calculates and evaluates power generation efficiency by reflecting the predicted module surface temperature. The power generation efficiency of PV modules is calculated as shown in Equation (4) [4].
where is the actual module efficiency (%), is the rated efficiency (%), is the temperature coefficient (°C−1), is the module surface temperature (°C), and is the reference temperature of the rated efficiency (°C). This study used 0.0045 °C−1 for and 25 °C for , which are typical general electrical characteristics at STC (standard test conditions) [4].
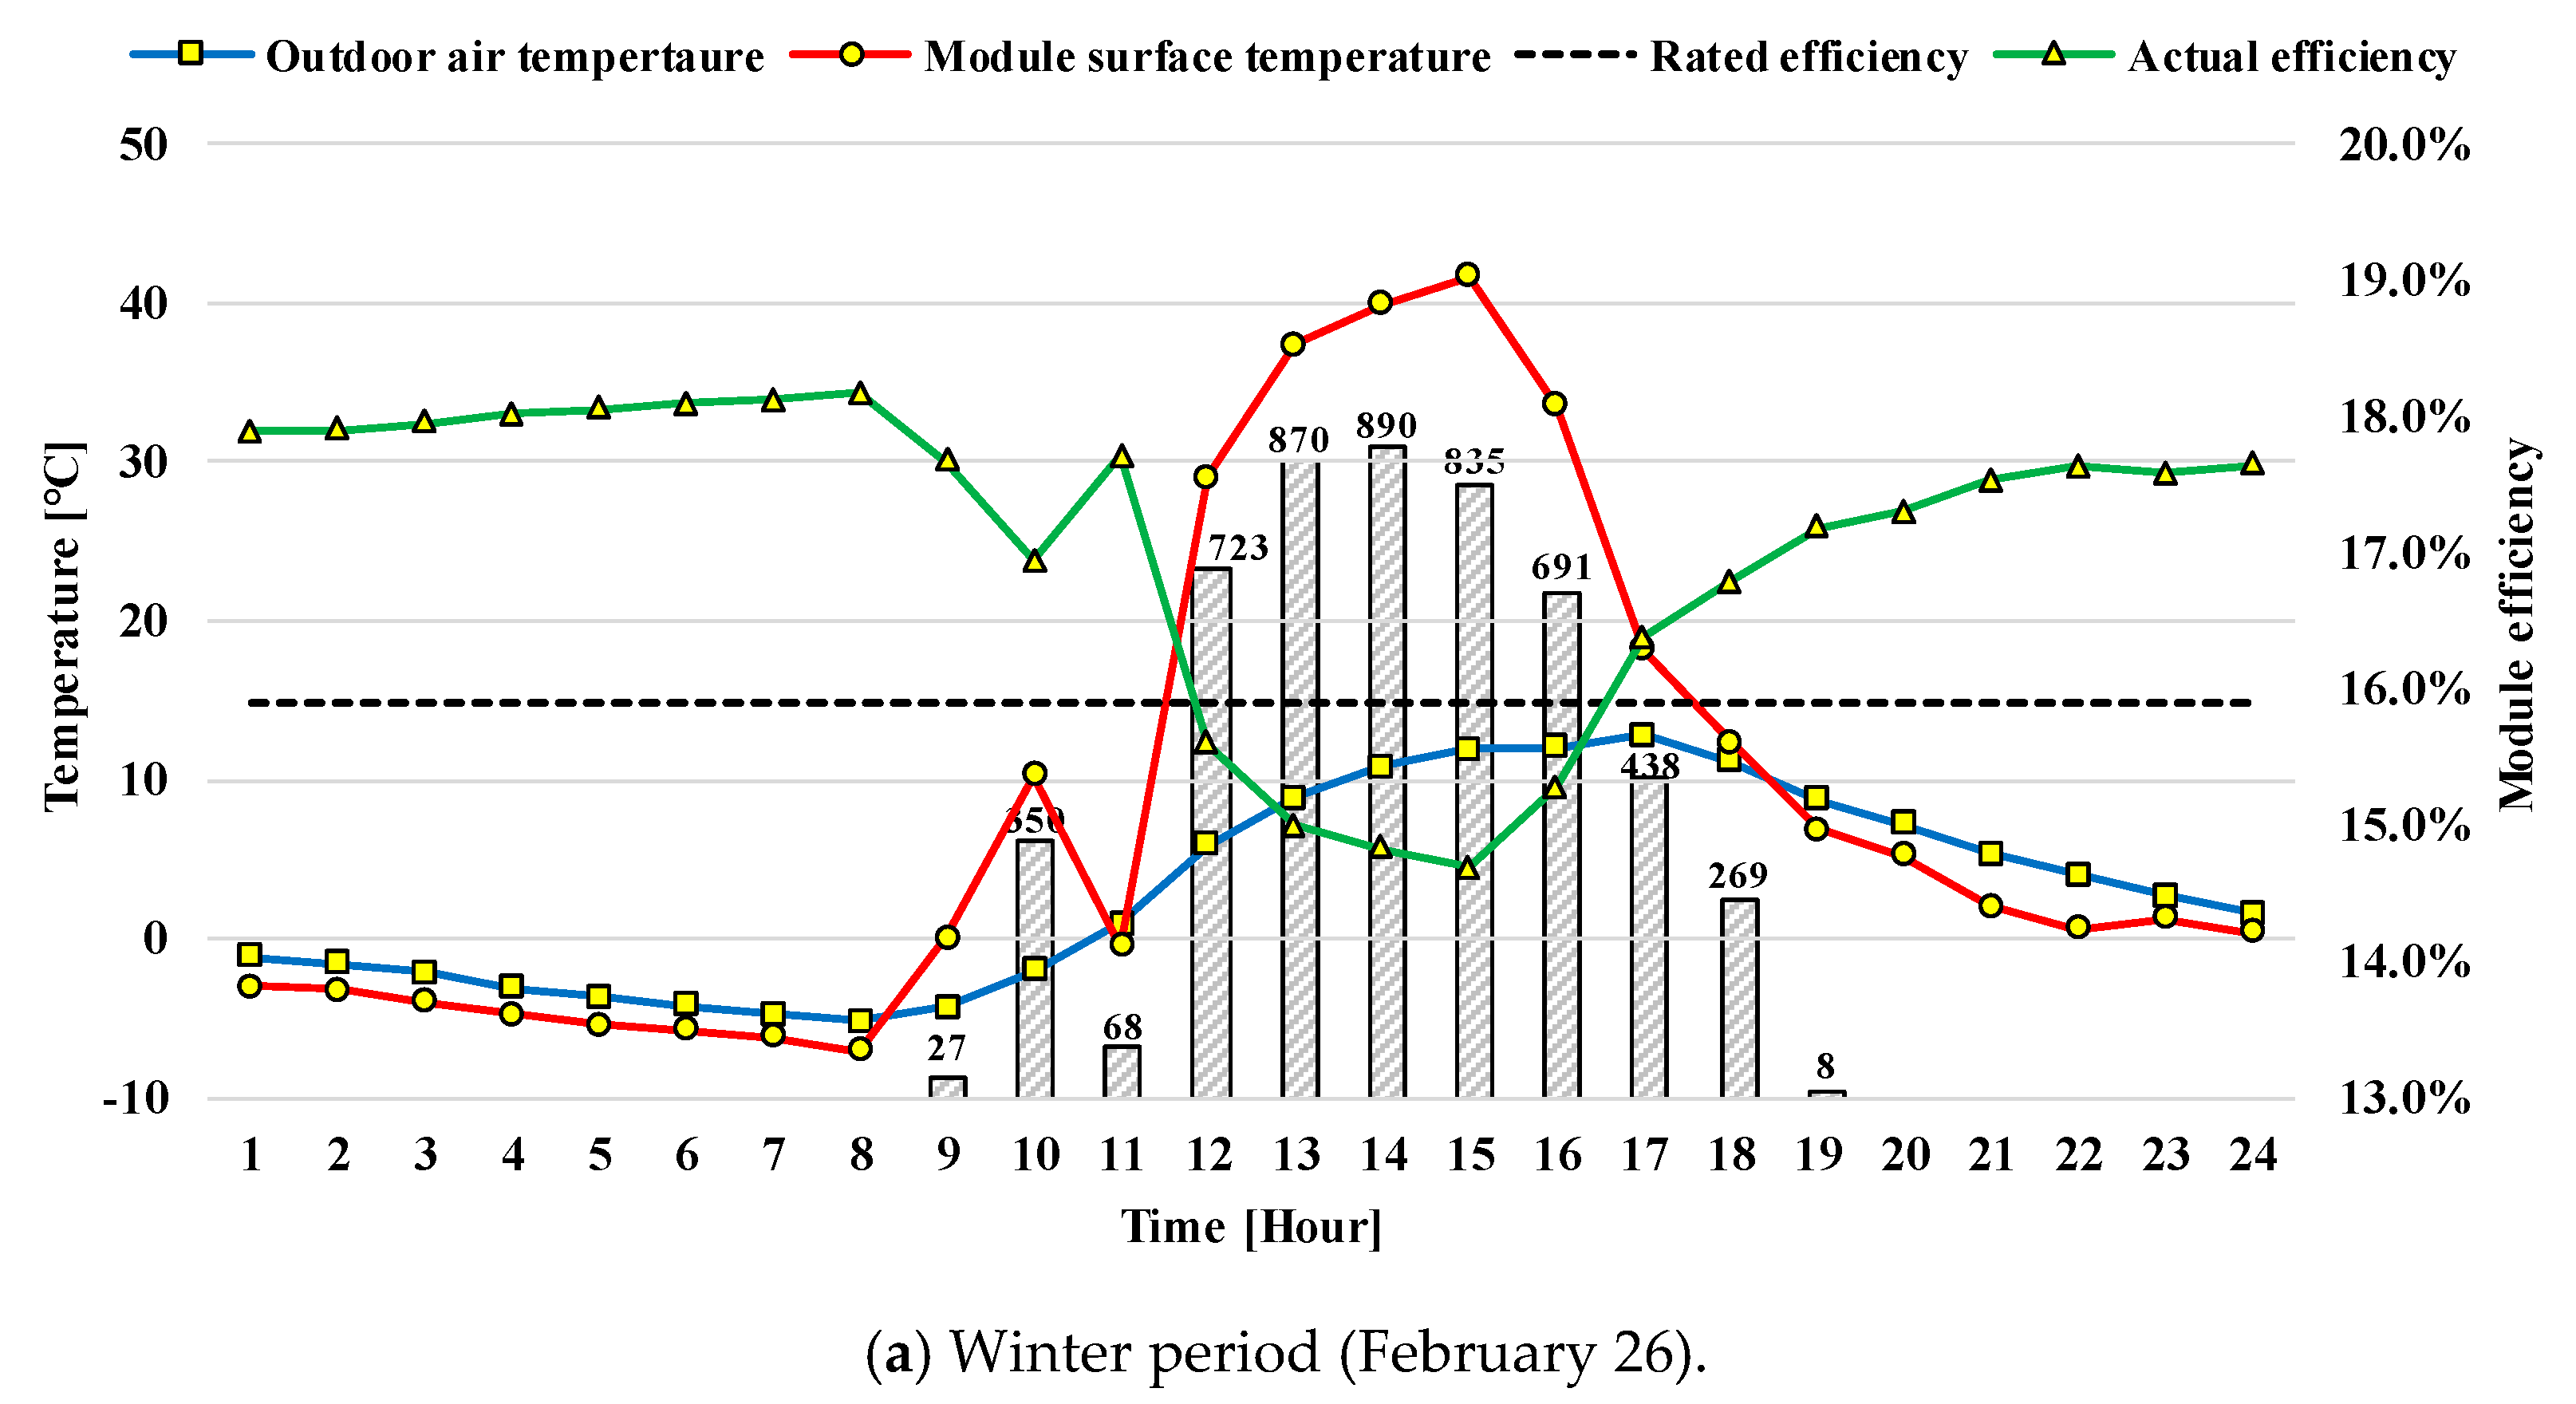
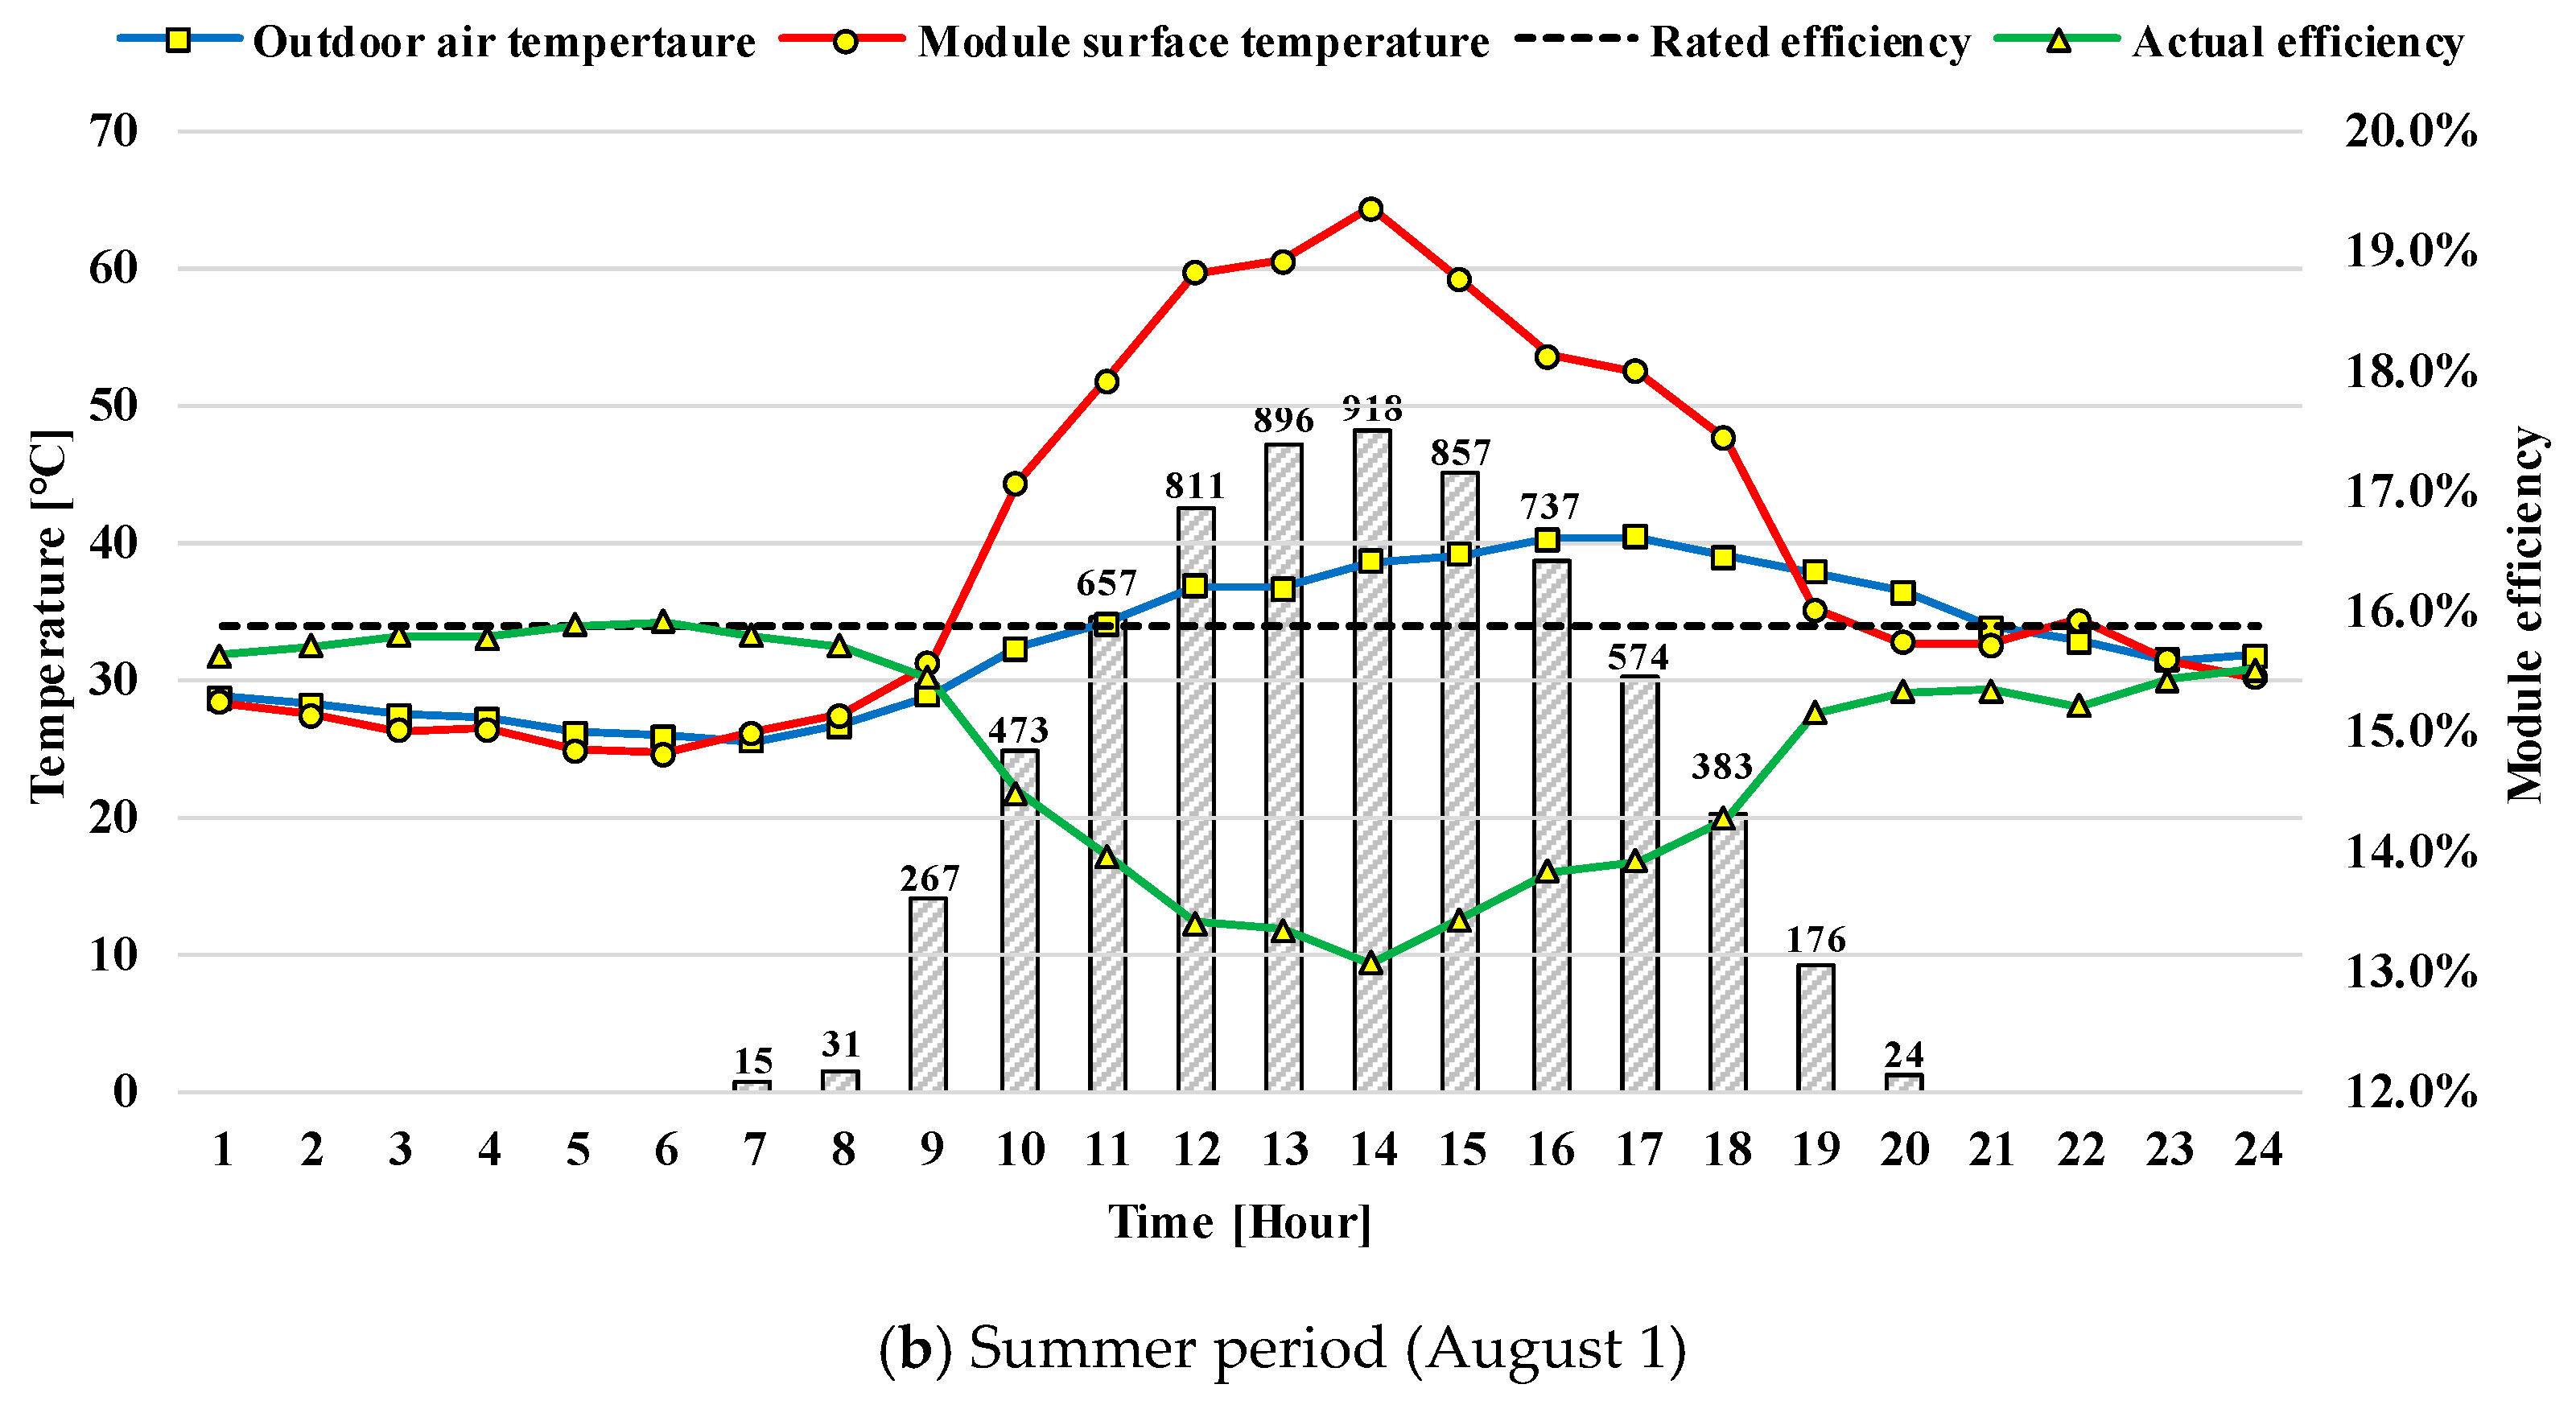
Figure 10 shows a graph of the PV system power generation efficiency according to the module surface temperature. The bar graphs with the data label indicate solar radiation in W/m2. The analysis was based on the days when the module surface temperature was highest during winter and summer (February 26 and August 1), where the rated efficiency of the PV system is 15.89% (see Table 2).
In winter, the actual efficiency was between 14.7% and 18.2%. The actual efficiency decreased as the module surface temperature increased. It also changed in inverse proportion to the module surface temperature. In particular, the actual efficiency was lower than the rated efficiency from 12:00 to 16:00 when solar radiation is concentrated. When the module surface temperature rose to 41.7 °C, the actual efficiency was about 14.7%, 1.2% lower than the rated efficiency. When there was no or low solar radiation in winter, the actual efficiency was about 2.4% higher than the rated efficiency. In summer, the actual efficiency was between 13.1% and 15.9%. Similar to winter, the actual efficiency decreased as the module surface temperature increased. When the module surface temperature rose to 64.4°C, the actual efficiency was about 13.1%, 2.7% lower than the rated efficiency. These results show that the efficiency decreases as the module surface temperature increases.
5.3. Electricity Power Generation
According to the analysis results in Section 5.2, the module efficiency changes according to the module surface temperature. In particular, the module efficiency decreased as the module surface temperature increased. This is consistent with the results of previous studies [4,5,6,7]. Therefore, this study evaluated the effect of the changed efficiency on power generation. Equation (5) shows how to calculate the power generation [10].
where is the actual module power generation (W), is the module surface area (m2), is the solar radiation (W/m2), and is the actual module efficiency (%) [10].
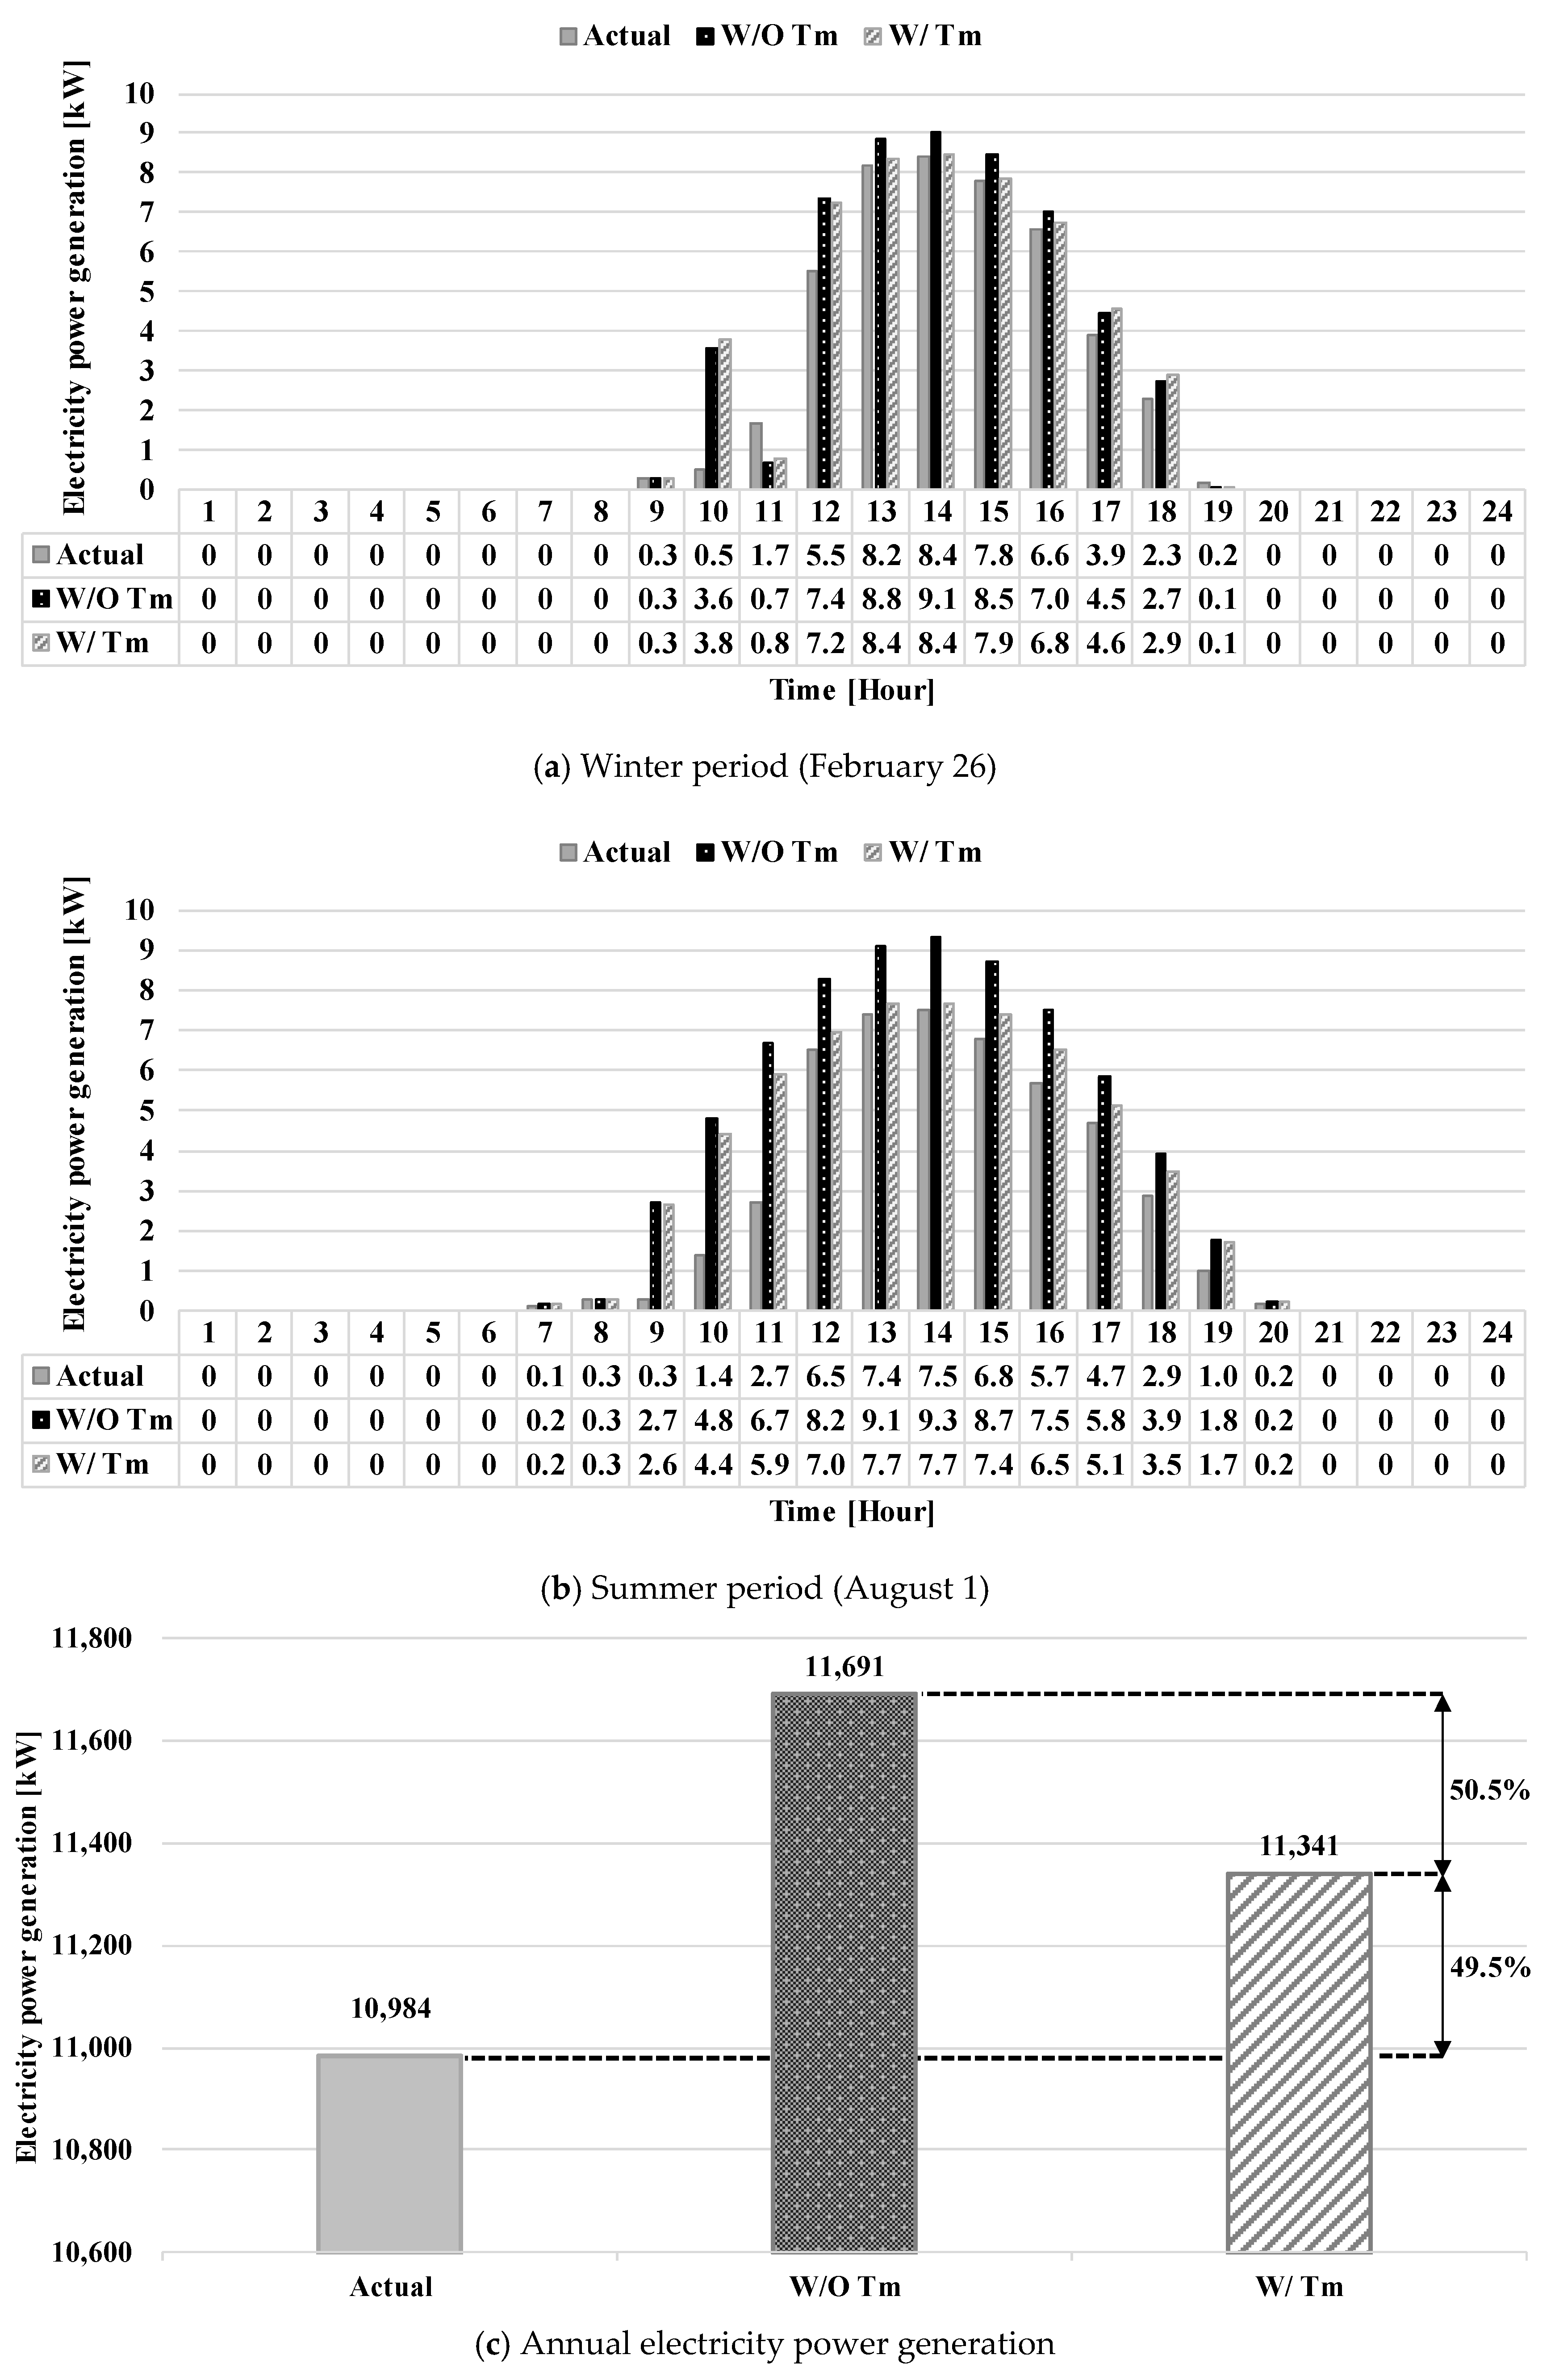
Figure 11 shows the amount of power generated by the PV system. Figure 11a,b shows the power generated during the periods analyzed in Section 5.2, and Figure 11c shows the annual cumulative power generation. In terms of power generation, this study compared the measured data (actual), the data without considering module surface temperature (i.e., W/O Tm), and the data considering module surface temperature (i.e., W/Tm).
As a result of analyzing the power generation in winter, the maximum power generated per hour of W/O Tm and W/Tm were 9.1 kW and 8.4 kW, respectively. W/Tm was similar to the actual amount of power generated. In addition, W/ Tm was similar to the actual power generation between 13:00 and 16:00 when there was high solar radiation. On the other hand, W/Tm was higher than W/O Tm between 10:00–11:00 and 17:00–18:00. This is due to the results (increased efficiency) of Figure 10a. In terms of the daily cumulative power generation, actual (45 kW) was about 18% lower than W/O Tm (53 kW) and 4% lower than W/Tm (51 kW).
As a result of analyzing the power generation in summer, the maximum power generated per hour of W/O Tm and W/Tm were 9.3 kW and 7.7 kW, respectively. The power generation of W/Tm was similar to the actual amount of power generated. In contrast to winter, W/Tm was always lower than W/O Tm in terms of the power generated in summer. In the case of the daily cumulative power generation, actual (48 kW) was about 44% lower than W/O Tm (69 kW) and W/Tm (60 kW) was about 15% lower than W/O Tm.
The annual cumulative power generation was 10,984 kW for actual, 11,691 kW for W/O Tm, and 11,341 kW for W/ Tm. In terms of power generation, actual was about 707 kW lower than W/O Tm and W/Tm was about 350 kW lower than W/O Tm. In terms of relative error, the power generation of W/Tm considering module surface temperature was about 50.5% lower than that of W/O Tm without considering module surface temperature. These results show that considering the module surface temperature is advantageous for calculating the power generation more accurately. These results will help calculate system capacity and prevent overdesign in the future.
6. Summary and Conclusions
In general, PV efficiency is determined by weather conditions and affects the amount of power generated. PV efficiency changes according to not only solar radiation but also to module surface temperature. In particular, the efficiency decreases as the module surface temperature rises. Therefore, analyzing the module surface temperature is an essential process in the evaluation of the performance of PV systems.
Therefore, this study developed a predictive model for module surface temperatures to analyze the efficiency and power generation according to module surface temperatures. Unlike conventional methods, the developed model predicts the module surface temperature of the next hour using data from the previous hour. This model uses ANN. Based on the analysis of the results, the findings of this study are as follows.
- The initial predictive model consisted of NHN = 13, NHL = 1, LR 0.3, and MC 0.3. The model’s cvRMSE was 22.00%. However, the predictive model’s accuracy was improved through an optimization process. The optimized predictive model showed the highest accuracy when NHN = 16, NHL = 5, LR 0.3, and MC 0.3. Under this configuration, the cvRMSE was 19.81%, an improvement of 2.19% over the initial predictive model. This model satisfied the recommendations specified in ASHRAE Guideline 14. In terms of the regression analysis results, the R2 value of the optimized predictive model was 0.97 for training, 0.97 for validation, 0.96 for test, and 0.97 overall. This shows that the optimized predictive model has high accuracy.
- The accuracy of module surface temperatures was higher during the nighttime than the daytime and higher in the summer than in winter. As a result of evaluating the annual cvRMSE, the daytime cvRMSE was about 18% and the nighttime cvRMSE was 12%. These results also satisfied the criteria specified in ASHRAE Guideline 14. In addition, the R2 value of the predicted annual module surface temperature was 0.95 when compared to the measured data. The model predicted the actual data with high accuracy. This shows that the developed model has high predictive performance.
- As a result of analyzing efficiency according to module surface temperature changes, the efficiency decreased as the module surface temperature increased. When the module surface temperature rose during winter, the actual efficiency was about 14.7%, 1.2% lower than the rated efficiency. When the module surface temperature rose to 64.4 °C in the summer, the actual efficiency was about 13% and 2.7% lower than the rated efficiency. These results show that the module surface temperature may have adverse effects on the actual PV efficiency.
- In terms of annual power generation, W/Tm considering module surface temperature was closer to the measured power generation than W/O Tm without considering module surface temperature. In the case of relative error, W/Tm was about 50.5% lower than W/O Tm. That is, W/Tm was closer to the actual amount of power generated. These results will help calculate system capacity and prevent overdesign in the future.
This study can help to estimate the module surface temperature, efficiency, and power generation. The predictive model developed in this study has the potential to improve the performance of PV systems. However, this model limited the number of input variables to five. This study assumed and considered that these five variables would have the greatest effect on module surface temperature, but other variables may affect the performance of PV systems. Therefore, further research should consider additional input variables that may affect the performance of PV systems. If various other input variables are further considered, this model will predict the performance of PV systems with higher accuracy.
Author Contributions
All authors contributed equally. Conceptualization, D.E.J., C.L., S.L.D.; methodology, D.E.J., S.L.D.; formal analysis, D.E.J., C.L., K.H.K., S.L.D.; data curation, D.E.J., C.L., S.L.D.; writing—original draft preparation, D.E.J., S.L.D.; writing—review and editing, S.L.D.; visualization, D.E.J., C.L., K.H.K., S.L.D.; supervision, S.L.D. All authors have read and agreed to the published version of the manuscript.
Funding
This study was supported by the Basic Science Research Program through the National Research Foundation of Korea (NRF) funded by the Ministry of Science, ICT and Future Planning [Grant No. 2020-201800440002-2018R1C1B600639913]. This work was also supported by the Korea Institute of Energy Technology Evaluation and Planning (KETEP) and the Ministry of Trade, Industry and Energy (MOTIE) of the Republic of Korea (No. 20204030200080).
Conflicts of Interest
The authors declare no conflict of interest.
References
- Ministry of Land Infrastructure and Transport. Green Buildings Construction Support Act, MOLIT, 2008, Act No. 15728. Available online: https://elaw.klri.re.kr/kor_service/lawView.do?hseq=50008&lang=ENG (accessed on 10 June 2020).
- Ministry of Trade, Industry and Energy. Electricity Power Supply and Demand Trend, MOTIE. 2019. Available online: http://www.index.go.kr (accessed on 10 June 2020).
- Ministry of Trade Industry and Energy. Renewable Energy 3020, MOTIE. 2017. Available online: https://english.motie.go.kr (accessed on 10 June 2020).
- Fesharaki, V.J.; Dehghani, M.; Fesharaki, J.J.; Tavasoli, H. The effect of temperature on photovoltaic cell efficiency. In Proceedings of the 1stInternational Conference on Emerging Trends in Energy Conservation–ETEC, Tehran, Iran, 20–21 November 2011. [Google Scholar]
- Romary, F.; Caldeira, A.; Jacques, S.; Schellmanns, A. Thermal modelling to analyze the effect of cell temperature on PV modules energy efficiency. In Proceedings of the 2011 14th European Conference on Power Electronics and Applications, Birmingham, UK, 30 August–1 September 2011. [Google Scholar]
- Dubey, S.; Sarvaiya, J.N.; Seshadri, B. Temperature dependent photovoltaic (PV) efficiency and its effect on PV production in the world–a review. Energy Procedia 2013, 33, 311–321. [Google Scholar] [CrossRef] [Green Version]
- El-Adaw, M.K.; Shalaby, S.A. Effect of Solar Cell Temperature on its Photovoltaic Conversion Efficiency. Int. J. Sci. Eng. Res. 2015, 6, 1356–1384. [Google Scholar]
- King, D.L.; Kratochvil, J.A.; Boyson, W.E.; Bower, W.I. Field Experience with A New Performance Characterization Procedure for Photovoltaic Arrays. Presented at the 2nd World Conference and Exhibition on Photovoltaic Solar Energy Conversion, Vienna, Austria, 6–10 July 1998. [Google Scholar]
- Tamizhmani, G.; Ji, L.; Tang, Y.; Petacci, L. Photovoltaic Module Thermal/Wind Performance: Long-term Monitoring and Model Development for Energy Rating; National Renewable Energy Laboratory: Golden, CO, USA, 2003; pp. 936–939. [Google Scholar]
- Duffie, J.A.; Beckman, W.A. Solar Engineering of Thermal Processes, 4th ed.; Wiley: Toronto, ON, Canada, 2013; pp. 757–759. [Google Scholar]
- Skoplaki, A.G.; Boudouvis, J.A. A Simple Correlation for the Operating Temperature of Photovoltaic Modules of Arbitrary Mounting. Solar Energy Mater. Solar Cells 2008, 92, 1393–1402. [Google Scholar] [CrossRef]
- Schwingshackl, C.; Petitta, M.; Wagner, J.E.; Belluardo, G. Wind Effect on PV Module Temperature: Analysis of Different Techniques for an Accurate Estimation. Energy Procedia 2013, 40, 77–86. [Google Scholar] [CrossRef] [Green Version]
- Hassan, Q.; Jaszczur, M.; Przenzak, E.; Abdulateef, J. The PV cell temperature effect on the energy production and module efficiency. In Contemporary Problems of Power Engineering and Environmental Protection; Department of Technologies and Installations for Waste Management: Gliwice, Poland, 2016; Volume 33. [Google Scholar]
- Davis, M.W.; Fanney, A.H.; Dougherty, B.P. Prediction of building integrated photovoltaic cell temperatures. In Proceedings of the American Society of Mechanical Engineers Conference, Washington, DC, USA, 21–25 April 2001. [Google Scholar]
- Alonso Garcia, M.C.; Blaenzategui, J.L. Estimation of photovoltaic module yearly temperature and performance based on Nominal Operation Cell Temperature calculations. Renew. Energy 2004, 29, 1997–2010. [Google Scholar] [CrossRef]
- Mattei, M.; Notton, G.; Cristofari, C.; Muselli, M.; Poggi, P. Calculation of the polycrystalline PV module temperature using a simple method of energy balance. Renew. Energy 2006, 31, 553–567. [Google Scholar] [CrossRef]
- Kurtz, S.; Whitfield, K.; Miller, D.; Joyce, J.; Wohlgemuth, J.; Kempe, M.; Dhere, N.; Bosco, N.; Zgoena, T. Evaluation of high-temperature exposure of photovoltaic modules. Prog. Photovolt. Res. Appl. 2011, 19, 954–965. [Google Scholar] [CrossRef] [Green Version]
- Brano, V.L.; Ciulla, G.; Falco, M.D. Artificial neural networks to predict the power output of a PV panel. Int. J. Photoenergy 2014, 2014. [Google Scholar] [CrossRef]
- Ceylan, İ.; Erkaymaz, O.; Gedik, E.; Gürel, A.E. The prediction of photovoltaic module temperature with artificial neural networks. Case Stud. Therm. Eng. 2014, 3, 11–20. [Google Scholar] [CrossRef] [Green Version]
- Olukan, T.A.; Emziane, M. A comparative analysis of PV module temperature models. Energy Procedia 2014, 62, 694–703. [Google Scholar] [CrossRef] [Green Version]
- Ayvazogluyuksel, O.; Filik, U.B. Power output forecasting of a solar house by considering different cell temperature methods. In Proceedings of the ELECO 2017 10th International Conference on Electrical and Electronic Engineering, Bursa, Turkey, 30 November–2 December 2017. [Google Scholar]
- Kamuyu, W.C.L.; Lim, J.R.; Won, C.S.; Ahn, H.K. Prediction model of photovoltaic module temperature for power performance of floating PVs. Energies 2018, 11, 447. [Google Scholar] [CrossRef] [Green Version]
- Chayapathy, V.; Anitha, G.S.; Raghavendra, P.S.G.; Vijaykumar, R. Solar Panel Temperature Prediction By Artificial Neural Networks. In Proceedings of the 2019 4th International Conference on Recent Trends on Electronics, Information, Communication & Technology (RTEICT-2019), Bengaluru, India, 17–18 May 2019. [Google Scholar]
- Hegazy, A.; Shenawy, E.T.E.; Ibrahim, M.A. Determination of the PV Module Surface Temperature Based on Neural Network using Solar Radiation and Surface Temperature. ARPN J. Eng. Appl. Sci. 2019, 14, 494–503. [Google Scholar]
- MathWorks. Available online: http://www.mathworks.com (accessed on 10 June 2020).
- Marquardt, D.W. An Algorithm for Least-Squares Estimation of Nonlinear Parameters. J. Soc. Ind. Appl. Math. 1963, 11, 431–441. [Google Scholar] [CrossRef]
- Korea Meteorological Administration. Available online: https://data.kma.go.kr (accessed on 10 June 2020).
- S-Energy. SN72 Cell 1,000V Polycrystalline PV Module Catalogue, Korea. 2018. Available online: http://www.s-energy.com (accessed on 10 June 2020).
- Hargan, M.R. ASHRAE Guideline 14-2002 Measurement of Energy and Demand Savings; American Society of Heating Refrigerating and Air-Conditioning Engineers (ASHRAE) Inc.: Atlanta, GA, USA, 2002. [Google Scholar]
- Moon, J.W.; Kim, K.; Min, H. ANN-based prediction and optimization of cooling system in hotel rooms. Energies 2015, 8, 10775–10795. [Google Scholar] [CrossRef] [Green Version]
Figure 1.
Photos for the photovoltaic system and sensors.

Figure 2.
Overall study process.

Figure 3.
Brief steps for the ANN (artificial neural network) model development.

Figure 4.
Diagram of the initial ANN model.

Figure 5.
Diagram of the optimized ANN model.

Figure 6.
MSE (root mean squared error) analysis of the optimized ANN model.

Figure 7.
Regression analysis on the optimized ANN model.

Figure 8.
Distribution of monthly module surface temperatures.

Figure 9.
Comparison of the measured and predicted module surface temperatures.


Figure 10.
Module efficiency according to the module surface temperature.


Figure 11.
Electricity power generation according to improvement of the module efficiency.


Table 1.
Literature reviews of photovoltaic (PV) cell (or module) surface temperature.
| Reference Number | Year | Objective | Location | PV Type | Methodology | Calculation Models | Input Parameters | Output Parameters | Accuracy | Analysis Parameters | |
|---|---|---|---|---|---|---|---|---|---|---|---|
| Experiment | Simulation | ||||||||||
| [14] | 2001 | Computation of the operating cell temperature | Maryland, US | Single Crystalline, Poly-Si, Si-Film, Triple-junction, A-Si | ○ | × | 1D steady state heat-transfer model | Solar radiation, Ambient temperature, Cell efficiency, Transmittance, Absorbance | Operating cell temperature | Relative error −12.1~10.6% | Cell temperature, Power |
| [9] | 2003 | Prediction of PV cell temperature | Arizona, US | Mono-Si, Poly-Si, A-Si, CIS, EFG-Poly-Si, CdTe | ○ | ○ | Linear regression model | Solar radiation, Ambient temperature, Wind speed, Wind direction, Relative humidity | Cell temperature | R2 = 0.943 | Cell temperature |
| [15] | 2004 | Estimation of PV module temperature and performance | Madrid, Spain | Semitransparent A-Si | ○ | ○ | Previous model | Solar radiation, Ambient temperature | Nominal operation cell temperature | Inaccuracy = ±3 °C | Cell temperature |
| [16] | 2006 | Development of a PV module temperature model | Ajaccio, France | Crystalline-Si | ○ | × | Modified model of previous model | Solar radiation, Ambient temperature, Wind speed, Convection coefficient | Cell temperature | RMSE = 2.24 °C | Cell temperature, Efficiency, Power |
| [17] | 2009 | Evaluation of PV cell temperature | Florida, US Colorado, US | Silicon Ribbon Module | ○ | × | Modified model of previous model | Solar radiation, Ambient temperature, Wind speed | Cell temperature | Unknown | Cell temperature |
| [18] | 2013 | Prediction of PV cell temperature | Palermo, Italy | Mono-Si, Poly-Si | ○ | ○ | Artificial neural network model | Power, Solar radiation, Weighting factor, Outdoor air temperature, Short circuit current, Open circuit voltage | Cell temperature | MAE ± 0.23 °C, ±0.11 °C | Cell temperature |
| [19] | 2014 | Prediction of PV cell temperature | Aegean, Turkey | Poly-Si | ○ | ○ | Artificial neural network model | System outlet air temperature, Solar radiation | Cell temperature | R2 = 0.99 | Cell temperature, Efficiency, Power |
| [20] | 2014 | Development of a 3D thermal model to predict the PV module temperature | Abu Dhabi, UAE | Poly-Si | ○ | × | 3D thermal model | Solar radiation, Ambient temperature, Wind speed, Heat loss coefficients | Cell temperature | RMSE < 1, MBE < 2 | Cell temperature, Power |
| [21] | 2017 | Forecasting of PV power considering cell temperature | Eskisehir, Turkey | Unknown | ○ | × | Previous model | Solar radiation, Ambient temperature, Wind speed, Convection coefficient | Cell temperature | RMSE = 2.23 °C MBE = 1.09 °C MABE = 1.82 °C | Cell temperature, Power |
| [22] | 2018 | Prediction of PV cell temperature | Hapcheon, Korea | Crystalline-Si | ○ | ○ | Multiple linear equation | Solar Radiation, Ambient temperature, Wind speed, Water temperature | Cell temperature | Relative error 2.06%, 4.40% | Cell temperature, Efficiency |
| [23] | 2019 | Prediction of PV cell temperature | Bengaluru, India | Unknown | ○ | ○ | Artificial neural network model | Solar radiation, Ambient temperature, Wind speed, Relative humidity, Panel temperature | Cell temperature | MAE = 0.9965 °C | Cell temperature |
| [24] | 2019 | Prediction of PV cell temperature | Cairo, Egypt | A-Si | ○ | ○ | Neural network model | Solar radiation, Ambient temperature | Cell temperature | 96% of accuracy | Solar radiation, Cell temperature |
Table 2.
Dataset parameters and value ranges.
| Parameters | Values |
|---|---|
| Outdoor air temperature (°C) | −16.2~40.4 |
| Wind speed (m/s) | 0~8.3 |
| Solar radiation (W/m2) | 0~1041.0 |
| Humidity (%) | 14.0~98.0 |
| Cloud cover (-) | 0~10.0 |
| Module surface temperature (°C) | −17.3~63.8 |
Table 3.
Electrical characteristics of the photovoltaic (PV) system (PV module name: SN310P-23 [28]).
Table 3.
Electrical characteristics of the photovoltaic (PV) system (PV module name: SN310P-23 [28]).
| Parameters | Values |
|---|---|
| Rated power (W) | 310 W |
| Voltage at Pmax (V) | 36.3 V |
| Current at Pmax (A) | 8.54 A |
| Warranted minimum Pmax (W) | 310 W |
| Short-circuit current (Isc) (A) | 8.96 A |
| Open-circuit current (Voc) (V) | 45.4 V |
| Module efficiency (%) | 15.89% |
| Operating module temperature (°C) | −40~+85 °C |
| Maximum system voltage (V) | 1000 V (IEC) |
| Maximum series fuse rating (A) | 15 A |
| Maximum reverse current (A) | 20.25 A |
| Power tolerance (W) | 0/+5 W |
Table 4.
Specification of sensors.
| Measurements | Measurement Point | Type | Non-Stability |
|---|---|---|---|
| Solar radiation | Top side | Si-pyranometer (Class: C) | ±2% |
| Outdoor temperature | Back side | RTD (Class: B) | ±0.25% |
| Module surface temperature | Back side | RTD (Thin film) | ±0.5% |
Table 5.
The coefficient of variation of the root mean squared error (cvRMSE) (%) according to the number of hidden neurons and layers.
Table 5.
The coefficient of variation of the root mean squared error (cvRMSE) (%) according to the number of hidden neurons and layers.
| NHN | 8 | 9 | 10 | 11 | 12 | 13 | 14 | 15 | 16 | 17 | 18 | |
|---|---|---|---|---|---|---|---|---|---|---|---|---|
| NHL | ||||||||||||
| 1 | 23.39 | 22.02 | 22.18 | 21.57 | 22.62 | 22.35 | 21.85 | 21.33 | 21.42 | 21.42 | 21.66 | |
| 2 | 21.34 | 20.88 | 22.21 | 21.25 | 21.97 | 21.69 | 21.28 | 20.96 | 21.60 | 21.86 | 20.86 | |
| 3 | 21.17 | 21.71 | 21.43 | 21.41 | 21.30 | 21.43 | 21.23 | 20.61 | 22.10 | 20.83 | 21.04 | |
| 4 | 21.08 | 22.10 | 21.92 | 20.54 | 21.25 | 21.33 | 21.09 | 21.85 | 21.25 | 20.70 | 20.58 | |
| 5 | 21.58 | 21.09 | 23.41 | 20.90 | 21.10 | 21.61 | 21.12 | 21.98 | 19.81 | 21.65 | 20.93 | |
© 2020 by the authors. Licensee MDPI, Basel, Switzerland. This article is an open access article distributed under the terms and conditions of the Creative Commons Attribution (CC BY) license (http://creativecommons.org/licenses/by/4.0/).
Share and Cite
MDPI and ACS Style
Jung, D.E.; Lee, C.; Kim, K.H.; Do, S.L. Development of a Predictive Model for a Photovoltaic Module’s Surface Temperature. Energies 2020, 13, 4005. https://0-doi-org.brum.beds.ac.uk/10.3390/en13154005
AMA Style
Jung DE, Lee C, Kim KH, Do SL. Development of a Predictive Model for a Photovoltaic Module’s Surface Temperature. Energies. 2020; 13(15):4005. https://0-doi-org.brum.beds.ac.uk/10.3390/en13154005
Chicago/Turabian StyleJung, Dong Eun, Chanuk Lee, Kee Han Kim, and Sung Lok Do. 2020. "Development of a Predictive Model for a Photovoltaic Module’s Surface Temperature" Energies 13, no. 15: 4005. https://0-doi-org.brum.beds.ac.uk/10.3390/en13154005
Note that from the first issue of 2016, this journal uses article numbers instead of page numbers. See further details here.