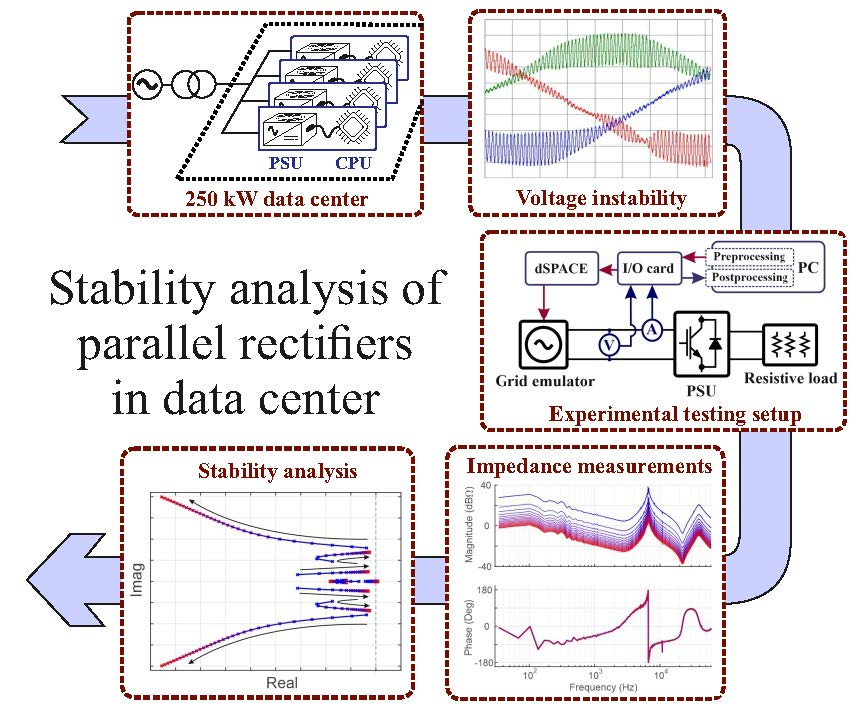
Impedance-Based Stability Analysis of Paralleled Grid-Connected Rectifiers: Experimental Case Study in a Data Center


Faculty of Information Technology and Communication Sciences, Tampere University, 33720 Tampere, Finland
*
Author to whom correspondence should be addressed.
Energies 2020, 13(8), 2109; https://0-doi-org.brum.beds.ac.uk/10.3390/en13082109
Submission received: 20 March 2020
/
Revised: 17 April 2020
/
Accepted: 17 April 2020
/
Published: 24 April 2020
(This article belongs to the Special Issue Power Electronics in Renewable Energy Systems Ⅱ)
Abstract
:Grid-connected systems often consist of several feedback-controlled power-electronics converters that are connected in parallel. Consequently, a number of stability issues arise due to interactions among multiple converter subsystems. Recent studies have presented impedance-based methods to assess the stability of such large systems. However, only few real-life experiences have been previously presented, and practical implementations of impedance-based analysis are rare for large-scale systems that consist of multiple parallel-connected devices. This work presents a case study in which an unstable high-frequency operation, caused by multiple paralleled grid-connected rectifiers, of a 250 kW data center in southern Finland is reported and studied. In addition, the work presents an experimental approach for characterizing and assessing the system stability by using impedance measurements and an aggregated impedance-based analysis. Recently proposed wideband-identification techniques based on binary injection and Fourier methods are applied to obtain the experimental impedance measurements from the input terminals of a single data center rectifier unit. This work provides a practical approach to design and implement the impedance-based stability analysis for a system consisting of multiple paralleled grid-connected converters. It is shown that the applied methods effectively predict the overall system stability and the resonant modes of the system, even with very limited information on the system. The applied methods are versatile, and can be utilized in various grid-connected applications, for example, in adaptive control, system monitoring, and stability analysis.

1. Introduction
Grid-connected power-electronics systems have become an essential part of the modern power system. A large share of electricity consumption is processed in power electronics, and also the production has started to shift towards power-electronic interfaced renewable alternatives. Consequently, the number of inverters and rectifiers in the electrical system is increasing rapidly, and it is expected that eventually 100% of the electricity in modern countries will flow through power-electronic devices [1].
Along with the transformation of the energy system, information technology and data processing, such as cloud storages, centralized servers and data mining, are experiencing a revolution. The energy demand for these activities has continuously increased in the past few years, and the data centers are becoming a significant energy consumer [2]. For example, maintaining the blockchain for the cryptocurrency Bitcoin has a yearly energy demand of approximately 43 TWh [3]. The majority of the required data mining takes place in data centers, where grid-connected power-supplying units (PSUs) feed the processing units. The processors are often graphical processing units (GPUs), central processing units (CPUs) or application-specific integrated circuits (ASICs). To achieve required power levels for high processing capability, multiple modular units are connected in parallel.
The high power consumption of a data center may cause issues in power quality, such as high total harmonic distortion (THD) or flicker in grid voltages [4,5]. In addition, the grid interface of power-electronic devices is prone to adverse interactions, which may lead to dramatic stability issues [6]. The threat of instability increases as more power-electronic units are connected in parallel [7]. Consequently, data centers that can have up to thousands of paralleled PSUs may encounter very low stability margins leading to unstable operation, as already encountered in systems that have multiple parallel inverters [8,9,10].
Past studies have shown methods that can be applied in stability analysis of grid-connected systems based on eigenvalue modeling [11,12,13] and impedance-based stability criterion [7,14,15,16,17]. Recently, the impedance-based analysis was applied also for a data center [18]. The work in [18] assessed the stability of a large-scale data center through modeling approach, where system topology is known in detail and the results are derived applying considerable modeling effort. However, often the detailed structure of the PSUs is not known, and the analysis must rely at least partially on black-box models. In such systems, modeling-based approaches are not applicable, and impedance measurements are imperative in order to predict the system stability margins.
Methods for measuring the terminal impedance of power-electronic devices have become popular, as the impedance measurements can be directly applied in the stability analysis [17,19,20,21]. This tackles the issues related to small-signal modeling and black-box nature of many commercial devices. In the methods, a perturbation signal is injected to the terminals and the currents and voltages are measured and Fourier transformed to extract the spectral information. Binary wideband sequences have shown prominent characteristics as perturbation signals, as they possess multiple desirable characterisctics, such as controllable frequency content, minimal crest factor, and fast measurement time [21,22].
This work reports an unstable operation experienced in 250 kW data center in southern Finland. Multiple parallel connected power-factor correcting (PFC) rectifiers produced sustained high-frequency oscillation, which distorted the voltages of local low-voltage (LV) grid and damaged nearby electric loads. The main oscillatory frequency manifested in the range of 7–8 kHz and had root-mean-square (RMS) amplitude of approximately 71 V, corresponding to 30.7% of the nominal phase voltage (230 V at 50 Hz). The detailed topology and control scheme of the rectifiers were unknown, and therefore, modeling-based analysis methods are unsuitable for assessing the instability. Additionally, the measurements on the internal dynamics of the rectifiers are unavailable. Thus, the only viable stability analysis method is the impedance-based analysis by applying terminal impedance measurements.
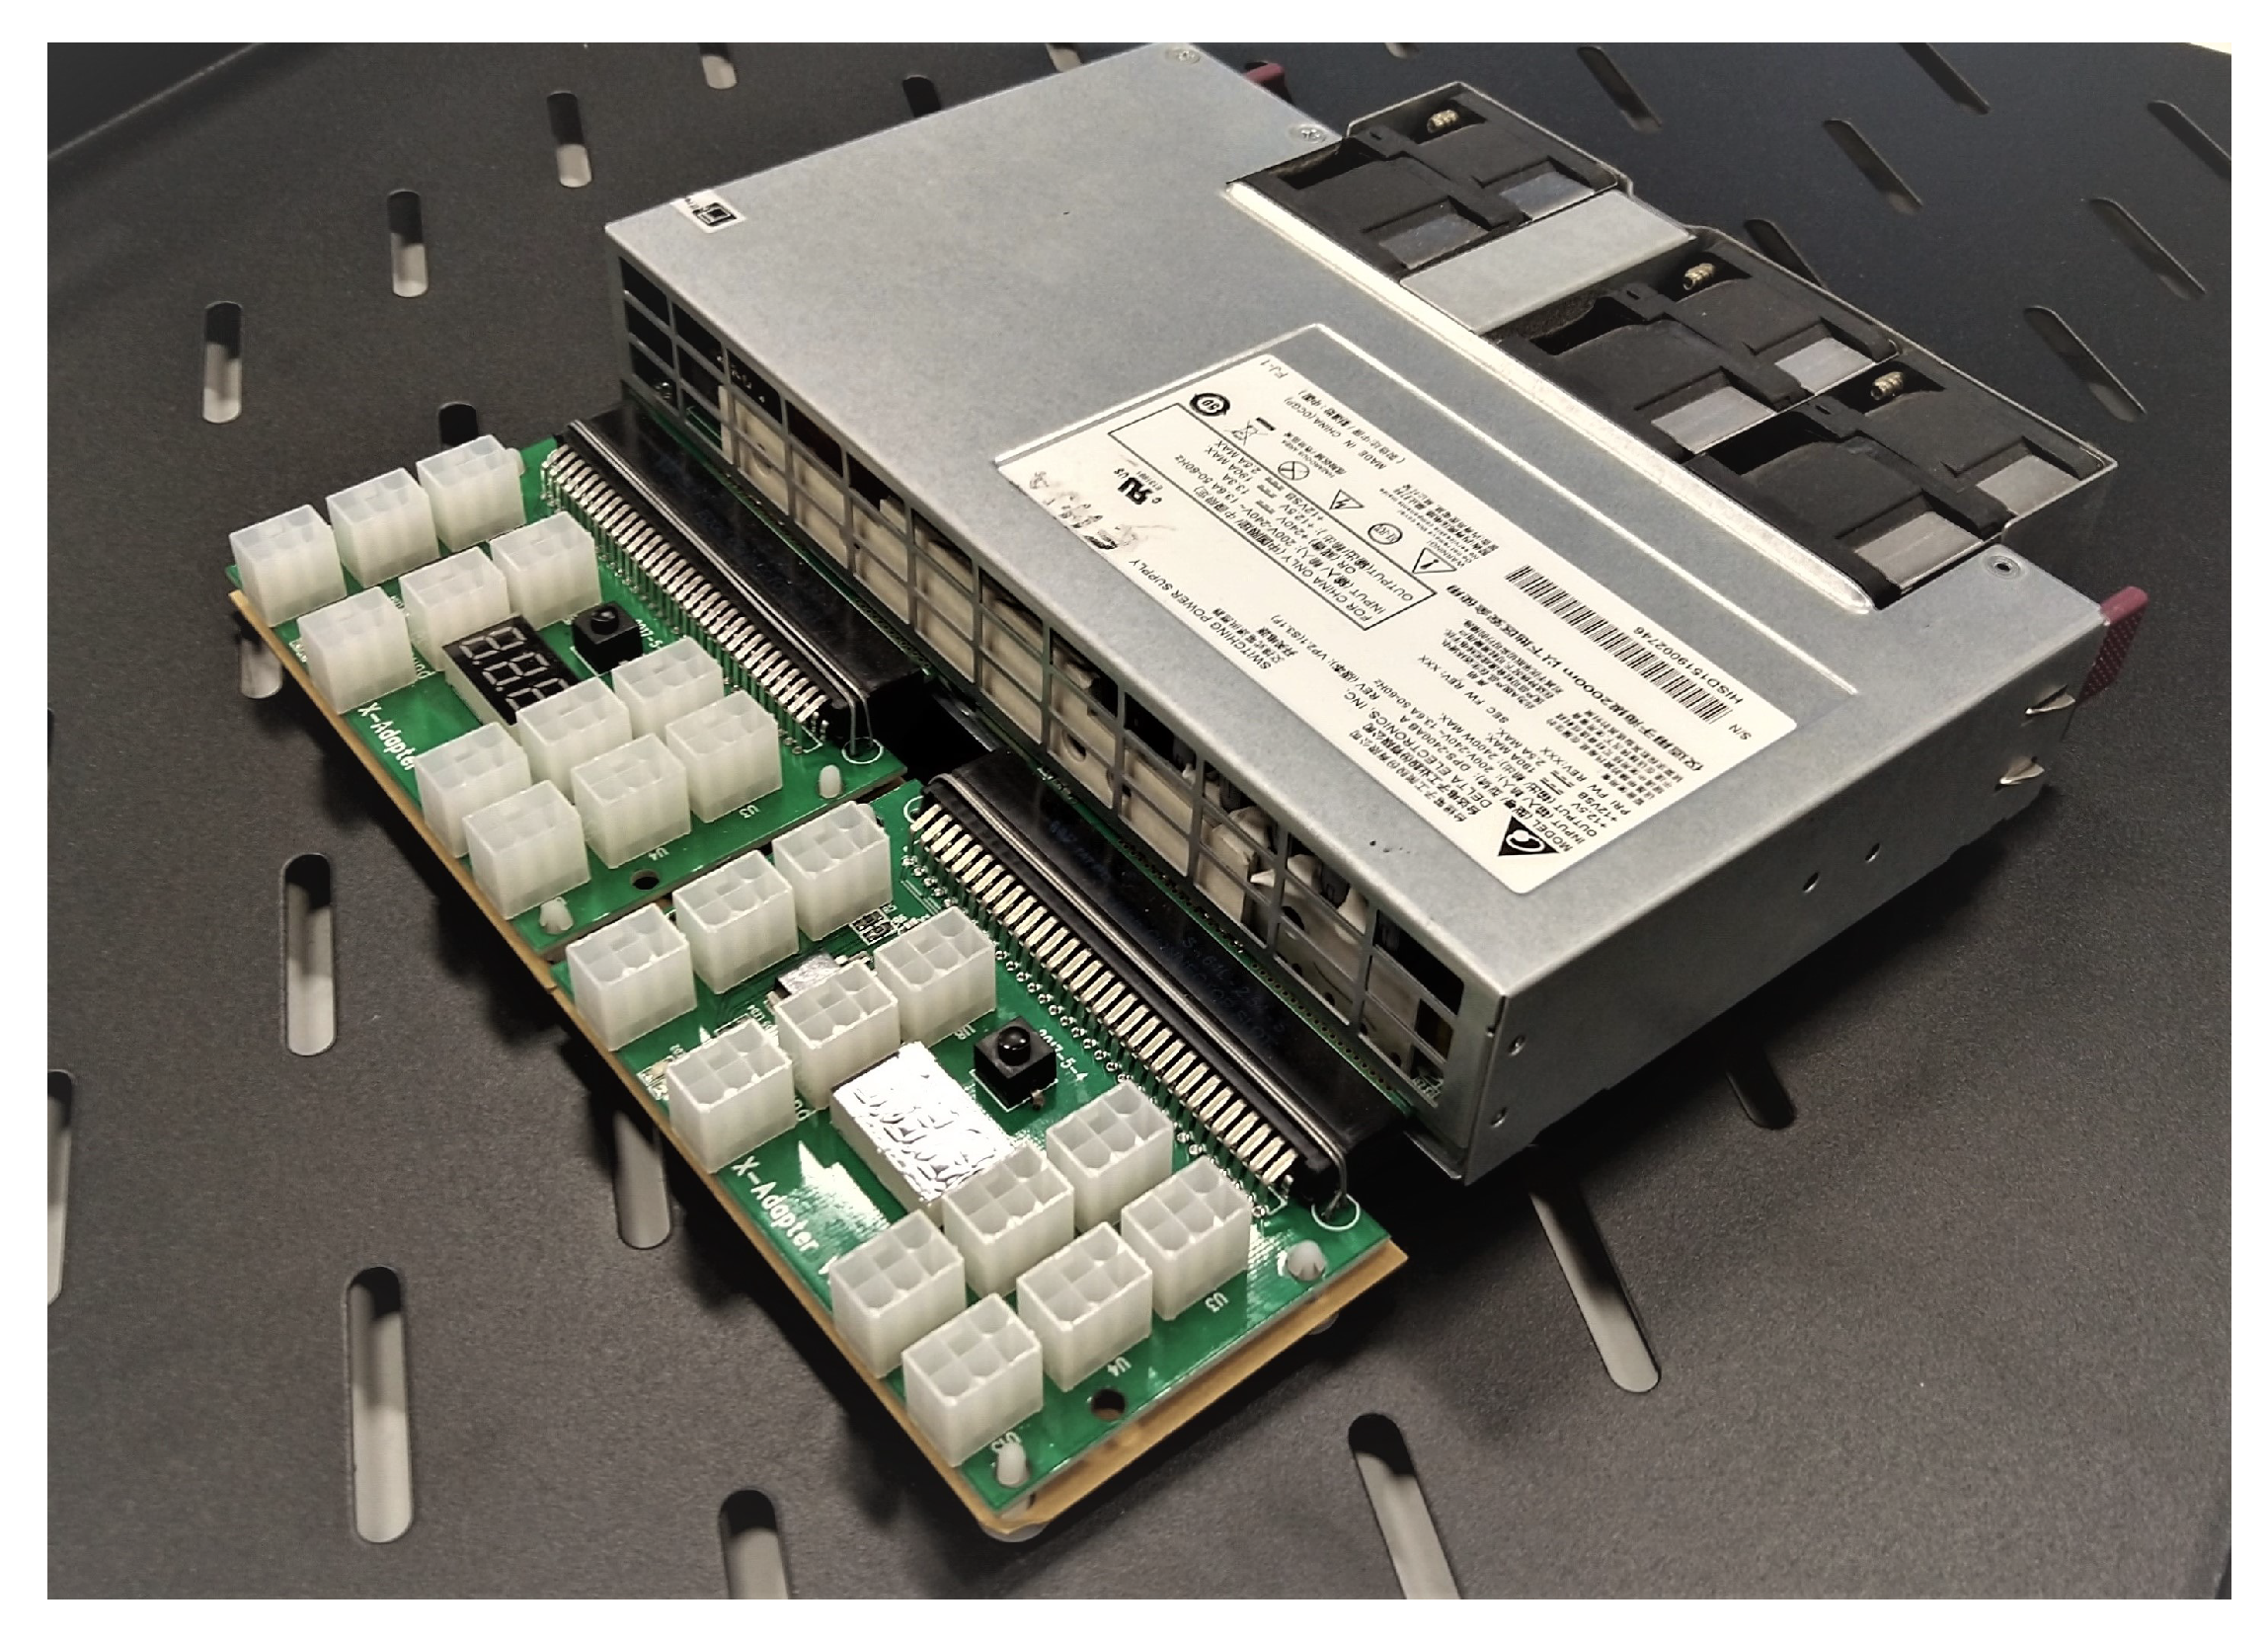
In this work, a 2400 W single-phase PSU (shown in Figure 1) obtained from the data center is examined and the input impedance is measured in varying load range applying pseudo-random binary excitation signal and Fourier methods. The impedance data is utilized in aggregated impedance-based stability analysis, which is used to explain the origin of the experienced instability of the data center. Consequently, the work provides a real-life example of instability in paralleled PSUs in a data center, and explains the origin of this instability based on known grid impedance and impedance-measurements of a single PSU.
The rest of the work is organized as follows. Section 2 provides the fundamental background on impedance-based stability analysis and broadband impedance measurements. Section 3 presents the detailed case description of the instability that occurred in the data center. Section 4 shows the impedance measurements of a single PSU and performs the stability analysis based on aggregated total load impedance of parallel PSUs. In Section 5, a brief discussion on the results of the work is presented. Finally, Section 6 concludes the work.
2. Background
2.1. Impedance-Based Stability Criterion
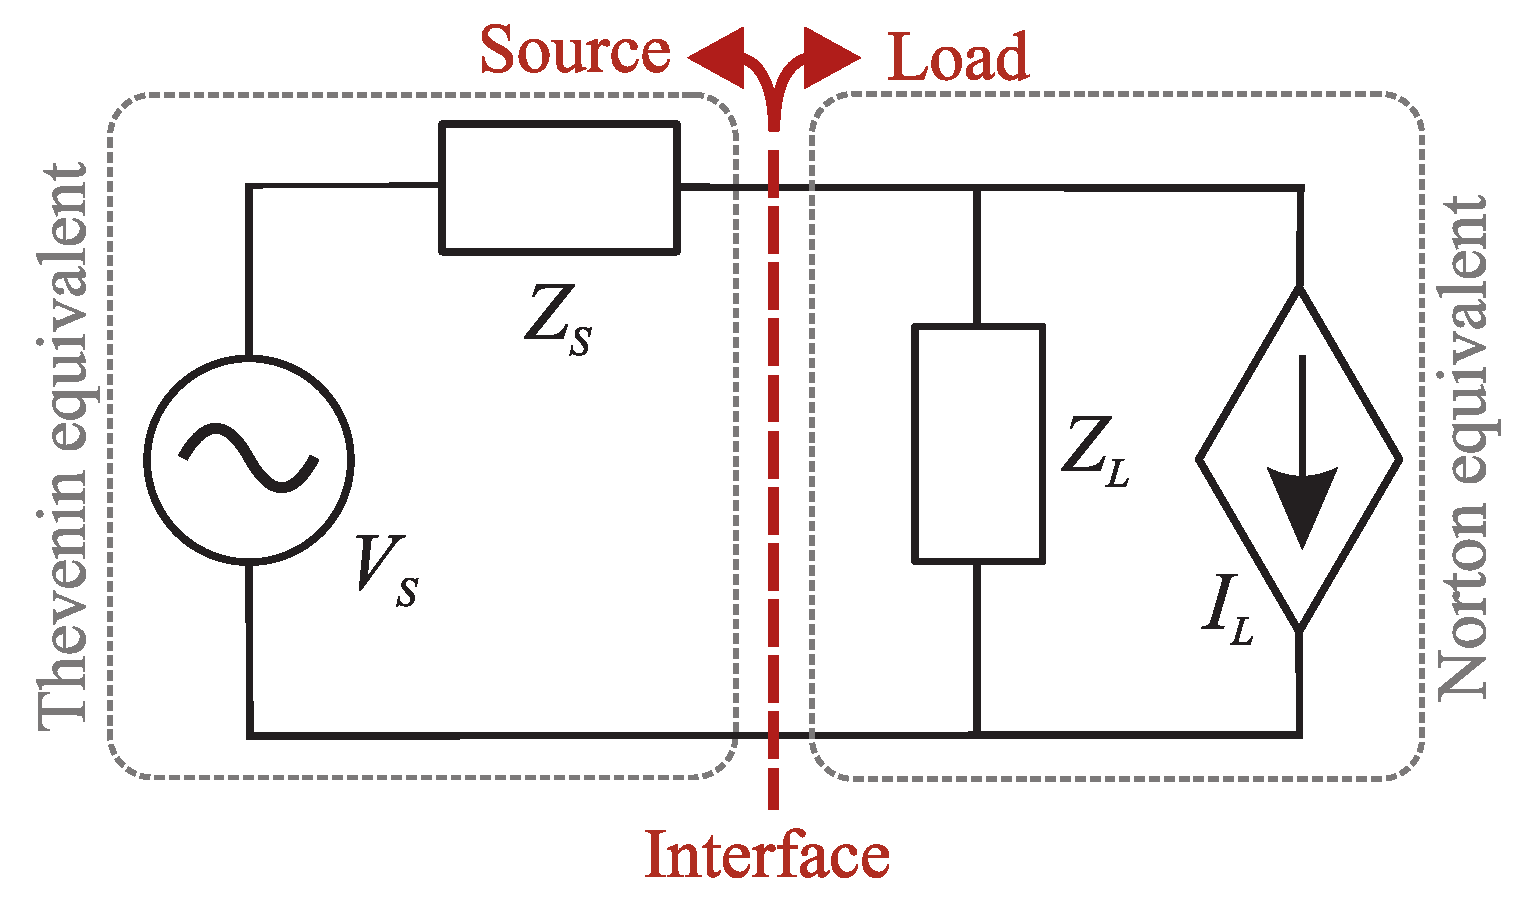
Although switched-mode power-electronics converters are nonlinear systems, the small-signal stability can be accurately assessed based on linearized small-signal-model. A grid-connected converter can be examined as an interconnected source-load system, where the impedance ratio of the subsystems indicates the stability [14]. Figure 2 presents a generalized source-load configuration of Thevenin and Norton equivalents, which is applicable for a grid-connected rectifier.
The current flowing from the source subsystem can be given as
where is the source voltage, is the load impedance, and is given as
where is the source impedance. resembles the transfer function of a negative feedback control system, where the forward path has a unity gain and the feedback is the impedance ratio. Thus, the stability can be analysed based on the impedance ratio, which is also known as the minor loop gain [23]. The Thevenin and Norton equivalents are interchangeable, and choosing Norton equivalent for source and Thevenin equivalent for load inverts the minor loop gain to be . As discussed in [24], the stability analysis can be performed similarly for and , and the ratio should be chosen so that it has no right-half plane (RHP) poles.
Conventional control theory tools, such as sensitivity function and Nyquist criterion, can be used in the stability analysis once the impedance-ratio is obtained. Nyquist criterion states that the stability can be analyzed from the Nyquist contour, which is the loop gain (in this case, impedance ratio) in complex plane. The system is stable if the open-loop transfer function is
- Stable and the contour does not encircle the critical point;
- Unstable and the contour encircles the critical point in a counter-clockwise direction once for each RHP pole of the loop gain.
Consequently, the stability of the open-loop transfer function must be known. Additionally, if the contour passes through the critical point (−1, 0), the system is marginally stable. The system sensitivity to disturbances can be assessed through maximum peak criterion (MPC), which interprets the system sensitivity from the minimum distance of the Nyquist contour to the critical point. The distance to the critical point corresponds to the disturbance attenuation at that frequency. The sensitivity function for the impedance-based analysis can be derived straightforwardly from
However, the MPC alone cannot be utilized for stability analysis, as the distance of the contour to the critical point does not consider the stability of the system. Thus, the MPC is only applicable for sensitivity analysis of stable systems.
2.2. Stability Analysis of Paralleled Devices
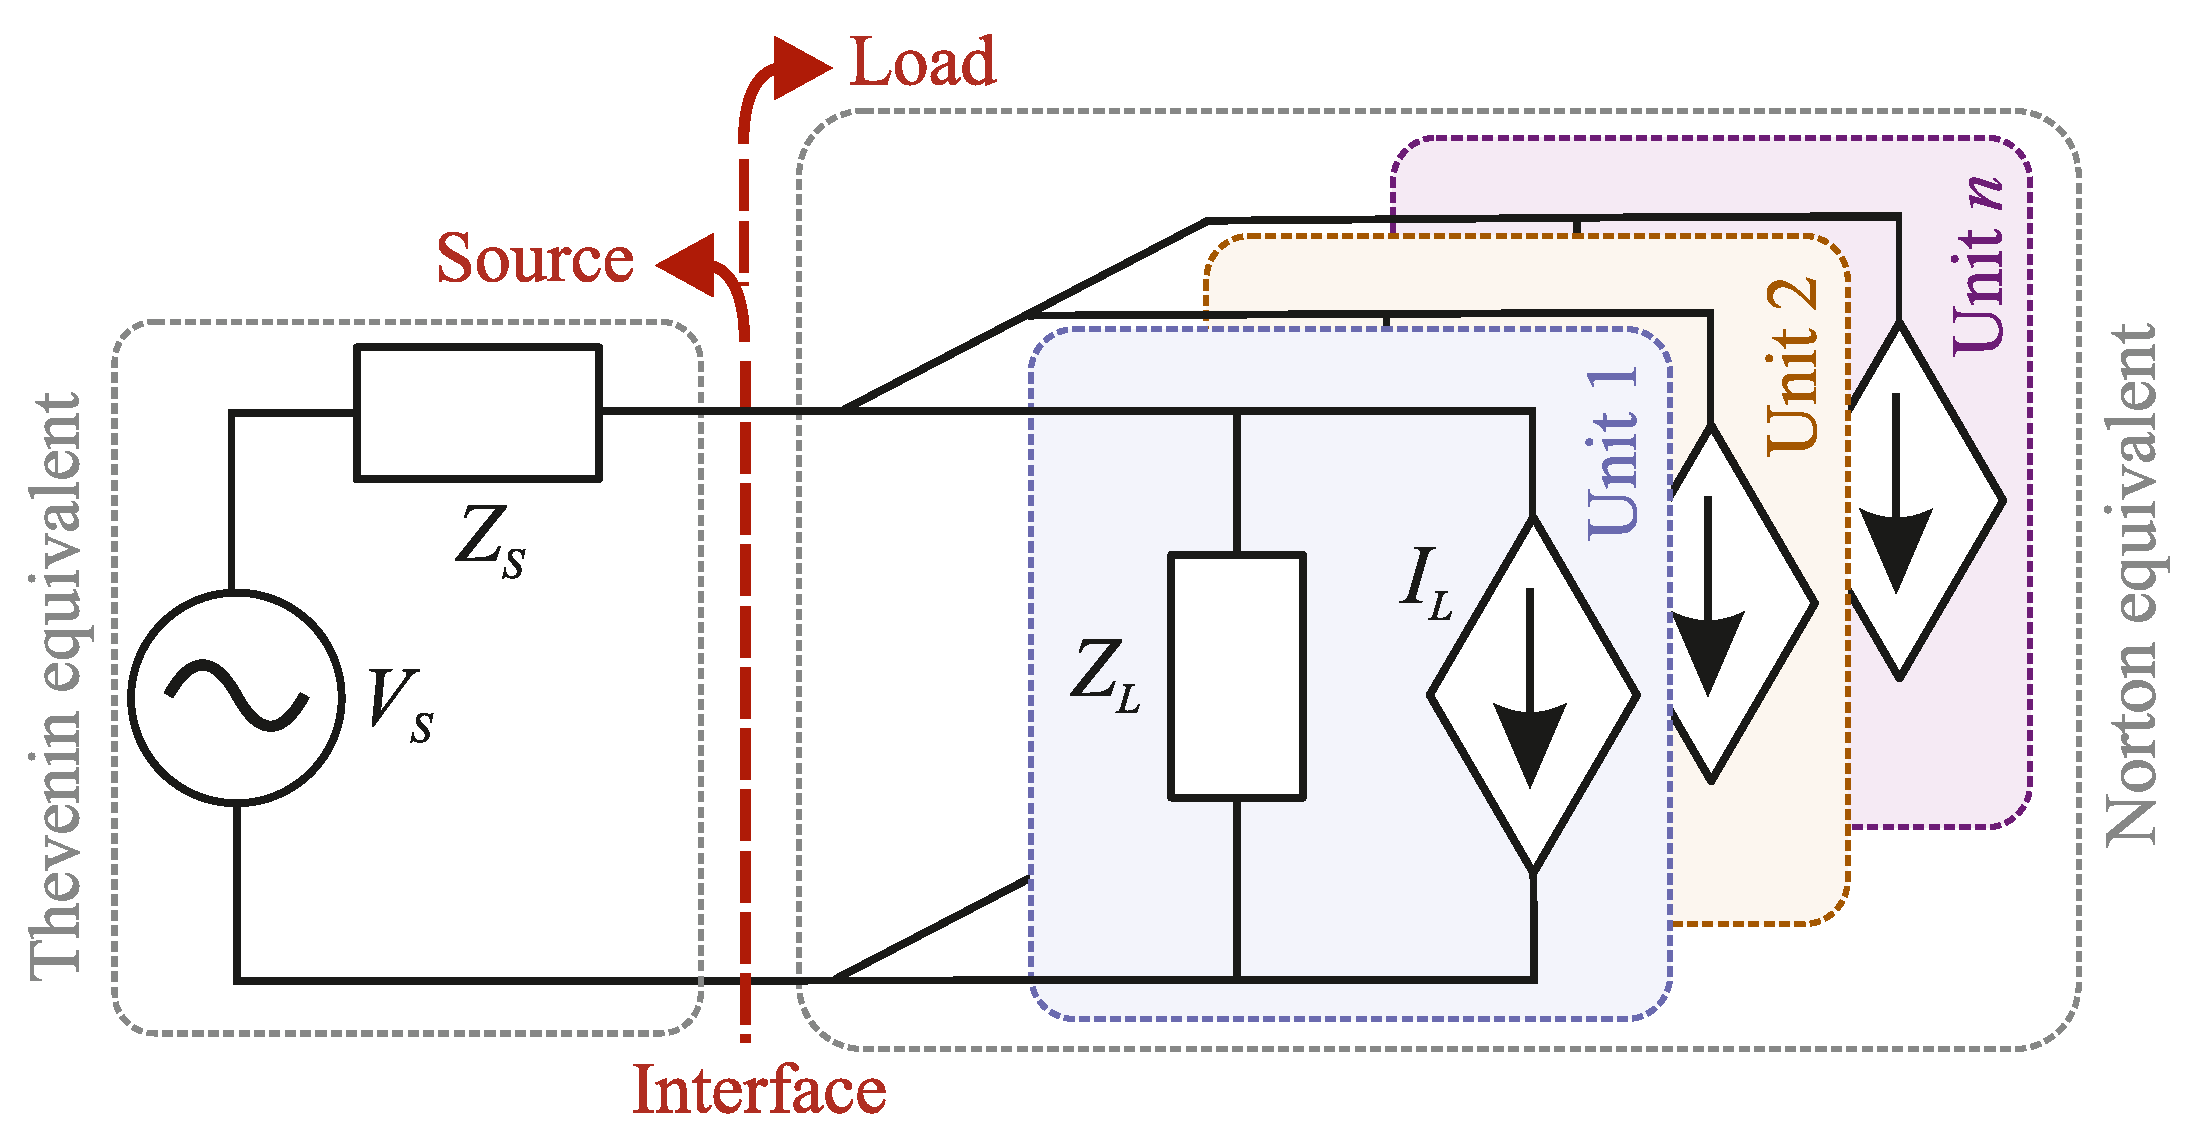
Originally, the impedance-based stability criterion was derived for systems that have a single source and load subsystem. However, the majority of large-scale systems consist of multiple paralleled devices in order to reach suitable power levels. This is the case also in data centers, where multiple PSUs are connected in parallel to feed the data processing units. To address the stability issue of paralleled devices, the impedance-based stability analysis has been extended to multi-paralleled devices [7]. Figure 3 presents a source-load equivalent of n parallel connected units, similar to Figure 2. Based on the figure, the parallel sources (or loads) can be aggregated to an equivalent source (or load) that has an equivalent impedance of
A necessary requirement for the aggregation method is that the subsystems are connected to the same point-of-common coupling; that is, the impedance in between the separate units is negligible [7]. In data centers, the PSUs are typically located nearby, so the interconnecting impedances between the PSUs can be assumed to be small. The analysis can be further simplified for parallel-connected systems where the devices are identical. The total aggregated admittance of n identical parallel-connected rectifiers can be obtained straightforwardly from
In this case study, the PSUs were identical and connected to the same feeding transformer, which makes (5) applicable.
2.3. Impedance Measurements with Broadband Excitations
Typically, the systems under analysis are either complex or partially unknown, and the analytical methods become inadequate. In these cases, the most used approach is the impedance-based analysis, which often relies on practical impedance measurements of the subsystems. The impedance measurements generally require a perturbation signal to be injected to the system, which can be either voltage- or current-type, and the resulting currents and voltages are measured. Then Fourier transform is applied to extract the spectral information (impedance) from the measured signals. Multiple different perturbation signals have been discussed, such as sine sweep, multi-sine sweep, impulse response, or broadband sequences [25].
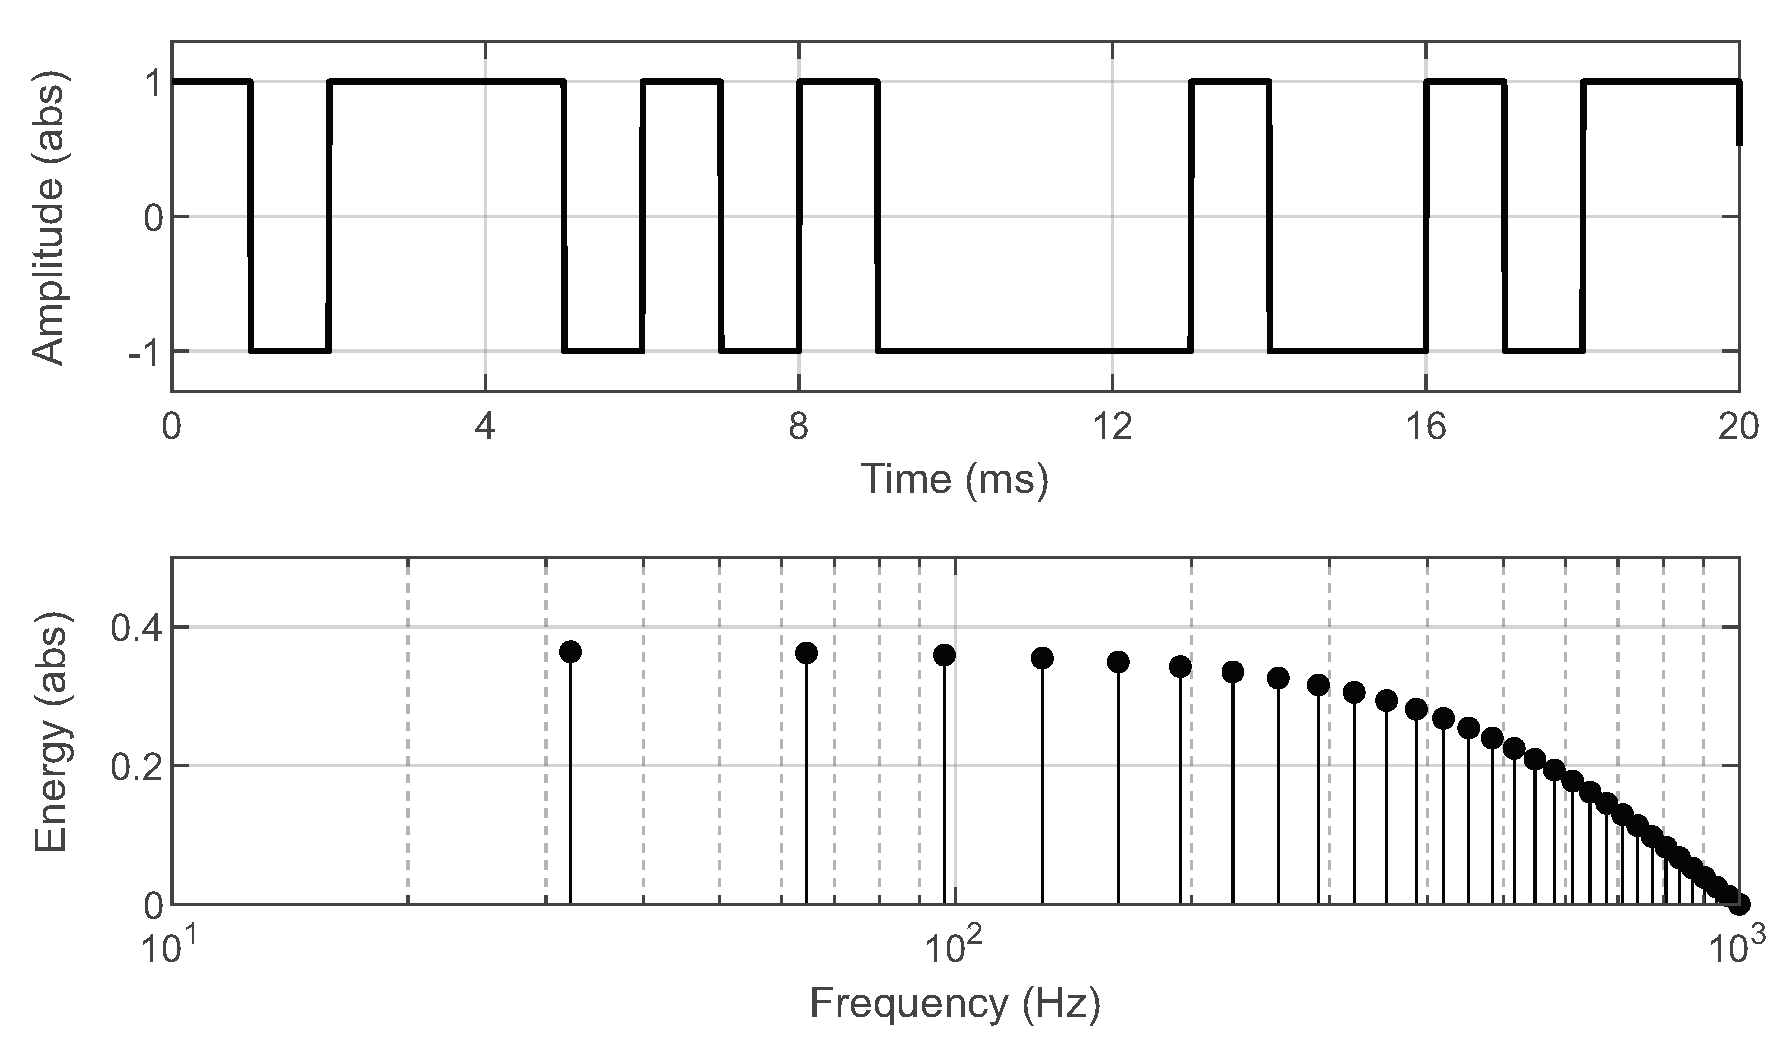
In this work, a maximum-length binary sequence (MLBS) is applied as the excitation signal. Figure 4 presents a 31-bit-length MLBS generated at 1 kHz. The MLBS is a periodic broadband excitation with a controllable frequency content and minimal peak-factor, which result in fast measurement time and possibility to average over multiple excitation periods [26]. Additionally, the MLBS is easy to generate and implement using a simple shift-register structure. As the signal is binary, it is very easy to implement even with a low-cost device, whose output can only cope with a small number of signal levels. The comparison of the MLBS to other measurement designs has been thoroughly reported in [22]. The sequence length N, frequency resolution , and measurement time can be given as
where n is the length of shift-register system, is the generation frequency, and P is the number of averaged periods. A logarithmic averaging procedure is an effective method for decreasing the effect of noise in periodic signals, which can be given as
where and are the Fourier-transformed voltages and currents [26].
3. Case Description: Sustained Harmonic Resonance in a Data Center
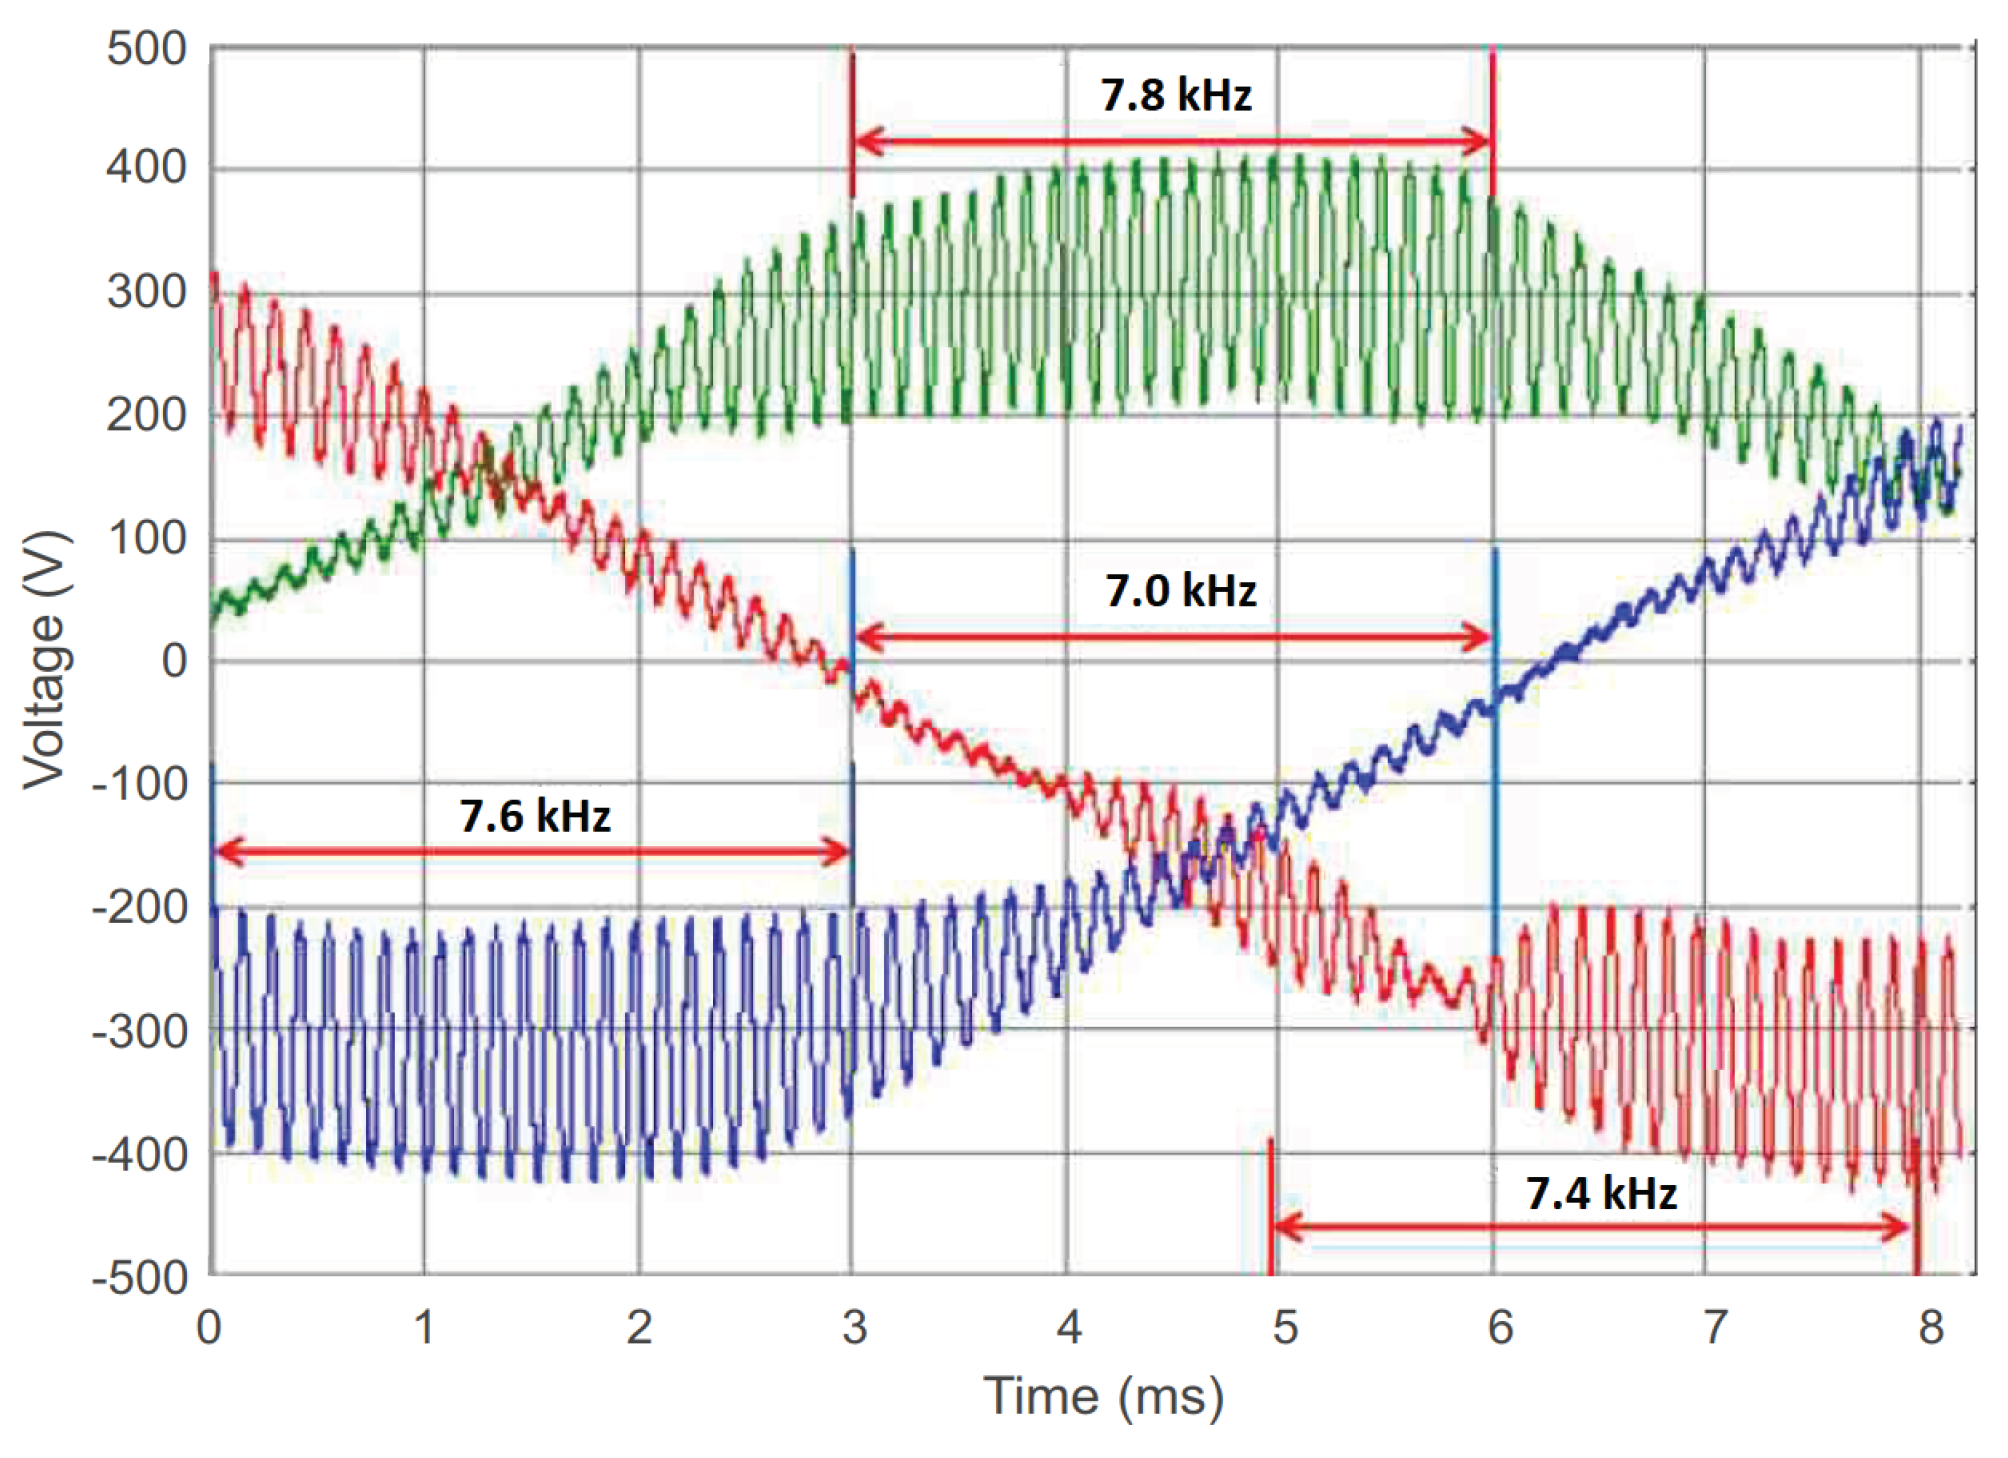
In November 2017, a new data center in southern Finland expressed unstable behavior, which produced dramatic sustained harmonic resonance in system currents and voltages causing breakdown of electric equipment for nearby consumers. Figure 5 presents the measured grid voltages at the point-of-common coupling of the data center. A drastic harmonic distortion is observed at around 7–8 kHz frequency range, with peak-to-peak amplitude of 200 V (that is, 31% of nominal peak-to-peak voltage). This sustained resonance corresponds to a total harmonic distortion (THD) of 31%, which is approximately four times the THD limitation set by standards (maximum 8% THD given in SFS-EN 50160 standard) [27]. In addition, the upper limit for grid voltages in the standard is +10% of the nominal phase voltage (360 V peak value) [27]. However, the sustained resonance introduced temporary phase voltages up to 420 V peak value, that is, 29% above normal peak voltages. The initial attempt to remove the harmonics was to decrease the data center power from 263 kW to 140 kW. However, the harmonic resonance persisted and was not removed until the data center replaced the PSUs with devices from a different manufacturer.
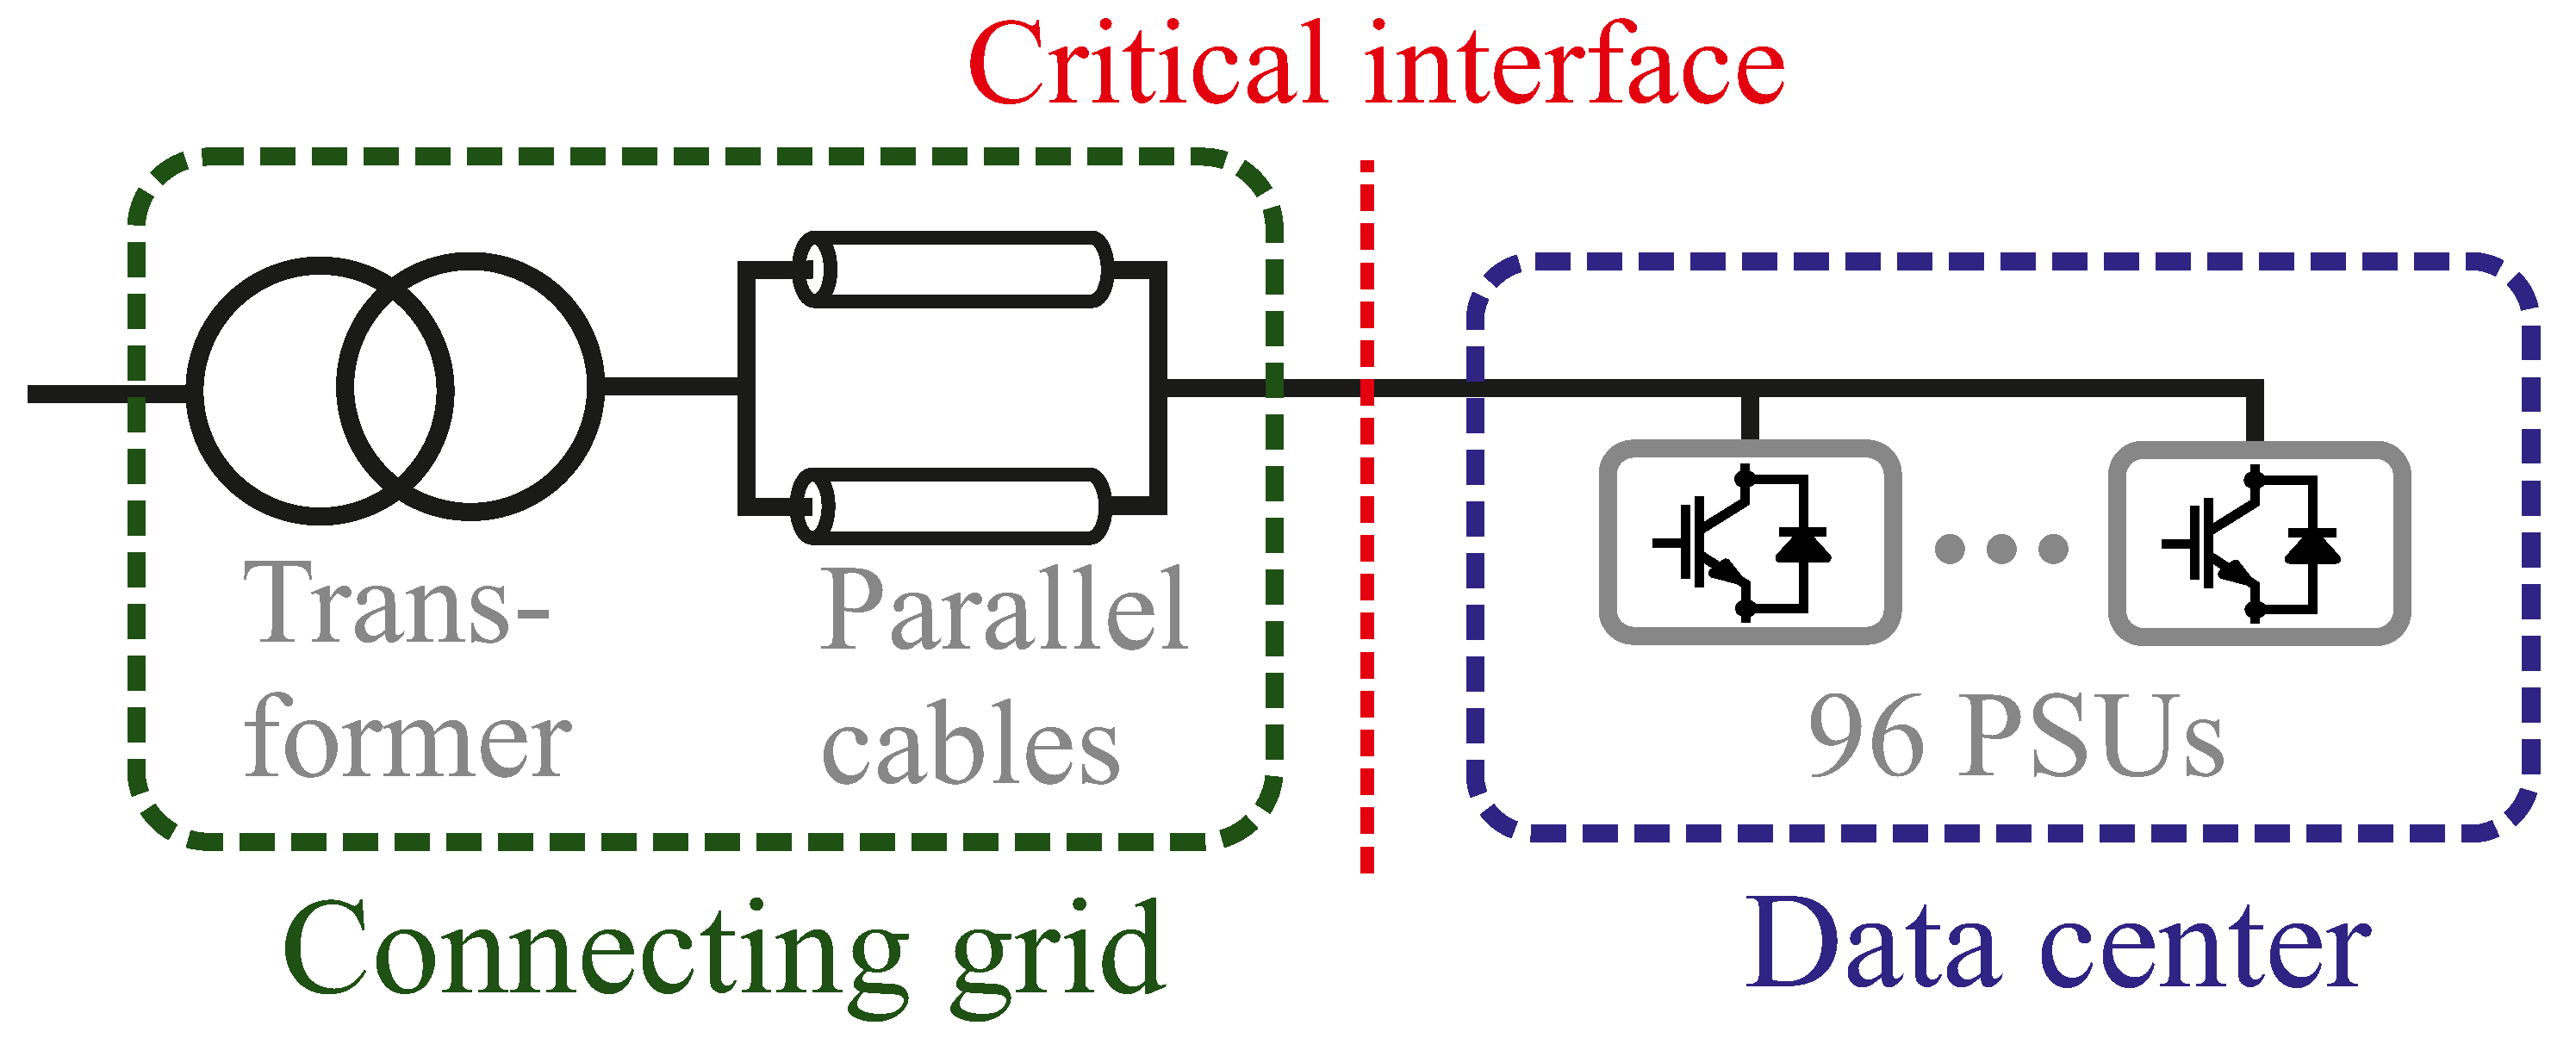
The data center connects to the grid through a 500 kVA transformer (20.5/0.41 kV) and two parallel underground cables (AXMK-Plus 2). The parameters are given in Table 1. The effect of other local electric loads such as fans is assumed to be negligible, and left out from the analysis. Figure 6 presents the overview of the grid connection of the data center.
4. Experimental Impedance-Based Stability Analysis
The stability analysis is performed based on impedance measurements of a single PSU acquired from the data center and known grid parameters. The equivalent parallel impedance of multiple PSUs is approximated from the impedance measurements, and the stability margins are examined using impedance-based stability criterion. The replacement PSUs could not be obtained for measurements, so a comparison of terminal impedances of the different type PSUs is not available.
4.1. Experimental Setup
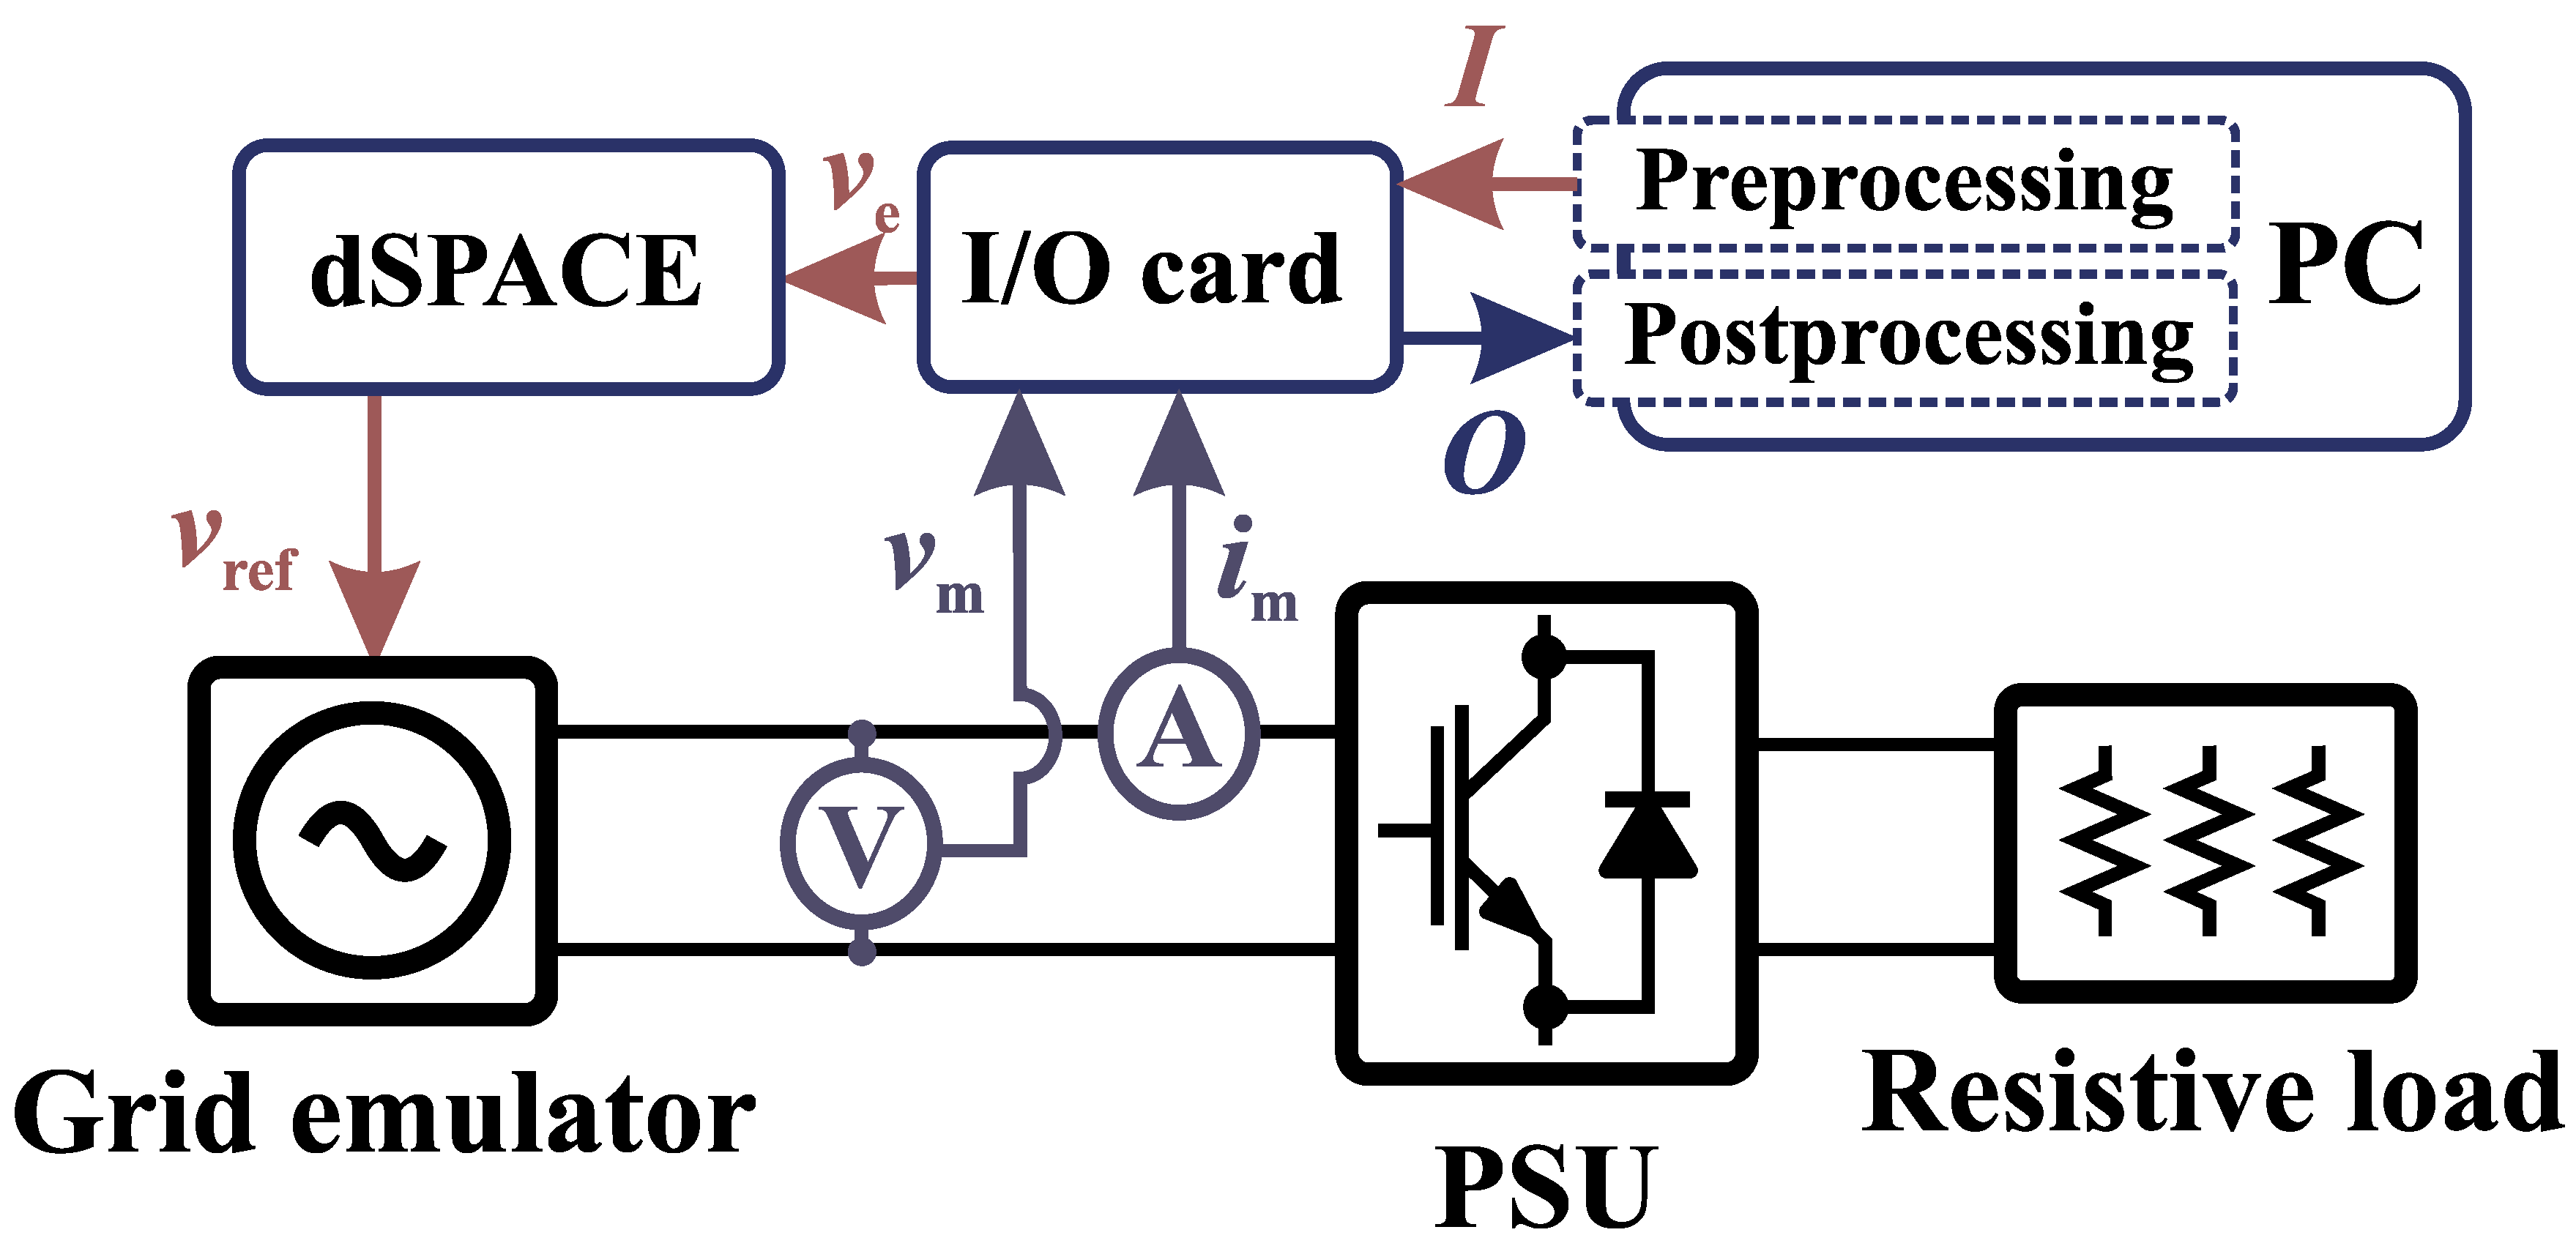
An experimental setup shown in Figure 7 was built for measuring the PSU input impedance. The setup consists of a linear 4-quadrant voltage amplifier (Spitzenberger&Spies PAS 15000) controlled using dSPACE real-time simulator (model 1103, GmbH, Germany), the PSU, I/O measurement card (National Instruments Data Acquisition Card USB-6363), and a custom passive load for output power consumption. The voltage amplifier is set to emulate 230 V phase voltage at 50 Hz frequency, which provides the input power to the PSU. Additionally, a preprocessed broadband MLBS excitation is added to the grid voltage reference in order to provide the perturbation for the PSU impedance measurements.
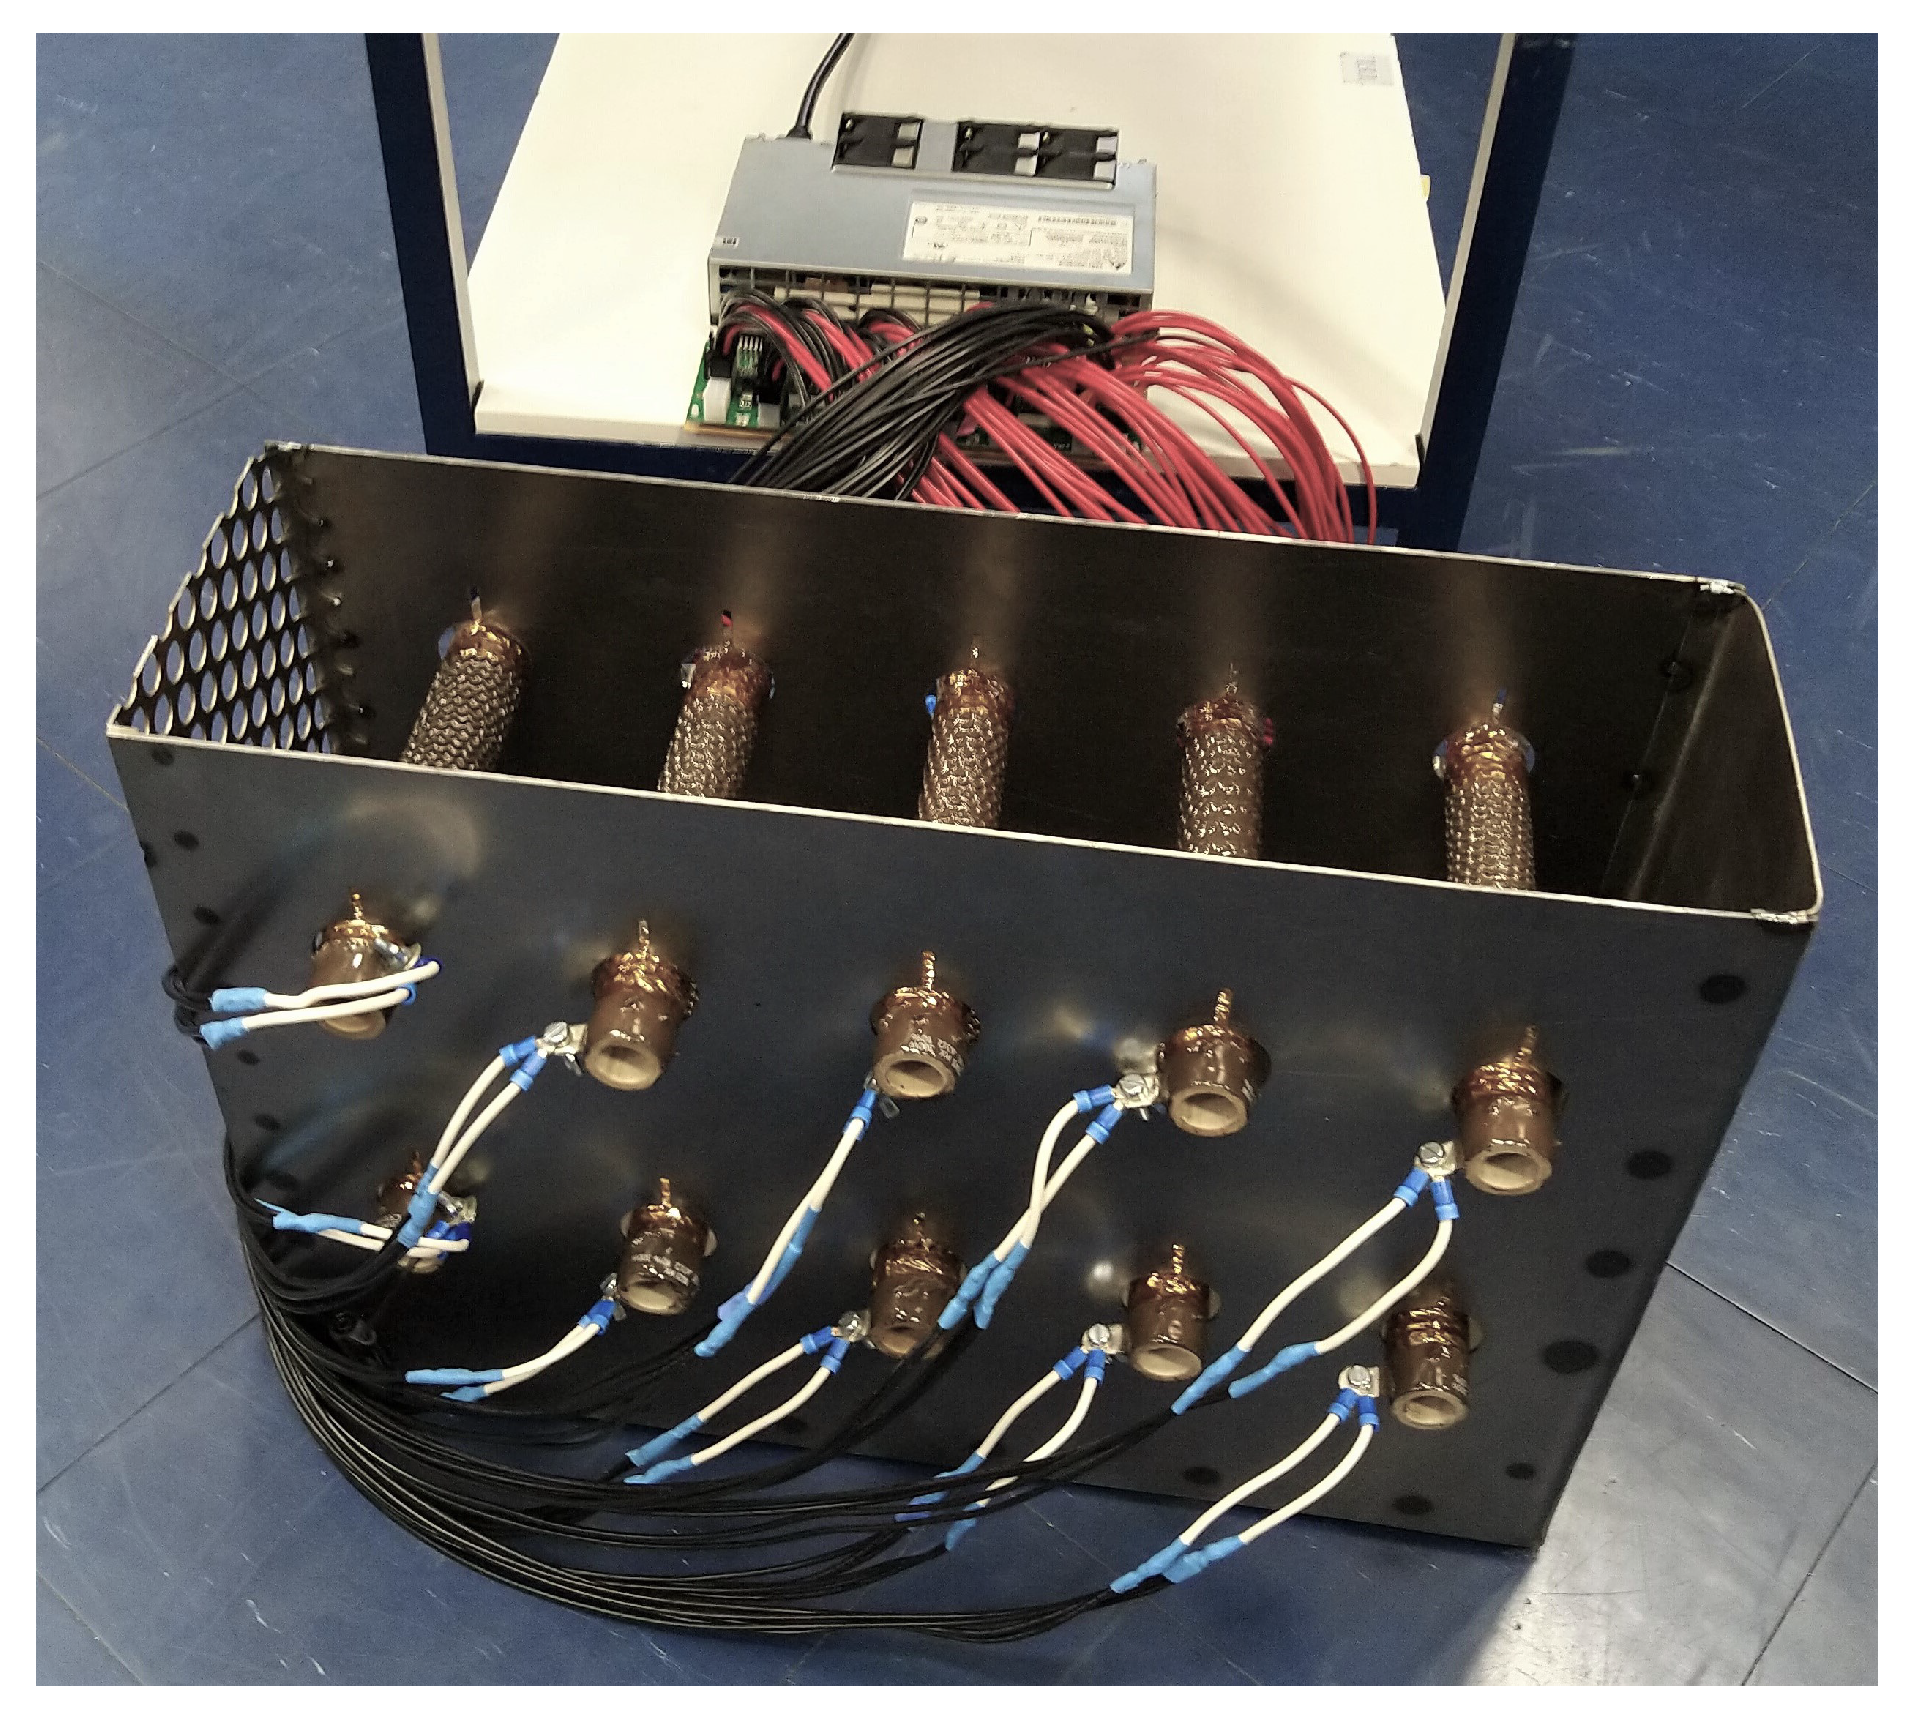
The operation conditions of the PSU, such as loading state, affect the input impedance. Thus, multiple impedance measurements are required so that more reliable analysis on the system behavior can be obtained. However, the low PSU output voltage of 12.5 V paired with high single-phase power output of 2.4 kW results in very high current (that is, 200 A). To tackle this issue, a modular passive load was build from 10 paralleled ceramic power resistors (), each of which rated for 300 W dissipation. The actual power dissipation at 12.5 V voltage is approximately 200 W for each resistor. The experimental power resistor load for the PSU is shown in Figure 8. The measurements are performed to the powers up to 80% of the maximum load, which is assumed to be approximately the typical loading state. Further increases of the loading above 50% change the impedance only marginally, and consequently, the obtained results can be assumed to valid for loading conditions between 50% and 100% of the nominal load. In a data center, the PSUs can be assumed to be operated in this range all the time.
4.2. Impedance Measurements
The input impedance of the PSU was measured by applying a 2047-bit-length MLBS injection generated at 140 kHz. These parameters yielded a frequency resolution of approximately 68 Hz and an injection time of approximately 14.6 ms (for a single-period injection). In order to increase the signal-to-noise ratio, the injection was applied with 2000 periods and the results averaged using (9). The total injection time was therefore approximately 29.2 s. The excitation is voltage-type with an amplitude of 2 V, and therefore, the measurement provides admittance data. However, in this work all the measurements are shown as impedances for consistency.
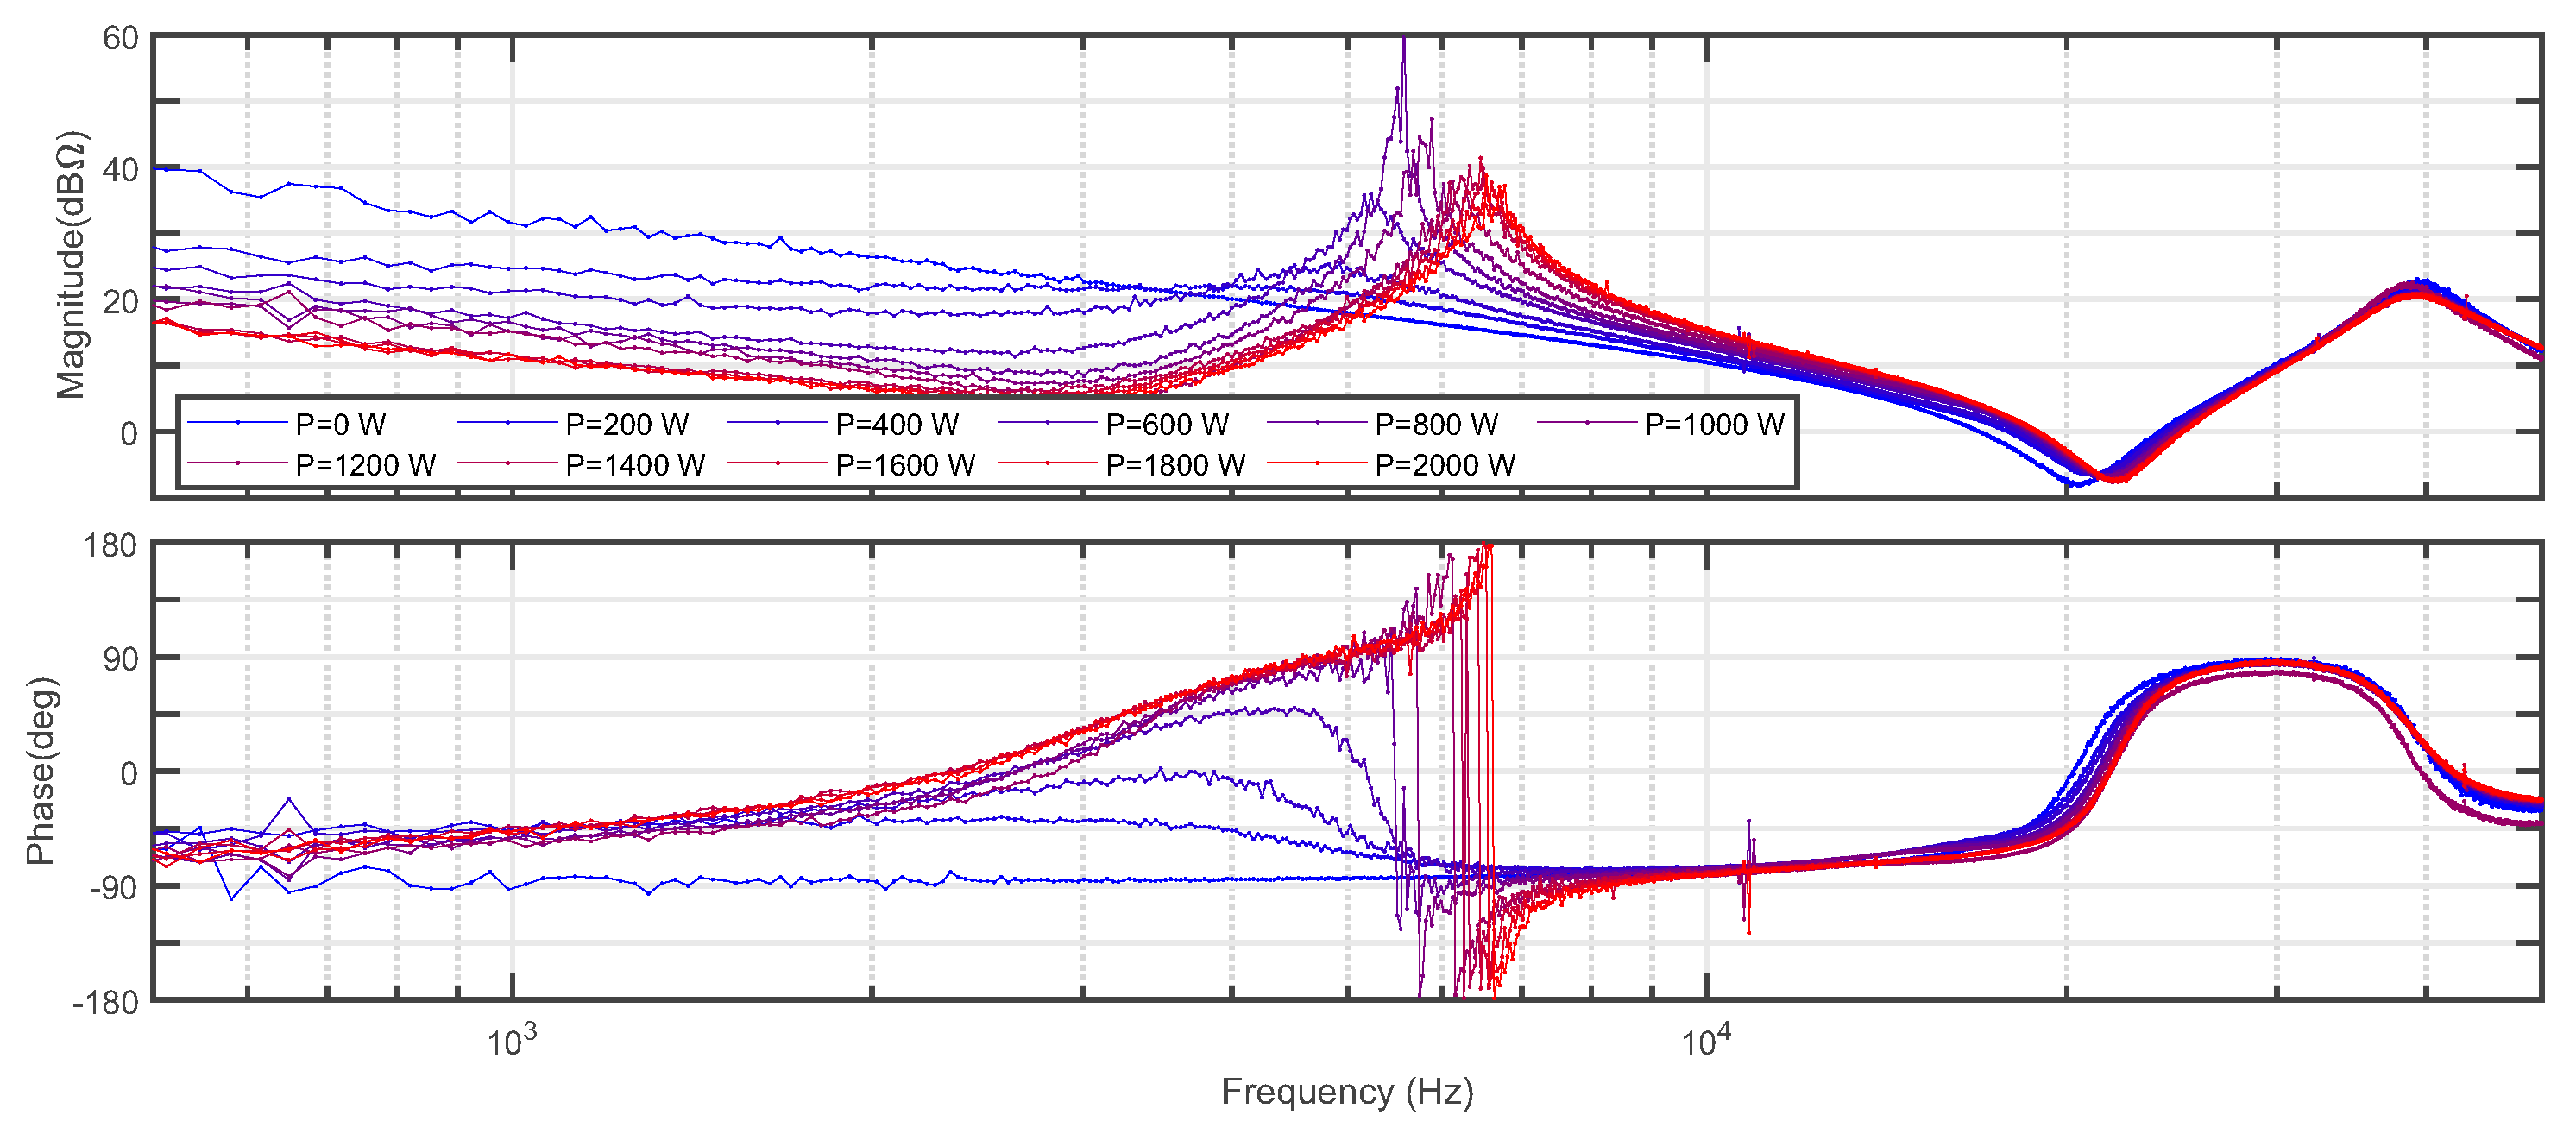
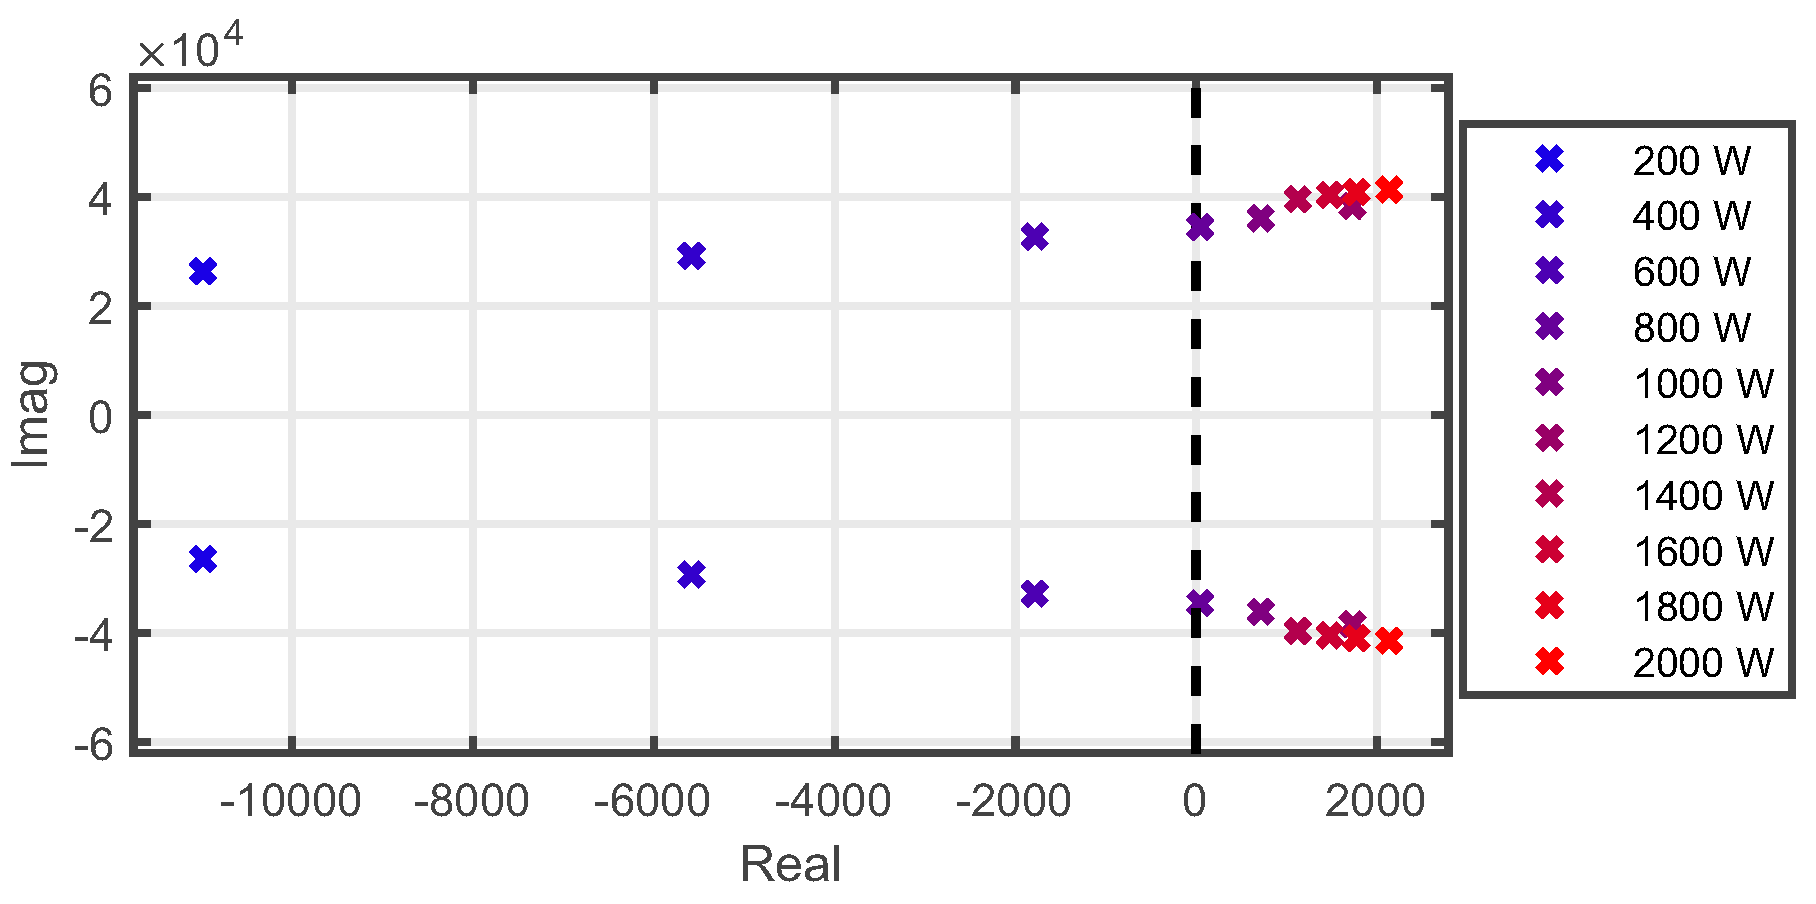
The input impedance of the PSU was measured during varying PSU output powers, ranging from 0 to 10 paralleled resistors, corresponding to power range of 0–2000 W. Figure 9 shows the measured input impedances. The impact of the power level has a drastic impact on the measured input impedance, as a distinct resonant shape appears as the output power is increased. In addition, the phase experiences a sudden shift of 360 degrees at the resonant frequency when the PSU operates above 30% of the nominal power. This indicates a shift of a system pole from left-hand plane (LHP) to right-hand plane (RHP). In order to verify this observation, an analytical transfer function based on the measured frequency-response data is estimated by using a least-square fitting function. Figure 10 presents the corresponding pole pair as a function of output power. The path of the pole pair crosses the imaginary axis to RHP at 600 W power, explaining the phase behavior at the resonance frequency. The presence of a RHP pole in the input impedance of the PSU indicates that the minor loop gain should be examined as so that the RHP poles can be avoided (the grid impedance is passive and contains no RHP poles or zeros). Although the input impedance has RHP poles, the grid-connected PSU is inherently a voltage-input type device and the zeros and poles of input admittance describe the internal stability of the device. Consequently, the admittance has only RHP zeros and no RHP poles, and the device is internally stable as assumed.
4.3. Stability Analysis
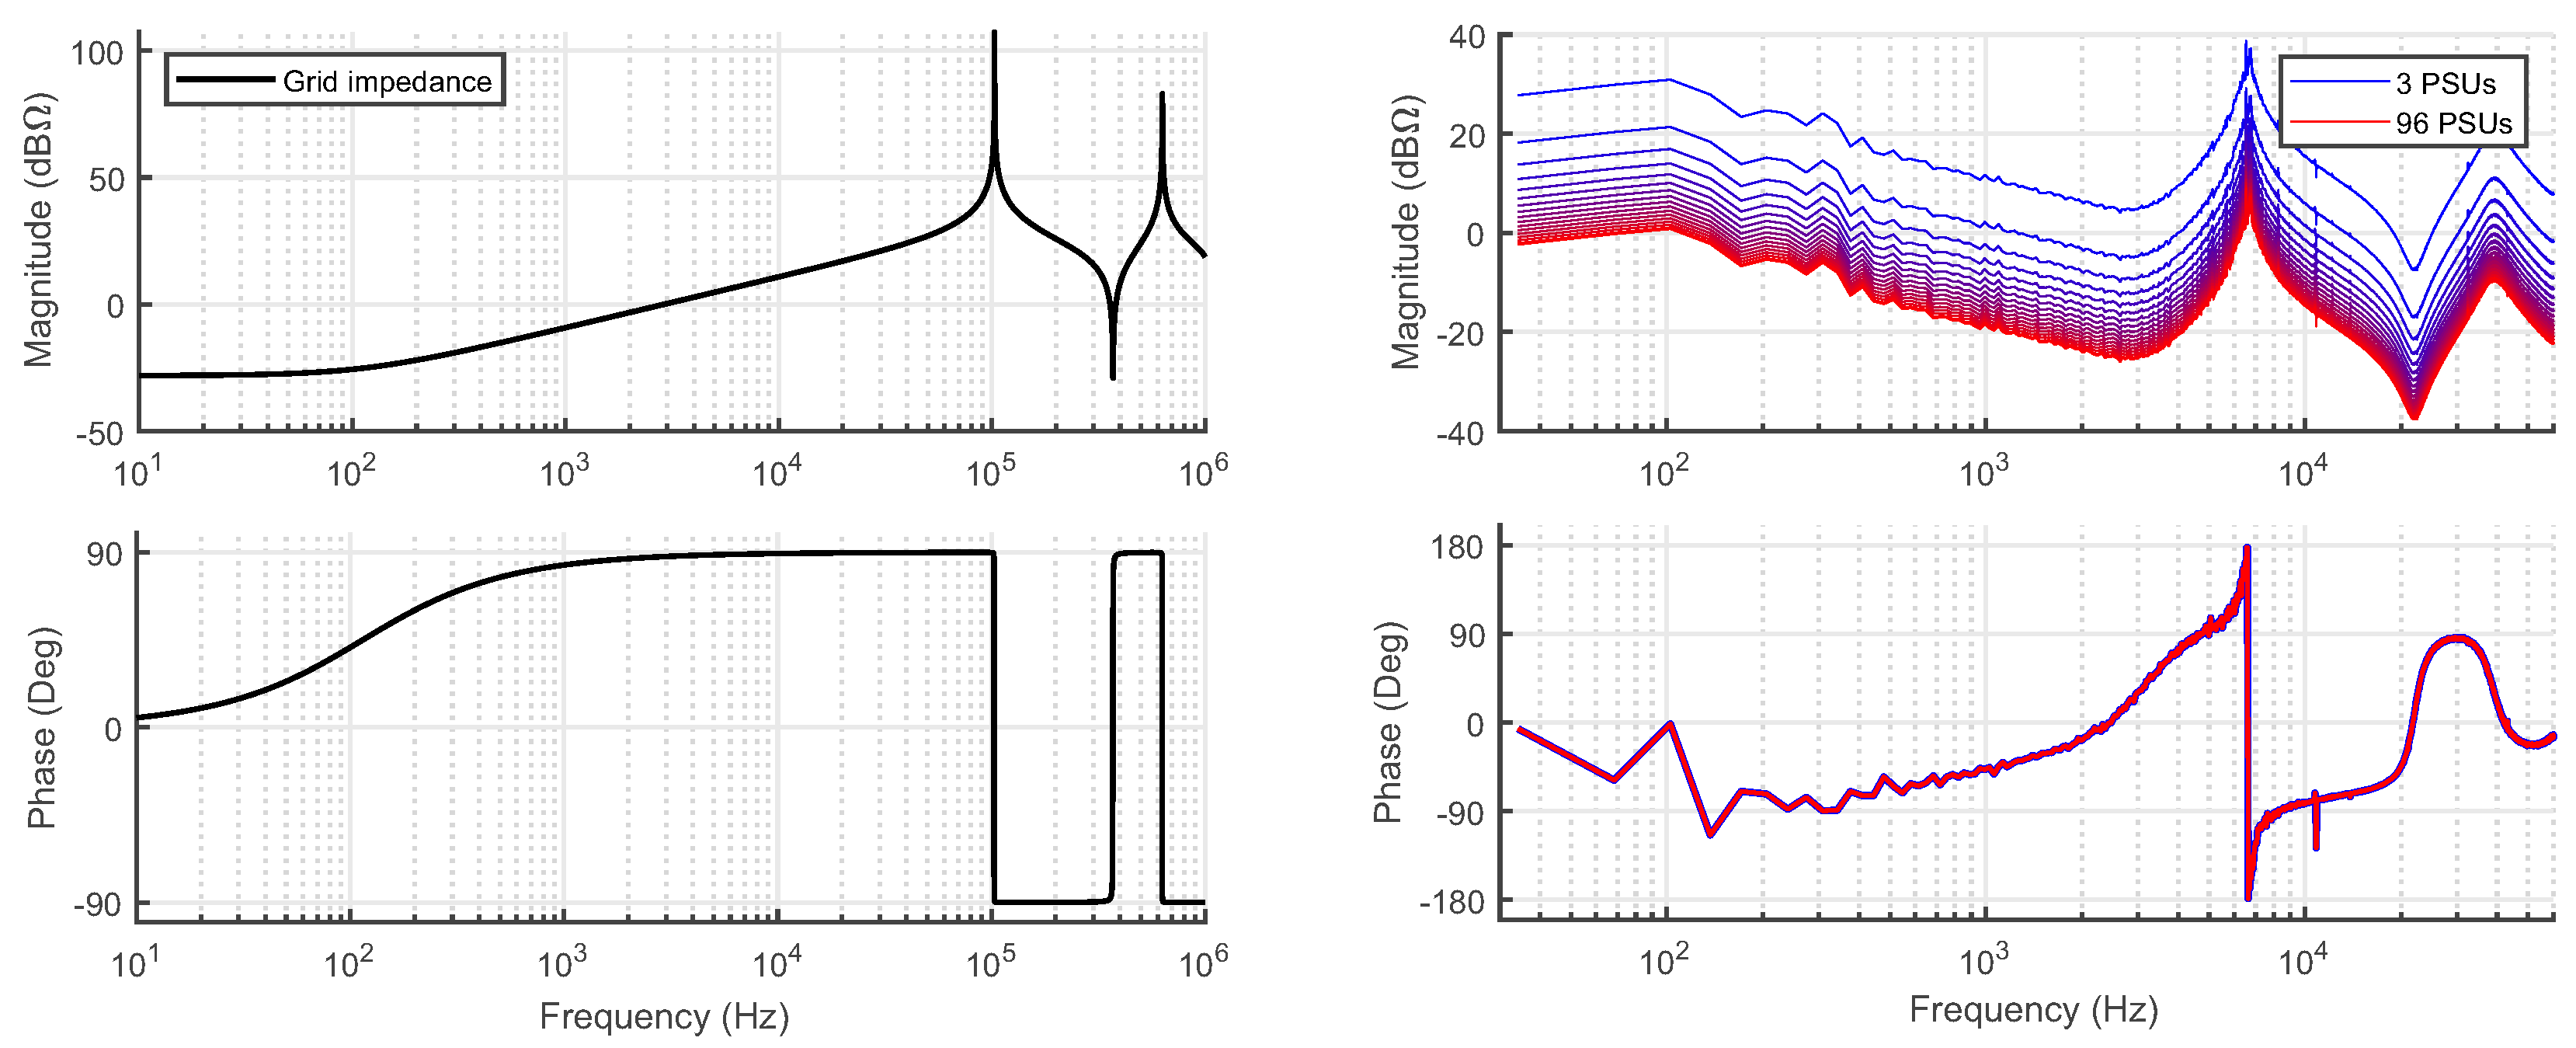
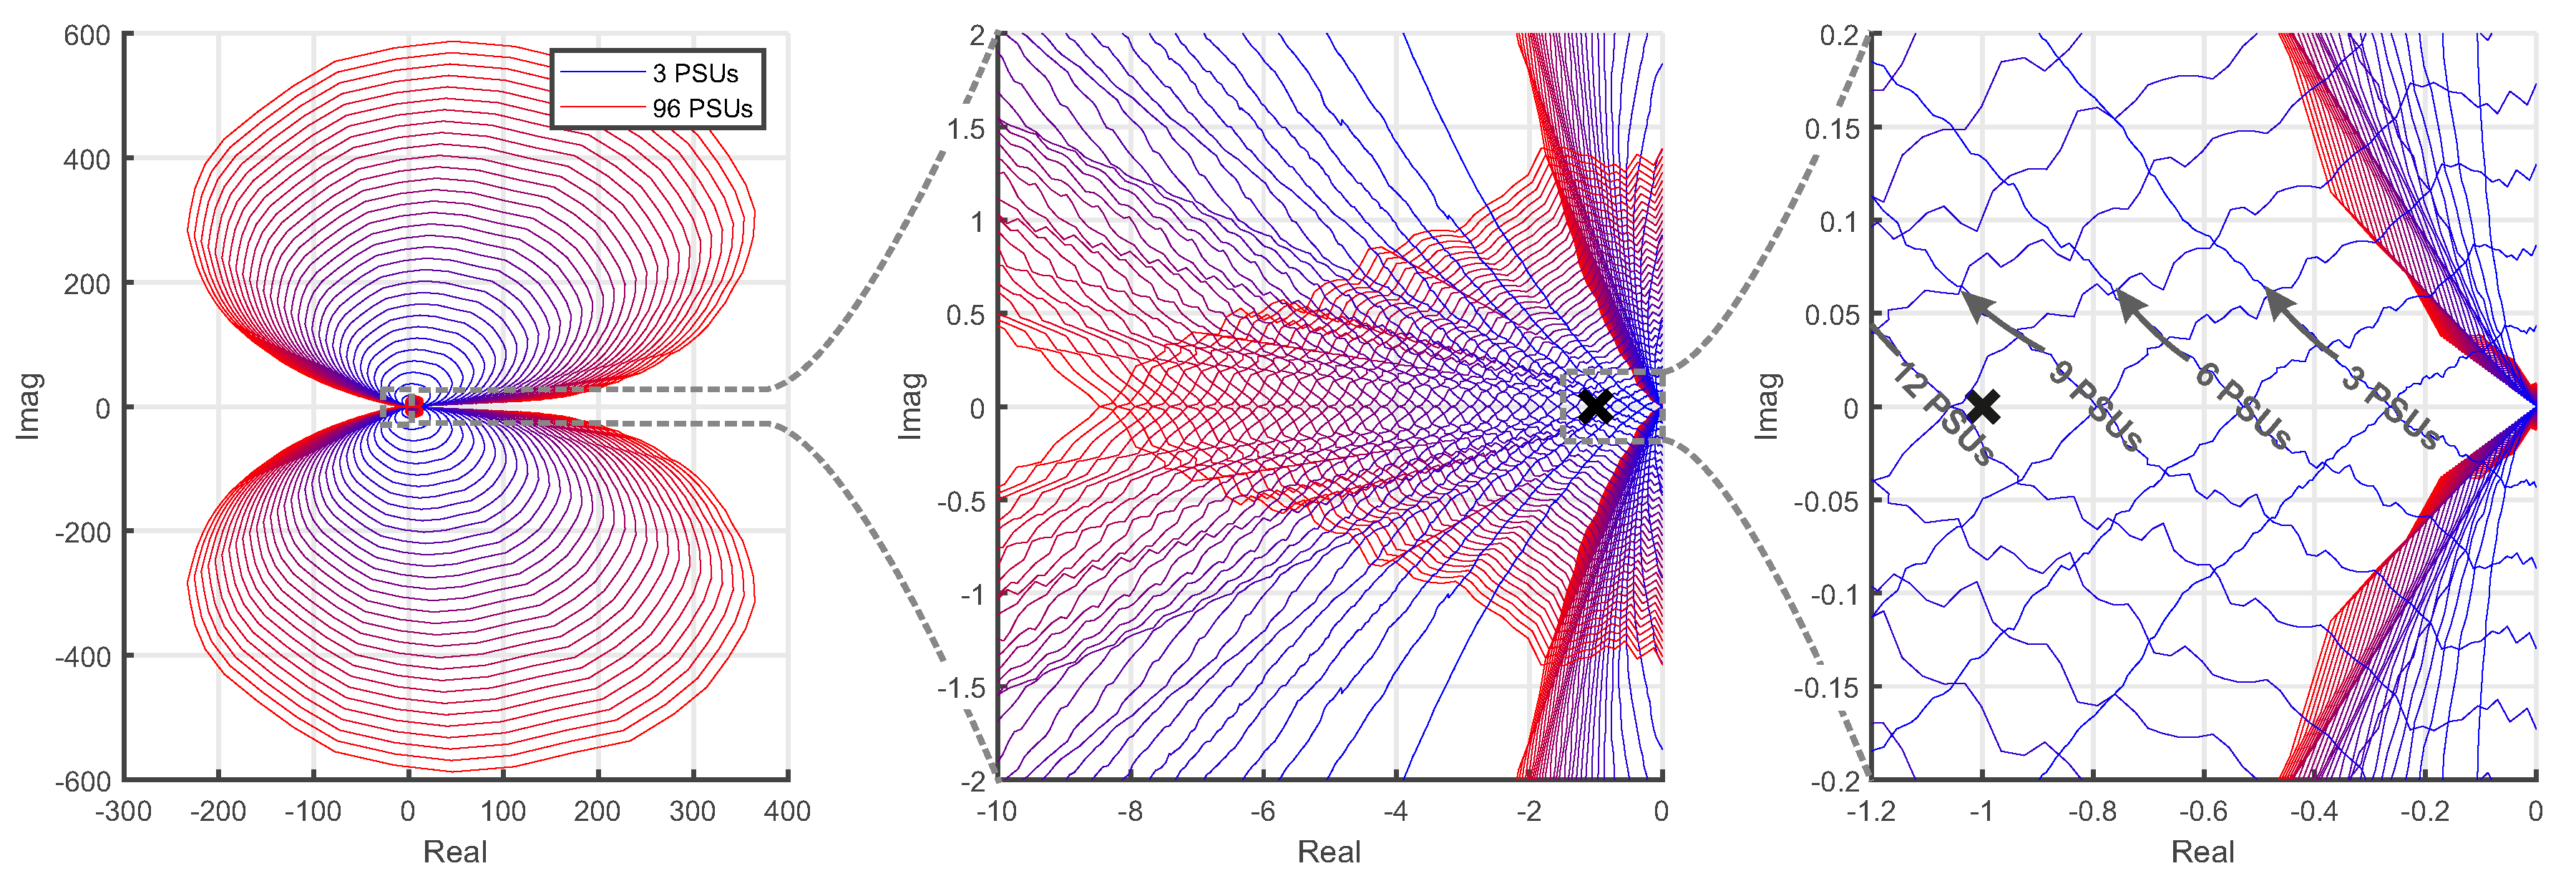
The stability analysis is performed by applying the presented impedance-based stability criterion (Section 2.1) and aggregation of identical parallel devices (Section 2.2). The PSU impedance is obtained through experimental measurements, and the grid impedance is analytically derived from the known grid parameters. The single-phase PSUs are assumed to be evenly distributed in the three phases. Figure 11 presents the modeled grid impedance (left, black) and the total impedance of parallel PSUs ranging from 3 to 96 units (right, blue to red). The PSUs operate at 80% loading conditions (2000 W) and all the units are assumed to be identical to the experimentally measured unit. The total impedance is obtained using (5).
The first method applied for the stability analysis is Nyquist criterion where the minor loop gain (the impedance ratio) is drawn in complex plane. The system is stable if the contour does not encircle the critical point . Figure 12 presents the Nyquist contours for the paralleled PSUs. As seen from the figure, increasing the number of PSUs from 9 to 12 shifts the contour to left resulting in encirclement of the critical point. Thus, the maximum number of paralleled devices is only 9 based on the impedance-based Nyquist analysis.
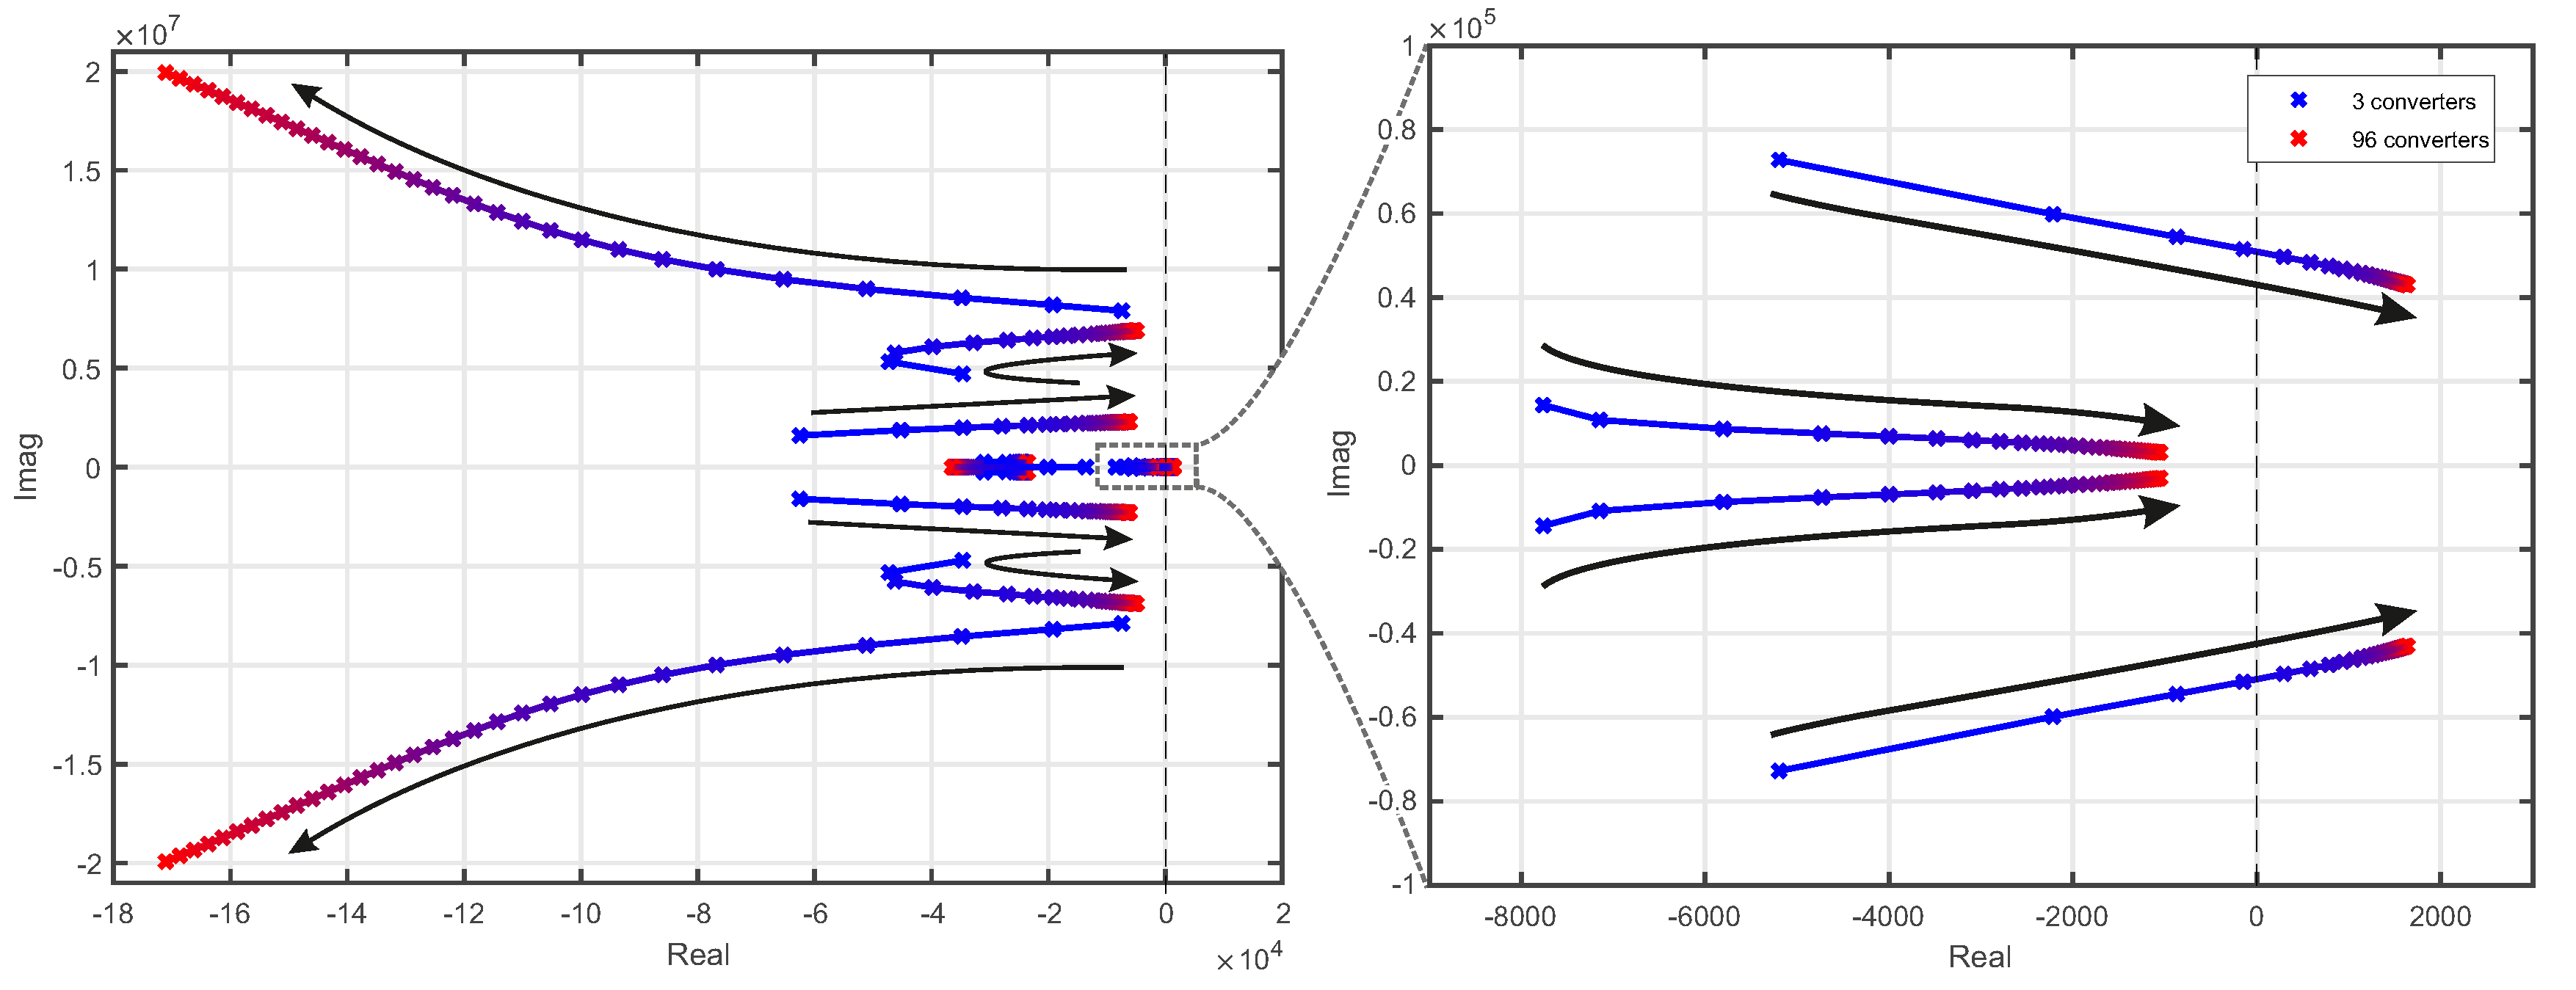
As a complementary method, a closed-loop stability of the system can be assessed through transfer function fitting and pole-zero analysis. The closed-loop poles of the system correspond to the eigenvalues of the system and describe the resonant modes by yielding the resonance frequencies and damping factors. Consequently, in addition to the absolute stability illustrated in the Nyquist contours, the modal analysis of closed-loop poles yield also the stability margins of the system. A linear time-invariant transfer function can be fitted to the aggregated PSU input impedance. Based on the fitted transfer functions, the closed-loop poles of the system are obtained by using (2). The poles shift as the number of parallel PSUs is increased, which corresponds to the changing stability margins of the system. Figure 13 shows the root loci of the system closed-loop poles, which show that the right-most pole pair (critical pole pair) shifts from LHP to RHP as the number of parallel devices increases from 12 to 15. The prediction of the stability boundary differs from the Nyquist analysis by 3 converters (1 per phase), which results from the slight inaccuracies in the transfer-function fitting performed for the closed-loop pole analysis. However, the eigenvalue analysis is an auxiliary method that aims to obtain the resonant modes and dampings, and the absolute stability should be assessed applying the unmodified measurement data in Nyquist analysis.
The critical poles have frequencies in the range of 6–8 kHz for multiple paralleled PSUs as showed in detail in Table A1 in Appendix A. This frequency corresponds accurately to the frequency of oscillation observed in the data center shown in Figure 5. Thus, the performed stability analysis predicted both the instability of the data center and the resonance frequency.
5. Discussion
While the dynamics of grid-connected converters and related stability analysis methods are widely studied, real-life cases and applications of the methods still remain rare. This study presented a practical implementation of an impedance-based stability analysis, where the instability of a commercial data center is explained directly from the black-box impedance measurements of a single PSU. The steps of this process are
- Model the grid impedance at the point-of-common coupling;
- Measure the input impedance of a converter;
- Aggregate the parallel devices;
- Calculate the impedance ratio and avoid RHP poles;
- Perform the stability analysis through Nyquist contours or closed-loop eigenvalues.
In this study, only a limited amount of information was available from the data center: the parameters of the grid connection and the number of paralleled PSUs were known, and a PSU acquired from the data center. The detailed wiring schematics, topology of the PSUs, and control schemes of the PSUs were all unknown or unavailable. Consequently, the impedance-based stability analysis utilizing the terminal impedance measurements of a PSU is the only method that can cope with these limitations. The impedance measurements were performed for a single PSU, and the rest were assumed identical. While all the PSUs were the same model, a variation is possible in the component values of the units. The detailed connection configuration of the PSUs and resonance frequency spectrum were unavailable. In addition, the PSU could not be measured in natural operation, where the load is graphical or central processing units. Instead, a resistive load was built to consume the output power, so that the PSUs can be measured at a nominal power. The output load may have impact on the input impedance through load effect, which may result in slight inaccuracies in the impedance measurements. Despite these challenges, the applied stability analysis predicted both the instability and the resonant frequencies, and the unstable operation could have been avoided if a similar analysis had been performed prior to commissioning the data center.
Mitigating the stability issues post-commissioning can be tedious or expensive, as it is significantly easier to avoid the stability issues instead of attempting to fix them. In general, the main contributor for stability issues in systems that consist of multiple parallel converters is a high grid impedance, that increases the interaction between the converters. In an ideal grid, an arbitrary number of converters can be connected in parallel, as all the current is directed to the zero-impedance grid and the bus voltages are rigid, and consequently, the converters cannot interact with each other. Consequently, the most straightforward method for resolving stability issues in such systems is to decrease the grid impedance by strengthening the grid through investments such as increasing the power rating of the grid-interfacing transformer or adding parallel cables from the transformer to the converters. However, these are often costly investments, and the viability should be carefully assessed by utilizing, for example, the presented measurement-based impedance analysis. In the presented data center, the PSUs were highly unsuited for multi-parallel operation due to the drastic resonant peak and present RHP zero pair. Very significant grid investments would have been required to decrease the grid impedance enough to stabilize the system, and thus, the most applicable solution was to completely replace the PSUs. Again, the replacement PSUs should be assessed beforehand to ensure the compatible operation.
6. Conclusions
Impedance-based stability criterion is a valuable tool in analysis of grid-connected systems. This work has shown a practical approach and a case study in which the stability criterion was applied to explain the instability occurred in a new data center in Southern Finland. The instability was observed as a sustained high-frequency resonance that had amplitude of 31% of nominal grid voltages measured at the grid-coupling transformer. The instability originated from paralleled rectifiers used in power supplying that had total power capacity of 250 kW.
In this work, the input impedance of a single power-supplying rectifier acquired from the data center was measured and the impedance-based stability analysis was extended to multi-converter systems, where the analysis was performed based on aggregated impedance-based stability criterion. The analysis revealed decreasing stability margins as more units were connected in parallel, until the stability was lost when the number of paralleled devices was increased to 12 (total power of 30 kW). In addition, system eigenvalue analysis accurately predicted the resonance frequency to the range of 6–8 kHz, which was the resonant frequency in the initial on-site measurements at the data center. To conclude the findings, the instability of the data center along with resonant modes could have been predicted by measuring the input impedance of a single rectifier and applying aggregated impedance-based stability criterion.
Author Contributions
Conceptualization, H.A.; Methodology, H.A.; Software, H.A. and T.R.; Validation, H.A.; Formal Analysis, H.A.; Investigation, H.A.; Resources, T.R.; Data Curation, H.A.; Writing – Original Draft Preparation, H.A.; Writing – Review & Editing, T.R.; Visualization, H.A.; Supervision, T.R.; Project Administration, T.R.; Funding Acquisition, T.R. All authors have read and agreed to the published version of the manuscript.
Funding
This research was funded by Business Finland.
Conflicts of Interest
The authors declare no conflict of interest.
Appendix A. Critical Poles of Paralleled PSUs
Table A1 shows the detailed characteristics of the critical pole pair for varying number of parallel PSUs, as shown in Figure 13. Increasing the number of paralleled PSUs above 12 results in pole-shift to RHP, which indicates unstable system described by the negative damping factors shown in red.

Table A1.
Critical pole pairs.
| Parallel PSUs | Critical Pole Pair (1000 rad/s) | Frequency (Hz) | Damping Factor |
|---|---|---|---|
| 3 | −5.197 ± 72.761i | 11,609.8 | 0.0714 |
| 6 | −2.216 ± 59.83i | 9528.8 | 0.0370 |
| 9 | −0.871 ± 54.448i | 8666.8 | 0.0160 |
| 12 | −0.147 ± 51.515i | 8198.9 | 0.0029 |
| 15 | 0.293 ± 49.674i | 7906 | −0.0059 |
| 18 | 0.583 ± 48.412i | 7705.6 | −0.0120 |
| 21 | 0.786 ± 47.493i | 7559.8 | −0.0166 |
| 24 | 0.936 ± 46.794i | 7449.0 | −0.0200 |
| 27 | 1.049 ± 46.246i | 7362.2 | −0.0227 |
| 30 | 1.139 ± 45.803i | 7292.0 | −0.0249 |
| 33 | 1.210 ± 45.439i | 7234.4 | −0.0266 |
| 36 | 1.269 ± 45.134i | 7186.1 | −0.0281 |
| 39 | 1.317 ± 44.874i | 7145.0 | −0.0294 |
| 42 | 1.358 ± 44.651i | 7109.7 | −0.0304 |
| 45 | 1.393 ± 44.458i | 7079.2 | −0.0313 |
| 48 | 1.424 ± 44.287i | 7052.1 | −0.0321 |
| 51 | 1.450 ± 44.137i | 7028.4 | −0.0328 |
| 54 | 1.473 ± 44.003i | 7007.2 | −0.0335 |
| 57 | 1.494 ± 43.883i | 6988.2 | −0.0340 |
| 60 | 1.512 ± 43.775i | 6971.2 | −0.0345 |
| 63 | 1.528 ± 43.677i | 6955.7 | −0.0350 |
| 66 | 1.543 ± 43.588i | 6941.6 | −0.0354 |
| 69 | 1.556 ± 43.506i | 6928.6 | −0.0358 |
| 72 | 1.568 ± 43.431i | 6916.8 | −0.0361 |
| 75 | 1.579 ± 43.362i | 6905.9 | −0.0364 |
| 78 | 1.590 ± 43.299i | 6895.9 | −0.0367 |
| 81 | 1.599 ± 43.239i | 6886.4 | −0.0370 |
| 84 | 1.608 ± 43.185i | 6877.9 | −0.0372 |
| 87 | 1.616 ± 43.134i | 6869.8 | −0.0375 |
| 90 | 1.623 ± 43.086i | 6862.2 | −0.0377 |
| 93 | 1.630 ± 43.041i | 6855.1 | −0.0379 |
| 96 | 1.636 ± 42.999i | 6848.5 | −0.0381 |
References
- Bose, B. Global Energy Scenario and Impact of Power Electronics in 21St. Century. IEEE Trans. Ind. Electron. 2013, 60, 2638–2651. [Google Scholar] [CrossRef]
- Koomey, J. Woldwide electricity use in data centers. Environ. Res. Lett. 2008, 3, 220–236. [Google Scholar] [CrossRef] [Green Version]
- Kosharnaya, Y.; Yanchenko, S.; Kulikov, A. Specifics of Data Mining Facilities as Energy Consumers. In Proceedings of the 12th International Scientific and Technical Conference on Dynamics of Systems, Mechanisms and Machines, Omsk, Russia, 13–15 November 2018; pp. 1–4. [Google Scholar] [CrossRef]
- Harinath, P.; Kamaleswaran, K.; Venkateshwaran, M.; Sreenath, C.; Prabhakaran, S.; Kirubakaran, V. A critical analysis of Power Quality issues in Data Center. In Proceedings of the 2016 Biennial International Conference on Power and Energy Systems: Towards Sustainable Energy (PESTSE), Bengaluru, India, 21–23 January 2016; pp. 1–6. [Google Scholar]
- Nassif, A.B.; Wang, Y.; Rahimi Pordanjani, I. Power Quality Characteristics and Electromagnetic Compatibility of Modern Data Centres. In Proceedings of the 2018 IEEE Canadian Conference on Electrical Computer Engineering (CCECE), Québec City, QC, Canada, 13–16 May 2018; pp. 1–4. [Google Scholar]
- Suntio, T.; Messo, T.; Berg, M.; Alenius, H.; Reinikka, T.; Luhtala, R.; Zenger, K. Impedance-Based Interactions in Grid-Tied Three-Phase Inverters in Renewable Energy Applications. Energies 2019, 12, 464. [Google Scholar] [CrossRef] [Green Version]
- Alenius, H.; Berg, M.; Luhtala, R.; Roinila, T.; Messo, T. Impedance-Based Stability Analysis of Multi-Parallel Inverters Applying Total Source Admittance. In Proceedings of the 2019 20th Workshop on Control and Modeling for Power Electronics (COMPEL), Toronto, ON, Canada, 16–19 June 2019; pp. 1–8. [Google Scholar] [CrossRef]
- Li, C. Unstable Operation of Photovoltaic Inverter from Field Experiences. IEEE Trans. Power Deliv. 2017, 33, 1013–1015. [Google Scholar] [CrossRef]
- Buchhagen, C.; Rauscher, C.; Menze, A.; Jung, J. BorWin1—First Experiences with harmonic interactions in converter dominated grids. In Proceedings of the International ETG Congress 2015; Die Energiewende—Blueprints for the New Energy Age, Bonn, Germany, 17–18 November 2015; pp. 27–33. [Google Scholar]
- Wang, L.; Xie, X.; Jiang, Q.; Liu, H.; Li, Y.; Liu, H. Investigation of SSR in Practical DFIG-Based Wind Farms Connected to a Series-Compensated Power System. IEEE Trans. Power Syst. 2015, 30, 2772–2779. [Google Scholar] [CrossRef]
- Amin, M.; Molinas, M. Small-Signal Stability Assessment of Power Electronics based Power Systems: A Discussion of Impedance- and Eigenvalue-based Methods. IEEE Trans. Ind. Appl. 2017, 53, 5014–5030. [Google Scholar] [CrossRef]
- Wang, Y.; Wang, X.; Blaabjerg, F.; Chen, Z. Harmonic instability assessment using state-space modeling and participation analysis in inverter-fed power systems. IEEE Trans. Ind. Electron. 2017, 64, 806–816. [Google Scholar] [CrossRef]
- Zhou, J.Z.; Ding, H.; Fan, S.; Zhang, Y.; Gole, A.M. Impact of short circuit ratio and phase locked loop parameters on the small signal behavior of a VSC HVDC converter. IEEE Trans. Power Deliv. 2014, 29, 2287–2296. [Google Scholar] [CrossRef]
- Sun, J. Impedance-based stability criterion for grid-connected inverters. IEEE Trans. Power Electron. 2011, 26, 3075–3078. [Google Scholar] [CrossRef]
- Vesti, S.; Suntio, T.; Oliver, J.A.; Prieto, R.; Cobos, J.A. Impedance-based stability and transient-performance assessment applying maximum peak criteria. IEEE Trans. Power Electron. 2013, 28, 2099–2104. [Google Scholar] [CrossRef] [Green Version]
- Rygg, A. Impedance-Based Methods for Small-Signal Analysis of Systems Dominated by Power Electronics. Ph.D. Thesis, NTNU, Trondheim, Norway, 2018. [Google Scholar]
- Roinila, T.; Messo, T.; Santi, E. MIMO-identification techniques for rapid impedance-based stability assessment of three-phase systems in DQ Domain. IEEE Trans. Power Electron. 2018, 33, 4015–4022. [Google Scholar] [CrossRef]
- Sun, J.; Xu, M.; Cespedes, M.; Wong, D.; Kauffman, M. Modeling and analysis of data center power system stability by impedance methods. In Proceedings of the 2019 IEEE Energy Conversion Congress and Exposition, ECCE 2019, Baltimore, MD, USA, 29 September–3 October 2019; pp. 107–116. [Google Scholar] [CrossRef]
- Cespedes, M.; Sun, J. Three-phase impedance measurement for system stability analysis. In Proceedings of the IEEE 14th Workshop on Control and Modeling for Power Electronics (COMPEL), Salt Lake City, UT, USA, 23–26 June 2013; pp. 1–6. [Google Scholar]
- Tang, Y.; Burgos, R.; Wen, B.; Boroyevich, D.; Verhulst, J.; Vrtachnik, D.; Belkhayat, M. A Novel DQ Impedance Measurement Method in Three-Phase Balanced Systems. In Proceedings of the 2019 20th Workshop on Control and Modeling for Power Electronics (COMPEL), Toronto, ON, Canada, 16–19 June 2019; pp. 1–5. [Google Scholar] [CrossRef]
- Roinila, T.; Messo, T.; Suntio, T.; Vilkko, M. Pseudo-Random Sequences in DQ-Domain Analysis of Feedforward Control in Grid-Connected Inverters. In Proceedings of the 17th IFAC Symposium on System Identification SYSID 2015, Beijing, China, 19–21 October 2015; Volume 48, pp. 1301–1306. [Google Scholar] [CrossRef]
- Tan, A.H.; Godfrey, K. Industrial Process Identification—Perturbation Signal Design and Applications; Springer: Berlin, Germany, 2019; p. 217. [Google Scholar]
- Middlebrook, D. Input filter considerations in design and applications of switching regulators. In Proceedings of the IEEE Industry Applications Society Annual Meeting, Chicago, IL, USA, 11–14 October 1976; pp. 91–107. [Google Scholar]
- Liao, Y.; Wang, X. General Rules of Using Bode Plots for Impedance-Based Stability Analysis. In Proceedings of the 2018 IEEE 19th Workshop on Control and Modeling for Power Electronics (COMPEL), Padova, Italy, 25–28 June 2018; pp. 1–6. [Google Scholar] [CrossRef]
- Roinila, T.; Vilkko, M.; Sun, J. Broadband methods for online grid impedance measurement. In Proceedings of the IEEE Energy Conversion Congress and Exposition (ECCE), Denver, CO, USA, 15–19 September 2013; pp. 3003–3010. [Google Scholar] [CrossRef]
- Godfrey, K. Perturbation Signals for System Identification; Prentice Hall: London, UK, 1993. [Google Scholar]
- Standard EN 50160. Voltage Characteristics of Electricity Supplied by Public Distribution System; EN: Brussels, Belgium, 2004. [Google Scholar]
Figure 1.
2400 W single-phase power-supplying unit.

Figure 2.
Source-load equivalent circuit for a grid-connected rectifier.

Figure 3.
Source-load equivalent circuit for parallel-connected rectifier.

Figure 4.
Maximum-length binary sequence in time-domain and frequency-domain.

Figure 5.
Unstable operation in a data center: distorted phase voltages.

Figure 6.
Schematic diagram of the data center and the grid.

Figure 7.
Schematic diagram of the experimental measurement setup.

Figure 8.
Modular passive load for emulating DC power consumption.

Figure 9.
Measured PSU input impedance with input powers varying from 0 to 2000 W (blue to red, from 0% to 80%).
Figure 9.
Measured PSU input impedance with input powers varying from 0 to 2000 W (blue to red, from 0% to 80%).

Figure 10.
Pole-pair that shifts from LHP to RHP as the output power increases.

Figure 11.
Modeled grid impedance (left, black) and aggregated measured PSU impedance (left, blue to red).
Figure 11.
Modeled grid impedance (left, black) and aggregated measured PSU impedance (left, blue to red).

Figure 12.
Nyquist contour of the minor loop gain when the number of paralleled PSUs is increased.

Figure 13.
Pole path for critical system poles as the number of paralleled PSUs is increased.

Table 1.
Parameters of grid connection.
| Parameter | Value | |
|---|---|---|
| Cable | Length | 88 m |
| Resistance | 0.20 /km | |
| Capacitance | 0.28 F/km | |
| Inductance | 0.26 mH/km | |
| Transformer | Nominal power | 500 kW |
| Voltage | 20.5/0.41 kV | |
| Resistance | 1.064% | |
| Reactance | 4.420% |
© 2020 by the authors. Licensee MDPI, Basel, Switzerland. This article is an open access article distributed under the terms and conditions of the Creative Commons Attribution (CC BY) license (http://creativecommons.org/licenses/by/4.0/).
Share and Cite
MDPI and ACS Style
Alenius, H.; Roinila, T. Impedance-Based Stability Analysis of Paralleled Grid-Connected Rectifiers: Experimental Case Study in a Data Center. Energies 2020, 13, 2109. https://0-doi-org.brum.beds.ac.uk/10.3390/en13082109
AMA Style
Alenius H, Roinila T. Impedance-Based Stability Analysis of Paralleled Grid-Connected Rectifiers: Experimental Case Study in a Data Center. Energies. 2020; 13(8):2109. https://0-doi-org.brum.beds.ac.uk/10.3390/en13082109
Chicago/Turabian StyleAlenius, Henrik, and Tomi Roinila. 2020. "Impedance-Based Stability Analysis of Paralleled Grid-Connected Rectifiers: Experimental Case Study in a Data Center" Energies 13, no. 8: 2109. https://0-doi-org.brum.beds.ac.uk/10.3390/en13082109
Note that from the first issue of 2016, this journal uses article numbers instead of page numbers. See further details here.