
One-Dimensional Analysis of Double Annular Combustor for Reducing Harmful Emissions


School of Mechanical Engineering, Chungbuk National University, Chungdae-ro 1, Seowon-gu, Cheongju 28644, Chungbuk, Korea
*
Authors to whom correspondence should be addressed.
Energies 2021, 14(13), 3930; https://0-doi-org.brum.beds.ac.uk/10.3390/en14133930
Submission received: 2 June 2021
/
Revised: 22 June 2021
/
Accepted: 22 June 2021
/
Published: 30 June 2021
(This article belongs to the Special Issue Technologies Conducive to Low Green House Gas Emission)
Abstract
:The number of aircraft flights worldwide has increased steadily since the introduction of air transportation to the public. Accordingly, environmental issues caused by the exhaust gases of aircraft engines have emerged. In particular, international organizations have crafted emission regulations since gases exhausted during takeoff and landing have been identified as the direct cause of air pollution near airports. Nitrogen oxides (NOx) produced at high combustion temperatures and carbon monoxide (CO) due to incomplete combustion affect the performance of the combustion chamber. Therefore, annular combustors comprising two annular zones have been developed to reduce the emissions of these two substances, which occur under different conditions. Parameters that should be considered when modifying a conventional single annular (SAC) to a double annular combustor (DAC) are discussed herein. In this paper, an optimization algorithm for obtaining the main design parameters of the DAC is presented to minimize NOx and CO emissions and an operation solution for reducing carbon monoxide emission is identified. A thermodynamic model of a high-bypass turbofan engine (PS-90A) is used to establish the inlet and outlet conditions of the combustor. Analysis results show that NOx emissions can be effectively reduced by adjusting the design parameters and CO emissions can be significantly decreased by partially turning off the fuel supply based on the engine cycle.

1. Introduction
The flight times of civilian aircraft equipped with gas turbine engines have increased steadily over the past few decades owing to the promotion of air transport. Hence, the effects of aircraft emissions on the atmosphere have increased. According to Onischik et al. [1] and Korinevskaya et al. [2], the eddy airflow caused by an aircraft’s wake retains harmful substances in the area around the aerodrome, thereby adversely affecting humans. In addition, Zhu et al. [3] stated that fine dust at large international airports is proportional to the number of flights. Hence, the Committee on Aviation Environmental Protection (CAEP) of the International Civil Aviation Organization (ICAO) is continuing its effort in strengthening regulations pertaining to hazardous emissions (NOx, CO, THC, etc.) [4].
An important issue in the design of civil aviation gas turbine engines is compliance with international environmental standards. Various intermediate products and combustion products are discharged when the air–fuel mixture reacts in the engine combustor. Among them, emissions, except carbon dioxide and water, adversely affect the human body. Since the 1970s, NASA Glenn Laboratories, General Electric, and Pratt and Whitney have developed various types of combustors to solve this problem [4]. Premixing in the fuel-lean state can reduce the adiabatic flame temperature for suppressing NOx generation. Using this principle, NASA developed a heterogeneously catalyzed combustor [5] that reduces the possibility of combustion instability, a swirl-can-type combustor with a rapid quenching effect, and a combustor comprising several partial premixes of fuel and air [6]. The lean direct-injection-type combustor concept was investigated to reduce the risk of auto-ignition or flash-back, which can occur when the air temperature is increased, to increase the efficiency of rapid vaporization and premixing [7]. When the combustion efficiency decreases, the concentrations of carbon monoxide and unburned fuel increase. Therefore, air-assisted fuel nozzles have been applied to generate fine droplets [6,8], and catalysts have been used in injection systems [9].
The type and concentration of emitted substances typically depend on the thrust mode of a typical combustor. The generation of nitrogen oxides is significant in the high-temperature maximum thrust mode, and materials from complete burning (unburned hydrocarbons, carbon monoxide, etc.) are easily generated in the fuel-rich idle mode. General Electric [10] has successfully reduced the NOx concentration considerably using a twin annular premixing swirler (TAPS) lean-burn system, achieving a uniform temperature distribution in the combustion chamber, and Rolls-Royce [11] developed an advanced Rich-Quench-Lean (RQL) combustor for NOx reduction. However, according to Feng et al. [12], a TAPS can produce more CO than conventional combustors because of the rich-burn near the injector head. In this case, it can be inferred that the reduction of harmful substances in all operation modes is limited when only the fuel atomization system is improved. General Electric and Pratt and Whitney developed a multistaged combustor to solve this contradictory problem [6]. Such a combustor may consist of pilot and main zones arranged axially or radially. Each zone can control the amount of fuel based on the engine mode, and the total amounts of NOx and CO generated over the entire flight cycle can be reduced. Among the proposed formats, the double annular combustor (DAC) with radially arranged zones has been applied to commercial engines CFM56 and GE90 [4]. The DAC can still be further developed as a TAPS (GE90) [10] and a lean premixed pre-vaporized injection system, i.e., a Component vaLidator for Environmentally friendly Aero-eNgine demonstrator [13,14], have been applied recently as well as the conventional injectors.
Feng et al. [12,15] confirmed the necessary conditions for the pilot and main zones by analyzing the difference in the generation of harmful substances in a single annular combustor (SAC) and a DAC through computer simulations. Through mathematical simulations, Yin et al. [16] confirmed that the combustor shape and airflow distribution rate affected the emission of harmful substances. These results indicate that the structural parameters of the DAC are associated closely with the concentrations of the combustion products. Sarkisov et al. [17,18] obtained the relationship between design and condition parameters as well as that between NOx and CO emissions using test data of engines with a SAC and presented their empirical equations. Several researchers have suggested the design theory of the SAC. Mousemi et al. [19] presented an integrated approach for designing a combustor liner by applying a coupling between a swirl injector and a swirler. Saboohi et al. [20] organized an automated 2D conceptual design algorithm of combustor considering the shape and size of the snout part located in front of the dome of the primary zone and recirculation zone. Saboohi et al. [21] used a chemical reactor network (CRN) approach, and the emission indices of NOx and CO were considered as major factors in the optimization algorithm for the selection of design variables. Khandelwal et al. [22] suggested the design of a DAC based on the design theory of the SAC. However, few have suggested DAC sizing from the viewpoint of minimizing harmful emissions. In this study, an algorithm was presented to obtain the initial design values of the DAC that minimizes NOx and CO emissions. The effect of radial DAC design parameters on the concentration of emissions was investigated. To obtain the minimum emissions of NOx and CO, the Nelder–Mead simplex algorithm and the Box–Wilson strategy (the gradient method) based on the fractional 2N design technique were used to optimize the design factors.
2. Analysis Method
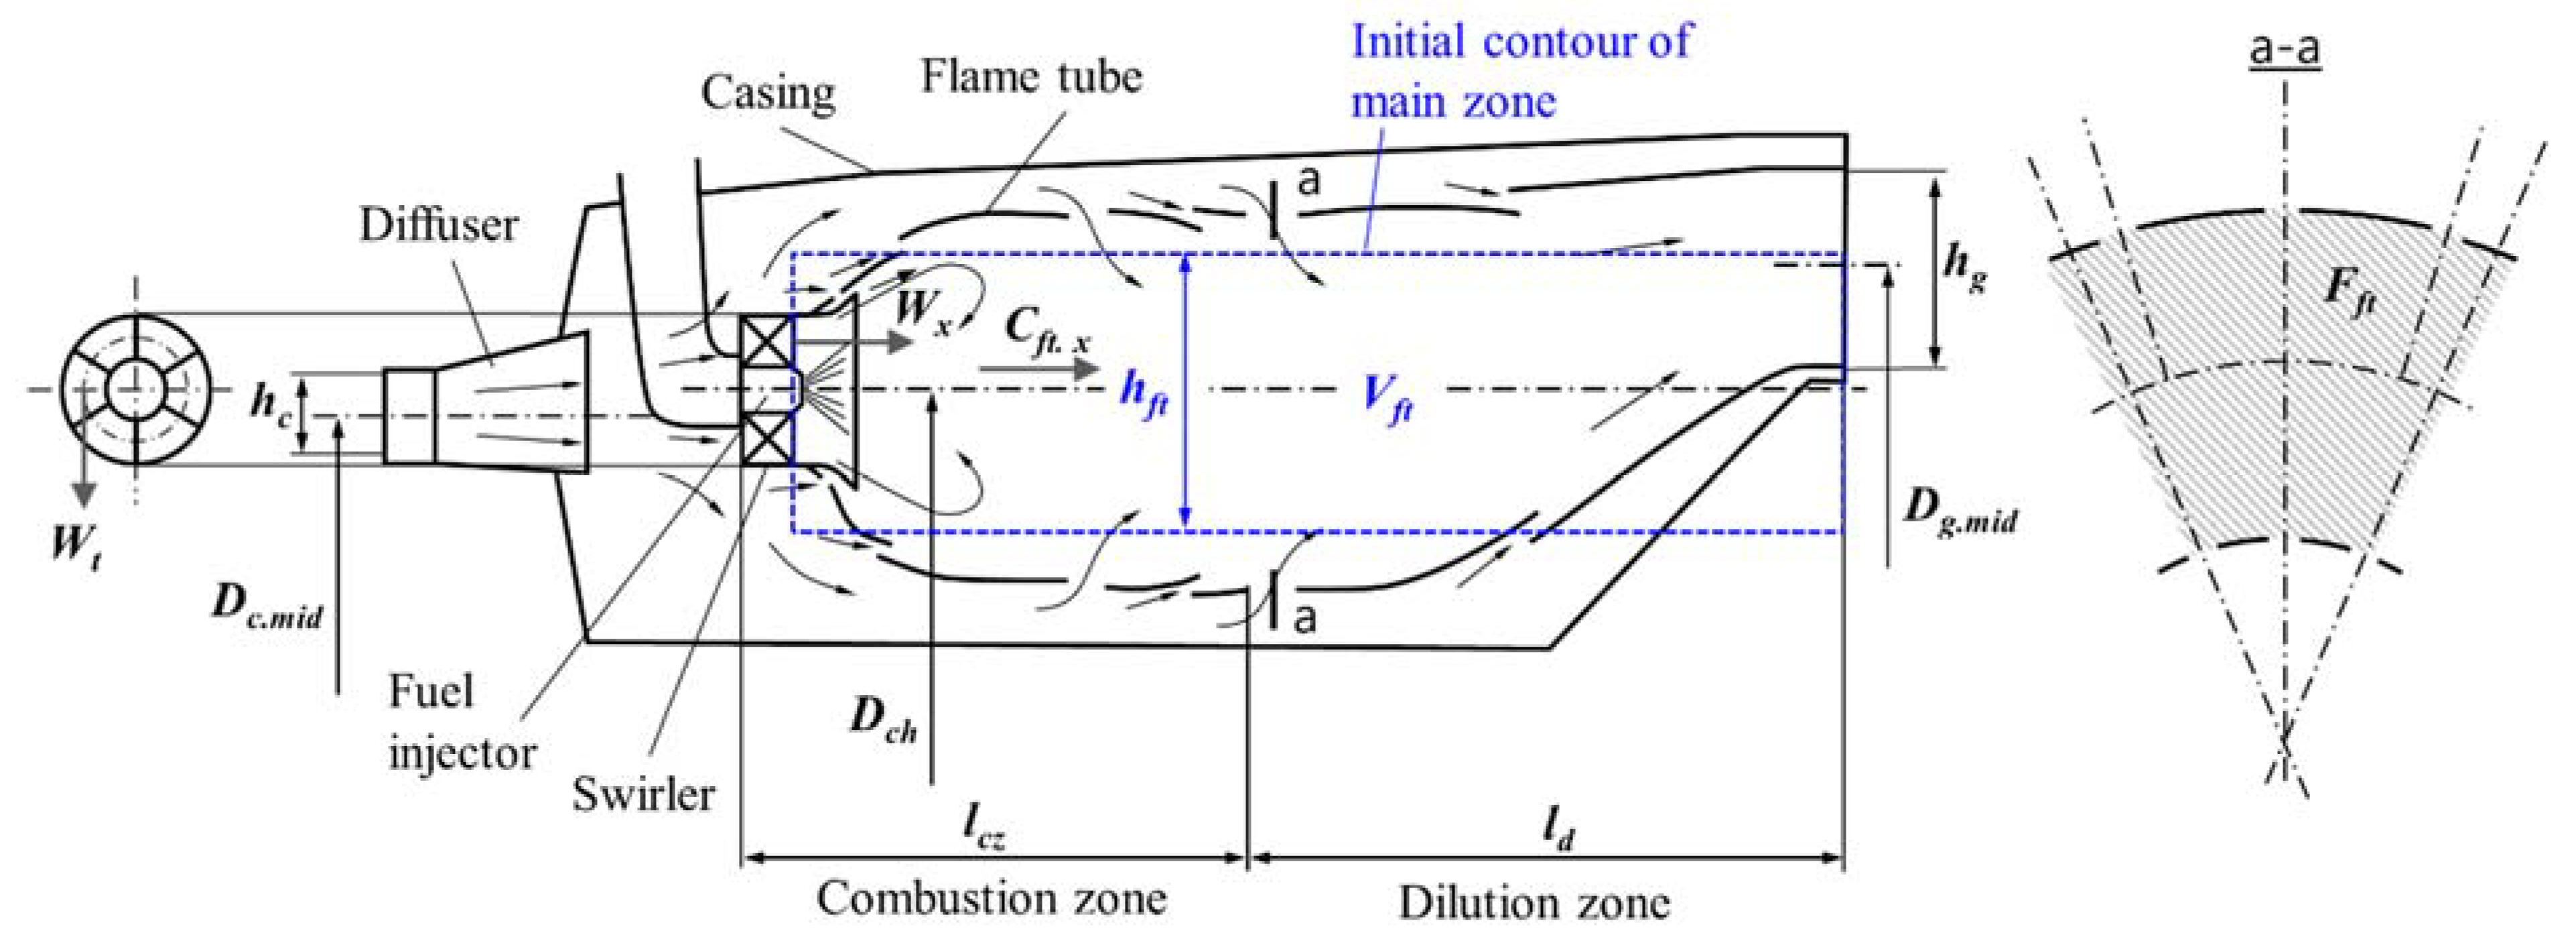
Kovner et al. [23] presented the shape of a general annular-type gas turbine engine combustor, as shown schematically in Figure 1. After the pressure and temperature are increased by the compressor, the air passes through the diffuser from the left side and enters the casing. In Figure 1, the middle diameter of the last-stage stator blade of the compressor is represented by the diameter Dc.mid. Some of the air passes through the swirler to form a recirculation zone, and fuel is sprayed at the center of the swirler and burned in the combustion zone of the flame tube. The combustion zone is defined as the space where the combustion process is completed. Its axial range is regarded as the space of the flame tube from the inlet of the swirler to the beginning of the dilution zone, and its length is indicated by lcz. The remaining mass fraction of air enters the flame tube in a stepwise manner from the annular space between the casing and the flame tube through the primary zone holes, secondary holes, dilution holes, and cooling slots to participate in the combustion, dilution, and cooling processes, respectively. Subsequently, the gas exits to the right to rotate the turbine. In Figure 1, the middle diameter of the turbine inlet stator is denoted as Dg.mid.
A sufficient volume must be ensured to realize a successful combustion process during combustor sizing. In the initial step of the flame tube sizing, a simple annular column having sufficient volume can be assumed, as shown in the blue dotted line in Figure 1. The geometric parameter hft represents the height of the initial flame tube. Among the factors affecting the combustor volume sizing, the engine restart condition during flight can be considered. It is known that the combustion efficiency should be approximately 75% or higher for a successful restart when the gas turbine engine is stopped in the air and changed into the autorotation state [23]. According to Doroshenko [25], the combustion efficiency depends on the volume of the combustion zone and the thermodynamic state of the air at the compressor outlet. Moreover, according to Kovner et al. [23], the volume of the combustion chamber can be related to the maximum restartable altitude Hign. At first, the volume of the combustion zone Vcz can be expressed by Equation (1) [24] using Doroshenko’s equation [25]. Here, the subscript H1 represents the case in which the flight Mach number is Mf ≈ 1 at altitude H = Hign, and KV is a parameter of combustion augmentation similar to parameter θ suggested by Khandelwal et al. [22]. Onischik et al. [26] and Kovner et al. [23] suggested that excess air coefficient αcz.H1 and combustion augmentation parameter KV.cz.H1 in the combustion zone at the autorotation state are close to 1.7 and in the range of 0.45–0.55, respectively. If the volume Vcz is obtained, hft can be obtained as in Equation (2) [23]. When the average axial air velocity in the flame tube without burning Cft.x is used instead of Hign, the average cross-section area of the flame tube Fft and hft can be obtained using the continuous equation shown in Equations (3) and (4), respectively [23]. Then the flame tube volume is calculated by the semi-empirical Equation (5) [23].
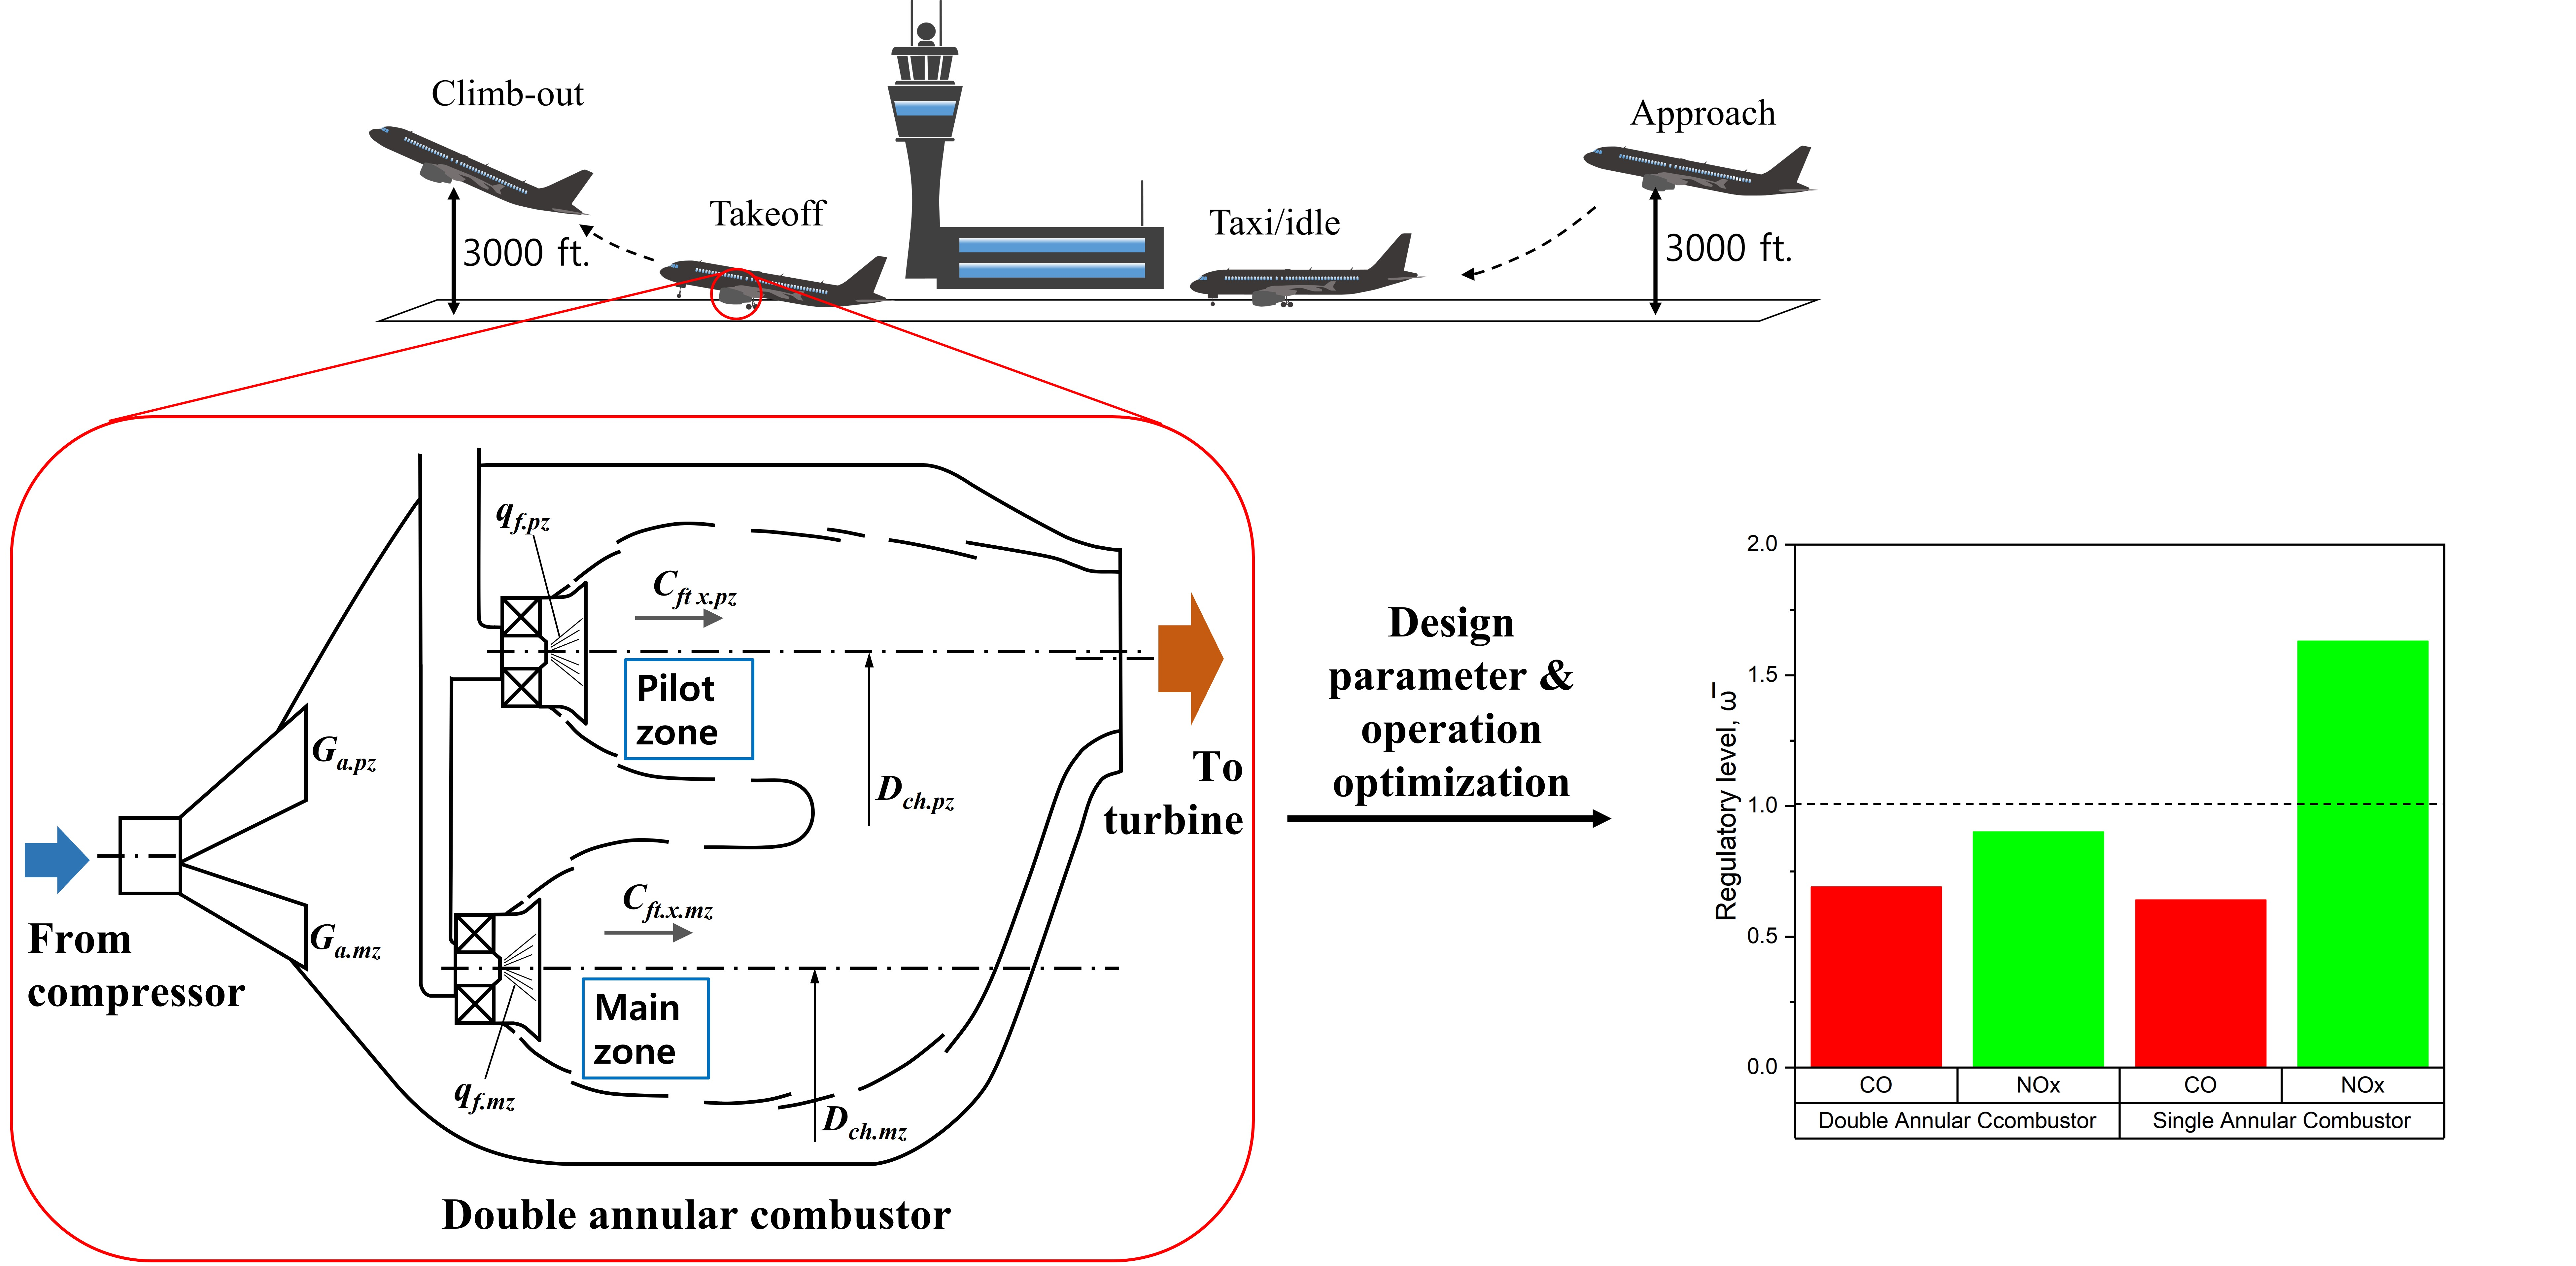
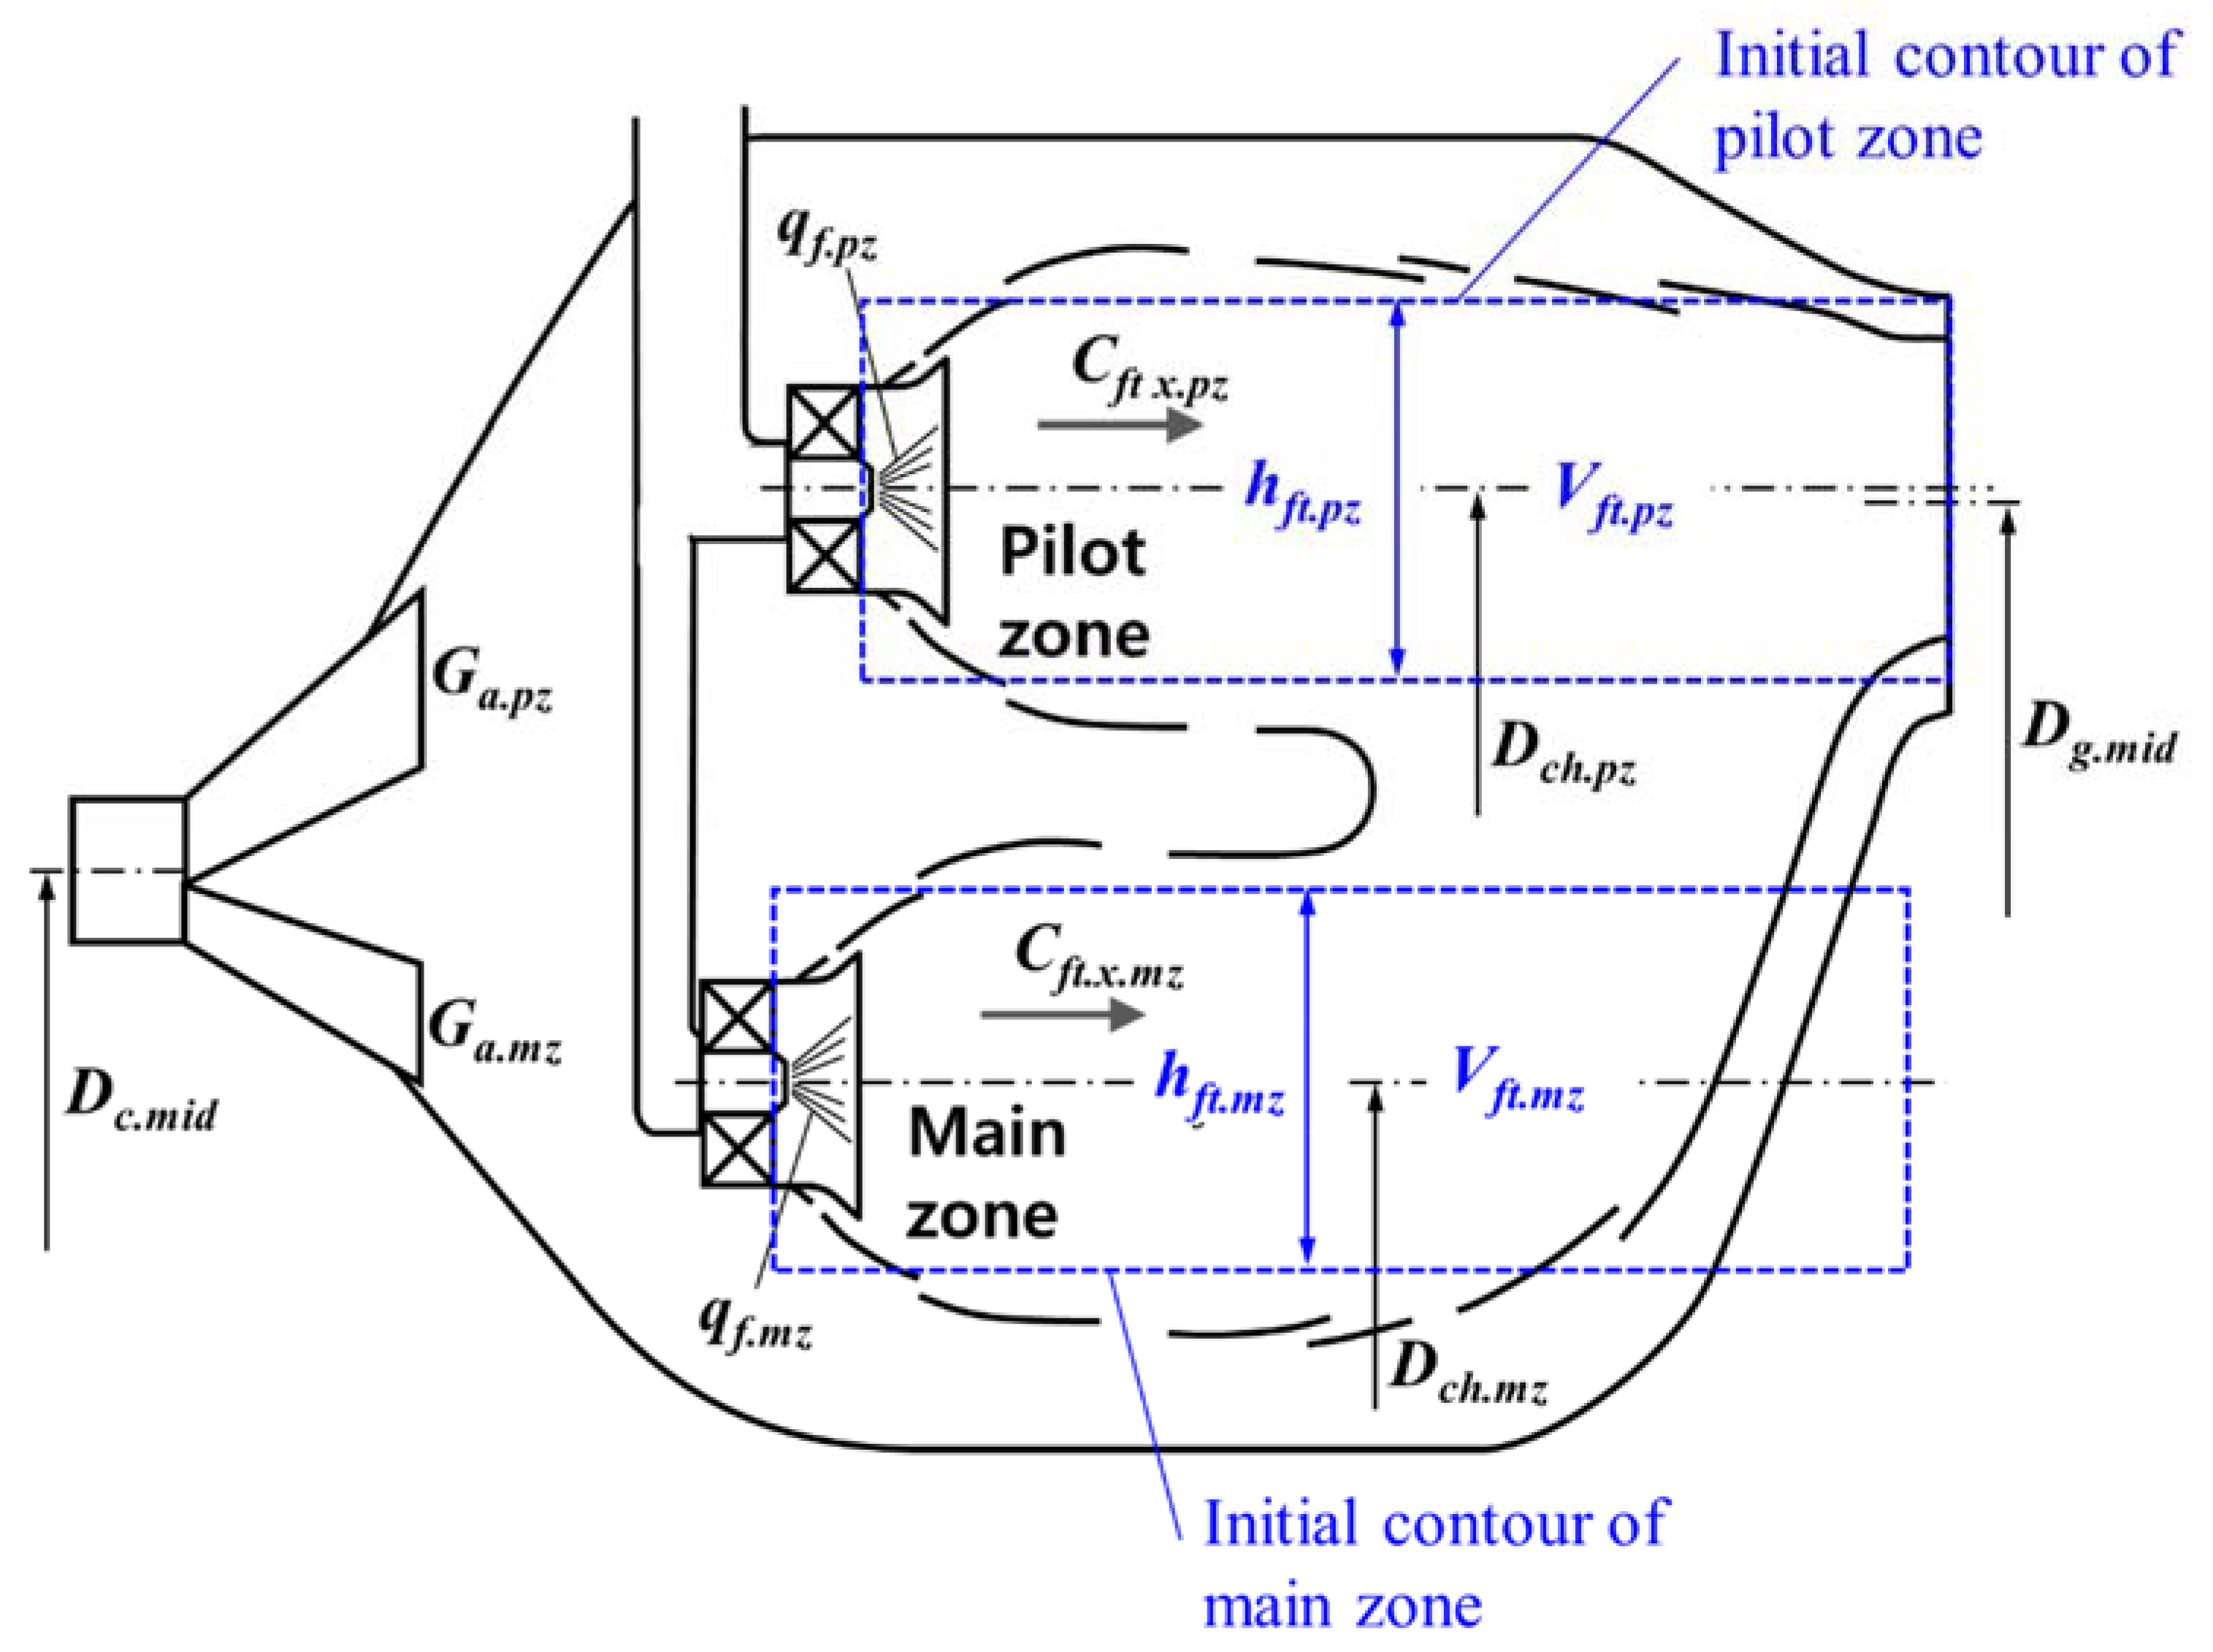
Khandelwal et al. [22] stated that the design process of the DAC can be similar to that of the SAC, and that the concept can be presented as a flame tube composed of multiple annular combustors, as shown in Figure 2. To form two independent combustion spaces (pilot and main zones) while using a single compressor, air and fuel must be distributed to each annular combustor. Therefore, the airflow rate ratios (, ) and fuel flow ratios (, ) to the pilot and main zones are required for the design of the double annular combustor.
To compare with the conventional single annular combustor, the geometric and thermodynamic parameters of the compressor outlet and turbine inlet must be fixed [27,28]. In addition, the values at the design and off-design points were derived because the condition of the air entering the combustion chamber depends on the atmospheric conditions and engine operation modes. The method suggested by Agulnik et al. [21,29] was used to calculate a one-dimensional thermo-gas-dynamic turbofan engine model at the design point. The initial input values were determined by referring to the basic data of the ground stop state (Mf = 0, Hf = 0) of the PS-90A [24], as listed in Table 1.
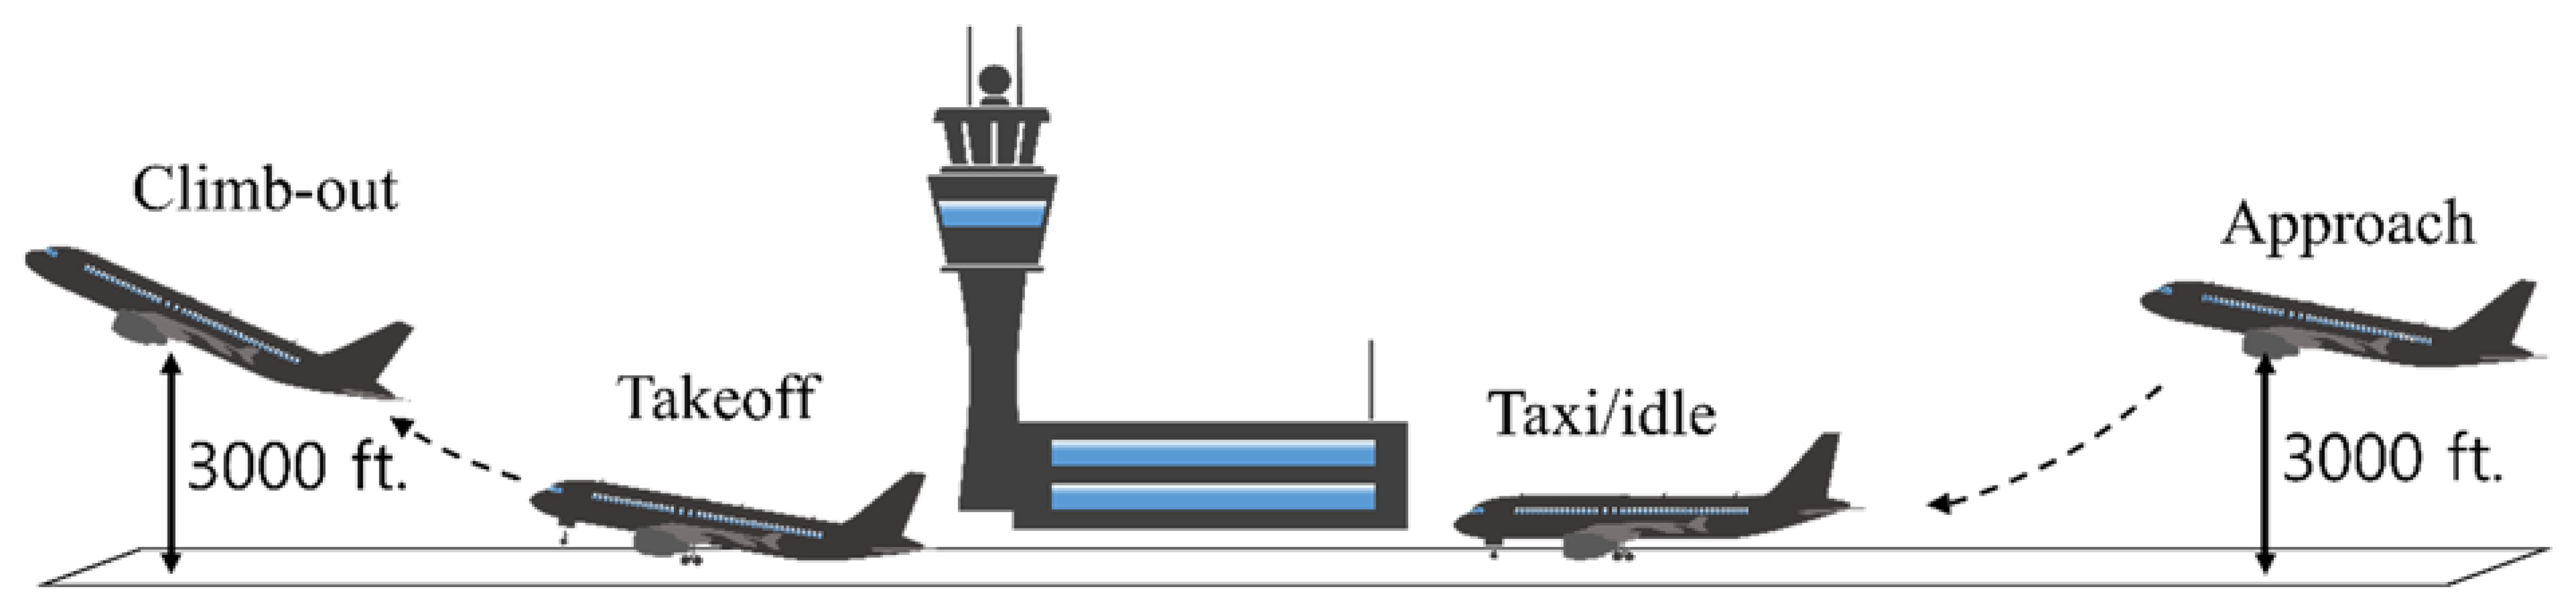
ICAO normalizes the aircraft landing and takeoff (LTO) cycle by categorizing it into four stages (takeoff, climb-out, approach, and taxi/idle), as shown in Figure 3 [4,30]. The climb-out and approach stages ranged up to 3000 ft (approximately 914 m) above the air, whereas the taxi/idle stage included all processes of the aircraft moving on the ground before LTO. Table 2 shows the values of the engine thrust mode (ratio to maximum thrust Poo) and the mode duration of the subsonic aircraft for each stage, as standardized by ICAO. Based on the proposed LTO cycle, the off-design calculation was conducted at 100%, 85%, 30%, and 7% of the full thrust. The in-house code of the Moscow Aviation Institute was used to calculate the throttle curve [27].
The regulatory level (ωi, g/kN), which is the estimating factor in the optimization process, is defined as the mass (g) of emitted substance i per thrust (kN) at each stage of the cycle [30]. The emissions of nitrogen oxides (NOx) and carbon monoxide (CO) were obtained using Equation (6). In addition, the permissible regulatory level of NOx in engines of this class depends on the overall pressure ratio of the compressor, as shown in Equation (7) (CAEP/8—until 2023) [30]. The CO emission is limited to less than 118 g per unit thrust [30].
where i is the type of emission material, j is each LTO step, and EI is the emission index determined by the mass (g) of the emission material per unit fuel mass (kg).
In general, the amount of NOx produced increases with the combustion temperature. The excess air coefficient α in the combustion chamber, the gas residence time in the recirculation area (combustion area), and the temperature Tc* of the inlet air affect the temperature in the combustion chamber. The penetration depth of air entering the flame tube affects the cooling and mixing processes. Therefore, the cross-sectional area () of the flame tube to the sum of the hole areas determines the temperature uniformity at the outlet of the combustion chamber. The mixing length and flame length decrease as the gas rotation intensity () increases by the swirler. However, according to Sarkicov et al. [18], the possibility of lean-burn occurrence in the combustion zone increases with the swirl numbers of the swirler and swirl injector, thereby resulting in a significant increase in the amount of carbon monoxide. In addition, the number of injectors per cross-sectional area of the flame tube () can affect the distribution uniformity of the fuel. This is related to the mixing efficiency in the combustion zone. As the flow rate of air entering the swirler increases, the excess air coefficient in the recirculation area increases, and the temperature distribution becomes uniform. This is associated with the ratio of the swirler area to the sum of the total hole area (). Sarkicov et al. [17,18] presented the emission indices of NOx and CO (as shown in Equations (8) and (9), respectively), which comprised the engine regime parameter function and combustion chamber structure parameter function.
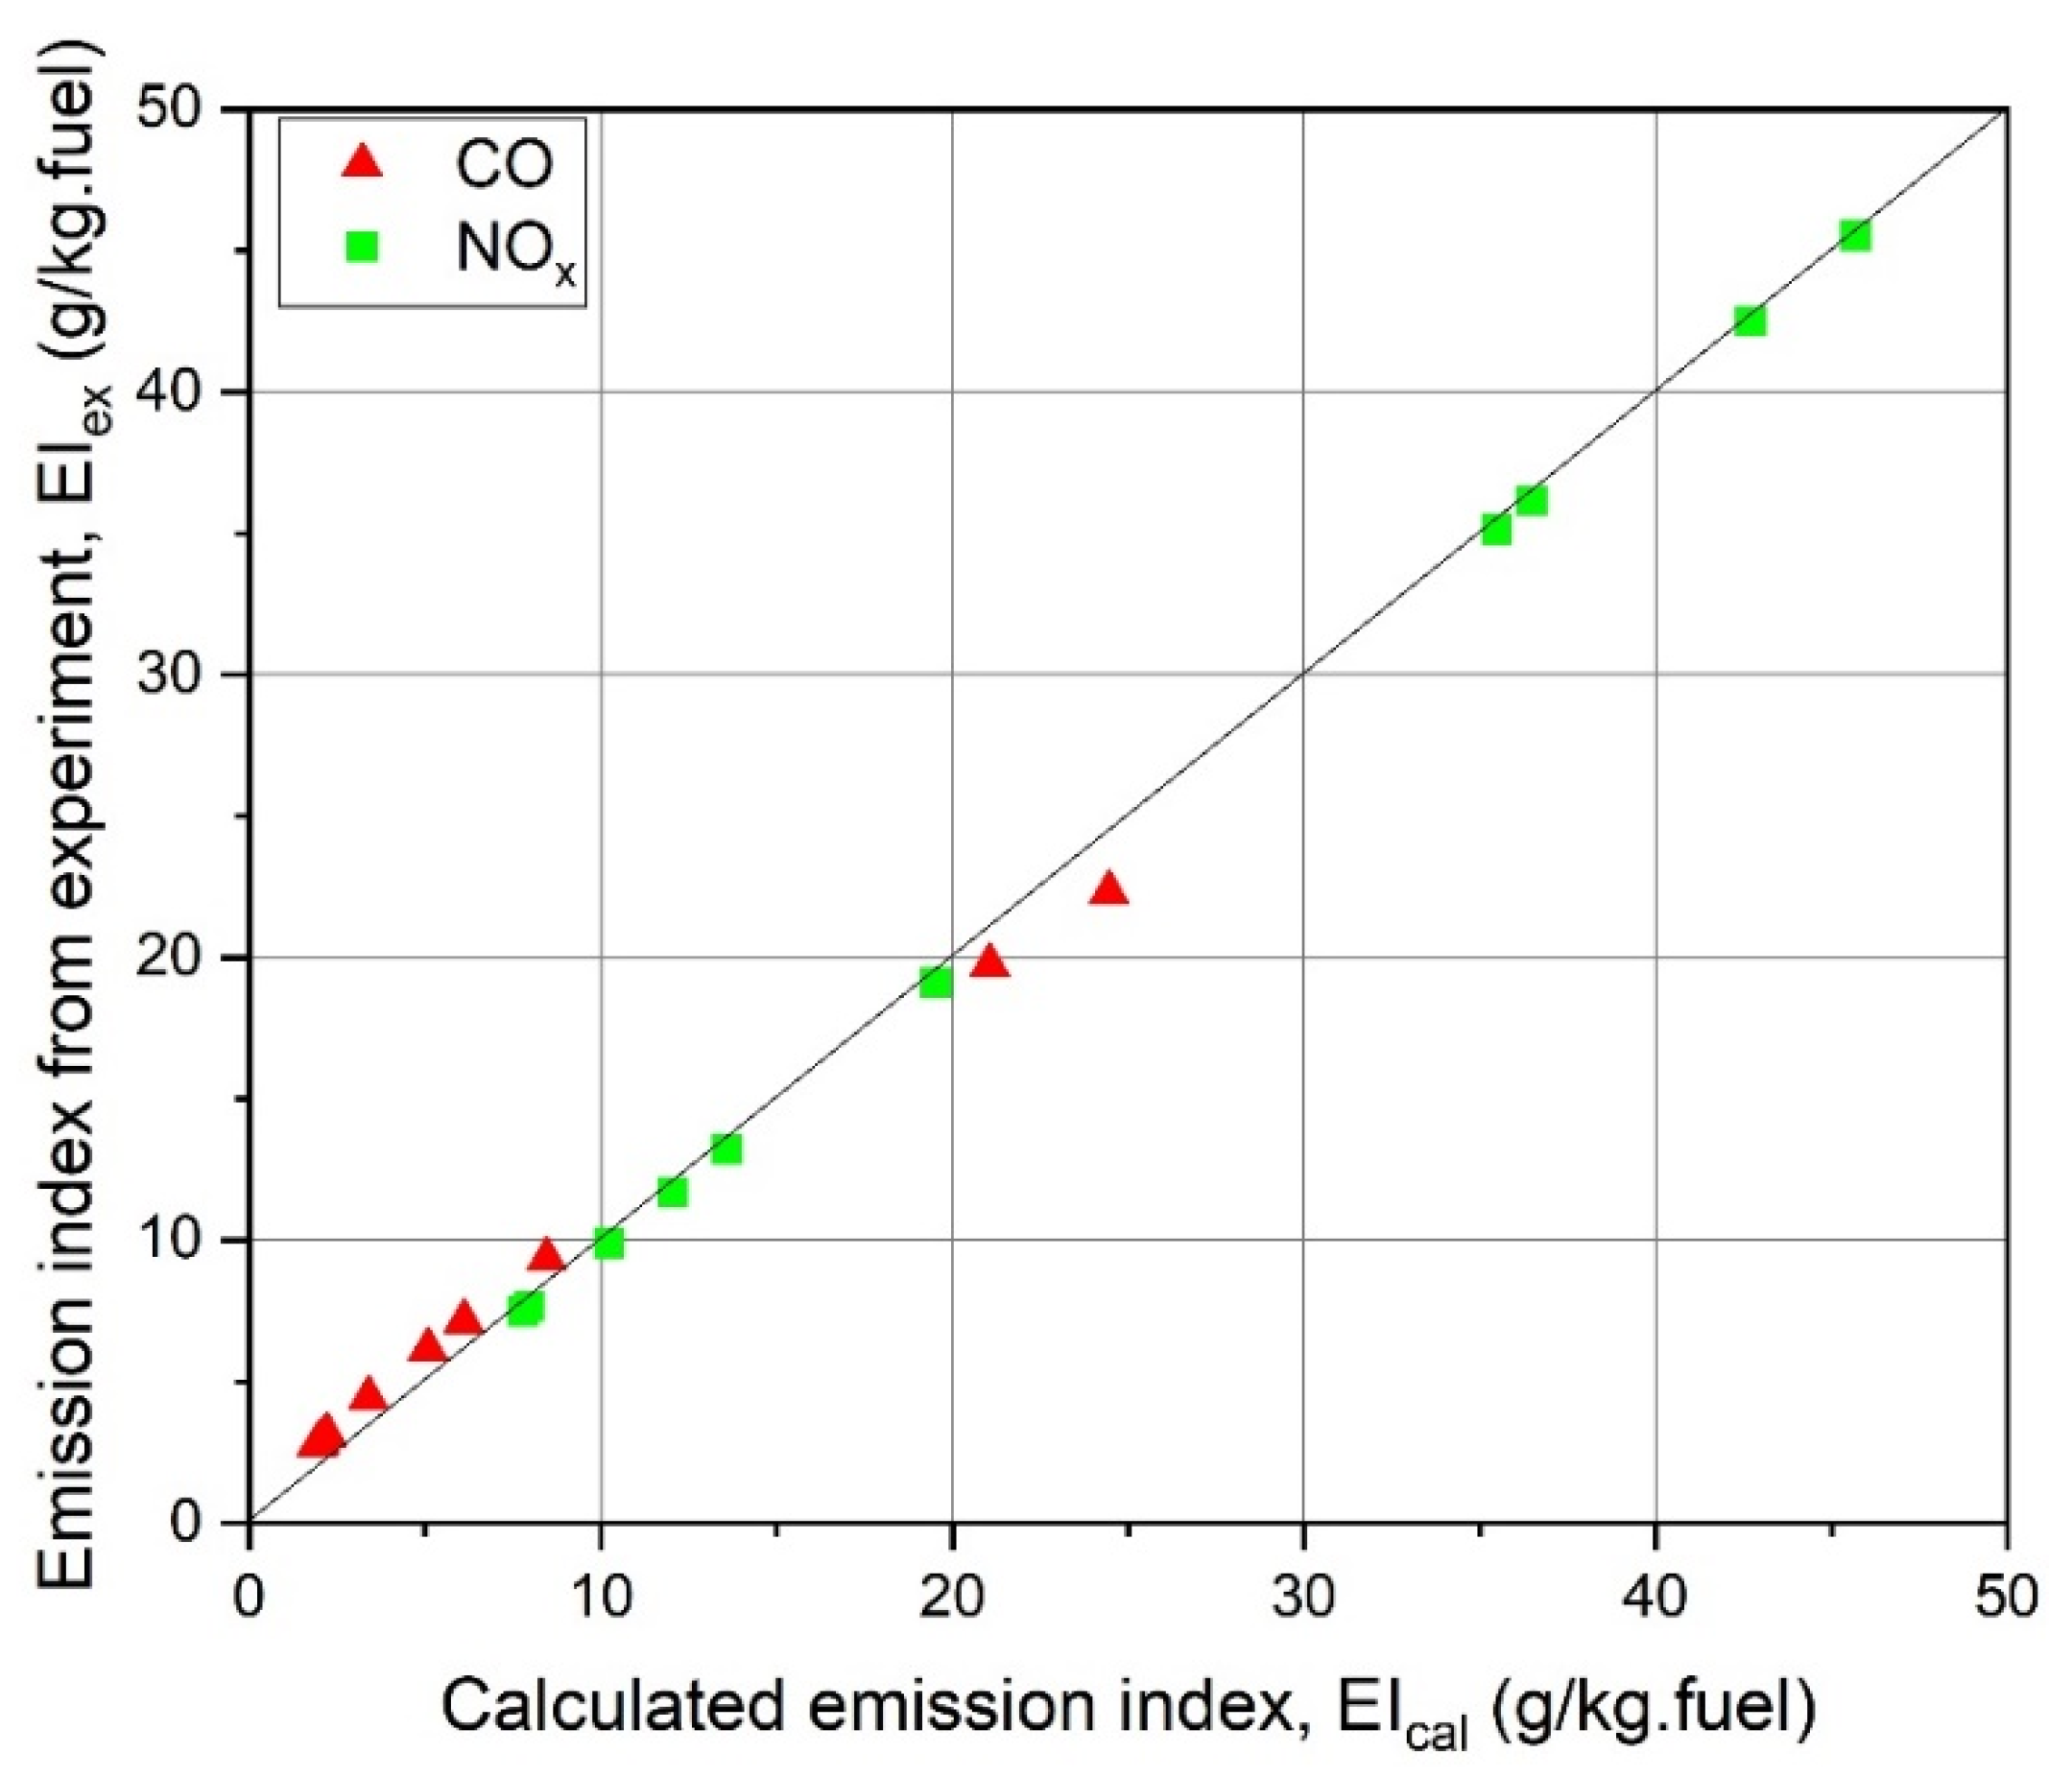
According to Mitrofanov [31] and Jeong [32], the coefficients A1 and B1 depend on the type of engine and fuel. Jeong [32] presented values such as and based on a comparison with the combustion test results of the PS-90A engine using kerosene. Figure 4 [32] shows that the emission indexes of NOx and CO calculated using these coefficients are similar to the empirical correlation derived from the test results ().
Depending on the operation purpose of the DAC, the appropriate parameters must be selected for each annular combustion zone to reduce harmful emissions. The annular zone for reducing CO emissions is the pilot zone, whereas that for reducing NOx generation is the main zone. Some terms of the empirical equations shown in Equations (8) and (9) are parabolic functions with a minimum value; however, other monotonically decreasing functions exist. Therefore, in this study, the ranges of design and performance parameters from the hot-test data [17,18] of the combustors were considered to ensure the validity of the equations [24,32]. In particular, the parameter range was determined to satisfy the condition to avoid the deterioration of the starting characteristics and the risk of flow separation [17]. According to Kovner et al. [23], the cross-sectional area ratio can be considered to be approximately equal to the ratio of airflow rate, and it is within the range of 0.05~0.2. Table 3 lists the values of the main parameters selected for the design of the pilot and main zones.
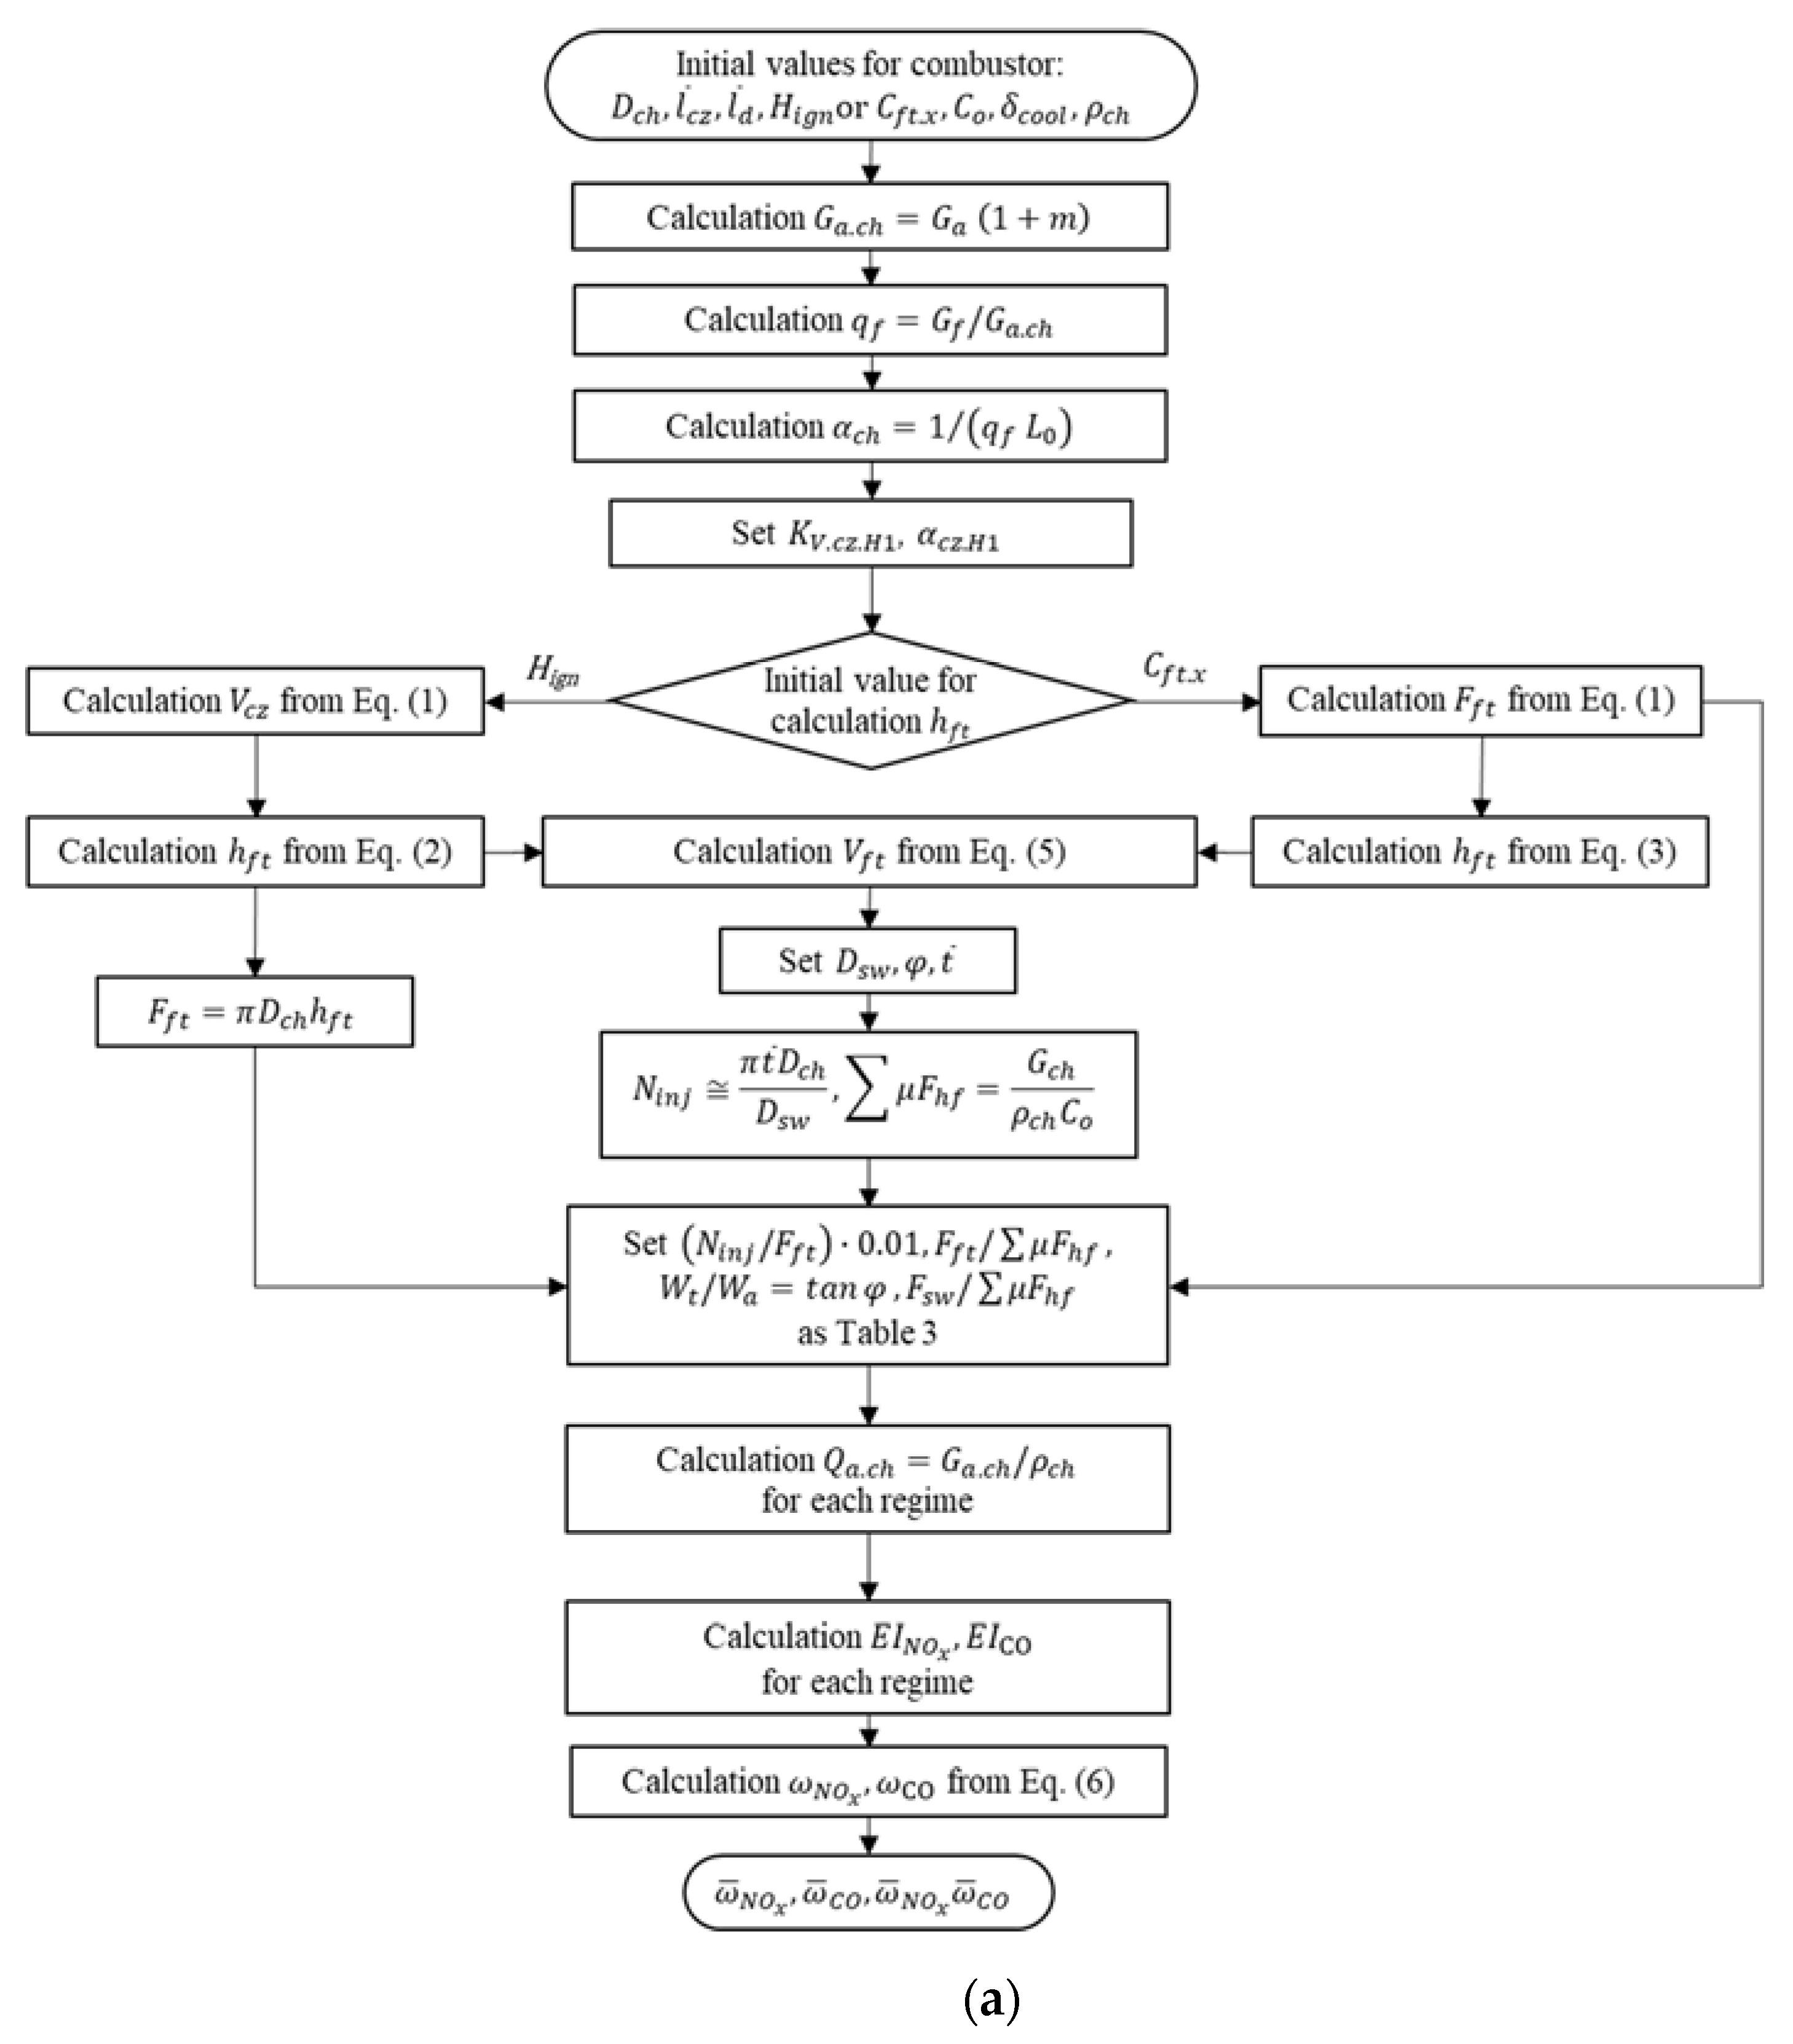
Mathematical simulations by Mazaheri and Shakeri [33] show that changes in combustor geometry can lead to a reduction in nitric oxide emissions. Furthermore, according to Mousemi et al. [19] and Saboohi et al. [20,21], it is possible to design an optimized combustor in terms of NOx and CO reduction by tuning the coupling between the design factors of combustor components. The basic sizing of the combustor and the calculation of NOx and CO emissions are shown in the flowchart of Figure 5a in the form of a subroutine. The values of and are known to be in the range of 1.2~2.0 and 0.5~1.5, respectively [23]. The relative amount of air used for the turbine cooling can be calculated by Equation (10) [29], where is the mass flow rate of air used for turbine cooling.
The average air velocity in the holes of the flame tube is known to have values ranging from 30–100 m/s [23]. According to Startsev [34], the swirler diameter and the relative pitch between swirlers in a flame chamber with a single injector row have the ranges of 0.03–0.06 m and 0.2–0.5, respectively. Pchelkin [35] stated that the blade angle of swirler φ was in the range of 45–55 degrees. The values of the above-mentioned parameters were determined by referring to actual engine data [24].
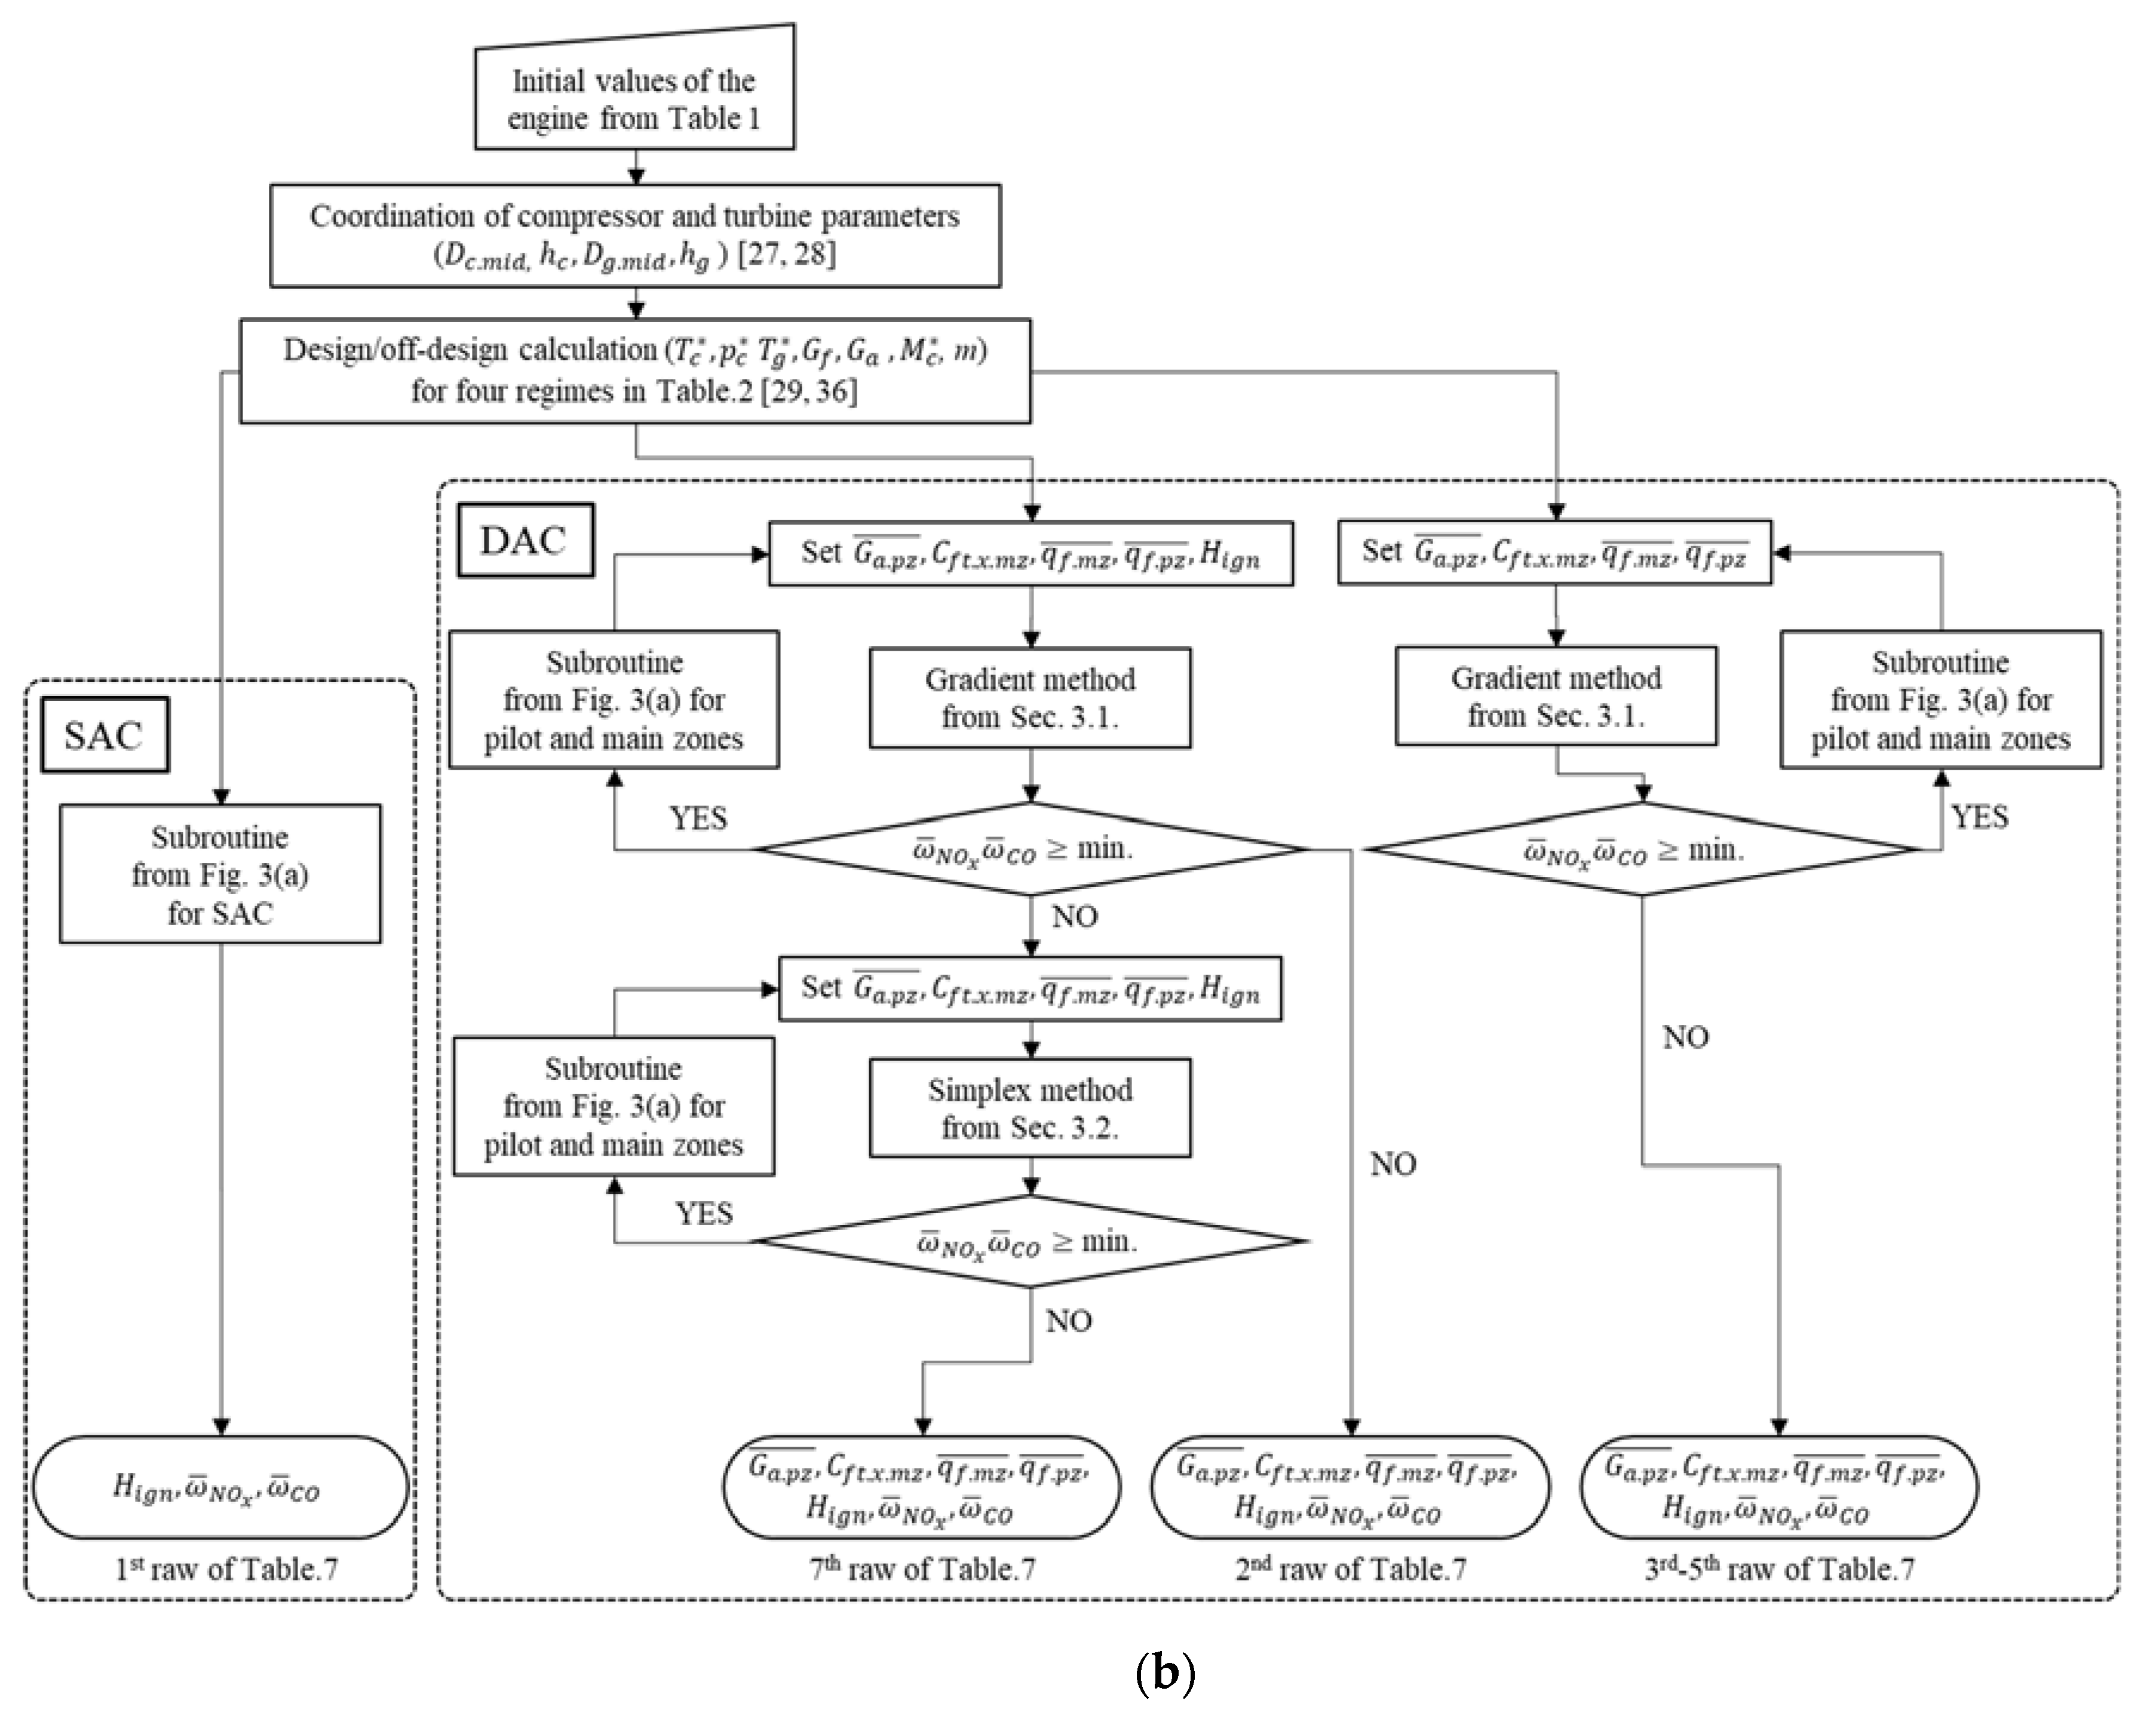
The optimization process for the double-annular combustor sizing is presented in Figure 5b using the subroutine. In this process, the Box–Wilson gradient method was primarily used to design a combustor that can minimize emissions for a specified engine model; subsequently, values similar to the actual optimal value were searched using the simplex optimization method.
3. Optimization of DAC Design Parameters
As mentioned above, the number of parameters for the DAC design is sufficiently large, even when the positions of the compressor and turbine are fixed. In this regard, a gas turbine engine combustor design process that satisfies the design objectives has been obtained using a multivariate optimization method in a previous study [37]. In that study, the gradient method applying fractional 2N designs was first applied; subsequently, the simplex strategy was performed in the previously derived range to obtain the parameters of the combustor that minimize NOx and CO emissions [32].
3.1. Box–Wilson Strategy (Gradient Method)
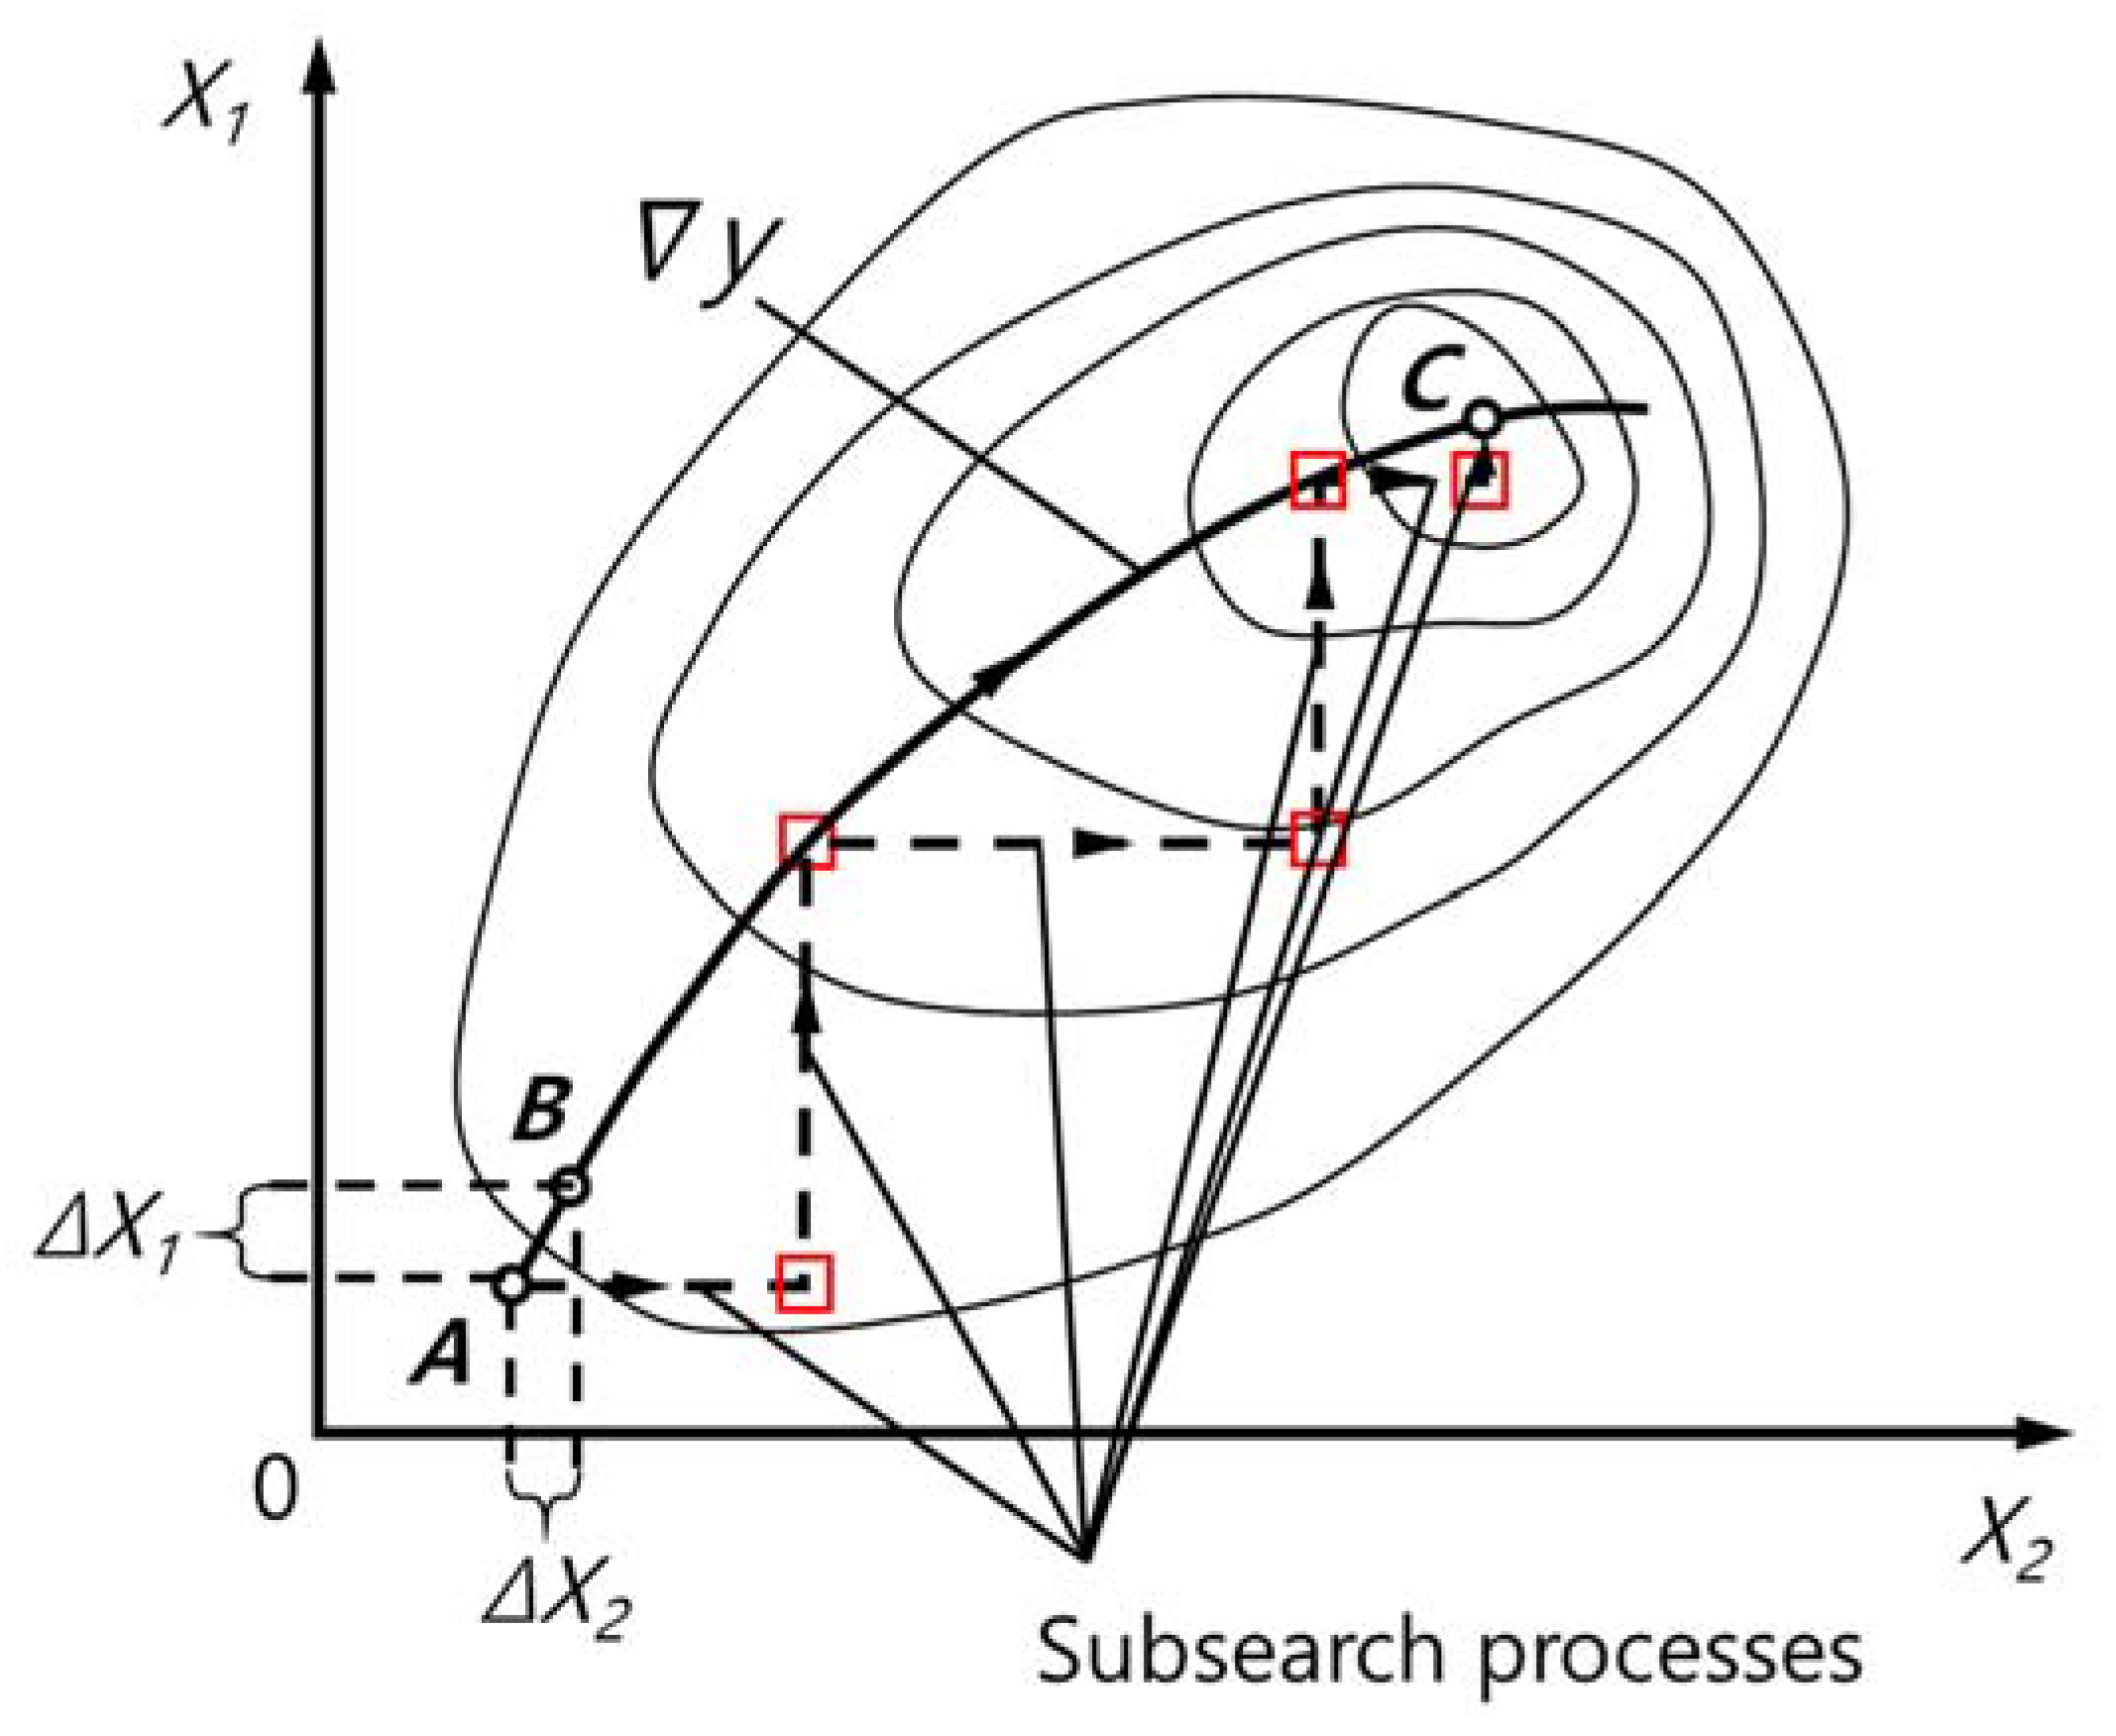
The response y affected by k factors can be expressed as . Optimization is the process of obtaining values x1, x2, …, xk at the minimum or maximum evaluation factor y. An optimization example can be considered with two factors (k = 2) affecting y, as shown in Figure 6. The univariate design method requires several subsearch processes from starting point A to attain the optimum value. In Figure 6, the red square represents the endpoint of each subsearch process. However, the optimal value can be identified more quickly and accurately when multiple factors are simultaneously varied along the gradient than by varying only one factor [38,39]. Therefore, a linear regression equation model with minimal factors must be obtained in advance such that it can be used in the gradient method [38].
When the engine shaft starts to rotate, air from the compressor outlet flows unconditionally into the two annular combustors. However, the fuel can be selectively supplied to each zone. A fractional factorial experiment with five design variables (), i.e., the relative mass flow rate of air in the pilot zone (), dimensionless relative mass flow rate of fuel in each zone (,), average axial gas velocity in the pilot zone (), and maximum restart altitude () were performed to obtain a mathematical model. The dimensionless relative mass flow rate of the fuel in the pilot and main zones can be expressed, as shown in Equations (11) and (12), respectively:
The maximum and minimum values of each factor were based on the recommended range for the modern aircraft gas turbine engine design [23,32], whereas the other values for establishing the design plan are shown in Table 4.
Considering the significant effect of the factor and the interaction between factors, was selected as the generator. Because of this generator, the terms , , , and were included in addition to the linear terms in the regression equation. The number of design variables included the center point, excluding the number of generators (p) () [39]. The regulatory level of the emissions against the allowable value (, ) and the multiplication of the relative regulatory levels of NOx and CO () as responses of each experiment (the row of the plan). The plan of the fractional factorial experiment and the calculation results are presented in Table 5.
The mathematical models (regression equations) for the three responses () are expressed as shown in Equations (13)–(15), respectively. It was confirmed that the coefficient of determination (R2) of the model for the calculated values were higher than 0.97.
It is extremely difficult to visually confirm the optimization process of an equation comprising more than two variables. According to Marchukov et al. [38], the mathematical regression model obtained using Equation (16) can be used to determine the gradient to determine the optimal value, where b1, b2, …, b5 are the coefficients of each term in the regression model.
As shown in Figure 6, if the increment changes in proportion to these coefficients (bi) starting from the initial position A and toward the optimum value, then the calculation point in space moves along the gradient direction. Furthermore, the actual value must be directly proportional to because the variation interval I is defined as [].
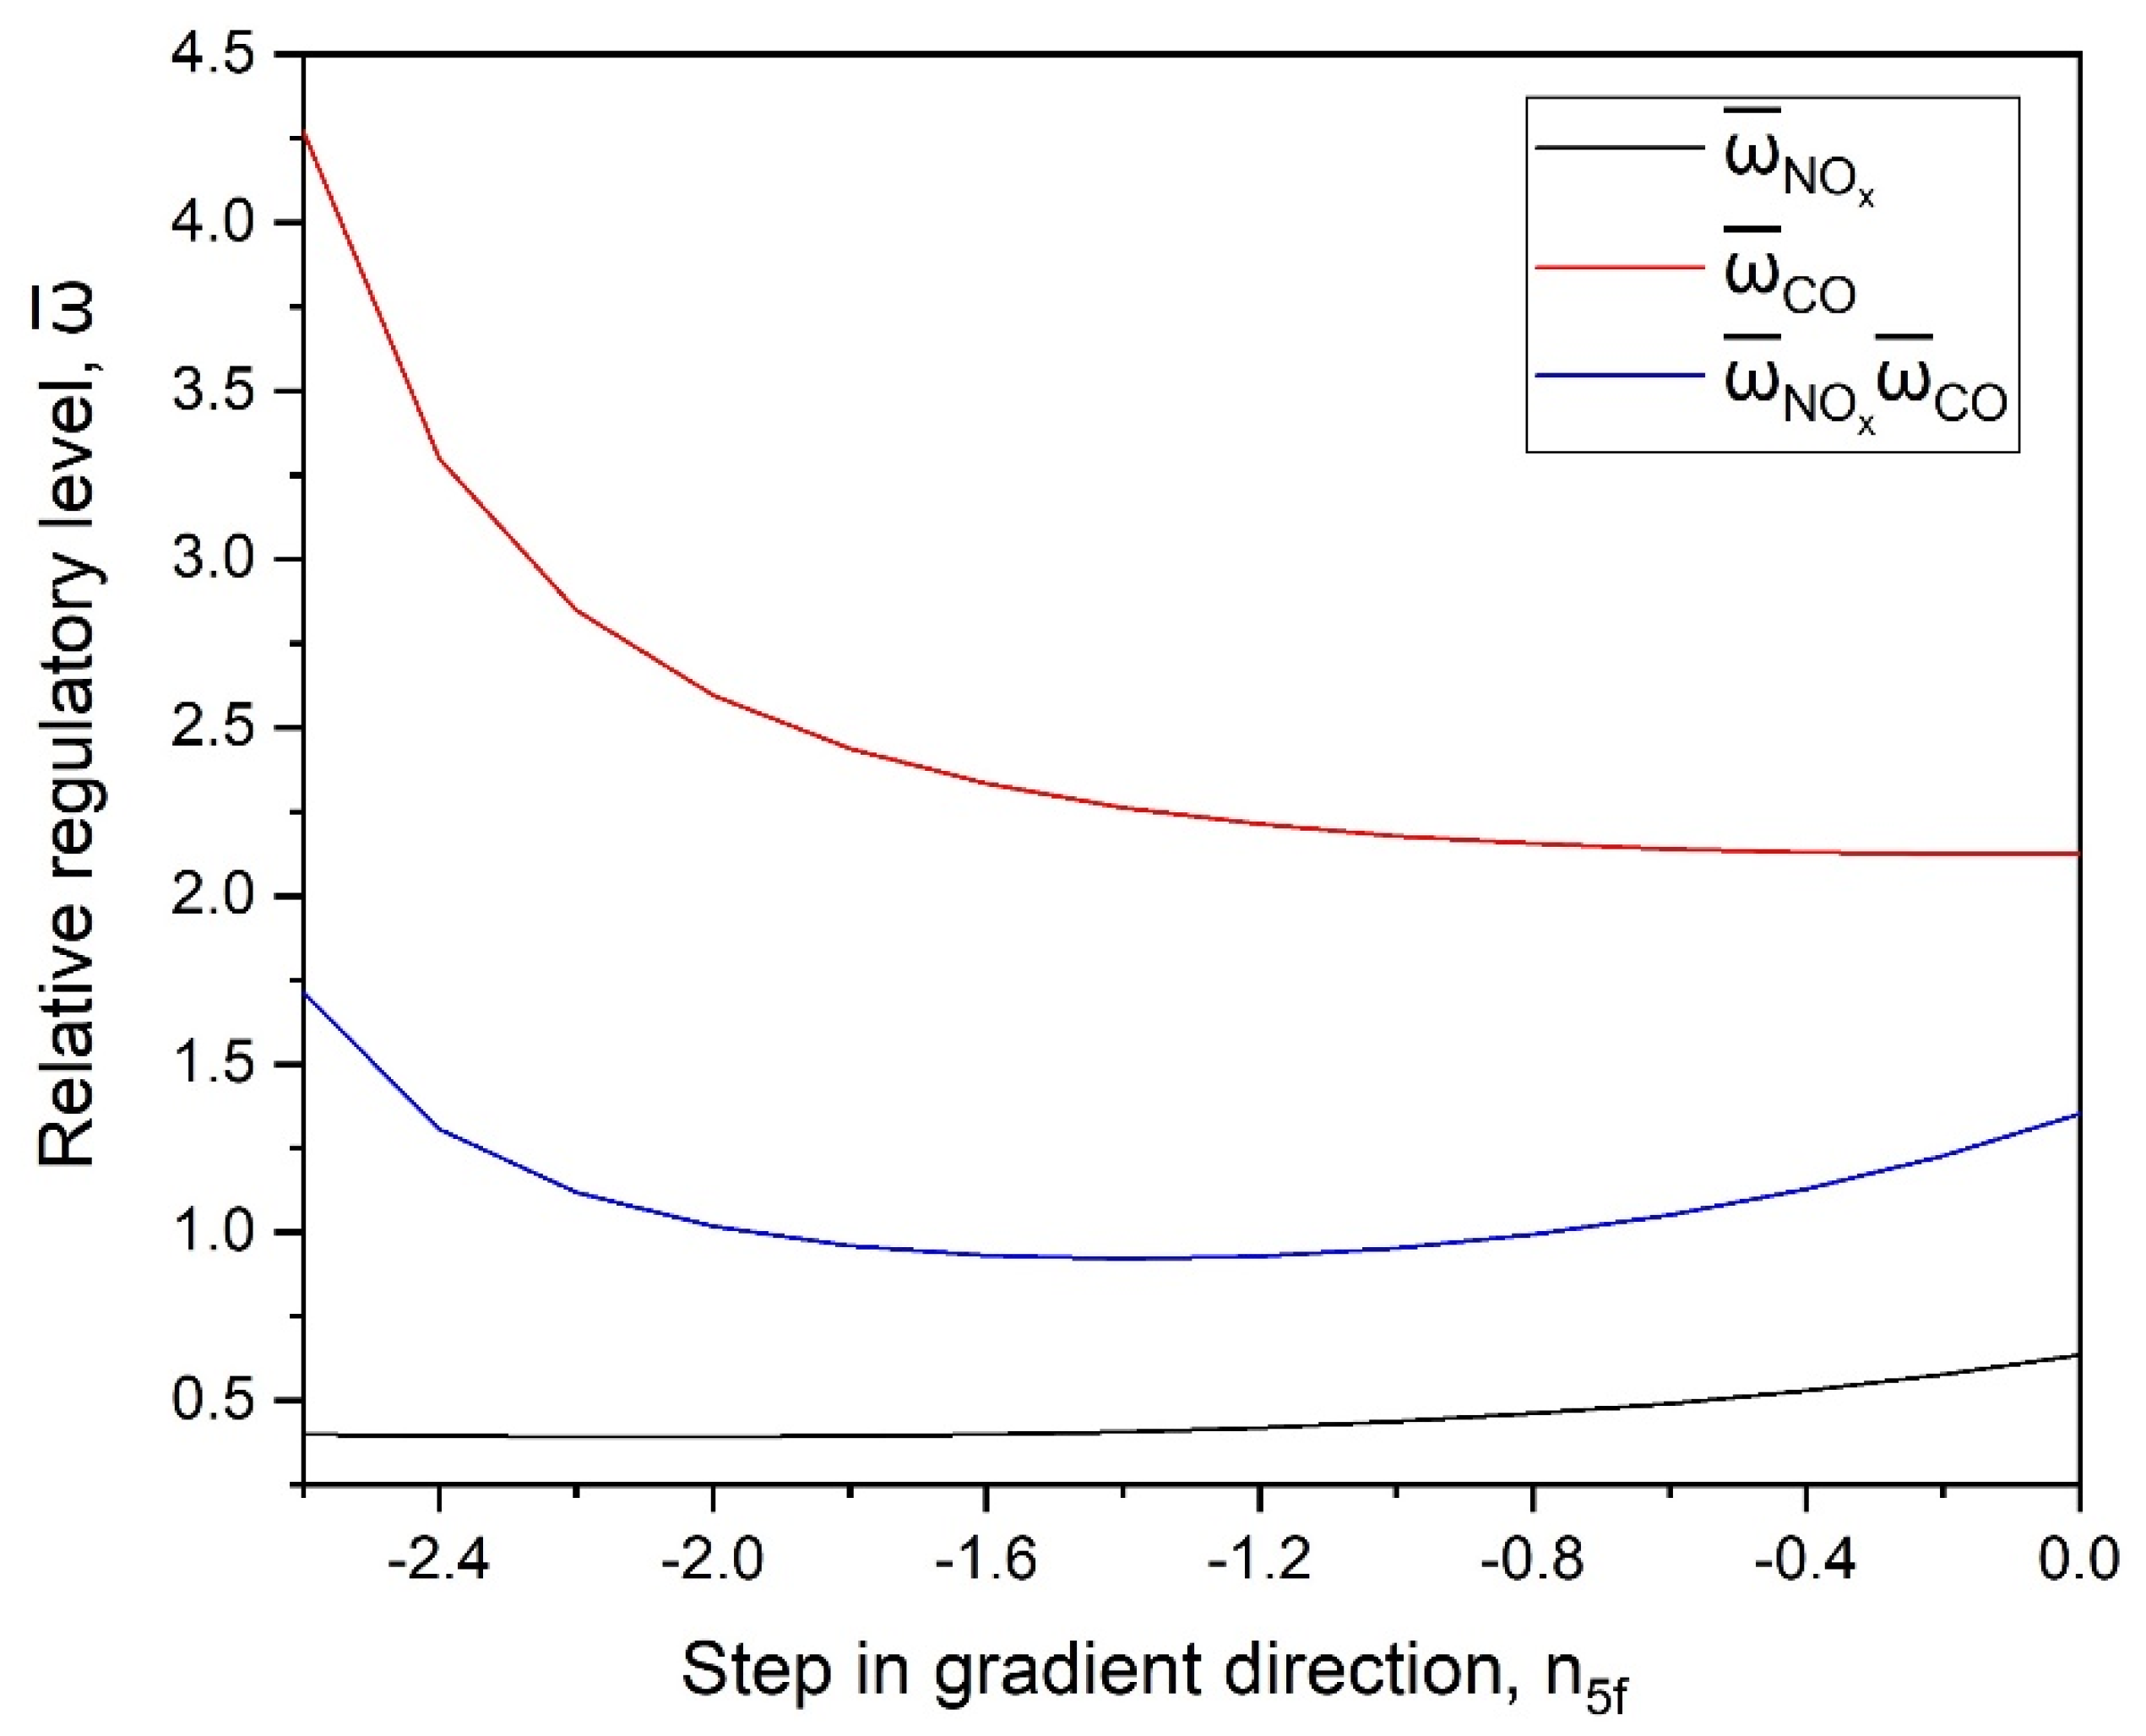
In the combustor design algorithm of Kovner et al. [23], and were considered as the initial input parameters for the combustion chamber design. Because the restart altitude depends on the speed in the flame tube and for the fuel flow rate, the increment in [, ] was first provided to obtain the increments of the remaining factors, which were relatively easy to change. Using these incremental values () and values at the center point (), the factor value at step in the gradient direction can be calculated (). For increment values of corresponding to each factor, exhibited a minimum value at , as shown in Figure 7. The values of the factors at this point were as follows:, m/s, , , and m.
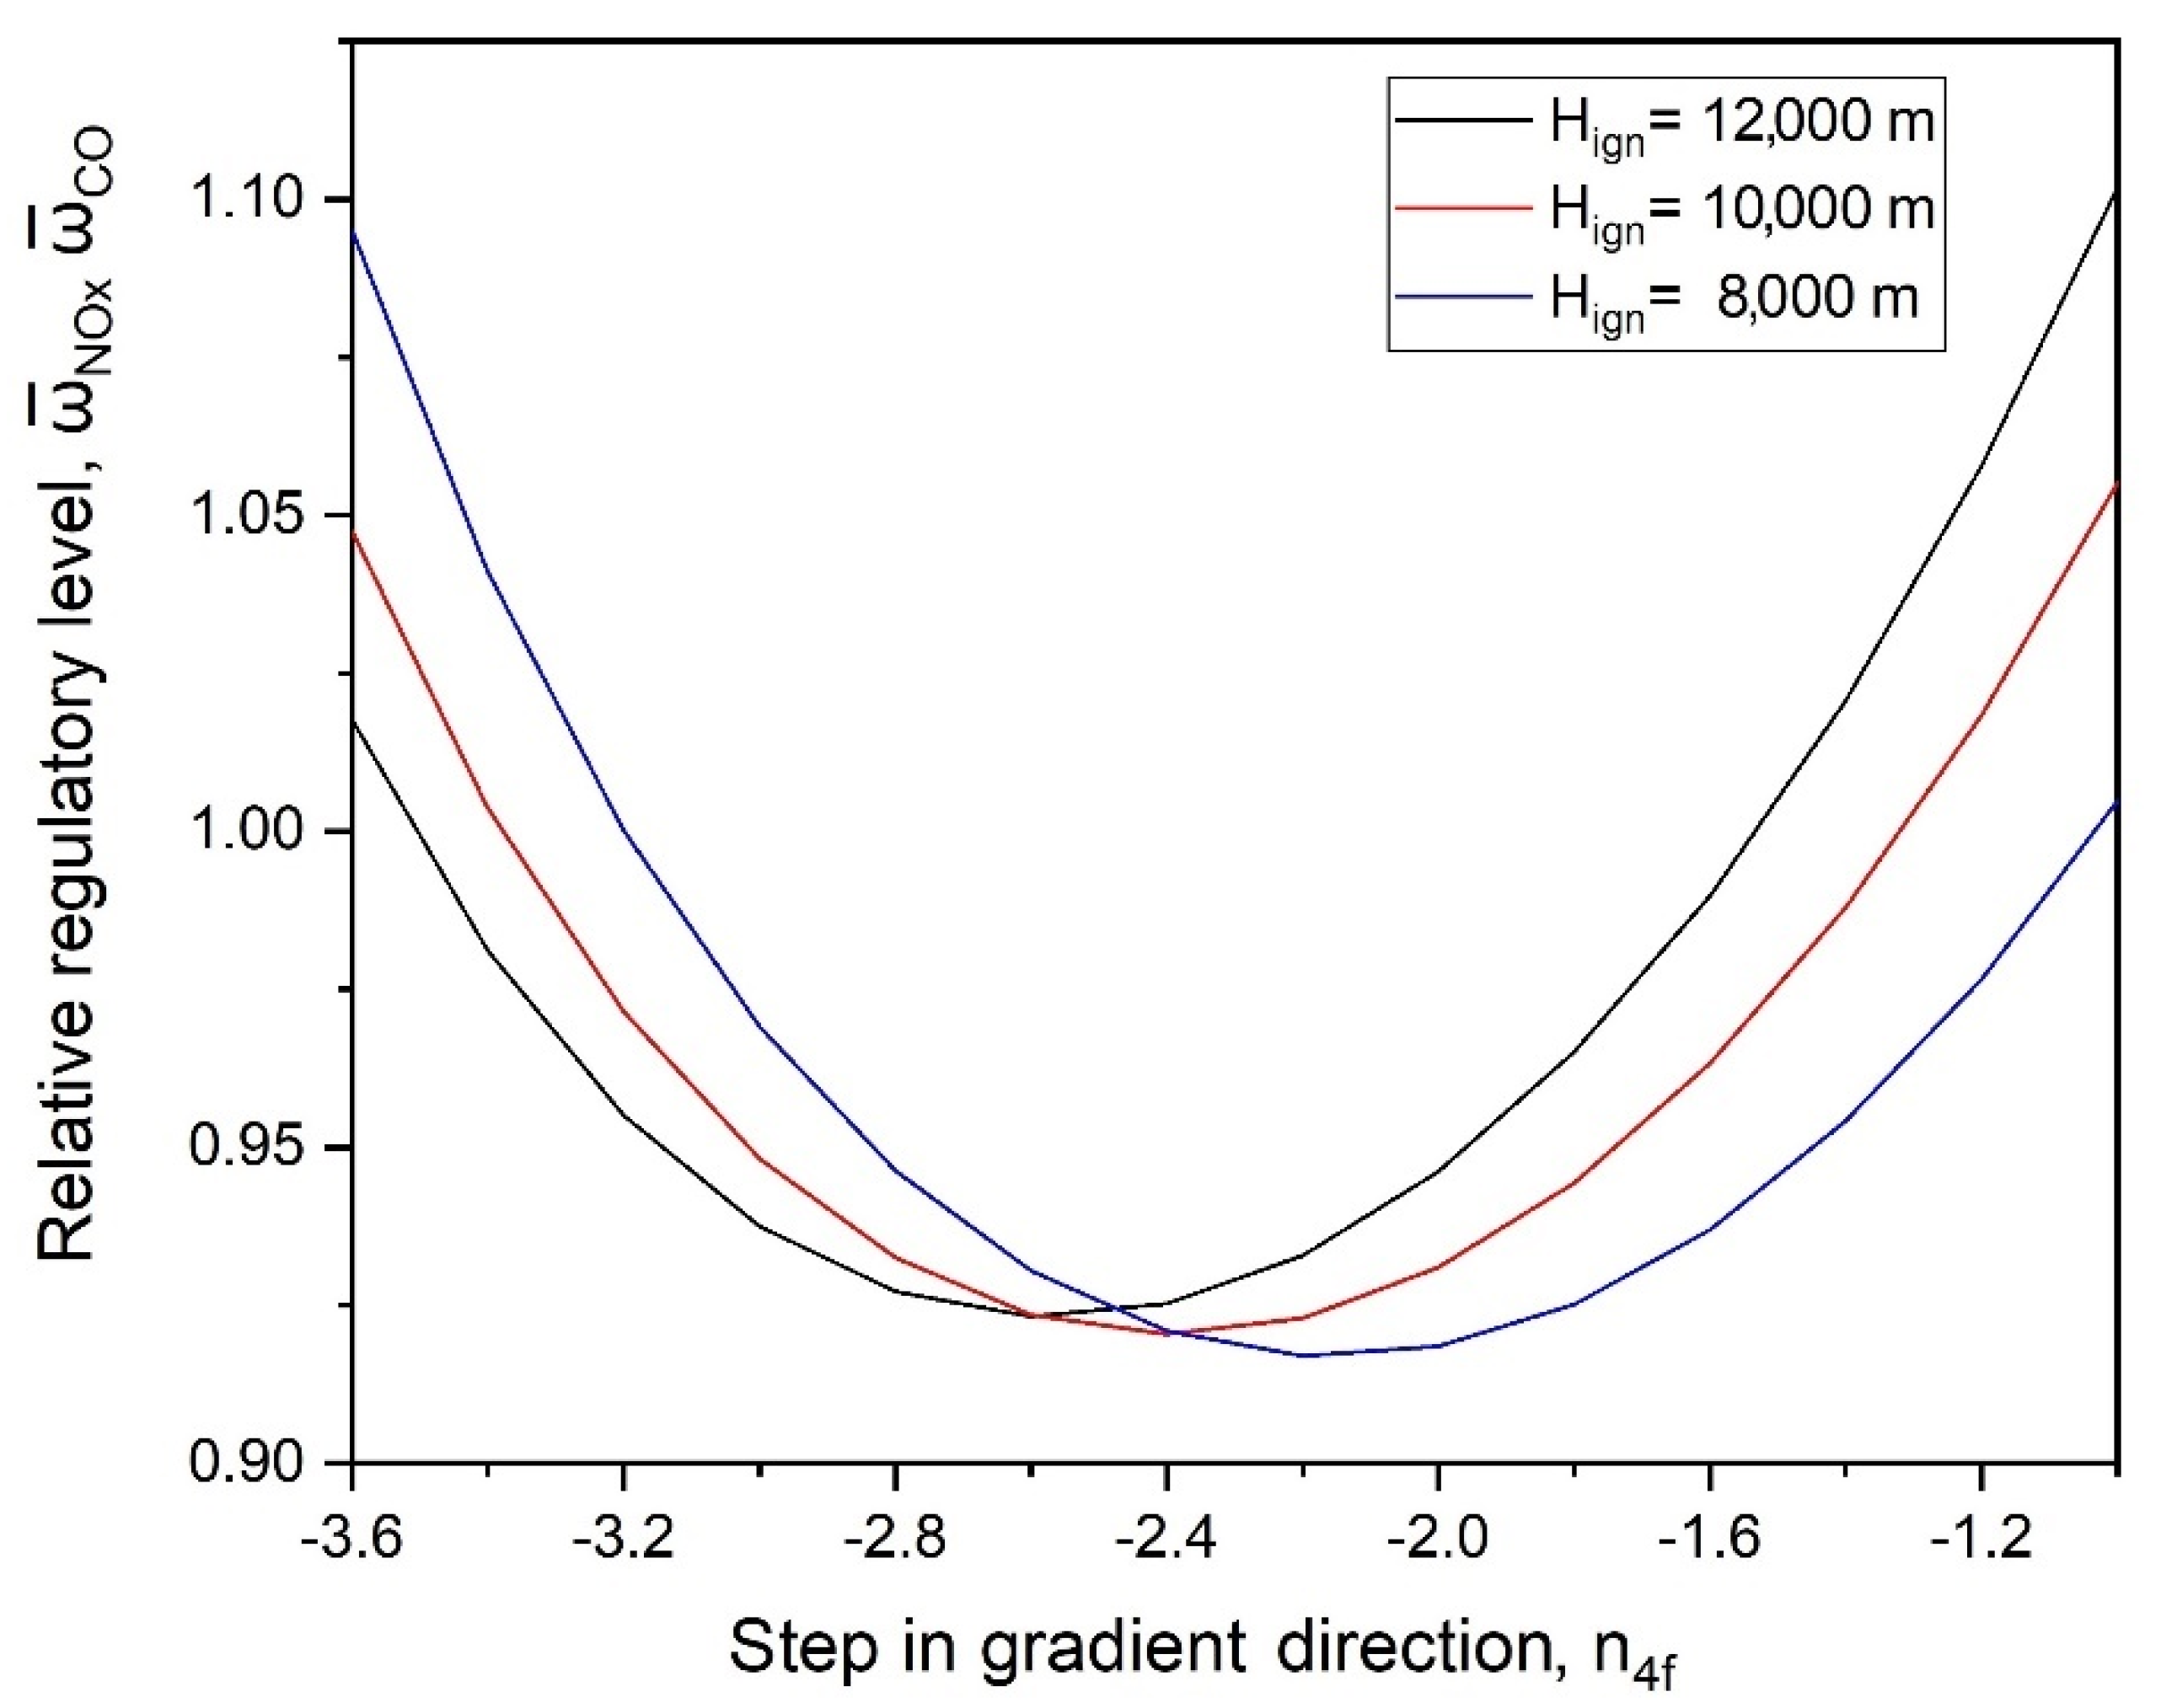
The mathematical models (Equations (13)–(15)) obtained using five factors showed that imposed a slight effect on the amount of emission substances. Therefore, the gradient method was performed again using factors excluding in the next step. Considering the significant effect of the factor and the interaction between factors, was selected as the generator. Table 6 shows a plan with four factors, and Equations (17)–(19) present the expressions for , , and , respectively.
The five-factor gradient method was used, and the other factors had increments for the increment of the second factor () in the equation, . Figure 8 shows the value of for each restart altitude (). Consequently, it was confirmed that the minimum values of were obtained owing to the previous step. The results of the primary optimization process with five and four factors are shown in rows 2–5 of Table 7.
3.2. Nelder–Mead Simplex Method
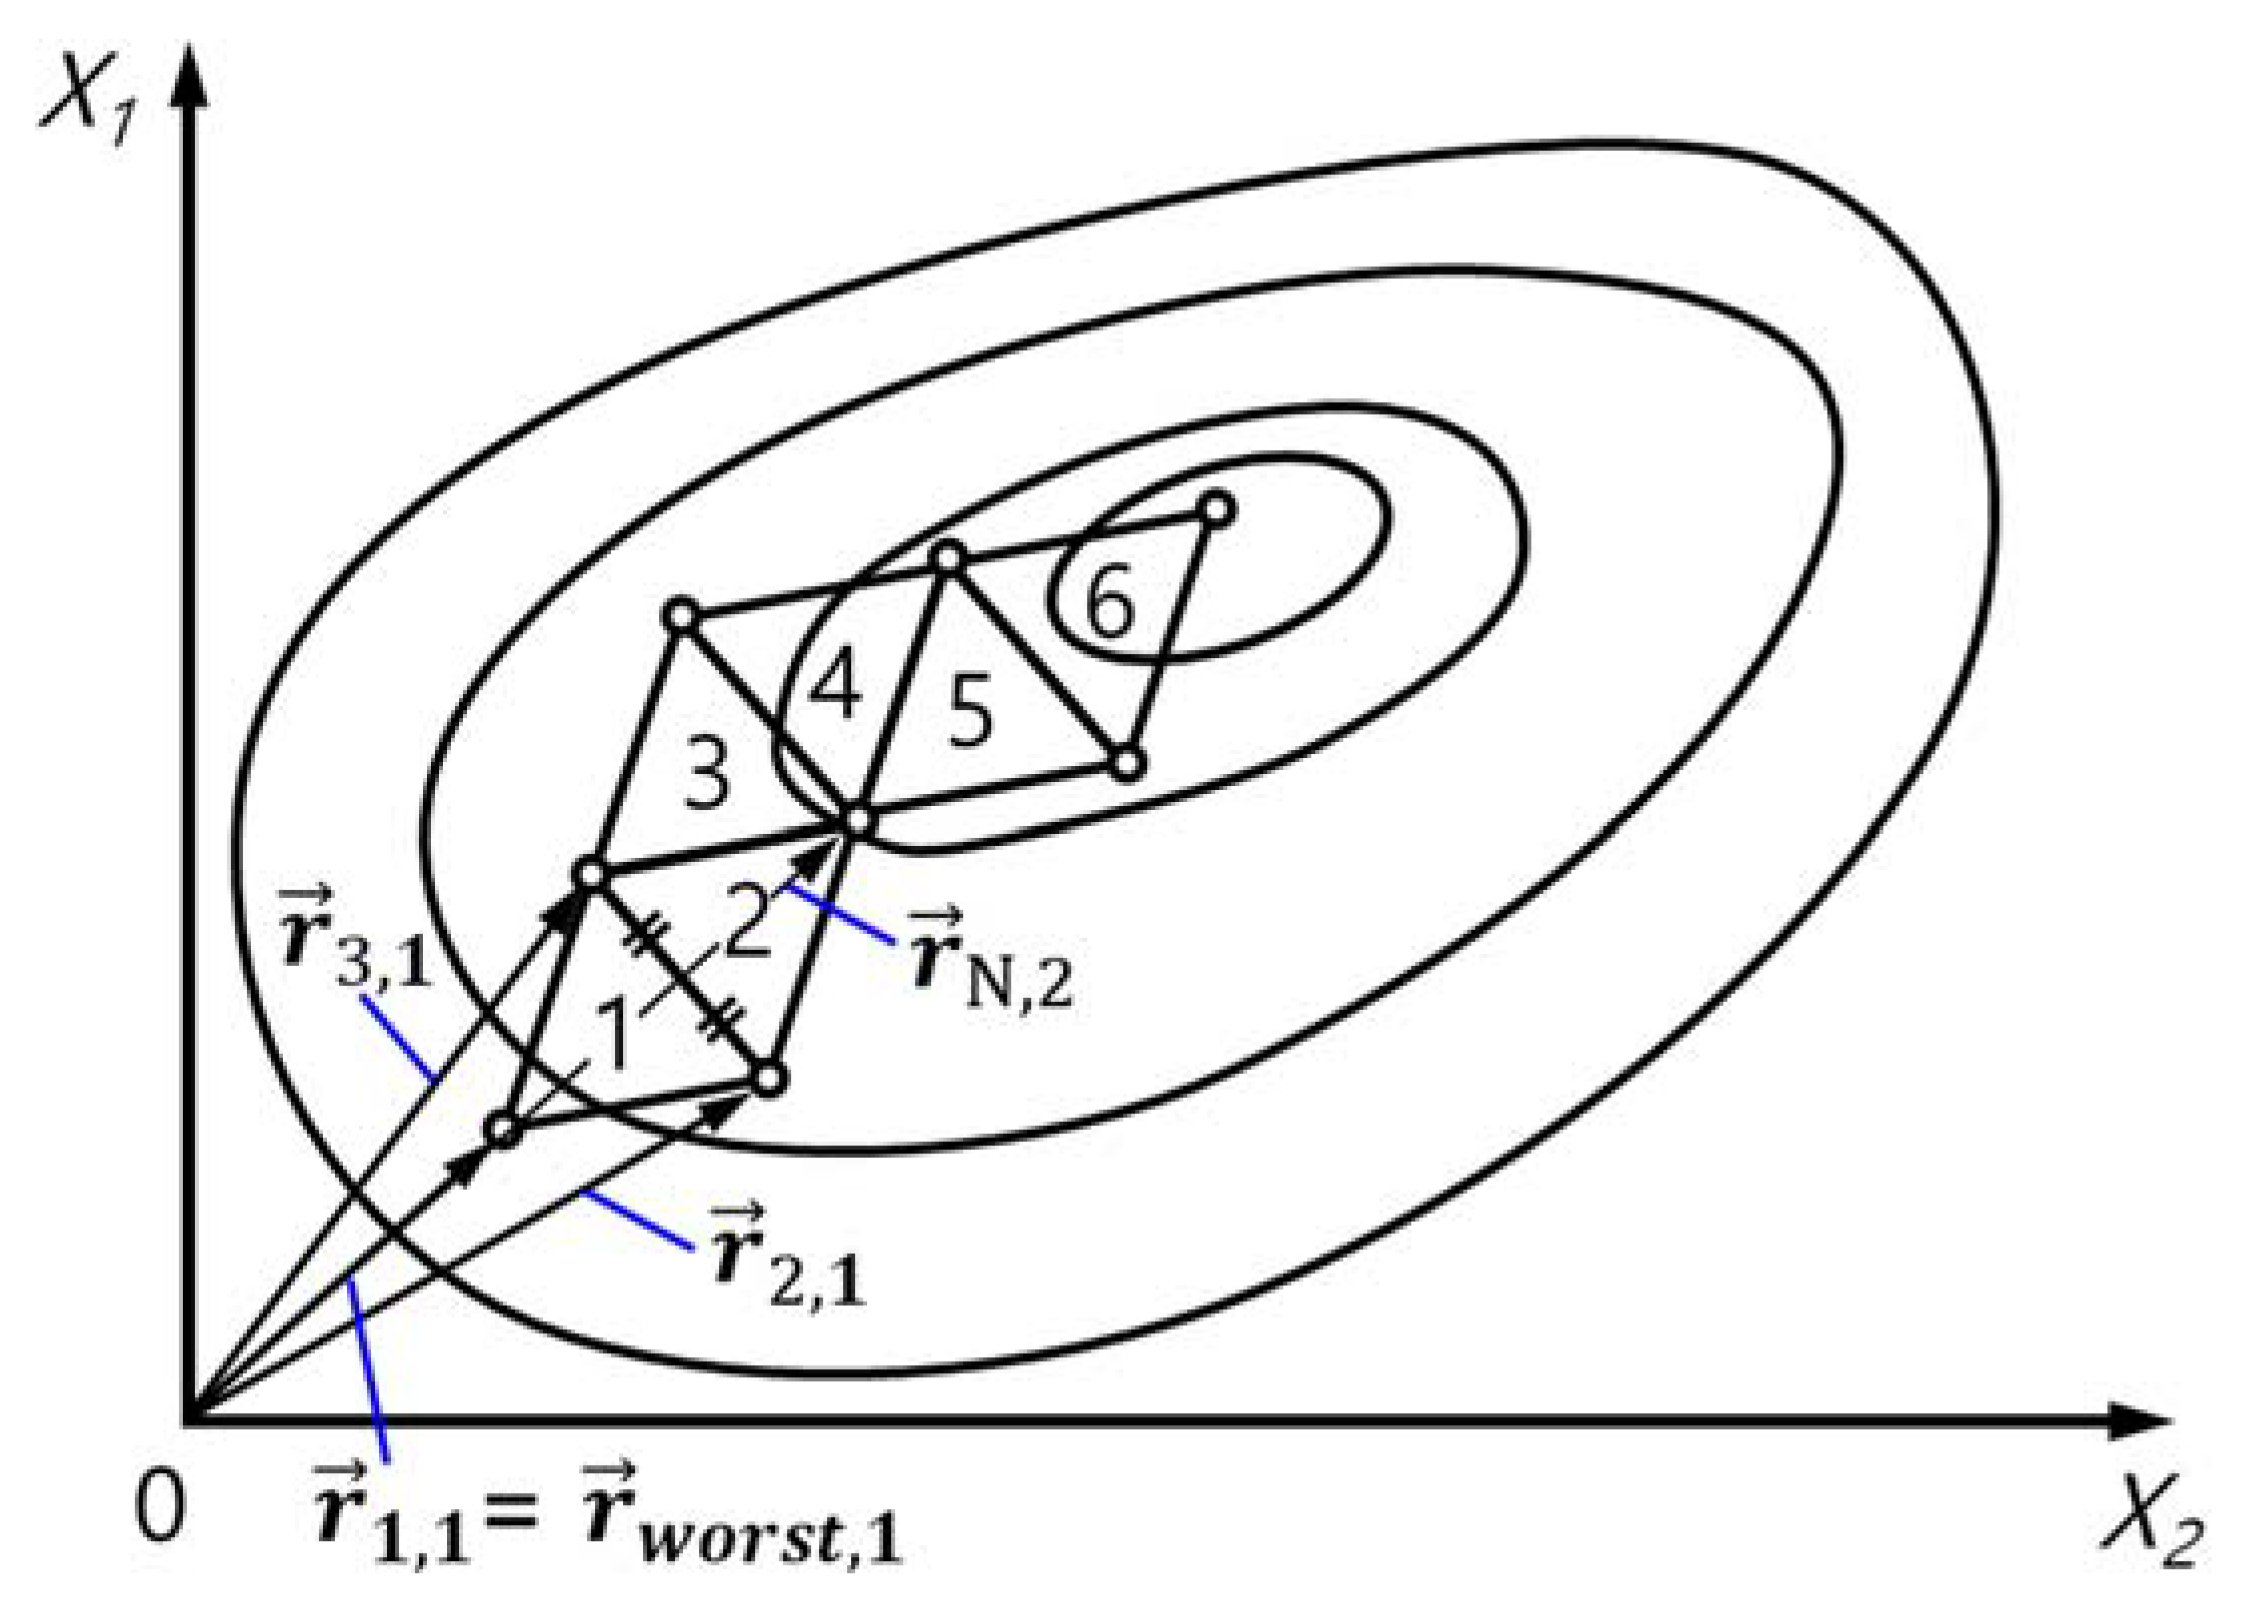
In the previous section, significant values of the main parameters were obtained using the gradient method. As the next step of the optimization process, the simplex method was used to obtain a value similar to the actual optimal value. As explained in Section 3.1, a function comprising two factors can be used to search for an optimal value by a group of trial points with the shape of continuous equilateral triangles (see Figure 9). However, it is impossible to visually confirm the optimal value of functions with three or more factors. The basic principle of the simplex method is to obtain the opposite vector () of the farthest vector () from the optimal value in a k-dimensional space (k = number of factors).
The first simplex was formed with the average value of the results of the previous step, and the calculation was performed using the algorithm suggested by Marchukov et al. [38]. For a more detailed search, each factor was assigned a smaller variability interval (I) than that in the previous step (). The first simplex (Aij) is a type of lower triangular matrix, and the first simplex can be obtained using Equation (20) [38], where is a vector of values obtained in the previous step (i is the number of factors, and j represents the number of experiments).
The matrices and vectors used in the calculation were as follows:
The new position constituting the (s + 1)-th simplex was obtained using Equation (21) with the farthest vector from the optimal value in the s-th simplex comprising vectors .
3.3. Initiatives to Reduce CO Emission
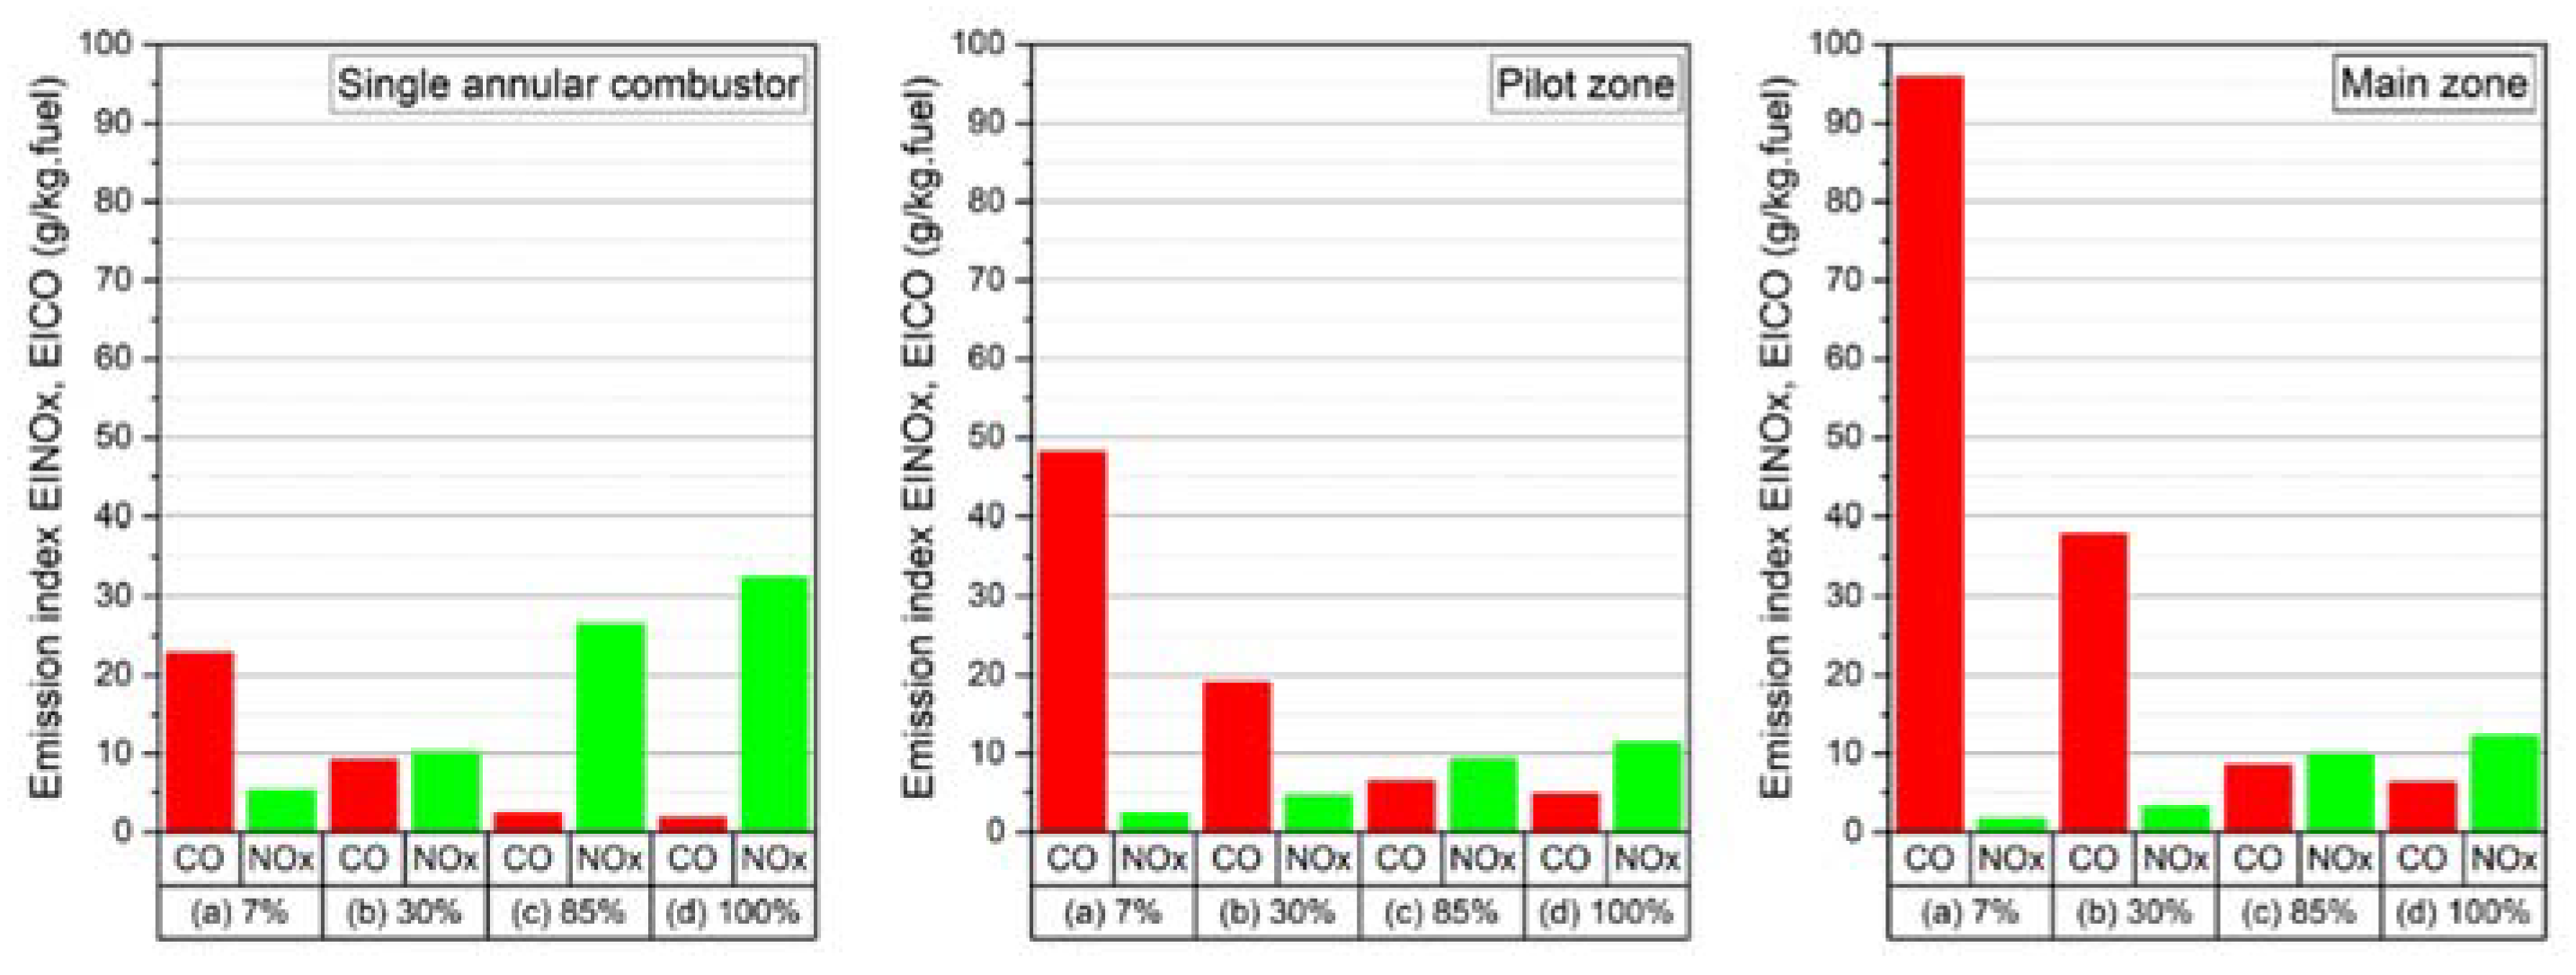
The results obtained using the three-stage optimization algorithm show that the emission of nitrogen oxides decreased significantly, but the multiplication of the evaluation index () exceeded the reference value. Based on Table 7, this result was caused by CO emission, which exceeded twice the reference value. As shown in Figure 10, the carbon monoxide emission per unit mass of fuel was significant in the taxi/idle and approach stages, indicating that the combustion efficiency was extremely low in these two stages. In particular, CO was generated in the main zone.
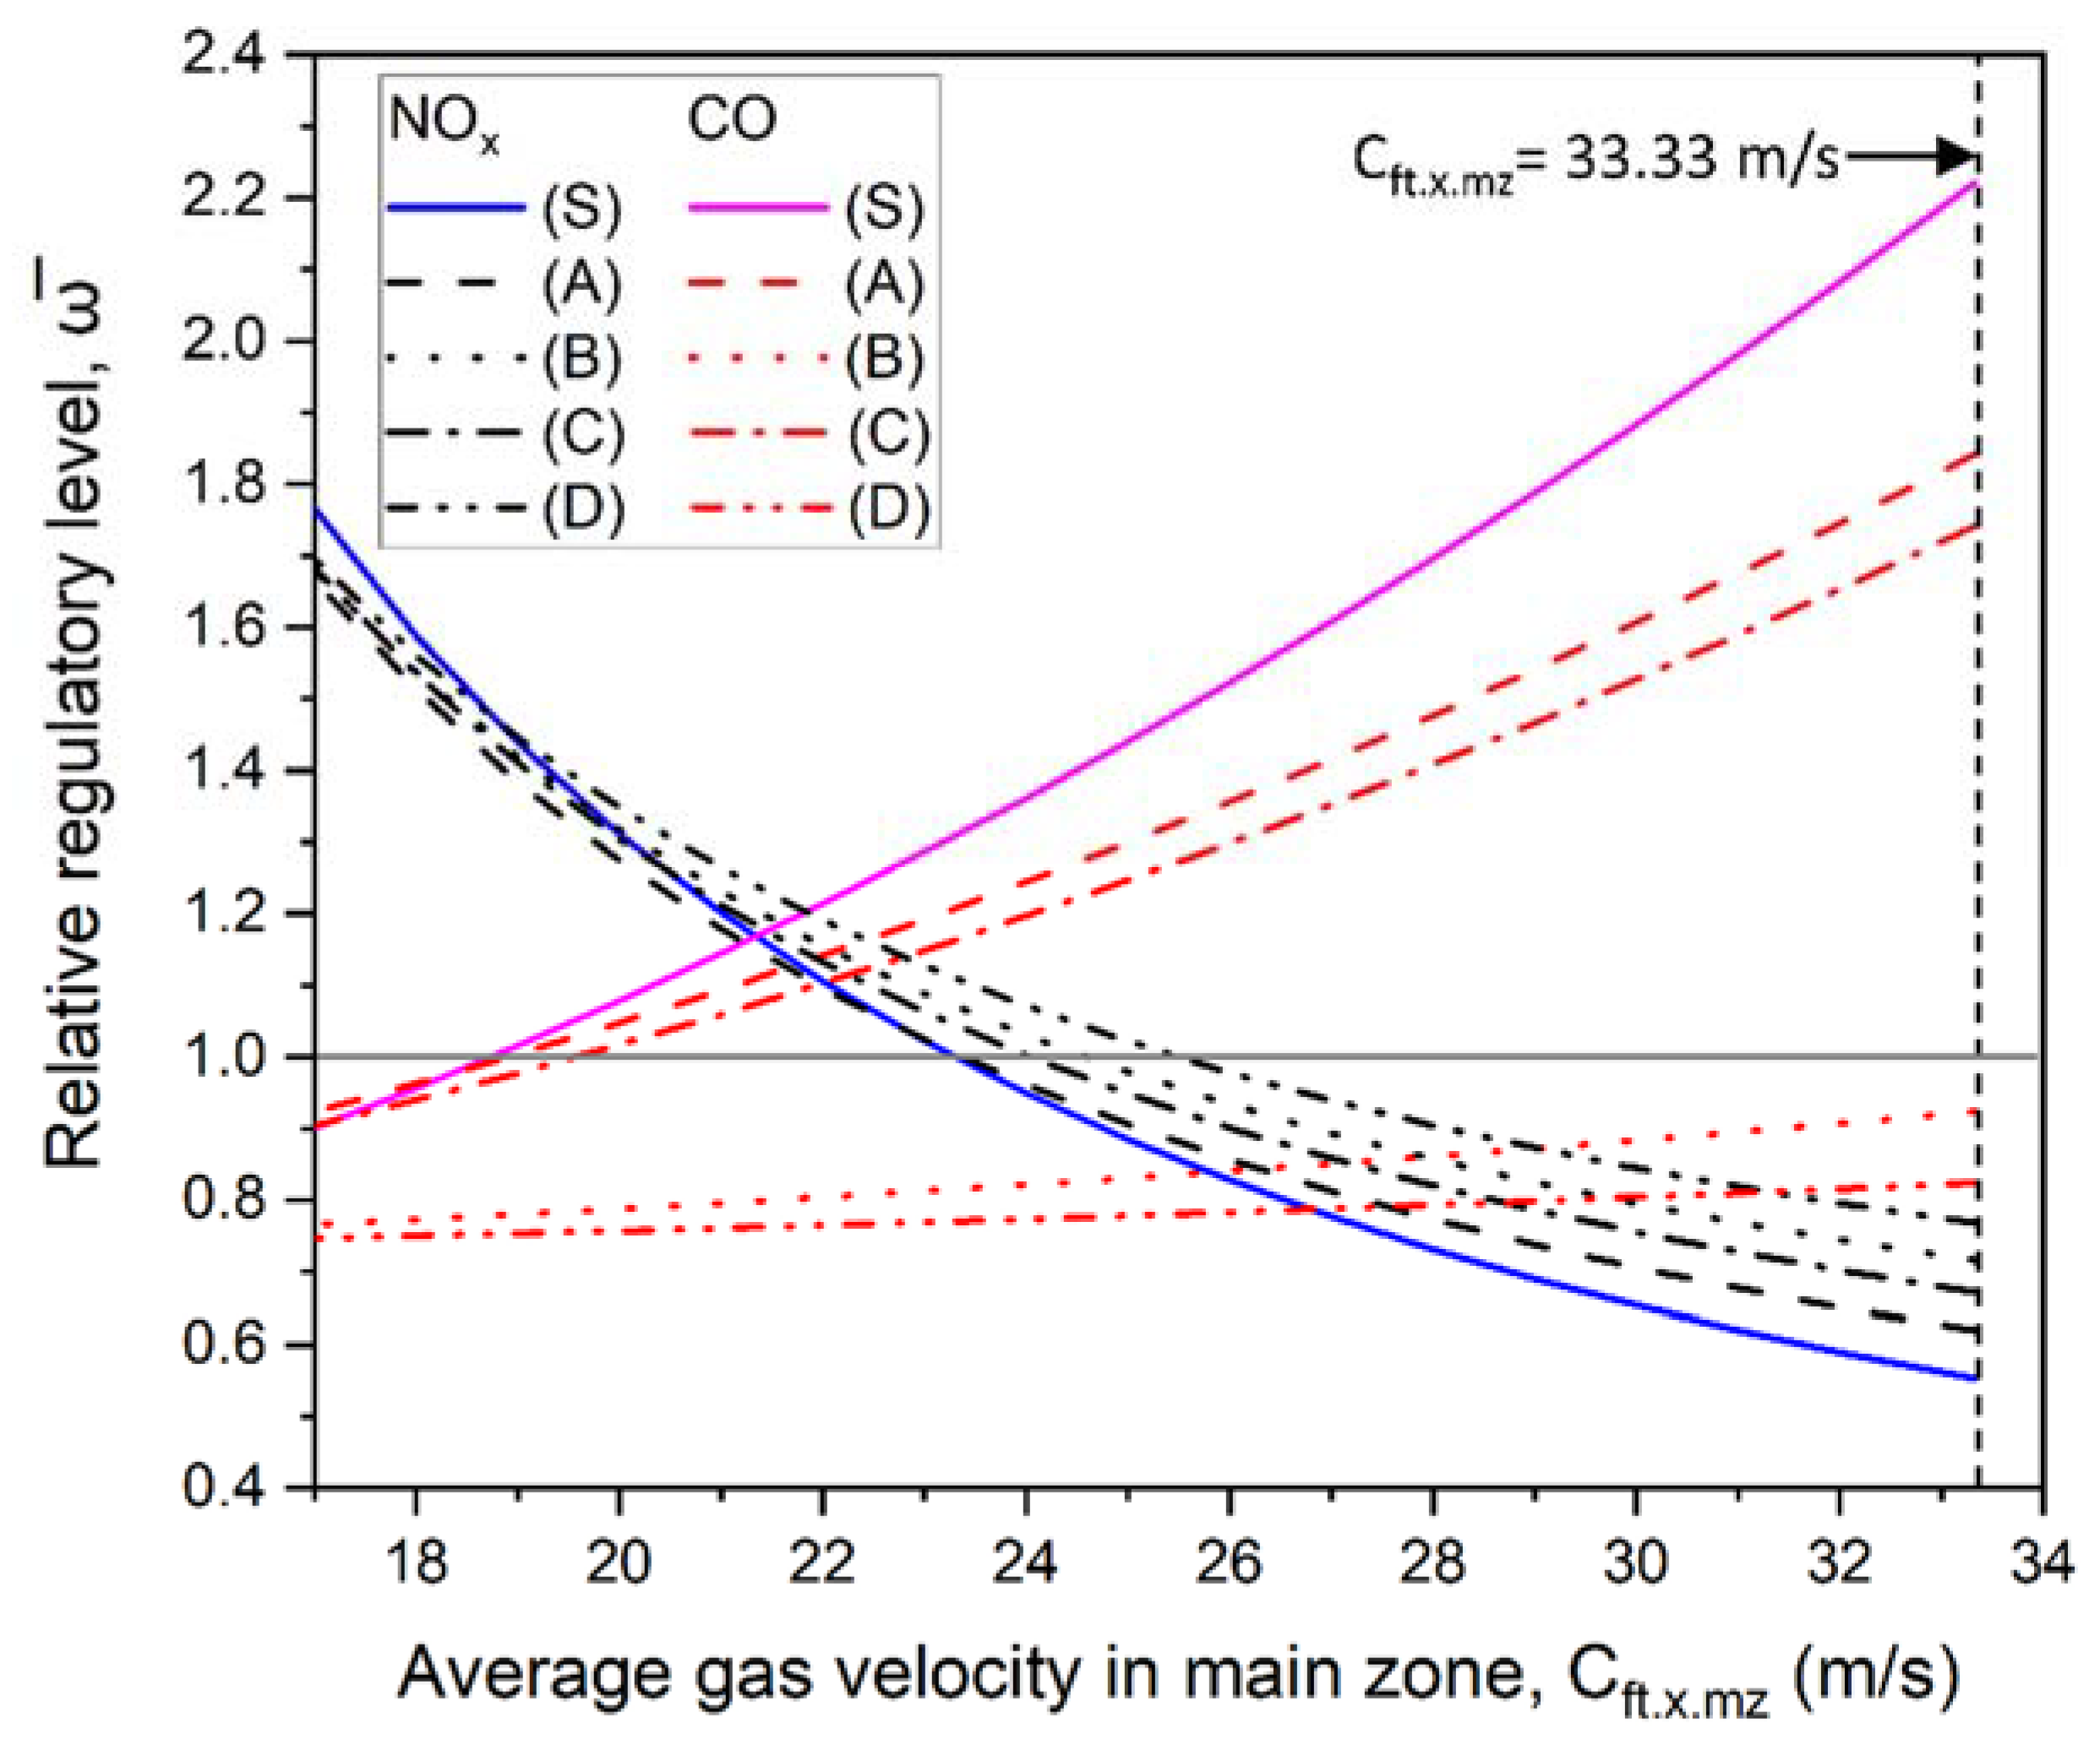
According to the basic principle of combustion theory, combustion efficiency can be increased by increasing the gas velocity in the main zone. Additionally, it has been reported that CO generation was suppressed in the air-rich state [29,40]. According to Gleason and Niedzwiecki [41], the fuel supply in the main zone for the two modes (approach and taxi/idle) can be turned off; however, this will yield poor results. Five cases (S, A, B, C, and D) were considered, as shown in Table 8, which reflect this method. Figure 11 shows that the relative regulatory levels varied as decreased from the value of 33.33 m/s. In the case of S, the values obtained using the simplex method remained constant for parameters other than . The excess air coefficient of the main zone was selected as 10 considering the air-rich combustion instability range [29]. When the average gas velocity in the main zone decreased starting from the velocity value obtained by the simplex method (), the CO emission decreased, whereas the NOx emissions increased. When combustion was terminated in one or more LTO regimes, the CO emissions remained below the reference value. However, to ensure the safe flight of an aircraft, supplying fuel to only one zone at the approach stage may not be a good option.
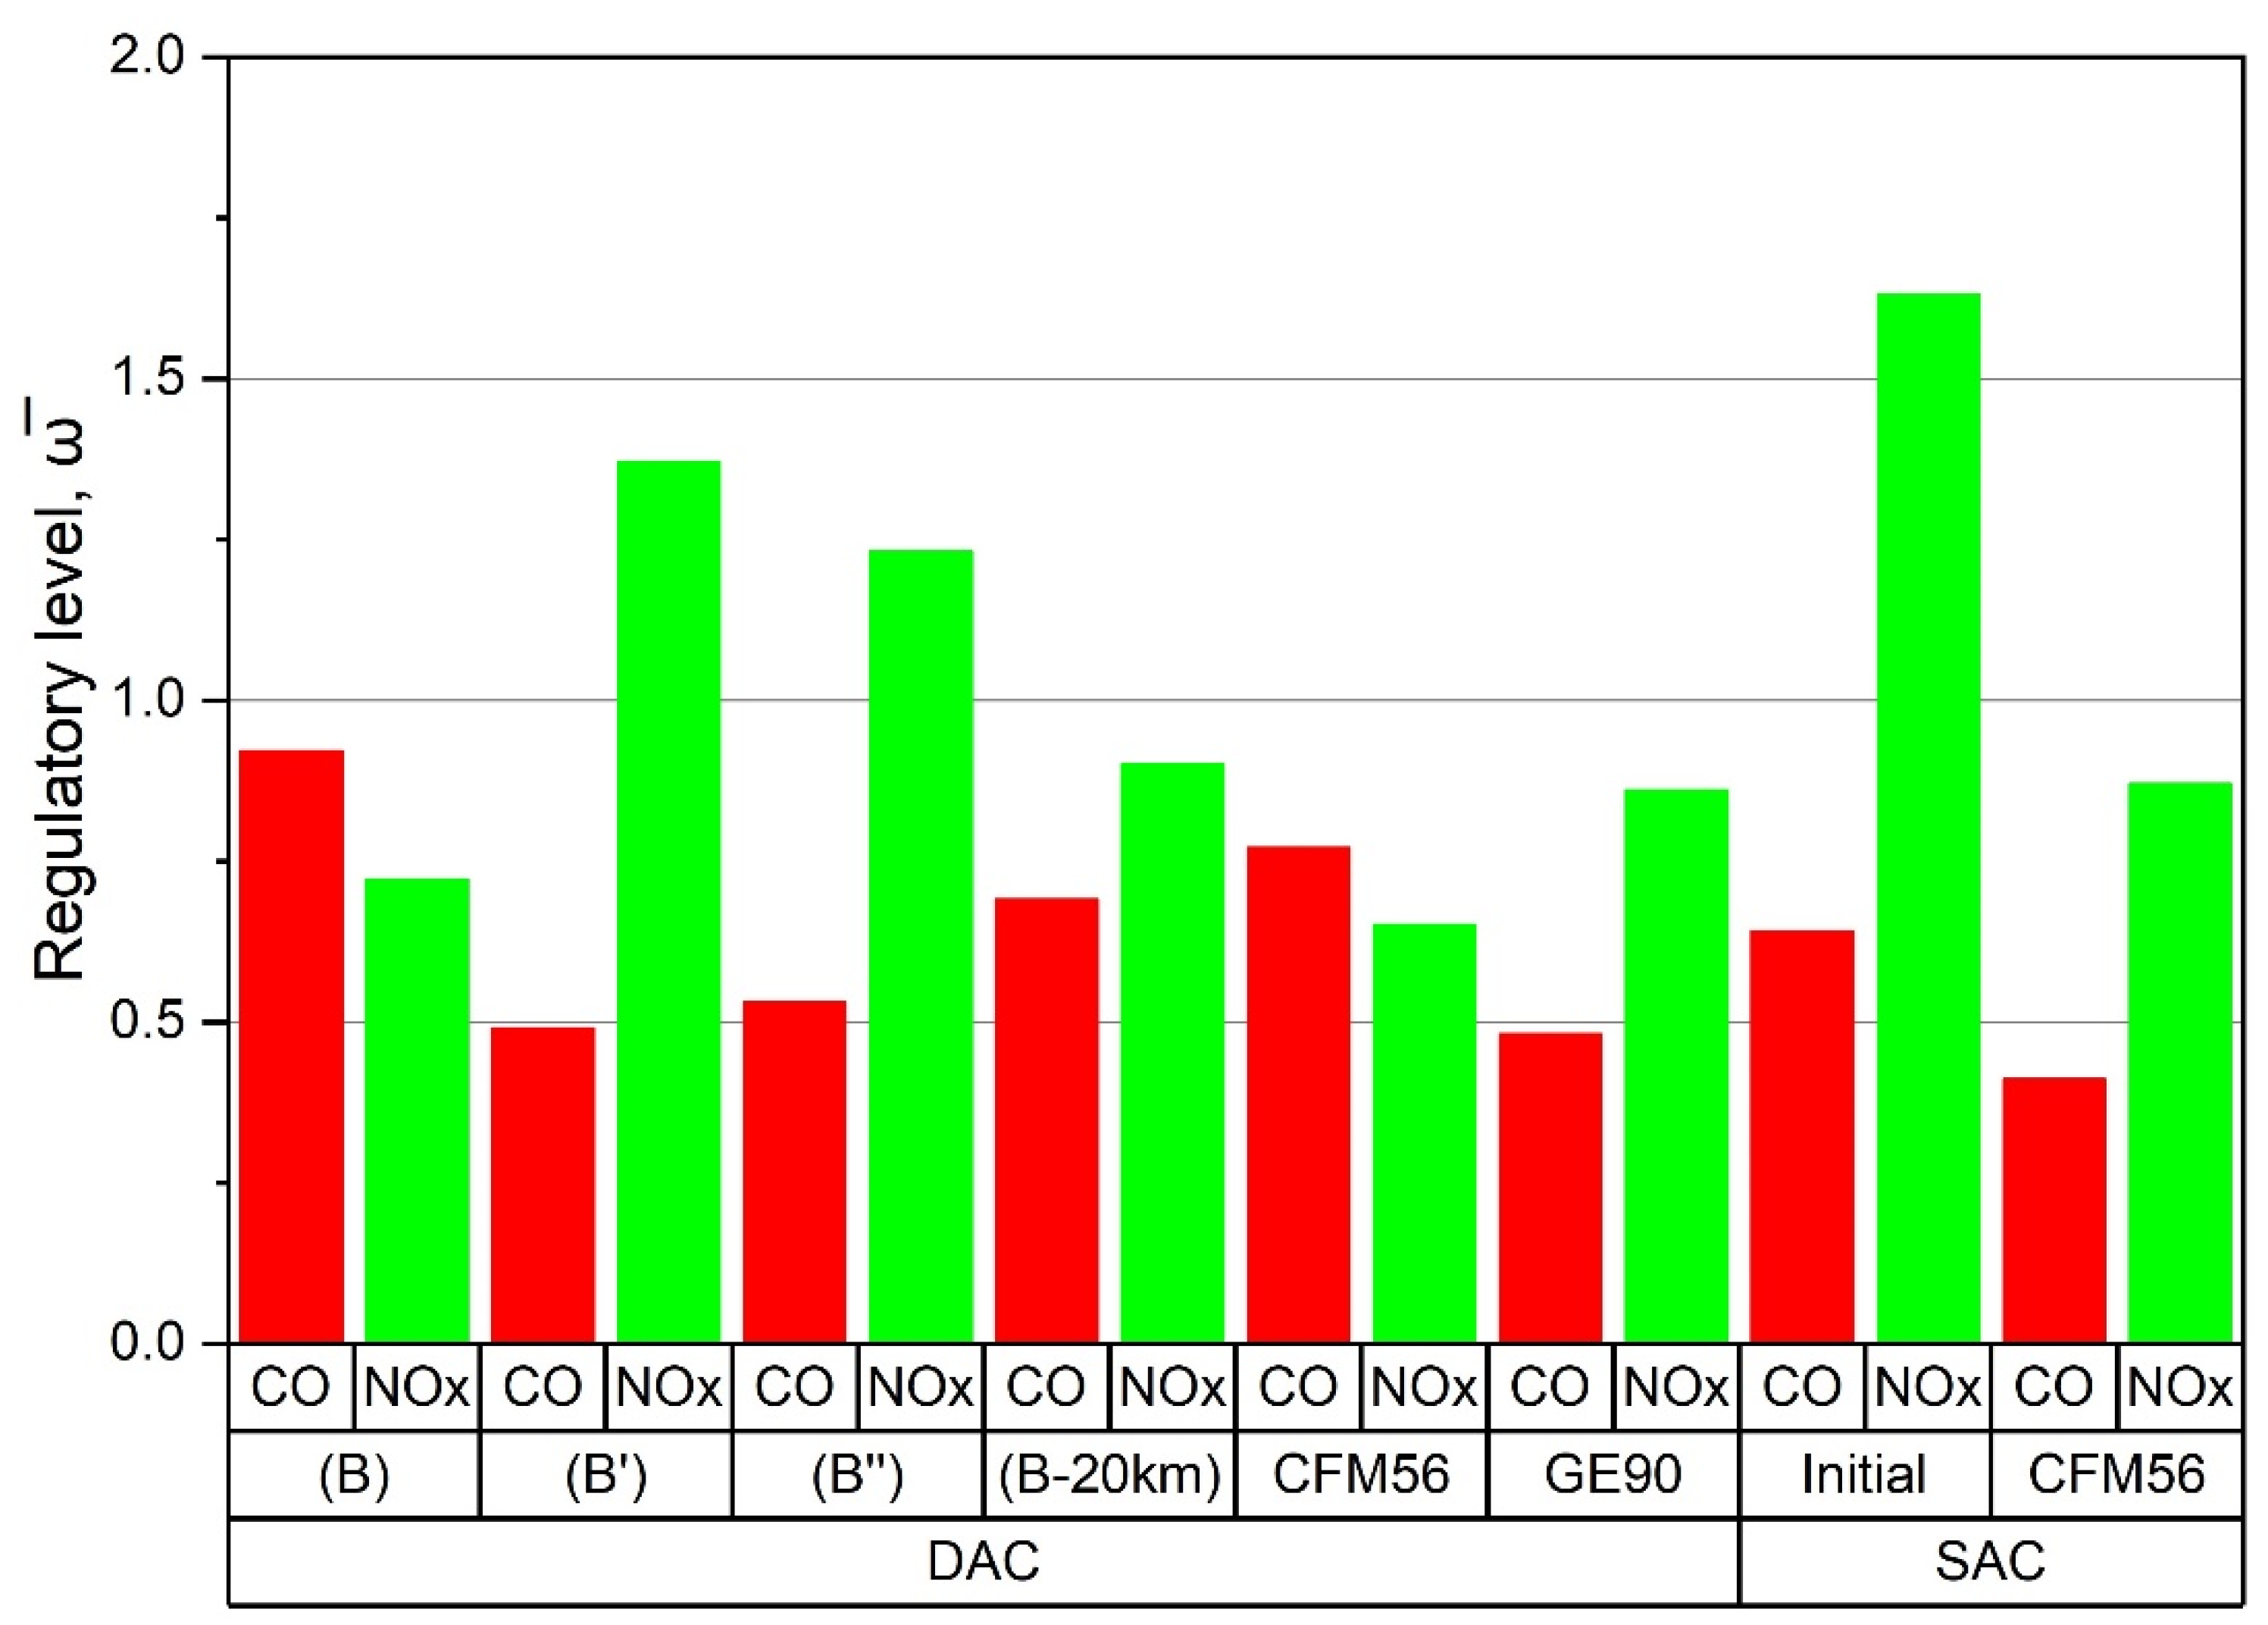
An important aspect of gas turbine combustor design is the uniformity of the temperature distribution at the turbine inlet [23]. Hence, the relative fuel flow rate () of the two zones in the takeoff stage was assigned the same value in case B′. In addition, case B″ can be considered as a case involving a lower amount of air entering the pilot zone. According to Kovner et al. [23], less CO is emitted as the volume of the flame tube increases. When was increased, the pilot zone volume increased while the airflow ratio () remained fixed. According to the regression equations shown in Equations (9) and (10) in Section 3.1, as well as Figure 8, the effect of on the emissions was slight. Therefore, can be increased while maintaining the remaining values (case B-20 km in Table 8). Before reducing the velocity (at ), the evaluation index () of B and D indicated minimum values, as shown in Figure 12. In cases B′ and B″, the CO emissions reduced by almost one-half, but the NOx emissions exceeded the reference value. Both substances did not exceed the reference value in the case of B-20 km, but the amount of NOx increased slightly compared with that of case B.
In the initial model (initial SAC in Figure 12) before conversion to the DAC, the amount of NOx emitted exceeded the CAEP/8 reference value. NOx emissions decreased considerably in the DAC, but CO emission increased in case B after applying the optimization process. As shown in Figure 12 and Table 9, a similar trend was observed in the actual SAC and DAC data of the CFM56 engine [42,43]. In the case of B-20 km, the amount of NOx increased as the CO emission reduced, which is comparable to the data of GE-90. The relative NOx emission of the DAC, derived through several calculation steps, was similar to the actual engine data; however, it was confirmed that the CO emissions differed slightly.
4. Conclusions
Based on the thermodynamic theory of the turbofan engine and turbomachinery theory, a one-dimensional model of a SAC of the PS-90A engine was developed. The relationship between NOx and CO emissions and the design parameters of the combustor were derived by comparing the values obtained from the calculation of off-design points and the experimental data pertaining to four LTO modes of the ICAO. Empirical equations were included in the design algorithm to design the DAC. Because NOx and CO were generated under different conditions, the main and pilot zones constituting the combustor reduced the amount of each substance. Hence, optimization was applied to select the initial design values of the two zones.
In this study, the relative mass flow rate of air in the pilot zone (), dimensionless relative mass flow rate of fuel in each zone (,), average axial gas velocity in the pilot zone (), and maximum restart altitude () were used as initial values. To perform the multivariate optimization algorithm using the gradient method and the simplex method in a stepwise manner, the experimental plan theory was applied in advance to obtain a regression model of the calculated values.
To comprehensively evaluate the amount of harmful emissions, the product of the relative regulatory levels of NOx and CO () was introduced as an evaluation index. As a result of performing optimization using this evaluation index, the amount of NOx reduced significantly, whereas the combustion efficiency of the main zone in the taxi/idle regime decreased significantly. It was confirmed that terminating the main-zone fuel flow in the low-thrust regime can more effectively solve the problem than by sustaining combustion in this zone. Decreasing the gas velocity in the pilot zone can reduce CO emission; however, NOx emissions may increase. The values derived in this study did not differ significantly from the actual engine test data.
Hence, the possibility of designing a combustor that satisfies the environmental standards of CAEP/8 was indicated through the proposed DAC design method. It is thought that the optimal design parameters of the independent annular pilot and main zones can be obtained for reducing the emissions through one-dimensional design. Since the turbine inlet is shared, however, the pilot and main zones must be connected in the dilution zone. The CO emission derived from this study may be higher than the actual value as the combustion gas from the two independent combustion zones and the additionally introduced air are mixed in such a dilution zone. Compared with the GE90 engine test data, the case B-20 km showing the most reasonable results has a difference of more than 40% in regulatory levels of CO emission, while the difference is less than 5% for the NOx emission. Therefore, a subsequent study is necessary to obtain a correlation between the mixing effect of the combustion gas generated in the two zones with the cooling air and the structural parameters of the dilution zone. In addition, this paper can be presented as a method that can be performed at the initial stage of combustor design to reduce harmful emissions, but it is also necessary to supplement it with other methods such as experimental verification.
Author Contributions
All authors (G.J. and K.A.) have contributed equally to the methodology, investigation, data curation, writing—original draft preparation, writing—review and editing. Both authors have read and agreed to the published version of the manuscript.
Funding
This research was supported by the Korea Aerospace Research Institute (KARI–FR21C00) and the National Research Foundation (NRF-2019M1A3A1A02076962 and NRF-2021M1A3B8077772) funded by the Ministry of Science and ICT, South Korea.
Institutional Review Board Statement
Not applicable.
Informed Consent Statement
Not applicable.
Data Availability Statement
This study did not report any data.
Conflicts of Interest
The authors declare no conflict of interest.
Nomenclature
| CO | carbon monoxide |
| CAEP | committee on aviation environmental protection |
| average axial air velocity in the flame tube without burning, (m/s) | |
| average air velocity in the holes of the flame tube, (m/s) | |
| DAC | double annular combustor |
| the middle diameter of flame tube (at the location of swirler-injector), (m) | |
| the middle diameter of the last-stage stator blade of the compressor, (m) | |
| diameter of swirler, (m) | |
| EI | emission index (g/kg∙fuel) |
| average cross-sectional area of flame tube, (m2) | |
| hole area on the flame tube wall, (m2) | |
| cross-sectional area of swirler, (m2) | |
| the airflow rate at the entrance of the combustor, (kg/s) | |
| relative mass flow rate of air in the main zone | |
| relative mass flow rate of air in the pilot zone | |
| the fuel flow rate, (kg/s) | |
| ICAO | international civil aviation organization |
| a parameter of combustion augmentation | |
| the maximum restartable altitude, (m) | |
| the length of the combustion zone, (m) | |
| the length of the dilution zone, (m) | |
| relative longitudinal size of combustion zone | |
| relative longitudinal size of dilution zone | |
| stoichiometric coefficient of fuel, (kgair/kgfuel) | |
| LTO | landing and takeoff |
| the flight Mach number | |
| characteristic Mach number | |
| m | bypass ratio |
| number of injectors | |
| NOx | nitrogen oxides |
| maximum thrust, (kN) | |
| total pressure at compressor outlet, (Pa) | |
| total pressure of atmosphere, (Pa) | |
| volumetric airflow rate at the outlet of the compressor, (m3/s) | |
| SAC | single annular combustor |
| SH | specific humidity of air at the entrance to the combustion chamber, (gwater/kgair) |
| total temperature at compressor outlet, (K) | |
| total temperature of atmosphere, (K) | |
| pitch between swirlers (m) | |
| relative pitch between swirlers | |
| TAPS | twin annular premixing swirler |
| relative mass flow rate of fuel | |
| dimensionless relative mass flow rate of fuel in the main zone | |
| dimensionless relative mass flow rate of fuel in the pilot zone | |
| volume of the combustion zone, (m3) | |
| the volume of the combustion chamber flame tube, (m3) | |
| tangential component of air velocity, (m/s) | |
| axial component of air velocity, (m/s) | |
| excess air coefficient (L0: stoichiometric coefficient) | |
| excess air coefficient in the combustion zone | |
| excess air coefficient of the main zone | |
| The relative amount of air using for the turbine cooling | |
| μ | discharge coefficient |
| overall pressure ratio | |
| the density air in combustor, (kg/m3) | |
| τ | stage duration, (min) |
| blade angle of swirler, (degrees) | |
| ω | regulatory level (g/kN) |
| Subscripts | |
| a | air |
| c | compressor outlet |
| ch | combustor |
| cz | combustion zone |
| d | dilution zone |
| f | fuel |
| ft | flame tube |
| g | turbine inlet |
| hf | hole on flame tube |
| mid | middle position |
| mz | main zone |
| opt | optimal value |
| pz | pilot zone |
| sw | swirler |
| * | thermo-gas dynamic value at the stagnation point |
References
- Onischik, I.I.; Ovsyaninkov, V.A.; Rutovsky, V.B. Research Methods for Harmful Effect of Jet Engines on the Environment; Publishing House MAI: Moscow, Russia, 1987. (In Russian) [Google Scholar]
- Korinevskaya, V.Y.; Belousova, I.V.; Shanina, T.P. Estimation of the emission of pollutants in the landing/takeoff cycle (on the example of the Odessa international airport). Bull. Odessa State Ecol. Univ. 2011, 12, 5–12. (In Russian) [Google Scholar]
- Zhu, Y.; Fanning, E.; Yu, R.C.; Zhang, Q.; Froines, J.R. Aircraft emissions and local air quality impacts from takeoff activities at a large international airport. Atmos. Environ. 2011, 45, 6526–6533. [Google Scholar] [CrossRef]
- Reddy, D.R.; Lee, C. An overview of low-emission combustion research at NASA Glenn. In Turbo Expo: Power for Land, Sea, and AirI; American Society of Mechanical Engineers: New York, NY, USA, 2016; Volume 49750. [Google Scholar]
- Szaniszlo, A.J. The Advanced Low-Emissions Catalytic-Combustor Program: Phase I-Description and Status; American Society of Mechanical Engineers: New York, NY, USA, 1979; Volume 79689. [Google Scholar]
- Jones, R.E.; Grobman, J. Design and evaluation of combustors for reducing aircraft engine pollution. NASA 1973, 19. [Google Scholar]
- Lee, C. NASA project develops next generation low-emissions combustor technologies. In Proceedings of the 51st AIAA Aerospace Sciences Meeting Including the New Horizons Forum and Aerospace Exposition, Grapevine, TX, USA, 7–10 January 2013. [Google Scholar]
- Papathakos, L.C.; Jones, R.E. Use of an air-assisted fuel nozzle to reduce idle emissions of a JT8D engine combustor. NASA 1973, 501, 24. [Google Scholar]
- Mularz, E.J.; Gleason, C.C.; Dodds, W.J. Combustor concepts for aircraft gas turbine low-power emissions reduction. J. Energy 1979, 3, 1. [Google Scholar] [CrossRef]
- Mongia, H.C. GE Aviation Low Emissions Combustion Technology Evolution; SAE: Warrendale, PA, USA, 2007. [Google Scholar]
- Belcher, B. Rolls-Royce CLEEN II low emission combustion technology. Rolls-Royce. In Proceedings of the CLEEN II Consortium Public Day, Cleveland, OH, USA, 8 May 2019. [Google Scholar]
- Li, F.; Shang, S.T.; Cheng, M.; Peng, L.Q.; Yang, H.; Song, B. Research on the feasibility of displacing the single annular combustor with a dual annular combustor. J. Aerosp. Pow. 2008, 1. (In Chinese) [Google Scholar]
- Frassoldati, A.; Cuoci, A.; Faravelli, T.; Ranzi, E.; Colantuoni, S.; Martino, P.D.; Cinque, G. Experimental and modeling study of a low NOx combustor for aero-engine turbofan. Combust. Sci. Technol. 2009, 181, 483–495. [Google Scholar] [CrossRef]
- Colantuoni, S.; Di Martino, P.; Cinque, G.; Terlizzi, A. The development of low-NOx CLEAN combustor in the frame of EEFAE research program. Turbo Expo Power for Land Sea Air 2007, 47918, 649–659. [Google Scholar]
- Li, F.; Cheng, M.; Shang, S.T.; Liu, D.C.; Zhang, S.S.; Song, B. Capability compare of twin annular premixing swirler with the single annular and dual annular combustor. J. Aerosp. Power 2012, 27, 1681–1687. (In Chinese) [Google Scholar]
- Yin, C.; Zhang, R.; Zhang, C.; Fan, W. Numerical simulation on combustion and exhaust emission of staged combustor. In Proceedings of the IOP Conference Series: Earth and Environmental Science, Sanya, China, 21–23 November 2016; Volume 52. [Google Scholar]
- Sarkisov, A.A.; Rudakov, O.A.; Salivon, N.D.; Sigalov, Y.V.; Mitrofanov, V.A. Dependence of NOx emission on the design and operating parameters of the combustion chamber of a gas turbine engine. Heat Power Eng. 1999, 12, 53–56. (In Russian) [Google Scholar]
- Sarkisov, A.A.; Rudakov, O.A.; Salivon, N.D.; Sigalov, Y.V.; Mitrofanov, V.A. Generalized emission characteristic of GTE as a function of design and operating parameters of the combustion chamber. Heat Power Eng. 2000, 4, 63–66. (In Russian) [Google Scholar]
- Mousemi, A.; Mosadegh, S.; Khademi, A.; Sorrentino, G. Design and Analytical Evaluation of a Swirler-Injector System. J. Fluid Flow Heat Mass Transfer (JFFHMT) 2021, 8, 166–177. [Google Scholar]
- Saboohi, Z.; Ommi, F.; Fakhrtabatabaei, A. Development of an augmented conceptual design tool for aircraft gas turbine combustors. Int. J. Multiphys. 2016, 10, 53–74. [Google Scholar]
- Saboohi, Z.; Ommi, F.; Akbari, M. Multi-objective optimization approach toward conceptual design of gas turbine combustor. Appl. Therm. Eng. 2019, 148, 1210–1223. [Google Scholar] [CrossRef]
- Khandelwal, B.; Banjo, O.; Sethi, V. Design, evaluation and performance analysis of staged low emission combustors. J. Eng. Gas Turbines Power 2014, 136. [Google Scholar] [CrossRef]
- Kovner, D.S.; Onischik, I.I.; Khristoforov, I.L. Calculation and Design of Combustion Chambers of Airbreathing-Jet Engines in CAD; Publishing House of Moscow Aviation Institute: Moscow, Russia, 1989. (In Russian) [Google Scholar]
- Inozemtsev, A.A.; Nerad’ko, A.V.; Konyaev, E.A.; Medvedev, A.V.; Ryassov, A.Y. Aviation Engine PS-90A; Fizmatlit: Moscow, Russia, 2007. (In Russian) [Google Scholar]
- Doroshenko, V.E. On the Combustion Process in a Gas Turbine Engine Chamber; Proceedings No. 354; Institute named after P. I.; Baranov: Moscow, Russia, 1959. (In Russian) [Google Scholar]
- Onischik, I.I.; Khristoforov, I.L.; Koloskov, A.S. Calculation and Design of Combustion Chamber of Air-Breathing Jet Engines Applied to CAD; Publishing House of MAI: Moscow, Russia, 1980. (In Russian) [Google Scholar]
- Bykov, N.N. Gas-Dynamic Calculations of Compressors and Turbines of Aircraft Gas Turbine Engines using a Computer; Publishing House MAI: Moscow, Russia, 1991. (In Russian) [Google Scholar]
- Kholschevnikov, K.V. Theory and Calculation of Aviation Turbomachine; Mashinostroenie: Moscow, Russia, 1970. (In Russian)
- Agulnik, A.B.; Bakulev, V.I.; Golubev, V.A.; Kravchenko, I.V.; Krylov, B.A. Thermogasdynamic Calculations and Calculation of the Characteristics of Aircraft Gas Turbine Engines; Publishing House MAI: Moscow, Russia, 2002. (In Russian) [Google Scholar]
- ICAO. Annex 16 “International Standards and Recommended Practices, Environmental Protection”, Volume II “Aircraft Engine Emissions”, 4th ed.; Amendment 9, 2017 Plus Further Amendments: Amendment 10; ICAO: Montréal, QC, Canada, 2021. [Google Scholar]
- Mitrofanov, V.A. Combustion Chambers of Gas Turbine Engines: Mathematical Modeling, Calculation Methodology, Concept of Optimal Design. Ph.D. Thesis, JSC Klimov, Saint Petersburg, Russia, 2004. (In Russian). [Google Scholar]
- Jeong, G. Analysis of Double Annular Combustion Chamber. Master’s Thesis, Moscow Aviation Institute, Moscow, Russia, 2015. (In Russian). [Google Scholar]
- Mazaheri, K.; Shakeri, A. Numerical optimization of laboratory combustor geometry for NO suppression. Appl. Therm. Eng. 2016, 102, 1328–1336. [Google Scholar] [CrossRef]
- Startsev, N.I. Construction and Design of the Combustion Chamber of Gas Turbine Engines; Publishing house of SSAU: Samara, Russia, 2007. (In Russian) [Google Scholar]
- Pchelkin, Y.M. Combustion Chambers of Gas Turbine Engines: Textbook for Universities; Mashinostroenie: Moscow, Russia, 1973. (In Russian)
- Agulnik, A.B.; Kravchenko, I.V. Methodological Instructions for the Implementation of Term Papers on the Course, “Theory and Calculation of Aircraft Engines and Power Plants”; Publishing House MAI: Moscow, Russia, 2012. [Google Scholar]
- The Design and Development of Gas Turbine Combustors Vol. II Design Methods and Development Techniques; Northern Research and Engineering Corporation: Woburn, MA, USA, 1980.
- Marchukov, E.Y.; Onishchik, I.I.; Rutovsky, V.B.; Taran, E.M.; Cherkez, A.Y. Testing and Ensuring the Reliability of Aircraft Engines and Power Plants, 2nd ed.; Publishing house of MAI: Moscow, Russia, 2004. (In Russian) [Google Scholar]
- Taavitsainen, V.T. Experimental optimization and response surfaces (91-138). In Chemometrics in Practical Applications; Varmuza, K., Ed.; InTechOpen: London, UK, 2012. [Google Scholar]
- Stickles, R.; Barrett, J. TAPS II Technology Final Report–Technology Assessment Open Report. DTFAWA-1C-00046. In Continuous Lower Energy, Emissions and Noise (CLEEN) Technologies Development; FAA: Cincinnati, OH, USA, 2013. [Google Scholar]
- Gleason, C.; Niedzwiecki, R. Results of the NASA/General Electric Experimental Clean Combustor Program. In Proceedings of the 12th Propulsion Conference, Palo Alto, CA, USA, 26–29 July 1976; p. 763. [Google Scholar]
- ICAO. Engine Exhaust Emissions Data Bank. Available online: https://www.easa.europa.eu/domains/environment/icao-aircraft-engine-emissions-databank (accessed on 20 May 2021).
- Jeong, G.; Yoon, Y. Analysis of a dual-annular combustor operation process. In Proceedings of the 54th KOSCO Symposium, Gangneung, Korea, 18–20 May 2017. [Google Scholar]

Figure 2.
Schematic illustration of DAC.

Figure 3.
Standard LTO cycle.

Figure 4.
Comparison of calculated values of emission index with empirical values from experimental data (▲: emission index of CO; ■: emission index of NOx).
Figure 4.
Comparison of calculated values of emission index with empirical values from experimental data (▲: emission index of CO; ■: emission index of NOx).

Figure 5.
Block diagram of calculation [32]. (a) Subroutine flowchart of calculation procedure for combustor designing. (b) Flowchart for the optimization plan [27,28,29,36].


Figure 6.
Comparison of univariate design method (dotted line) and gradient method (solid line) (A: starting point; B: second point; C: optimum value) [38].
Figure 6.
Comparison of univariate design method (dotted line) and gradient method (solid line) (A: starting point; B: second point; C: optimum value) [38].

Figure 7.
Relative regulatory level based on step in gradient direction for five factors.

Figure 8.
Relative regulatory level () based on step in gradient direction for four factors.

Figure 9.
Geometrical interpretation of simplex strategy with two factors [38].
Figure 9.
Geometrical interpretation of simplex strategy with two factors [38].

Figure 10.
Emission indices of NOx and CO for each step in the LTO cycle.

Figure 11.
Relationship of regulation level for NOx and CO with gas velocity in the main zone.

Figure 12.
Comparison of SAC and DAC emissions with calculated values and real data from ICAO.


Table 1.
Initial value for thermodynamic engine model.
| Parameter | Value | Units |
|---|---|---|
| Maximum thrust, Foo | 157 | kN |
| Bypass ratio, m | 4.5 | - |
| Overall pressure ratio, πoo | 30 | - |
| Total temperature of turbine, Tg* | 1640 | K |
| stoichiometric coefficient of fuel, L0 | 14.8 | kgair/kgfuel |
Table 2.
Reference LTO cycle of subsonic aircraft [30].
Table 2.
Reference LTO cycle of subsonic aircraft [30].
| Stages of Takeoff and Landing Cycle | Subsonic Aircraft | |
|---|---|---|
| Engine Thrust on Stage | Stage Duration τ, min | |
| Takeoff | Poo | 0.7 |
| Climb-out (to 3000 ft.) | 0.85 Poo | 2.2 |
| Approach (from 3000 ft.) | 0.30 Poo | 4.0 |
| Taxi/idle | 0.07 Poo | 26.00 |
Table 3.
Parameters of double annular combustor.
| Single annular combustor | 0.67 | 0.4 | 0.94 | 0.99 | |
| Double annular combustor | Pilot zone | 1.70 | 1.83 | 1.00 | 1.60 |
| Main zone | 1.00 | 0.83 | 0.90 | 0.80 | |
Table 4.
Factors for fractional factorial experiment.
| Number, k | |||||
|---|---|---|---|---|---|
| 1 | 0.2 | 0.4 | 0.1 | 0.3 | |
| 2 | 30 | 40 | 5 | 35 | |
| 3 | 0.8 | 1.2 | 0.2 | 1 | |
| 4 | 0.8 | 1.2 | 0.2 | 1 | |
| 5 | , m | 8000 | 12,000 | 2000 | 10,000 |
Table 5.
Fractional factorial design and experimental results involving five factors.
| Run (u) | Factor | Response | |||||||||||
|---|---|---|---|---|---|---|---|---|---|---|---|---|---|
| z0 | z1 | z2 | z3 | z4 | z5 | z6 | z7 | z8 | z9 | ||||
| 1 | x1 | x2 | x3 | x4 | x5 | x1x2 | x1x3 | x1x4 | x1x5 | y1′ | y2′ | y3′ | |
| 1 | + | + | + | + | + | + | + | + | + | + | 0.61 | 2.71 | 1.66 |
| 2 | + | − | + | + | + | + | − | − | − | − | 0.42 | 3.22 | 1.35 |
| 3 | + | + | − | + | + | − | − | + | + | − | 0.68 | 1.78 | 1.21 |
| 4 | + | − | − | + | + | − | + | − | − | + | 0.72 | 2.35 | 1.69 |
| 5 | + | + | + | − | + | − | + | − | + | − | 1.36 | 2.54 | 3.46 |
| 6 | + | − | + | − | + | − | − | + | − | + | 1.73 | 2.54 | 4.39 |
| 7 | + | + | − | − | + | + | − | − | + | + | 1.87 | 1.47 | 2.74 |
| 8 | + | − | − | − | + | + | + | + | − | − | 2.41 | 1.44 | 3.47 |
| 9 | + | + | + | + | − | + | + | + | − | + | 0.55 | 3.02 | 1.66 |
| 10 | + | − | + | + | − | + | − | − | + | − | 0.42 | 3.21 | 1.36 |
| 11 | + | + | − | + | − | − | − | + | − | − | 0.66 | 1.90 | 1.25 |
| 12 | + | − | − | + | − | − | + | − | + | + | 0.74 | 2.23 | 1.64 |
| 13 | + | + | + | − | − | − | + | − | − | − | 1.24 | 2.89 | 3.57 |
| 14 | + | − | + | − | − | − | − | + | + | + | 1.63 | 2.67 | 4.34 |
| 15 | + | + | − | − | − | + | − | − | − | + | 1.71 | 1.65 | 2.83 |
| 16 | + | − | − | − | − | + | + | + | + | − | 2.28 | 1.51 | 3.44 |
| 17 | + | 0 | 0 | 0 | 0 | 0 | 0 | 0 | 0 | 0 | 0.85 | 2.12 | 1.81 |
Table 6.
Fractional factorial design and experimental results involving four factors.
| Run (u) | Factor | Response | ||||||
|---|---|---|---|---|---|---|---|---|
| z0 | z1 | z2 | z3 | z4 | ||||
| 1 | x1 | x2 | x3 | x4 | y1′ | y2′ | y3′ | |
| 1 | + | + | + | + | + | 0.57 | 2.75 | 1.56 |
| 2 | + | − | + | + | − | 0.42 | 3.28 | 1.38 |
| 3 | + | + | − | + | − | 0.70 | 1.85 | 1.29 |
| 4 | + | − | − | + | + | 0.72 | 2.21 | 1.60 |
| 5 | + | + | + | − | − | 1.42 | 2.86 | 4.08 |
| 6 | + | − | + | − | + | 1.99 | 2.53 | 5.02 |
| 7 | + | + | − | − | + | 1.68 | 1.48 | 2.50 |
| 8 | + | − | − | − | − | 2.07 | 1.51 | 3.14 |
| 9 | + | 0 | 0 | 0 | 0 | 0.85 | 2.12 | 1.81 |
Table 7.
Results of optimization methods.
| Optimization Step | Hign | Cft.mz | |||||||
|---|---|---|---|---|---|---|---|---|---|
| m | - | m/s | - | - | - | - | - | ||
| Initial SAC | 10,000 | - | - | - | - | 1.6274 | 0.6448 | 1.0494 | |
| Gradient method | 5-factors | 10,500 | 0.326 | 33.6 | 1.261 | 1.002 | 0.5445 | 2.2619 | 1.2316 |
| 4-factors | 8000 | 0.321 | 32.8 | 1.223 | 0.980 | 0.5601 | 2.1886 | 1.2257 | |
| 10,000 | 0.323 | 32.6 | 1.243 | 0.979 | 0.5746 | 2.1410 | 1.2303 | ||
| 12,000 | 0.325 | 32.4 | 1.263 | 0.977 | 0.5844 | 2.1121 | 1.2343 | ||
| Average | 10,100 | 0.324 | 32.9 | 1.248 | 0.985 | 0.5658 | 2.1759 | 1.2312 | |
| Simplex method | 10,453 | 0.329 | 33.3 | 1.2580 | 1.0094 | 0.6004 | 2.2546 | 1.3536 | |
Table 8.
Cases for reducing CO emission.
| Case | Maximum Ignition Altitude Hign, m | ||||
|---|---|---|---|---|---|
| Taxi/idle | Approach | ||||
| S | 5.70 | 4.34 | 0.47 | 1.26 | 10,453 |
| A | 10 | 10 | |||
| B | Off | 10 | |||
| B-20 km | 20,000 | ||||
| B′ | 1.00 | 1.00 | 10,453 | ||
| B″ | 0.90 | 1.10 | |||
| C | 10 | Off | 0.47 | 1.26 | |
| D | Off | Off | |||
Table 9.
SAC and DAC emissions with calculated values and real data from ICAO.
| Type | Case | ||
|---|---|---|---|
| SAC | Initial model (from the PS-90A) | 1.63 | 0.64 |
| CFM56 | 0.87 | 0.41 | |
| DAC | B | 0.72 | 0.92 |
| B′ | 1.37 | 0.49 | |
| B″ | 1.23 | 0.53 | |
| B-20 km | 0.90 | 0.69 | |
| CFM56 | 0.65 | 0.77 | |
| GE90 | 0.86 | 0.48 |
Publisher’s Note: MDPI stays neutral with regard to jurisdictional claims in published maps and institutional affiliations. |
© 2021 by the authors. Licensee MDPI, Basel, Switzerland. This article is an open access article distributed under the terms and conditions of the Creative Commons Attribution (CC BY) license (https://creativecommons.org/licenses/by/4.0/).
Share and Cite
MDPI and ACS Style
Jeong, G.; Ahn, K. One-Dimensional Analysis of Double Annular Combustor for Reducing Harmful Emissions. Energies 2021, 14, 3930. https://0-doi-org.brum.beds.ac.uk/10.3390/en14133930
AMA Style
Jeong G, Ahn K. One-Dimensional Analysis of Double Annular Combustor for Reducing Harmful Emissions. Energies. 2021; 14(13):3930. https://0-doi-org.brum.beds.ac.uk/10.3390/en14133930
Chicago/Turabian StyleJeong, Gijeong, and Kyubok Ahn. 2021. "One-Dimensional Analysis of Double Annular Combustor for Reducing Harmful Emissions" Energies 14, no. 13: 3930. https://0-doi-org.brum.beds.ac.uk/10.3390/en14133930
Note that from the first issue of 2016, this journal uses article numbers instead of page numbers. See further details here.