Article

Acquiring the Foremost Window Allocation Strategy to Achieve the Best Trade-Off among Energy, Environmental, and Comfort Criteria in a Building

by
Seyedeh Farzaneh Mousavi Motlagh
1,
Ali Sohani
2,
Mohammad Djavad Saghafi
1,
Hoseyn Sayyaadi
2 and
Benedetto Nastasi
3,*
1
Department of Architecture, Architecture School, College of Fine Arts, University of Tehran, Tehran 1415 564583, Iran
2
Lab of Optimization of Thermal Systems’ Installations, Faculty of Mechanical Engineering Energy Division, K.N. Toosi University of Technology, Tehran 1999 143344, Iran
3
Department of Planning, Design and Technology of Architecture, Sapienza University of Rome, Via Flaminia 72, 00196 Rome, Italy
*
Author to whom correspondence should be addressed.
Submission received: 10 May 2021 / Revised: 18 June 2021 / Accepted: 24 June 2021 / Published: 1 July 2021
(This article belongs to the Special Issue Energy Consumption in a Smart City)

Abstract

:
The purpose of this investigation is to propose a way for acquiring the foremost window allocation scheme to have the best trade-off among energy, environmental, and comfort criteria in a building. An advanced decision-making tool, named the technique for order preference by similarity to ideal solution (TOPSIS), is utilized to find the best building amongst different alternatives for having windows on the building façades. Three conditions, namely two parallel, two perpendicular, and three façades, considered as A, B, and C types, respectively, are investigated. For each type, four possible orientations are studied. Heating, cooling, and lighting energy demands in addition to carbon dioxide equivalent emission and thermal and visual comfort are taken into account as the investigated criteria, and they are all evaluated in a simulation environment. The results show that for the modular residential buildings chosen as the case study and located in Tehran, Iran, having windows on the north and east façades is the best scheme. This alternative, which belongs to the B type, has about 40% and 37% lower heating and cooling energy demands than the C type’s foremost alternative. It is also able to provide about 10% better CO2 equivalent emission and 28% higher thermal comfort.

1. Introduction

As the concern about energy and environmental crises increases, presenting solutions and methods to cope with such issues becomes more and more important to researchers from different fields. Since the building sector is recognized as having a huge contribution to these crises, researchers in this field have also come up with some solutions to achieve energy and environmental improvements, and they are trying hard to find more effective methods as their crucial mission. Table 1 presents a list of the recent investigations in the field as the literature in which window-related parameters in a building were evaluated, considering the topic of this work. As the mentioned items in that table show, the previously conducted studies can be investigated from different viewpoints, including employed software programs and studied building aspects. The literature is reviewed from the mentioned viewpoints in the remainder of this section.

1.1. Considered Building Aspects and Employed Software Programs in the Literature

In a building, several aspects are involved, and researchers investigate a building from different perspectives. Each of these aspects can be then evaluated by some quantitative indicators that have been considered as the objective functions in the literature [21]. In order to investigate these objectives in a building, depending on the considered objectives, researchers usually use a variety of building simulation software programs, such as EnegyPlus (funded by the U.S. Department of Energy (DOE)), DesignBuilder (Stroud, Gloucestershire, UK), Radiance (developed by Greg Ward, Berkeley, CA, USA) etc.
For instance, Zhao and Du [20] presented an optimum design for an office building using DesignBuilder in which thermal comfort and energy consumption indicators were considered as the objectives. In another study, Delgarm et al. [1] considered the same two building aspects as [20] and used the EnergyPlus building simulation tool to evaluate them. Moreover, in some other works, [8,15], the impact of some design strategies, such as window-to-wall ratio (WWR) and window shading system, on energy demand and daylighting have been analyzed by employing EnergyPlus for energy simulation and Radiance and DAYSIM (developed by the National Research Council Canada and the Fraunhofer Institute for Solar Energy Systems) for daylighting analysis.
Another example that can be given is the study of Zhai et al. [9]. In this investigation, the authors presented a three-objective optimization approach to evaluate the effect of window design on energy demand and thermal and visual comfort by combining an optimization algorithm with EnergyPlus. Elghamry and Hassan [16] also analyzed the impact of window parameters on energy consumption and thermal comfort, in addition to cost and environment. Moreover, some recent works have only considered the impact of some design strategies on energy demand (e.g., [5,10,17]).
Reviewing the studies based on software program reveals that EnergyPlus has been the most popular building simulation tool. In addition, analyzing the investigated building aspects shows that, to the best of the authors’ knowledge, in a large part of the research works, only some of the important building performance criteria have been investigated, and others have been neglected. Since there is a trade-off among different performance criteria in a building, not considering this interaction will lead to obtaining unfavorable results from some viewpoints. It can be said that for having a favorable condition, different building aspects should be considered at the same time, and not considering one will lead to an unfavorable condition from other perspectives.

1.2. The Stages at Which the Evaluation Was Done in the Literature

Reviewing the literature demonstrates that the evaluation of the building performance has been done at different stages during a building’s lifespan, including the early design stage and retrofitting stage.
In the early design stage, building parameters that are not possible to change later have been analyzed. The results help the architects to choose the appropriate building variables in the design process.
Within this framework, Feng et al. [11] implemented a parametric design method to improve the environmental performance of buildings in the early design phase. Moreover, Al-Saggaf et al. [18] developed a system to analyze the impact of architectural design features on energy consumption. The proposed system was implemented in three different building design alternatives in a hot climate, and their impact on cooling energy demand was assessed.
Window parameters, as a group of early design features that have a great impact on improving building performance, have been widely considered in the previously conducted studies. For instance, Ashrafian and Moazzen [12] studied the impact of WWR and orientation on energy demand and occupants’ comfort. Moreover, Misiopecki et al. [4] investigated different window-to-wall connections to find the most energy-efficient position. Azmy and Ashmawy [5] also considered WWR, window position, and orientation as different variables to optimize energy consumption.
Inappropriate conditions in an existing building caused by inefficient design strategies can be changed in the retrofitting stage. Despite the huge amount of cost and effort it takes, it can sometimes be beneficial in low-performance buildings. As a few examples, Ascionea et al. [19], Jafari and Valentin [6], Hart et al. [13], and Selen Solmaz et al. [7] addressed the building retrofitting phase in their works.
Reviewing the investigations according to the stages at which they have been carried out reveals that most of the studies have proposed steps to be taken in the early design stage, and a few of them have suggested solutions for retrofitting plans. However, to the best of the authors’ knowledge, a framework for selecting the best building among several alternatives has not been proposed. Presenting such a method in the selection stage can help a customer choose the best building to buy among all the existing ones.
Moreover, in the conducted studies, the analysis has usually been done by considering a constant number for the façades on which windows are installed. This means that the impact of changing the number and combination of building façades on the building performance criteria and objective functions is still missing in the literature.

1.3. The Novelty of the Current Work

Despite being valuable, the literature reveals three gaps, as discussed in the final paragraph of Section 1.1 and two last paragraphs of Section 1.2. As a result, the current study aims to cover the gaps by considering the following items as novelties:
  • This paper provides a comparative method to find the best building considering the interaction between the top four most used building aspects, including energy consumption, environmental impact, and thermal and visual comfort. The best building is selected based on a systematic decision-making method called the technique for order preference by similarity to the ideal solution, also known as TOPSIS.
  • The framework is presented for the selection stage, in which instead of one, a number of buildings are evaluated, and the best of them is introduced as the winning alternative for a customer.
  • A number of buildings with the same characteristics, such as floor area and wall construction, but different orientations, numbers, and combinations of façades have been taken into account as the alternatives. The best one is then found in a comprehensive comparative analysis. In this way, the foremost window allocation strategy for a building is found.
Expressed in question format, this study aims to find answers for the following questions as some gaps and areas of concern in the literature:
  • If a customer is going to buy a new building among a set of alternatives with the same architectural plans but different window allocation strategies, which building will provide the most benefits to them? Is having the highest number of façades, which is usually thought to be the best condition, really the optimal condition in terms of different building aspects?
  • Is the optimal orientation the same for different buildings with the same architectural plans and located in the same climatic region, but with different window allocation strategies? Or does the optimal orientation vary as the number and combination of façades changes in buildings?
The following structure is chosen for this paper. After this part, i.e., the Introduction, the employed methodology is presented in Section 2. Then, the details of the case study and results are given in Section 3 and Section 4, respectively. Finally, the conclusions are proposed in Section 5.

2. Methodology

The methodology employed in this study will be described in this section. Initially, the working principle of the proposed method is given in Section 2.1. Then, the details about the EnergyPlus and decision-making method are given in Section 2.2 and Section 2.3 respectively. As an important point, it should be noted that in this study, a commercially developed software is used. In such a condition, and especially for well-known software programs such as those employed in this study, as a widely accepted assumption, it has been considered that the results of the simulation have been validated by the software developers, and for that reason, no further validation is done.

2.1. Working Principle Description

The research presents a comparative method, which is carried out in the selection stage of buildings. The selection stage refers to a phase in which the building alternatives are already designed and ready to be occupied. The method aims to select the winning alternative among all the existing building choices based on their overall performance. In order to observe the interaction between different aspects that define a building’s performance, the four most important building aspects, including energy consumption, environmental impact, thermal comfort, and visual comfort, are taken into account in this study. These different aspects are assessed by some quantitative indicators and analyzed with the aid of the EnergyPlus building simulation tool. The final optimal building with the highest performance is selected using the TOPSIS decision-making method.
As shown in Figure 1, the overall framework of the proposed method consists of the following steps:
  • Some building alternatives are selected among the existing choices. Some factors, including the customer’s preferences and budget, also play a significant role in choosing the appropriate alternatives.
  • Depending on the differences between the considered alternatives, some decision criteria are taken into account.
  • A set of objective functions that contribute to the four building aspects are specified to conduct the comparison based on them.
  • The EnergyPlus building simulation tool is used to evaluate the performance of each alternative based on the considered objectives.
  • The Decision-making method is developed to prioritize the alternatives according to their similarity to the ideal performance.
  • The final winning alternative is presented.
To evaluate the proficiency of the developed method, it is applied to select the final optimal building among 12 residential building alternatives in a small residential town. These buildings have the same architectural plans but different orientations, numbers, and combinations of façades. The mentioned case studies are located in Tehran, which is in the mild climatic region of Iran. It should be underlined that other building functions with some other decision criteria can be also assessed using the presented method in this paper.

2.2. EnergyPlus Simulation Tool

EnergyPlus is a building performance analysis software developed by the U.S. Department of Energy (DOE) [22]. The findings of the review by Mousavi Motlagh et al. [21] indicate that taking advantage of EnergyPlus to simulate building performance has been very popular in the recent studies. Thus, this software is used in this paper to evaluate the performance of building alternatives in terms of different objective functions. Since EnergyPlus is a text-based file format interface, the OpenStudio SketchUp Plug-in is also implemented as a graphical user interface to model the geometry of the buildings.

2.3. Decision-Making Method

Once the values of objective functions are calculated, a decision-making method is performed to find the winning alternative. As the most efficient and popular decision-making method for selecting the final optimal building, TOPSIS is used in this study. This method was first introduced by Hwang and Yoon in 1981 [23]. Based on this approach, the winning alternative is the one that has the shortest distance to the ideal condition and the longest distance to the nonideal condition [24]. In this work, the ideal condition is a situation that minimizes energy consumption and environmental impact while maximizes thermal and visual comfort. In contrast, the nonideal condition is a situation that maximizes energy consumption and environmental impact while minimizing thermal and visual comfort.
Before starting the calculations, due to the different dimensions of objective functions, they should be normalized via Equation (1) [25]:
F i j   = O b j i j i = 1 N u m i   ( O b j i j ) 2
where i and j are the number of alternatives and objective functions, respectively. Moreover, F is the normalized objective function, and Obj is the actual value of the objective function.
In the second step, the parameters d+ and d are calculated for each building alternative using the Equations (2) and (3), respectively [25]. These two parameters correspond to the spatial distance of each alternative from the ideal and nonideal conditions, respectively [26].
d i + = i = 1 N u m O b j   ( F i j F j i d e a l ) 2
d i = i = 1 N u m O b j   ( F i j F j n o n i d e a l ) 2
Finally, the parameter Cl is defined for each alternative using Equation (4) [25]. This parameter is used to rank all the existing choices. The final optimal building is the one with the highest value of Cl.
C l i = d i d i + d i +

3. Case Study

The information about the considered case study is given here. It contains an introduction of the plans and location of the buildings, considered the decision criteria, and definitions of the objective functions. Section 3.1, Section 3.2, Section 3.3 and Section 3.4 provide information about each of the mentioned items, respectively.

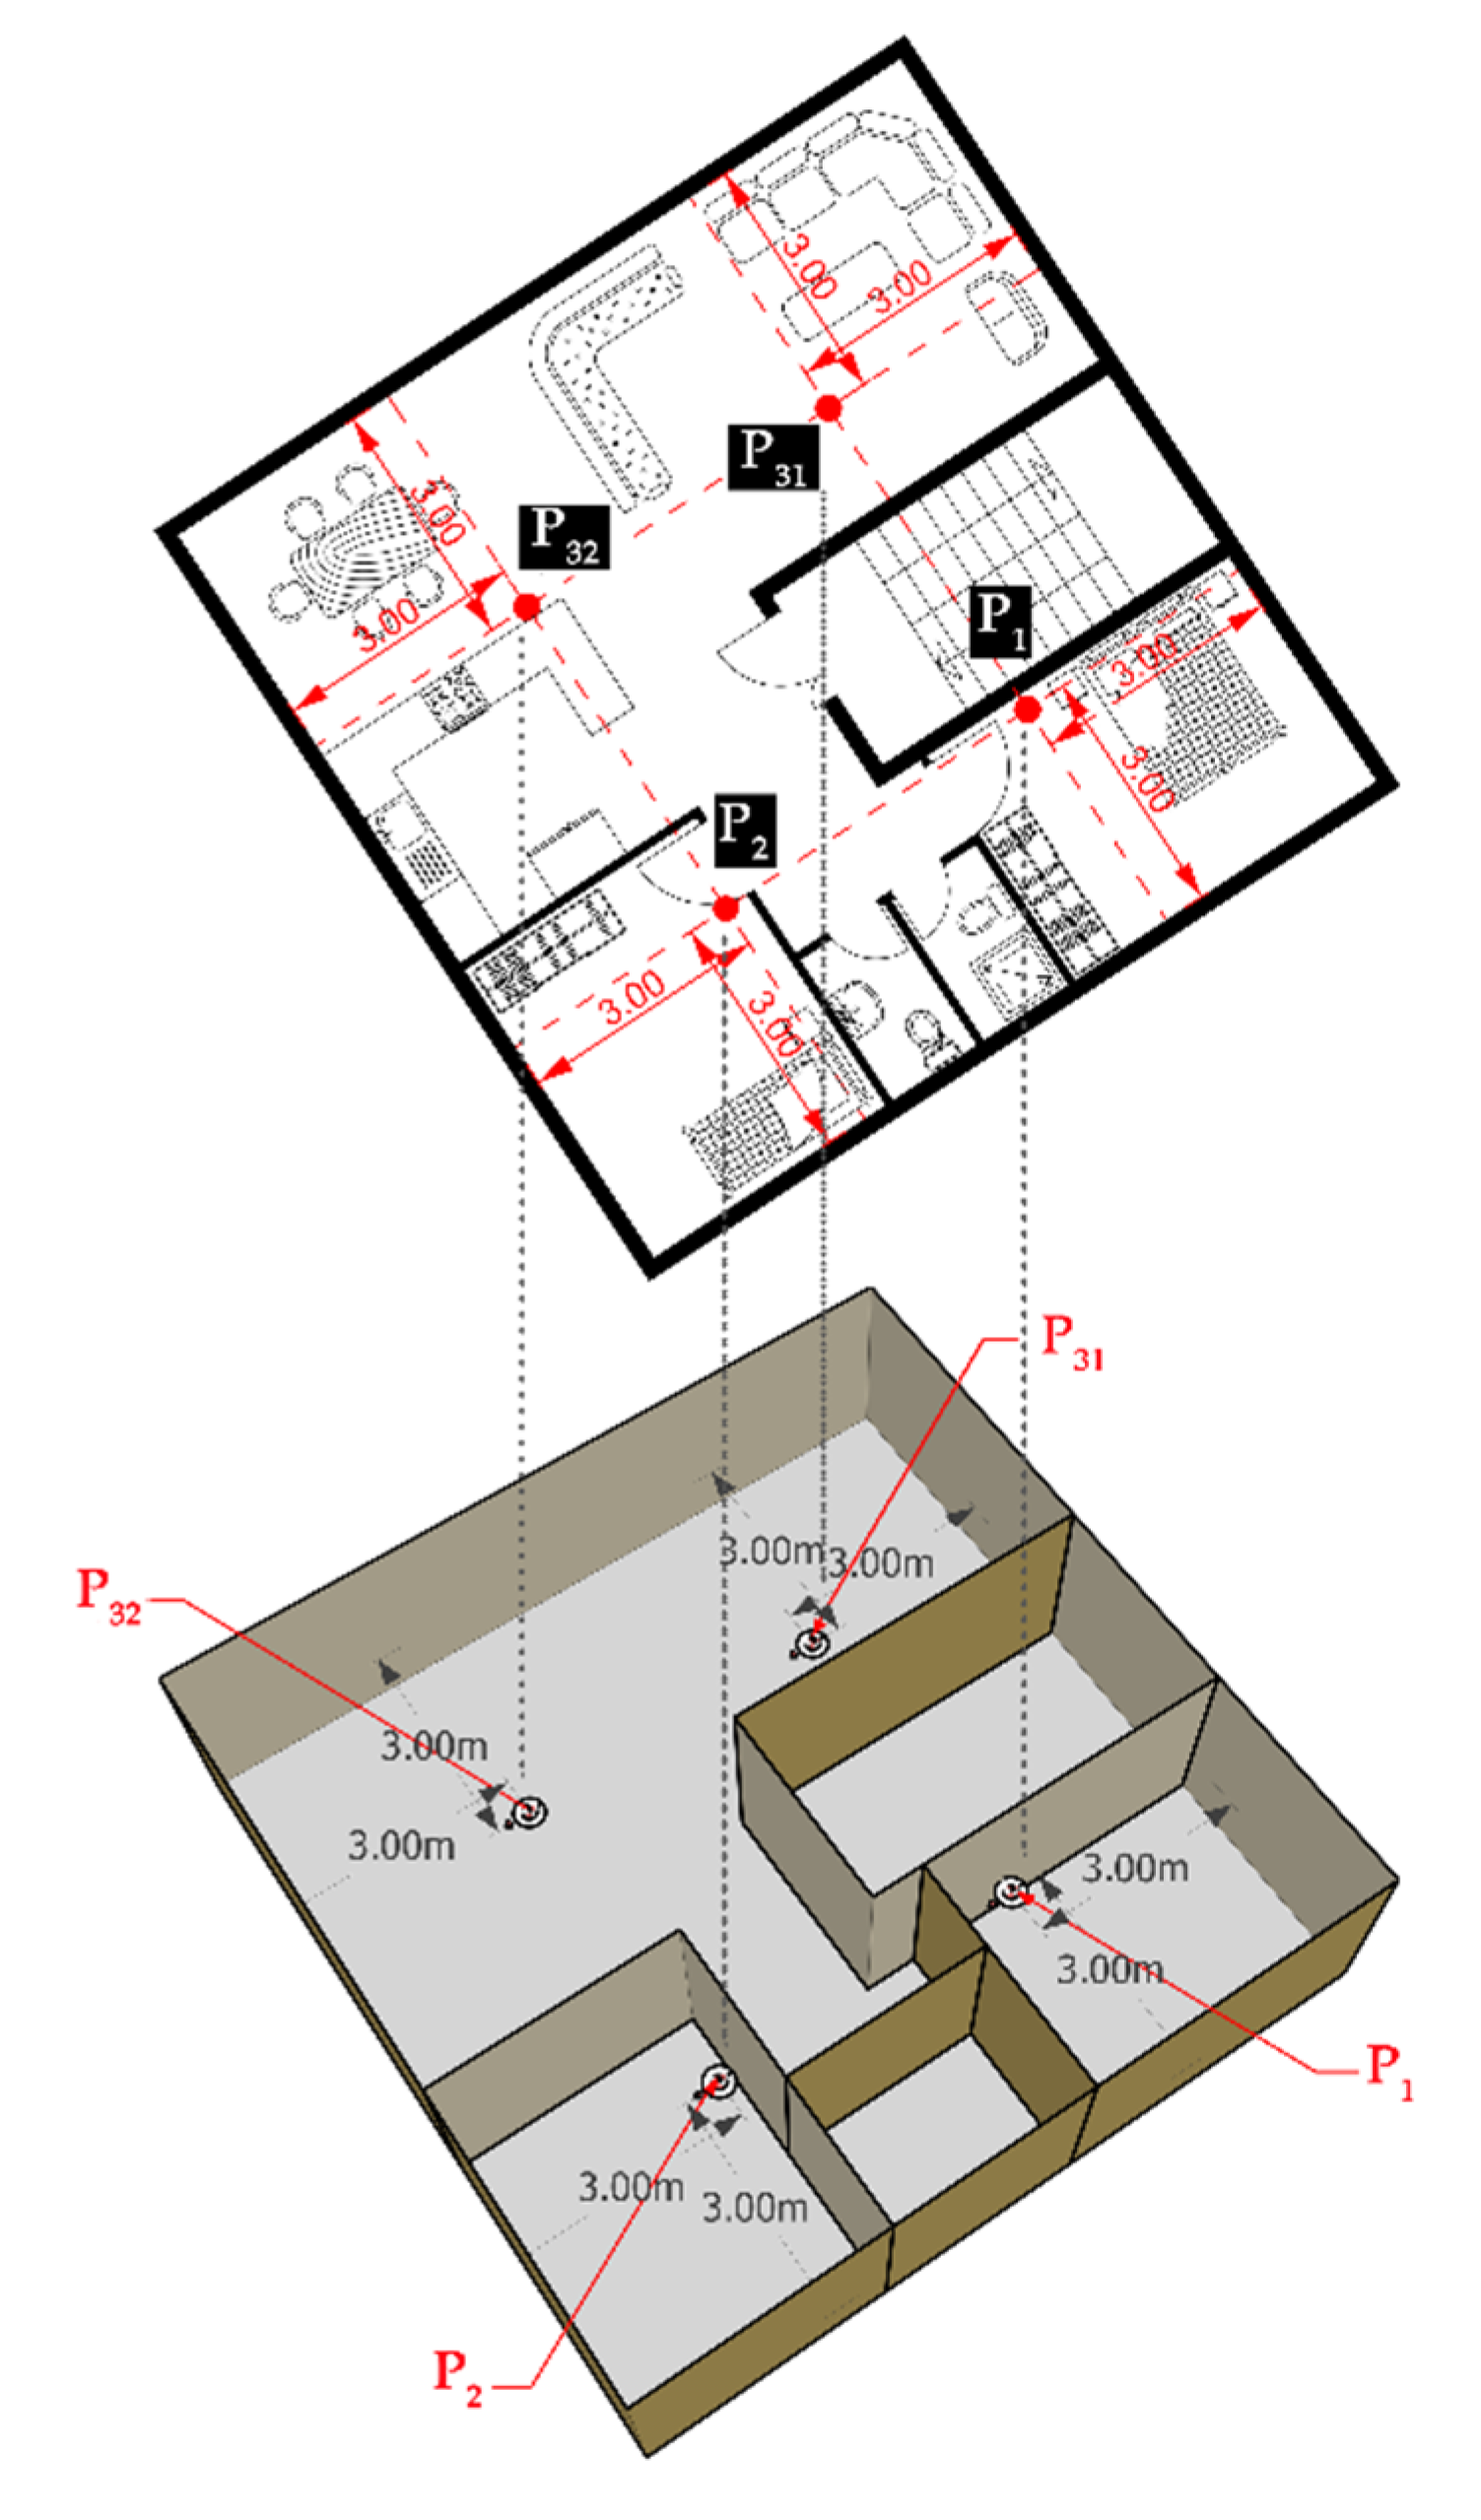
3.1. Description of the Case Study

In this section, the proposed method is applied to select the optimal building among all the existing buildings in a small residential town, which is already designed and ready to be occupied. The town is located in Tehran, Iran. Figure 2 shows different configurations of the urban blocks in this town. All these blocks consist of some three-story buildings with the same architectural plans, which is also demonstrated in Figure 2. Moreover, as shown in Table 2, the total area of spaces with a controlled thermal condition, known as net conditioned area, is the same in all these buildings. Other characteristics of the residential apartments in this town are also reported in Table 2. It should be underlined that the material properties reported in Table 2 are obtained based on the Iranian National Building Regulations [27]. Packaged terminal heat pump (PTHP) air conditioning systems are provided for all these apartments. The COP of the systems for the cooling and heating operations are 3 and 2.75, respectively [28]. Moreover, the set points of the systems are 22 °C for heating and 26 °C for cooling [27]. It is worth mentioning that this study considers a case study with all the obstructions previous works have taken into account.

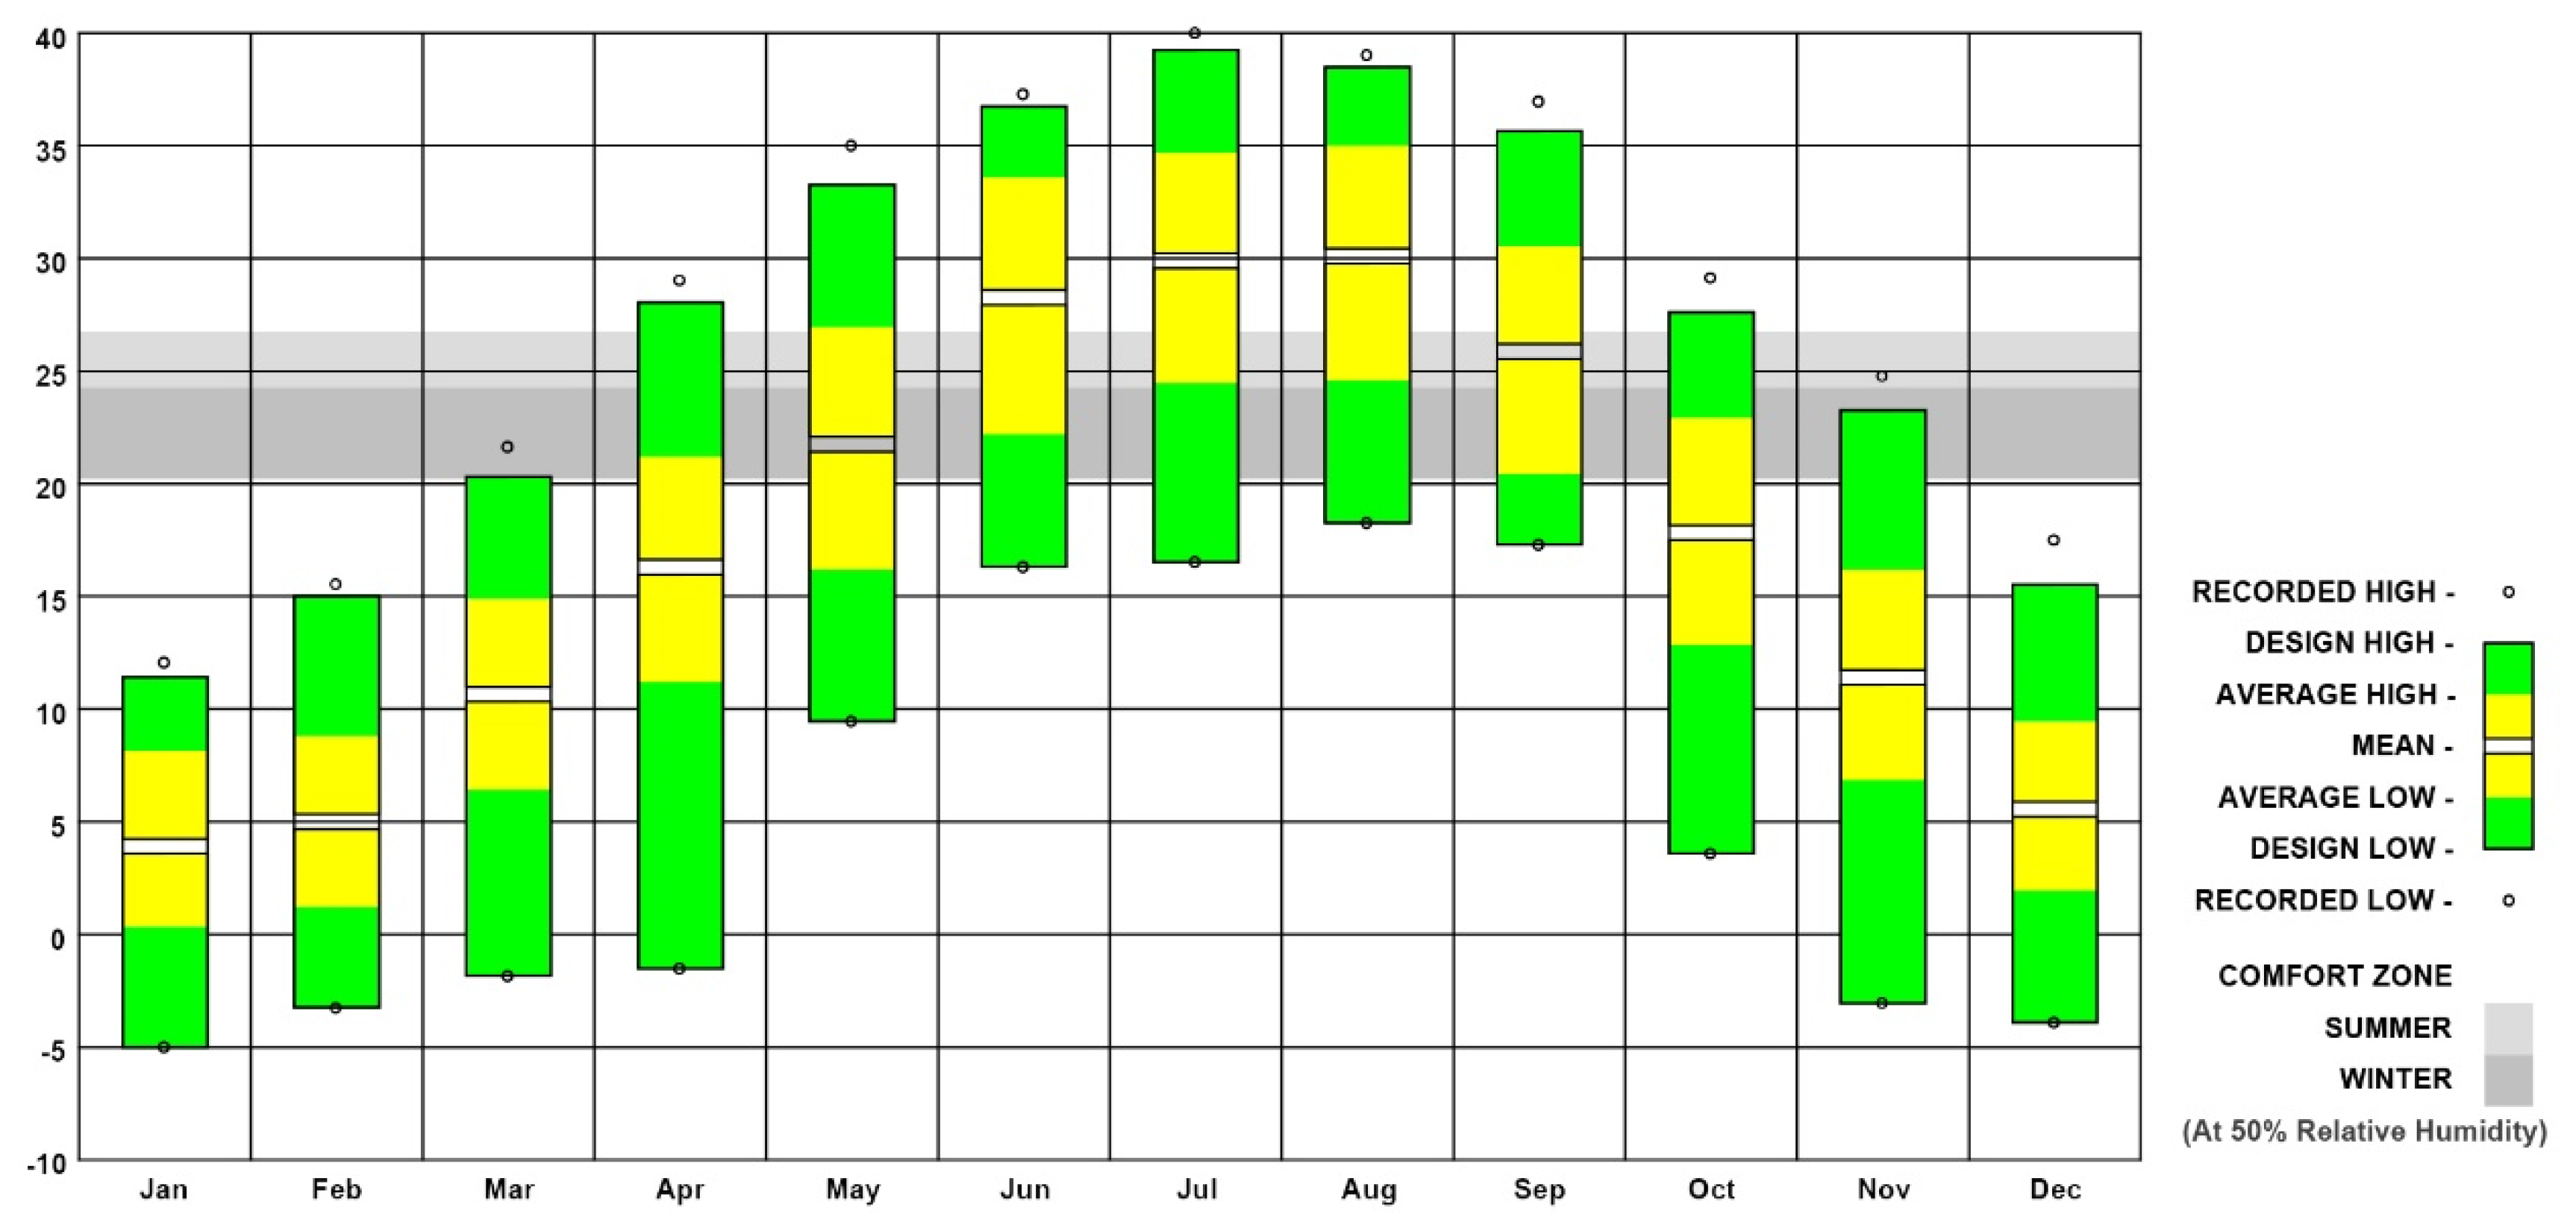
3.2. Location of the Considered Case Study

Tehran is the capital of Iran and is located in the mild climatic region of this country. Due to the increasing demand for residential apartments in this densely populated city, making any improvement to the performance of the residential buildings will avoid a significant proportion of the energy and environmental issues occurring as an impact of the population growth. Given this, a small residential town in Tehran is investigated in this study. The climatic properties of this city are introduced in Table 3. Moreover, the temperature range in different months of the year for Tehran is shown in Figure 3. This chart is obtained using the EnergyPlus weather data for Tehran.

3.3. Decision Criteria

To consider all the possible choices for a customer in the selection phase, 12 different building alternatives located in the second story with the same plans but different orientations, numbers, and combinations of façades are taken into account. The mentioned parameters that distinguish the different alternatives are considered as the decision criteria in this study.
Three variations of number and combination of façades are found in the existing buildings, including two parallel façades, two perpendicular façades, and three façades. The classification of the considered alternatives based on these three variations is shown in Figure 4. Sketchup 3D modeling software (developed by Trimble Inc.) is used to model the buildings. Then, the EnergyPlus building simulation tool is employed to analyze the models in different orientations based on the four objectives explained in Section 3.4.

3.4. Definition of the Considered Objectives

In order to find the winning alternative, the effect of the decision criteria on energy consumption, environmental impact, thermal comfort, and visual performance is taken into account. These four aspects are defined by some indicators considered as the objective functions, which are described in the following.

3.4.1. Energy Consumption

In many studies (e.g., [9,30,31]), the total energy consumption has been considered as an indicator for investigating the energy performance of a building. This indicator is usually composed of cooling, heating, and lighting energy demand and calculated as follows:
T E C = Q c + Q h + Q l
where Qc is the annual cooling energy demand, Qh is the annual heating energy demand, and Ql is the annual lighting load of a building.
In this paper, to present a more comprehensive method, cooling, heating, and lighting energy consumptions are taken into account separately as three independent indicators.

3.4.2. Environmental Impact

Reviewing the literature, it can be recognized that different indicators have been used to assess the environmental impact in a building. For instance, Sohani et al. [32] presented a multi-objective optimization method, and considered annual carbon dioxide emission as one of the objective functions. In another work [33], life cycle emissions have been minimized as an environmental impact metric in addition to economic and thermal comfort indicators. As another considered indicator in the literature (e.g., [34]), carbon dioxide equivalent (CO2-eq) emission is taken into account in this study.
The electricity consumption in a building is consumed as one of the sources for CO2-eq. The produced amount of CO2-eq related to heating, cooling, and lighting energy consumption is obtained as follows [34]:
C O 2 - e q = Q · E F η
where Q is the total annual energy use, EF is the primary greenhouse gas factor, and η is the average annual efficiency of the system.

3.4.3. Thermal Comfort

As the standard of living increases, designing a building that provides occupants comfort becomes more and more important. It can be said that comfort in a building is a condition in which occupants feel satisfied thermally and visually [35]. The considered thermal and visual comfort metrics are described in this section and Section 3.4.4, respectively.
In this paper, the Fanger model is developed to investigate the percentage of people dissatisfied (PPD), which is a metric to assess thermal comfort in a building. To calculate this metric, the predicted mean vote (PMV) should first be calculated using the following equations [36]:
P M V = [ 0.303 × e x p ( 0.036 × M ) + 0.028 ] × { ( M E W ) 3.05 × 10 3 × [ 5733 6.99 × ( M E W ) P a ] 0.42 × [ ( M E W ) 58.15 ] 1.7 × 10 5 × M × ( 5867 P a ) 0.0014 × M × ( 34 T a i r ) 3.96 × 10 8 × f c l × [ ( T c l + 273 ) 4 ( T r + 273 ) 4 ] f c l × h c × ( T c l T a i r )
where
T c l = 33.7 0.028 × ( M E W ) 0.155 × I c l × { 3.96 × 10 8 × f c ; × [ ( T c l + 273 ) 4 ( T r + 273 ) 4 ] + f c l × h c l × ( T c l T a i r ) }
h c = { 2.38 × | T c l T a i r | 0.25           f o r           2.38 × | T c l T a i r | 0.25 > 12.1 × V r e l         12.1 × V r e l                     f o r                             2.38 × | T c l T a i r | 0.25 < 12.1 × V r e l          
f c l = { 1.00 + 1.290 × I c l           f o r         I c l 0.078                 m 2 · K · W 1         1.05 + 0.645 × I c l           f o r         I c l > 0.078                 m 2 · K · W 1        
In Equations (7) to (10), the parameters fcl, Icl, Tcl, Tr, and M are the area of clothing surface factor, clothing insulation, clothing surface temperature, mean radiant temperature, and the metabolic rate, respectively. Moreover, Vrel, hc, Tair, and Pa refer to the relative air velocity, convective heat transfer coefficient, air temperature, and the partial pressure of water vapor, respectively. External work is introduced by EW, which is also another parameter in Equations (7) to (10), and is related to the system.
Finally, PPD can be obtained from Equation (11) [36].
P P D = 100 [ 95 exp ( 0.03353 P M V 4 0.2179 P M V 2 ) ]
To compare different building alternatives, the annual average PPD (AAPPD) and the monthly average PPD (MAPPD) of the three conditioned zones, shown in Figure 5, are used and calculated as follows [30]:
A A P P D = 1 n i = 1 n t = 1 12 P P D i ,   t
M A P P D = 1 n i = 1 n j = 1 m P P D i ,   j
where PPDi,t is the PPD of the conditioned zone i in the tth month of a year, and n is the total number of the conditioned zones. In addition, PPDi,j is the PPD of the conditioned zone i in the tth day of a month, and m is the total number of days in a month.

3.4.4. Visual Comfort

Visual performance as another aspect that demonstrates occupants’ comfort is considered in this study. To evaluate this aspect, the level of daylight illuminance in the four control points shown in Figure 6 is analyzed. These points are placed 0.8 m above the floor with a distance of 3 m from the external walls. The goal of this paper is to minimize the ratio of hours in a year that the level of daylight illuminance falls out of the comfort range. This metric is introduced as UDIDiscomfort in the study done by Carlucci et al. [37] and is calculated as follows:
U D I D i s c o m f o r t = U D I U n d e r l i t + U D I O v e r l i t
U D I = i = 1 8760 v i 8760
{ U D I U n d e r l i t           w i t h               v i   = { 1 .                     E D a y l i g h t < E L o w e r   l i m i t 0 .                     E D a y l i g h t E L o w e r   l i m i t U D I O v e r l i t           w i t h               v i   = { 1 .                   E D a y l i g h t > E U p p e r   l i m i t 0 .                   E D a y l i g h t E U p p e r   l i m i t
To describe the overall visual performance of the buildings with a single factor, the average value of UDIDiscomfort of P1, P2, P31, and P32 is calculated using Equation (17).
A U D I D i s c o m f o r t = 1 m i = 1 m U D I D i s c o m f o r t

4. Results

In this section, the results of the proposed comparative method, which contributes to the selection phase, is presented based on the following structure. First, different orientations of the three building types, including, type A, type B, and type C, are analyzed based on the considered objective functions, and the optimal orientation of each group is selected by the TOPSIS decision-making method. Then, the final winning alternative is chosen among the selected optimal orientations of the three mentioned groups.

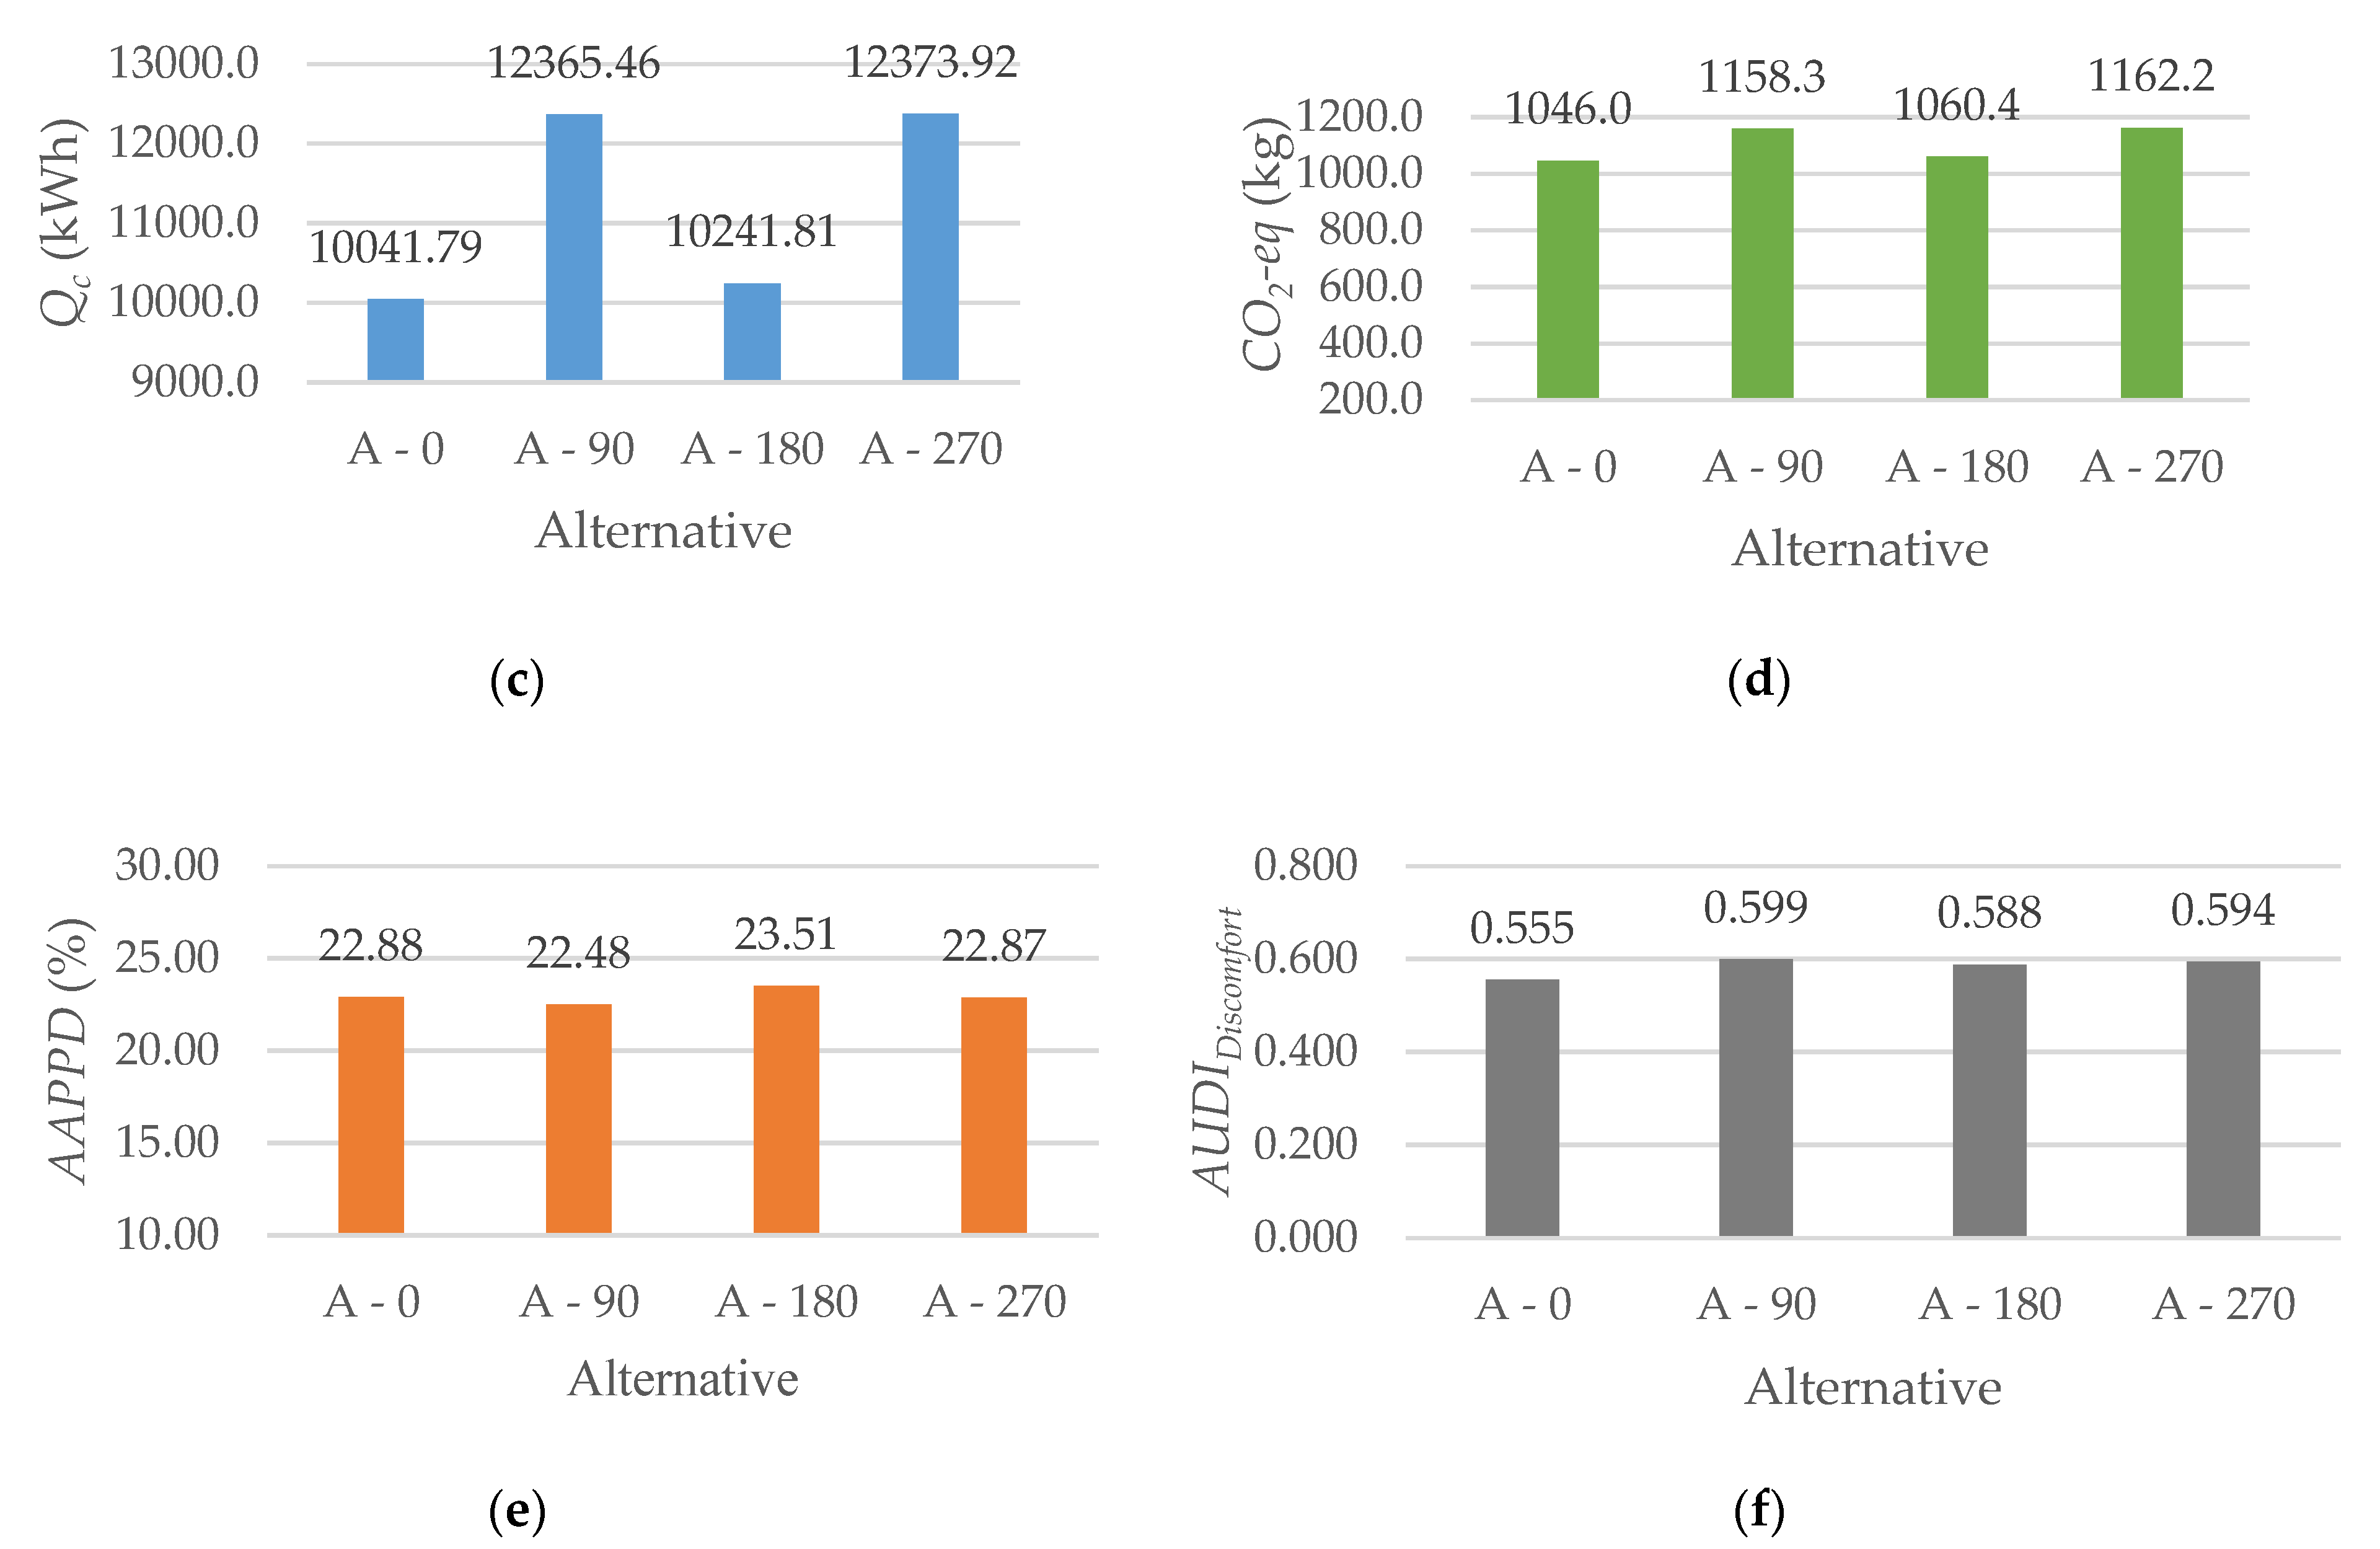
4.1. Optimal Orientation of the Buildings Type A

The annual performance of the building alternatives with two parallel façades, classified as building type A, in four different orientations is analyzed in this part. The analysis is done based on the six considered objective functions. The findings demonstrated in Figure 7 indicate that there is not a single building in this group with minimum values of all the objective functions. For instance, A-0 with the lowest annual cooling energy demand is also one of the highest energy consumers for heating. This happens due to the high heat loss from the large net area of the northern façade of A-0. To better understand the interaction between these two objectives, in A-90 the annual heating energy consumption is the lowest, while its cooling energy demand is about 23% higher than the lowest value, which is a considerable amount. Reviewing the results, it is clear that the heating energy demand is linked to the heat loss from the north rather than the heat gain from the south, meaning that the lower the heat loss from the north, the less energy is consumed for heating. In contrast, the cooling energy consumption is lower when the heat loss from the north is higher.
Since the values of annual lighting energy demand and AUDIDiscomfort change very slightly from one direction to another, it can be said that they are not notably affected by the building orientation. Moreover, the results reveal that there is less visual discomfort in A-0 and A-180 with southern and northern façades compared to A-90 and A-270 with east–west orientations. On the contrary, the lighting energy consumption increases in the south–north orientations in comparison with those of east–west.
The greater amount of AAPPD in A-0 and A-180 compared to A-90 and A-270 is a result of the discomfort caused by the high solar radiation from the southern windows in summer. This can be due to the lack of a designed overhang for the southern windows of A-0 and A-180, which causes overheating in the summer. It should be mentioned that the difference between the least and the greatest values of AAPPD in the four orientations is only about 1%.
Given that the electricity consumption is the main source of CO2-eq, its values in different alternatives are in line with the amount of the total energy demand. This means that A-0, A-180, A-90, and A-270 arranged from the lowest CO2-eq to the highest value also vary in the same order for total energy consumption.
Based on the results of the TOPSIS decision-making method reported in Table 4, A-0 is found to be the optimal alternative in this group of buildings. It is considered to have the highest performance with the minimum values of cooling energy demand, CO2-eq, and AUDIDiscomfort, and its values of AAPPD and lighting and heating energy consumption are relatively close to the ideal situation.

4.2. Optimal Orientation of the Buildings Type B

The annual values of the considered objectives for building type B in different orientations are reported in Figure 8. As shown in this figure, B-0 and B-270 with south-facing glazing on one side consume less energy for heating than the two other cases. This happens because of the higher solar radiation and heat gain in the south. Accordingly, A-270 with the greatest area of southern glazing is recognized to demand the least heating energy. It should be underlined that the high solar radiation in the buildings from the southern windows is considered disadvantageous in terms of AAPPD. Given this, AAPPD is increased in B-0 and B-270 compared to B-90 and B-180.
Moreover, the overheating in B-0 and B-270 and the heat loss from the northern façade in B-90 and B-180 result in a huge difference in the cooling energy demand of these cases. The lowest and the highest values of this objective are seen in B-180 and B-0, respectively.
Since CO2-eq is a function of the total energy consumption, its annual value is the highest in B-0 due to its greatest amount of total energy demand, and it is about 18% higher than the minimum value in B-180.
Analyzing the results of AUDIDiscomfort and lighting energy demand reveal that in B-0 and B-90 with a western façade in both, the values of these objective functions are less than B-180 and B-270, which both have an eastern façade.
As shown in Table 5, the results of the TOPSIS decision-making method point out that B-180 is introduced as the optimal orientation. Despite a slight difference in its AUDIDiscomfort and lighting and heating energy consumption with the lowest values, it has the best performance in terms of CO2-eq, AAPPD, and cooling energy demand.

4.3. Optimal Orientation of the Buildings Type C

Buildings categorized as type C are the ones with three façades such that their configuration is a combination of type A and B. Here, four alternatives of this group are analyzed. Figure 9 shows that in buildings type C, as in types A and B, the greatest range of variation in the values of the considered objective functions is contributed to the cooling energy demand. The maximum annual cooling energy in C-270 is due to its highest heat gain from the south and zero heat loss from the north. In contrast, the least annual cooling energy demand in C-90 is a result of the highest heat loss from the north and zero heat gain from the south. Moreover, the value of CO2-eq is also affected by this huge range of variation in cooling energy; thus, its minimum and maximum amounts are reached in C-90 and C-270, respectively.
The findings also indicate that C-90 provides more thermal and visual comfort compared to other cases, which means that the lowest values of AAPPD and AUDIDiscomfort are achieved in this case. In terms of lighting and heating energy consumption, the minimum value is reached in C-270.
Considering the conflicting relationship between the investigated objective functions, C-90 is selected as the optimal orientation by the TOPSIS decision-making method, as demonstrated in Table 6. Even though the heating and lighting energy demand in C-90 are a little higher than the least values, respectively, it has the minimum amounts of cooling energy consumption, CO2-eq, AAPPD, and AUDIDiscomfort.

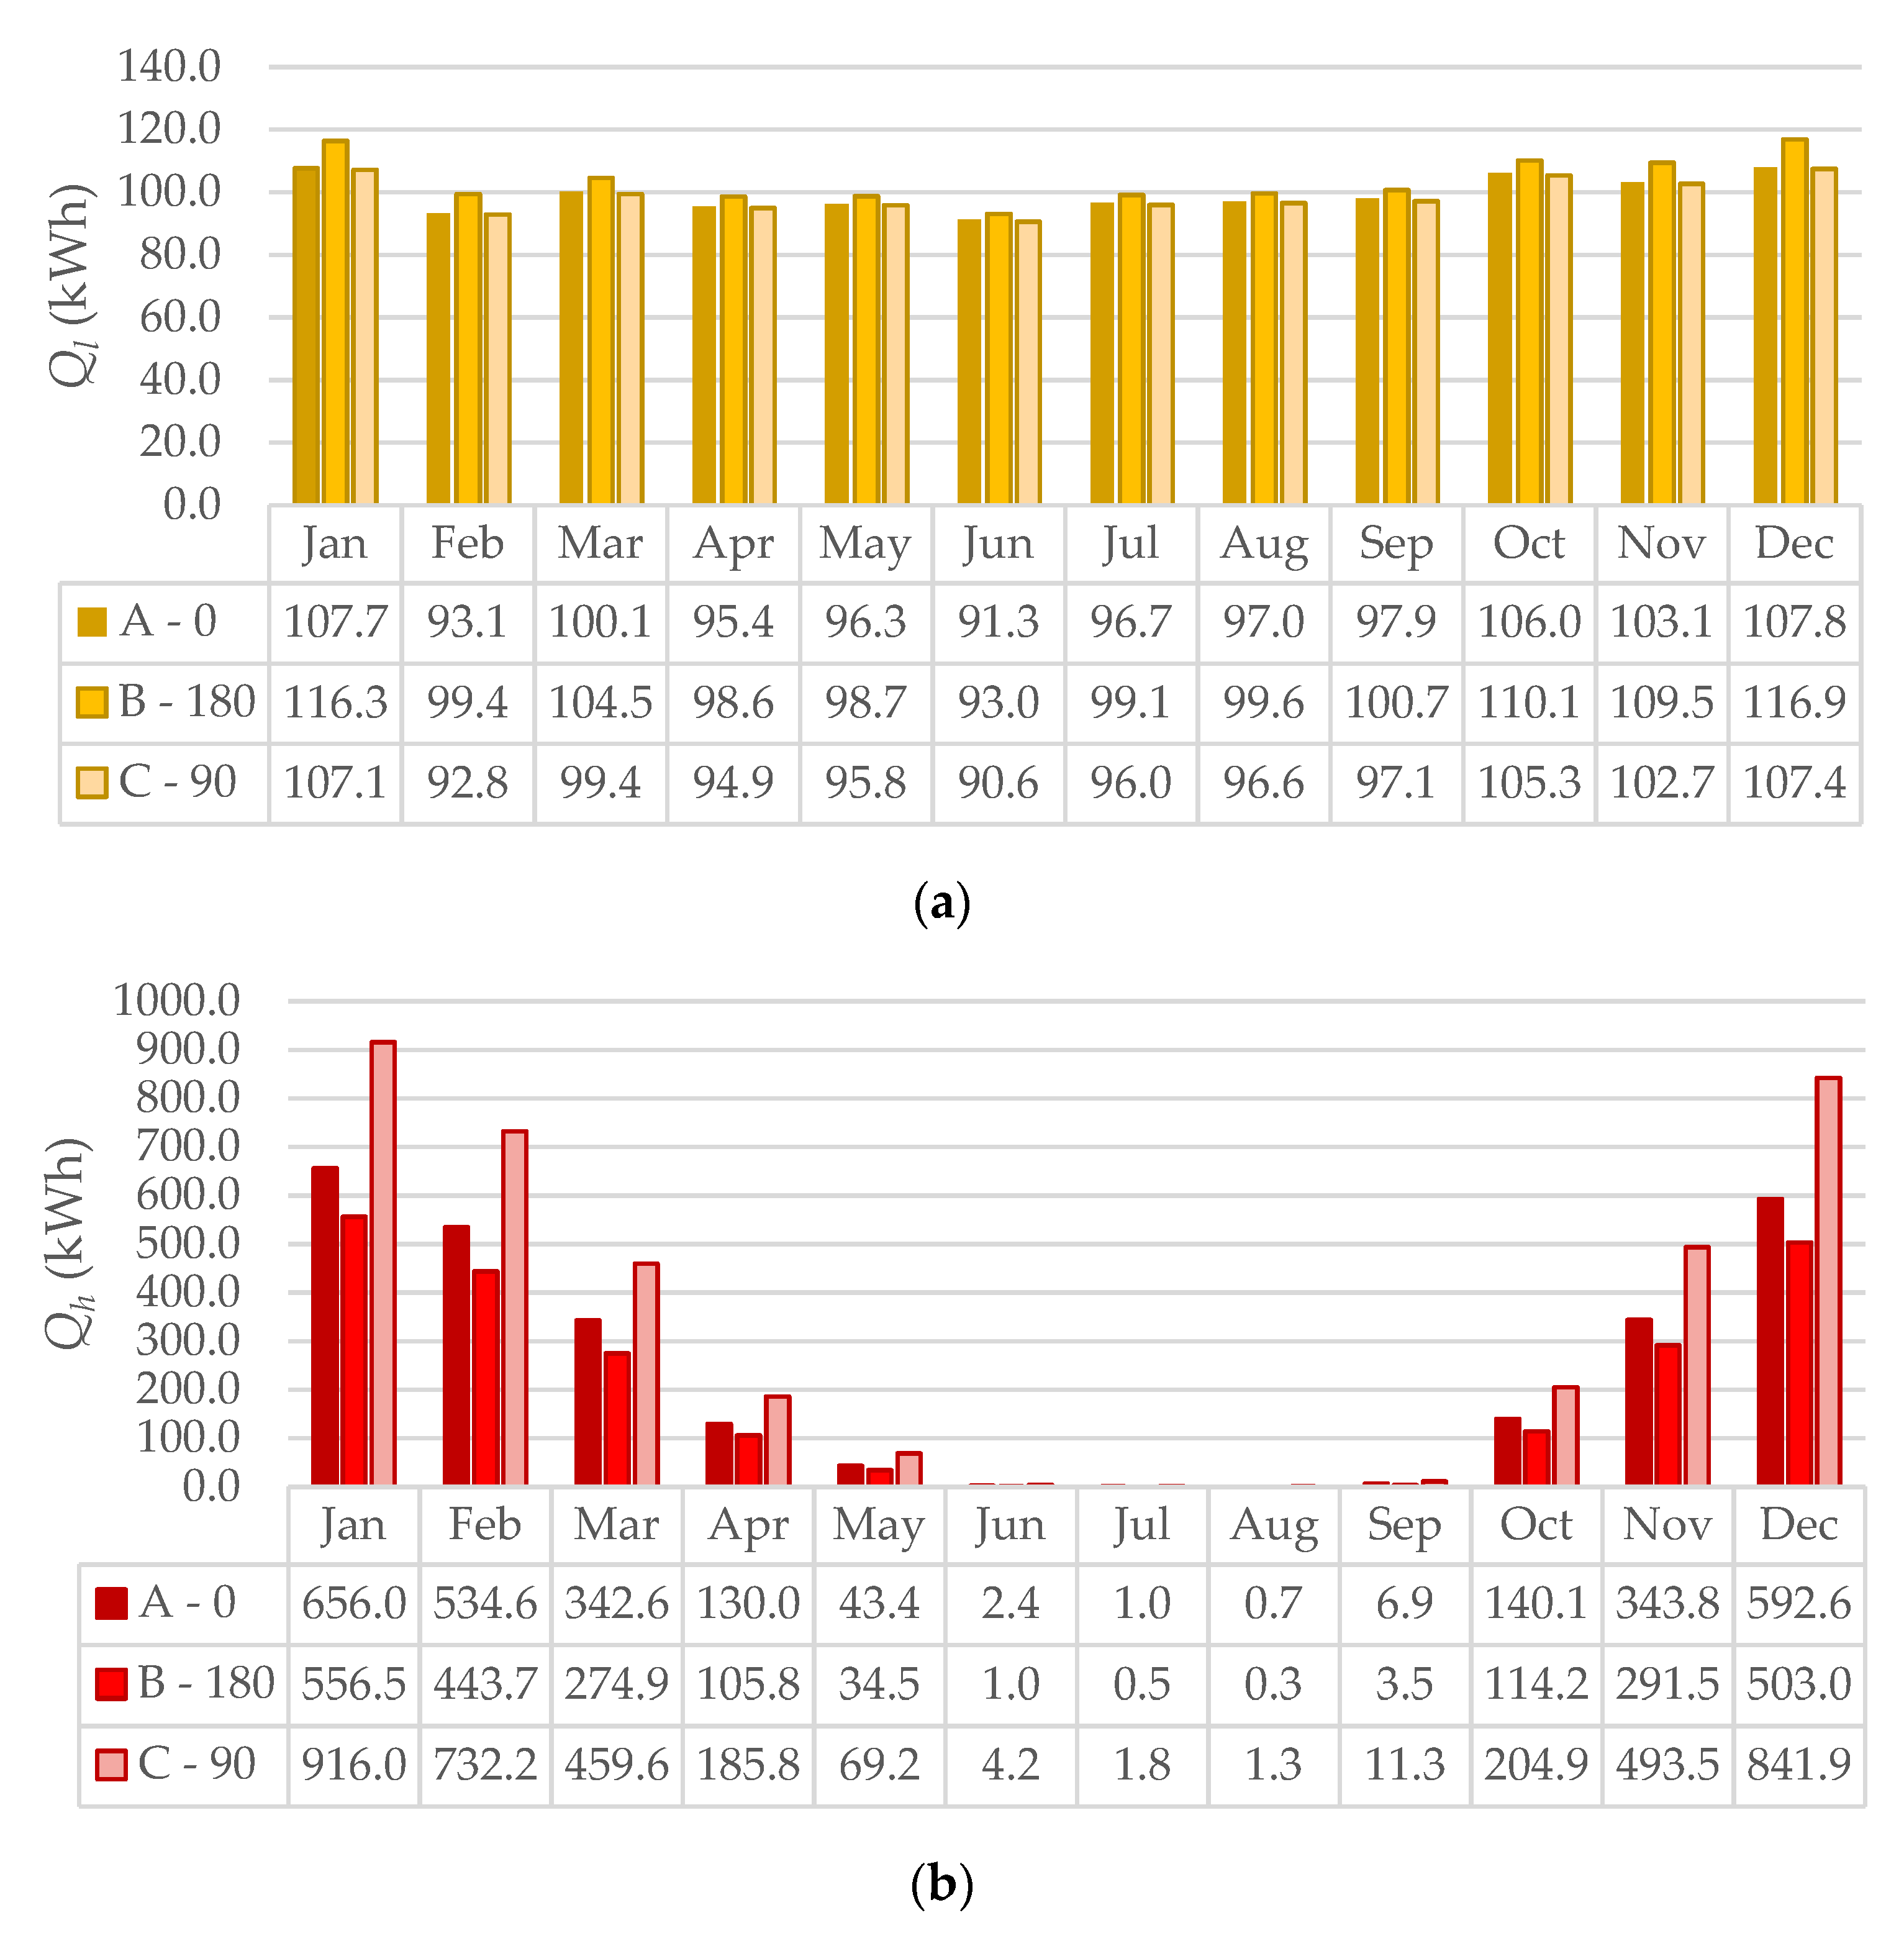
4.4. The Winning Alternative

The monthly profiles of A-0, B-180, and C-90 as the optimal orientations of each building type are compared in Figure 10. According to the results presented in Figure 10, increasing the number of façades (larger area of external walls), as in C-90, is only favorable to the values of lighting energy consumption, which is due to the increased daylight availability. Moreover, in terms of visual discomfort, the values of AUDIDiscomfort in C-90 are the lowest only at the end of autumn and the beginning of winter. In the rest of the year, because of the great range of variations in the monthly amount of AUDIDiscomfort in A-0, the lowest values are seen in this case.
Due to the large area of external walls and windows in C-90, it is more affected by the weather conditions. Subsequently, the range of variations in the monthly cooling energy consumption, in this case, is very large. As a result, the values of this objective are the maximum in C-90 in the hot months; however, in November, December, January, and February, its values, in this case, are close to the minimum amounts. For the same reason, the worst condition in terms of thermal comfort also happens in C-90 in all months of the year except for August and September. In the mentioned months, the values of MAPPD in A-0 exceed the values in C-90 because of the overheating in the south.
Since the increase in the heating energy demand is in a linear relationship with the buildings’ heat loss from the external walls and windows, its monthly maximum and minimum values are reported in C-90 and B-180, respectively. Moreover, the minimum values of CO2-eq are also obtained in B-180 during the whole year except for summer. In summer, the lowest values of this objective function are seen in A-0, which is affected by its lowest cooling energy consumption in this season. It should be underlined that the increase in the values of CO2-eq in both summer and winter is due to the peak energy usage for cooling and heating energy demand in these two seasons, respectively. Furthermore, since the values of lighting energy consumption in different alternatives vary in a small range, it is not considered as an effective factor in the values of CO2-eq.
Finally, based on the results of the TOPSIS decision-making method shown in Table 7, first, second, and third place go to B-180, A-0, and C-90, respectively, and B-180 with two perpendicular façades facing north and east is selected as the winning alternative among all the existing buildings. Even though B-180 is not the optimal alternative in terms of lighting energy consumption and visual discomfort, the highest performance is achieved in this case considering the trade-off between all the objective functions. As it was argued, it has the lowest values of heating energy demand during the whole year. The cooling energy consumption and CO2-eq in B-180 are a bit higher than the lowest values in May, June, July, and August only. Moreover, the minimum values of MAPPD are observed in this case in all seasons except for spring. Overall, comparing the annual results in Figure 7, Figure 8 and Figure 9, there is a significant decrease of about 40%, 37%, 28%, and 10% in the values of Qh, Qc, CO2-eq, and AAPPD for B-180 compared to the highest values observed in C-90, respectively. However, its annual values of Ql and AUDIDiscomfort are only about 7% and 14% higher than the lowest values obtained in C-90 and A-0, respectively.

5. Conclusions

The results revealed some very important conclusions. First of all, the best orientation is not necessarily the same for all the buildings located in a specific climatic region. Many parameters can affect the selection of the optimal orientation, including the number and combination of façades in a building. As the results show, A-0, B-180, and C-90 were selected as the best orientations of A, B, and C building types, respectively. Moreover, as another remarkable outcome, it is found that, despite what a customer usually selects, when all the important building aspects are involved, the best window allocation strategy is not having windows on the greatest number of façades, i.e., a member of C plans. Even though this strategy enjoys a lower lighting energy demand, other criteria are not put in a good position. Based on the TOPSIS decision-making method results and the in-depth conducted analysis, which included a monthly comparison of the performance indicators, B-180 was the winning alternative among the best of each type. In B-180, the annual values of Qh, Qc, CO2-eq, and AAPPD were about 40%, 37%, 28%, and 10% lower than the highest values observed in C-90, respectively, while Ql and AUDIDiscomfort were about 7% and 14% higher than the lowest value achieved in C-90 and A-0, respectively. This highlighted that to select the most appropriate building for a customer, the trade-off between all the important performance criteria should be taken into account simultaneously.
Ranking existing buildings in the selection stage by implementing the proposed framework can create a competitive environment among architects to apply the optimization methods presented in the literature in the early design stages. Furthermore, the proposed method can be also used by architects in the predesign phase to compare different design strategies and select the best one.
A software program could be designed and developed based on the method, the development of which could be followed up on in future works. In this software, the plans of alternatives and the climatic conditions could be given, and the rank of alternatives in addition to the values of important performance criteria could be provided as the output. Moreover, employing the presented method in this paper to other building functions, such as offices and schools that are not occupied during the whole day, can be taken into account in future investigations. The results of such studies can create a new perspective for selecting the optimal buildings for the mentioned functions. As another suggestion for future works, the optimal direction for different plans could be selected, and the best direction of various plans with different window setups could be evaluated.

Author Contributions

Conceptualization: S.F.M.M., A.S. Formal analysis: S.F.M.M. Investigation: S.F.M.M., Methodology: S.F.M.M., A.S. Software: S.F.M.M., Supervision: A.S., M.D.S., H.S., B.N. Validation: S.F.M.M., Visualization: S.F.M.M., Writing-original draft: S.F.M.M., Writing-review and editing: A.S., B.N. All authors have read and agreed to the published version of the manuscript.

Funding

This research received no external funding.

Institutional Review Board Statement

Not applicable.

Informed Consent Statement

Not applicable.

Data Availability Statement

Not applicable.

Acknowledgments

Not applicable.

Conflicts of Interest

The authors declare no conflict of interest.

Nomenclature

d+ithe ith answer in Pareto optimal front distance from the ideal point
dithe ith answer in Pareto optimal front distance from the nonideal point
Fnormalized objective functions
Objobjective functions
Numnumber
Clidecision making parameter in TOPSIS method for the ith answer in Pareto optimal front
Qccooling energy demand (kWh)
Qhheating energy demand (kWh)
Qllighting energy demand (kWh)
Qtotal annual energy use (kWh)
EFprimary greenhouse gas emission factor (kgCO2·(kWh)−1)
ηaverage annual efficiency of the system
fclarea of clothing surface factor
Iclclothing insulation (W·m−2·K1)1
Tclclothing surface temperature (K)
Trmean radiant temperature (K)
Mmetabolic rate
Vrelrelative air velocity (m·s1)
hcconvective heat transfer coefficient (W·m2·K1)
Tairair temperature (K)
Pathe partial pressure of water vapor (Pa)

Abbreviations

TOPSIStechnique for order preference by similarity to the ideal solution
DOEdepartment of energy
PTHPpackaged terminal heat pump
COPcoefficient of performance
WWRwindow-to-wall ratio
TECtotal energy consumption
CO2-eqcarbon dioxide equivalent
PMVpredicted mean vote
PPDpercentage of people dissatisfied
EWexternal work
AAPPDannual average PPD
MAPPDmonthly average PPD
UDIuseful daylight illuminance
AUDIaverage UDI
Scripts
ccooling
hheating
llighting
airair
clclothing
relrelative
Discomfortdiscomfort
Underlitunderlit
Upperlitupperlit
Daylightdaylight
Lower limitlower limit
Upper limitupper limit
Superscripts
Idealideal
Nonidealnonideal

References

  1. Delgarm, N.; Sajadi, B.; Delgarm, S. Multi-objective optimization of building energy performance and indoor thermal comfort: A new method using artificial bee colony (ABC). Energy Build. 2016, 131, 42–53. [Google Scholar] [CrossRef]
  2. Manigandan, S.; Gunasekar, P.; Devipriya, J.; Saravanan, W. Reduction of greenhouse gases by the effect of window position and its size in isolated building. J. Chem. Pharm. Sci. 2016, 9, 3304–3307. [Google Scholar]
  3. Manigandan, S.; Gunasekar, P.; Devipriya, J.; Anderson, A.; Nithya, S. Energy-saving potential by changing window position and size in an isolated building. Int. J. Ambient Energy 2018, 39, 462–466. [Google Scholar] [CrossRef]
  4. Misiopecki, C.; Bouquin, M.; Gustavsen, A.; Jelle, B.P. Thermal modeling and investigation of the most energy-efficient window position. Energy Build. 2018, 158, 1079–1086. [Google Scholar] [CrossRef]
  5. Azmy, N.Y.; Ashmawy, R.E. Effect of the window position in the building envelope on energy consumption. Int. J. Eng. Technol 2018, 7, 1861. [Google Scholar] [CrossRef]
  6. Jafari, A.; Valentin, V. Selection of optimization objectives for decision-making in building energy retrofits. Build. Environ. 2018, 130, 94–103. [Google Scholar] [CrossRef]
  7. Senel Solmaz, A.; Halicioglu, F.H.; Gunhan, S. An approach for making optimal decisions in building energy efficiency retrofit projects. Indoor Built Environ. 2018, 27, 348–368. [Google Scholar] [CrossRef]
  8. Xue, P.; Li, Q.; Xie, J.; Zhao, M.; Liu, J. Optimization of window-to-wall ratio with sunshades in China low latitude region considering daylighting and energy saving requirements. Appl. Energy 2019, 233, 62–70. [Google Scholar] [CrossRef]
  9. Zhai, Y.; Wang, Y.; Huang, Y.; Meng, X. A multi-objective optimization methodology for window design considering energy consumption, thermal environment and visual performance. Renew. Energy 2019, 134, 1190–1199. [Google Scholar] [CrossRef]
  10. Troup, L.; Phillips, R.; Eckelman, M.J.; Fannon, D. Effect of window-to-wall ratio on measured energy consumption in US office buildings. Energy Build. 2019, 203, 109434. [Google Scholar] [CrossRef]
  11. Feng, K.; Lu, W.; Wang, Y. Assessing environmental performance in early building design stage: An integrated parametric design and machine learning method. Sustain. Cities Soc. 2019, 50, 101596. [Google Scholar] [CrossRef]
  12. Ashrafian, T.; Moazzen, N. The impact of glazing ratio and window configuration on occupants’ comfort and energy demand: The case study of a school building in Eskisehir, Turkey. Sustain. Cities Soc. 2019, 47, 101483. [Google Scholar] [CrossRef]
  13. Hart, R.; Selkowitz, S.; Curcija, C. Thermal performance and potential annual energy impact of retrofit thin-glass triple-pane glazing in US residential buildings. Build. Simul. 2019, 12, 79–86. [Google Scholar] [CrossRef]
  14. Rizal, Y.; Robandi, I.; Yuniarno, E.M. Optimization of daylight factor distribution using standard deviations based on shifting window position. J. Ilm. Kursor 2020, 10. [Google Scholar] [CrossRef]
  15. Kunwar, N.; Bhandari, M. A Comprehensive analysis of energy and daylighting impact of window shading systems and control strategies on commercial buildings in the United States. Energies 2020, 13, 2401. [Google Scholar] [CrossRef]
  16. Elghamry, R.; Hassan, H. Impact of window parameters on the building envelope on the thermal comfort, energy consumption and cost and environment. Int. J. Vent. 2020, 19, 233–259. [Google Scholar] [CrossRef]
  17. Kaasalainen, T.; Mäkinen, A.; Lehtinen, T.; Moisio, M.; Vinha, J. Architectural window design and energy efficiency: Impacts on heating, cooling and lighting needs in Finnish climates. J. Build. Eng. 2020, 27, 100996. [Google Scholar] [CrossRef]
  18. Al-Saggaf, A.; Nasir, H.; Taha, M. Quantitative approach for evaluating the building design features impact on cooling energy consumption in hot climates. Energy Build. 2020, 211, 109802. [Google Scholar] [CrossRef]
  19. Ascione, F.; Bianco, N.; Iovane, T.; Mauro, G.M.; Napolitano, D.F.; Ruggiano, A.; Viscido, L. A real industrial building: Modeling, calibration and Pareto optimization of energy retrofit. J. Build. Eng. 2020, 29, 101186. [Google Scholar] [CrossRef]
  20. Zhao, J.; Du, Y. Multi-objective optimization design for windows and shading configuration considering energy consumption and thermal comfort: A case study for office building in different climatic regions of China. Sol. Energy 2020, 206, 997–1017. [Google Scholar] [CrossRef]
  21. Mousavi Motlagh, S.F.F.M.; Sohani, A.; Djavad Saghafi, M.D.; Sayyaadi, H.; Nastasi, B. The Road to developing economically feasible plans for green, comfortable and energy efficient buildings. Energies 2021, 14, 636. [Google Scholar] [CrossRef]
  22. Crawley, D.B.; Lawrie, L.K.; Pedersen, C.O.; Winkelmann, F.C. Energy plus: Energy simulation program. ASHRAE J. 2000, 42, 49–56. [Google Scholar]
  23. Hwang, C.-L.; Yoon, K. Methods for multiple attribute decision making. In Multiple Attribute Decision Making; Springer: Berlin/Heidelberg, Germany, 1981; pp. 58–191. [Google Scholar]
  24. Assari, A.; Mahesh, T.; Assari, E. Role of public participation in sustainability of historical city: Usage of TOPSIS method. Indian J. Sci. Technol. 2012, 5, 2289–2294. [Google Scholar] [CrossRef]
  25. Sohani, A.; Sayyaadi, H. Design and retrofit optimization of the cellulose evaporative cooling pad systems at diverse climatic conditions. Appl. Therm. Eng. 2017, 123, 1396–1418. [Google Scholar] [CrossRef]
  26. Sohani, A.; Sayyaadi, H.; Hoseinpoori, S. Modeling and multi-objective optimization of an M-cycle cross-flow indirect evaporative cooler using the GMDH type neural network. Int. J. Refrig. 2016, 69, 186–204. [Google Scholar] [CrossRef]
  27. Naderi, E.; Sajadi, B.; Behabadi, M.A.; Naderi, E. Multi-objective simulation-based optimization of controlled blind specifications to reduce energy consumption, and thermal and visual discomfort: Case studies in Iran. Build. Environ. 2020, 169, 106570. [Google Scholar] [CrossRef]
  28. Hasani Balyani, H.; Sohani, A.; Sayyaadi, H.; Karami, R. Acquiring the best cooling strategy based on thermal comfort and 3E analyses for small scale residential buildings at diverse climatic conditions. Int. J. Refrig. 2015, 57, 112–137. [Google Scholar] [CrossRef]
  29. Abbasi, M.H.; Sayyaadi, H.; Tahmasbzadebaie, M. A methodology to obtain the foremost type and optimal size of the prime mover of a CCHP system for a large-scale residential application. Appl. Therm. Eng. 2018, 135, 389–405. [Google Scholar] [CrossRef]
  30. Si, B.; Wang, J.; Yao, X.; Shi, X.; Jin, X.; Zhou, X. Multi-objective optimization design of a complex building based on an artificial neural network and performance evaluation of algorithms. Adv. Eng. Inform. 2019, 40, 93–109. [Google Scholar] [CrossRef]
  31. Li, Z.; Chen, H.; Lin, B.; Zhu, Y. Fast bidirectional building performance optimization at the early design stage. Build. Simul. 2018, 11, 647–661. [Google Scholar] [CrossRef]
  32. Sohani, A.; Sayyaadi, H.; Azimi, M. Employing static and dynamic optimization approaches on a desiccant-enhanced indirect evaporative cooling system. Energy Convers. Manag. 2019, 199, 112017. [Google Scholar] [CrossRef]
  33. Mostavi, E.; Asadi, S.; Boussaa, D. Development of a new methodology to optimize building life cycle cost, environmental impacts, and occupant satisfaction. Energy 2017, 121, 606–615. [Google Scholar] [CrossRef]
  34. Hamdy, M.; Mauro, G.M. Multi-objective optimization of building energy design to reconcile collective and private perspectives: CO2-eq vs. Discounted payback time. Energies 2017, 10, 1016. [Google Scholar] [CrossRef]
  35. Sohani, A.; Sayyaadi, H.; Mohammadhosseini, N. Comparative study of the conventional types of heat and mass exchangers to achieve the best design of dew point evaporative coolers at diverse climatic conditions. Energy Convers. Manag. 2018, 158, 327–345. [Google Scholar] [CrossRef]
  36. Sohani, A.; Sayyaadi, H.; Zeraatpisheh, M. Optimization strategy by a general approach to enhance improving potential of dew-point evaporative coolers. Energy Convers. Manag. 2019, 188, 177–213. [Google Scholar] [CrossRef]
  37. Carlucci, S.; Cattarin, G.; Causone, F.; Pagliano, L. Multi-objective optimization of a nearly zero-energy building based on thermal and visual discomfort minimization using a non-dominated sorting genetic algorithm (NSGA-II). Energy Build. 2015, 104, 378–394. [Google Scholar] [CrossRef] [Green Version]
Figure 1. Schematic workflow of the proposed method.
Energies 14 03962 g001
Figure 2. The considered case study: (a) different configurations of the urban blocks; (b) architectural plan of the buildings.
Energies 14 03962 g002
Figure 3. Temperature range in different months of a year for Tehran.
Energies 14 03962 g003
Figure 4. Classification of the considered alternatives: (a) type (A) with two parallel façades; (b) type (B) with two perpendicular façades; (c) type (C) with three façades.
Energies 14 03962 g004aEnergies 14 03962 g004b
Figure 5. The conditioned zones.
Energies 14 03962 g005
Figure 6. Placement of the control points.
Energies 14 03962 g006
Figure 7. Annual profiles of the considered objective functions for different orientations of the building type A: (a) annual profiles of Ql; (b) annual profiles of Qh; (c) annual profiles of Qc; (d) annual profiles of CO2-eq; (e) annual profiles of AAPPD; (f) annual profiles of AUDIDiscomfort.
Energies 14 03962 g007aEnergies 14 03962 g007b
Figure 8. Annual profiles of the considered objective functions for different orientations of the building type B: (a) annual profiles of Ql; (b) annual profiles of Qh; (c) annual profiles of Qc; (d) annual profiles of CO2-eq; (e) annual profiles of AAPPD; (f) annual profiles of AUDIDiscomfort.
Energies 14 03962 g008
Figure 9. Annual profiles of the considered objective functions for different orientations of the building type C: (a) annual profiles of Ql; (b) annual profiles of Qh; (c) annual profiles of Qc; (d) annual profiles of CO2-eq; (e) annual profiles of AAPPD; (f) annual profiles of AUDIDiscomfort.
Energies 14 03962 g009aEnergies 14 03962 g009b
Figure 10. Monthly results of the objective functions for the optimal orientations of the three different building types, including, types A, B, and C: (a) monthly results of Ql; (b) monthly results of Qh; (c) monthly results of Qc; (d) monthly results of CO2-eq; (e) monthly results of MAPPD; (f) monthly results of AUDIDiscomfort.
Energies 14 03962 g010aEnergies 14 03962 g010bEnergies 14 03962 g010c
Table 1. A list of the recent works which have been carried out in the field of improving building performance.
StudyYear Discussed in Section 1.1.Discussed in Section 1.2.
Employed Software ProgramConsidered Building AspectsThe Stage at Which the Improvements Have Been Applied Considered Window Parameters
Delgarm et al. [1]2016EnergyPlusEnergy consumption
Thermal comfort
Early design stageWindow size and glazing material
Manigandan et al. [2]2016Computational Fluid Dynamics approachNatural ventilationN.A.Orientation and size of windows
Manigandan et al. [3]2017Computational Fluid Dynamics approachNatural ventilationN.A.Orientation and size of windows
Misiopecki et al. [4]2018THERMEnergy consumptionN.A.Window position in the window opening
Azmy and Ashmawy [5]2018EnergyPlusEnergy consumption
Visual comfort
Early design stageWindow position in the building envelope
Jafari and Valentin [6]2018eQuestN.A.Retrofitting stageReplacement of windows
Selen Solmaz et al. [7]2018EnergyPlusEnergy consumption
Economic benefits
Retrofitting stageWindow properties and configuration of shading system
Xue et al. [8]2019EnergyPlus, RadianceEnergy consumption
Visual comfort
Early design stageWindow-to wall ratio (WWR) and sunshade configuration
Zhai et al. [9]2019EnergyPlusEnergy consumption
Thermal comfort
Visual comfort
Early design stageWWR and glazing material
Troup et al. [10]2019N.A.Energy consumptionEarly design stageWWR
Feng et al. [11]2019Autodesk® Dynamo and RevitEnvironmental impactEarly design stageWindow size
Ashrafian and Moazzen [12]2019DIALux Evo, DesignBuilder, and EnergyPlusEnergy consumption
Occupants’ comfort
Early design stageWWR and window configuration
Hart et al. [13]2019EnergyPlusEnergy consumptionRetrofitting stageReplacement of windows
Rizal et al. [14]2020N.A.Visual comfortN.A.Window position
Kunwar and Bhandari [15]2020EnergyPlus, DIVA-for-RhinoEnergy consumption
Visual comfort
N.A.Window shading systems and control strategies
Elghamry and Hassan [16]2020DesignBuilderEnergy consumption
Thermal comfort
Economic benefits
Environmental impact
Early design stageWWR and position on the wall
Kaasalainen et al. [17]2020IDA Indoor Climate and Energy (IDA ICE)Energy consumptionEarly design stageWindow area, proportions, horizontal position, external shading, and glazing properties
Al-Saggaf et al. [18]2020Revit and EcotectEnergy consumptionEarly design stageGlazing area and percentage
Ascione et al. [19]2020EnergyPlusEnergy consumption
Economic benefits
Retrofitting stageReplacement of windows
Zhao and Du [20]2020DesignBuilderEnergy consumption
Thermal comfort
Early design stageConfiguration of windows and shading system
The current work2021EnergyPlusEnergy consumption
Environmental impact
Thermal comfort
Visual comfort
Selection stageNumber and combination of building façades
Table 2. Characteristics of the residential apartments in the investigated town.
ParameterValueUnit
Net conditioned building area86.69m2
Building height2.8m
WWR30 for each zone’s external walls%
External walls’ U-value0.7W/m2K
Internal walls’ U-value2.58W/m2K
Floors/ceilings’ U-value1.45W/m2K
Double-glazed windows’ U-value2.67W/m2K
Table 3. Climatic properties of Tehran (reproduced with permission from Abbasi et al., Applied Thermal Engineering; published by Elsevier, 2018 [29]).
CityClimatic TypeDry Bulb Temperature (°C)Wet Bulb Temperature (°C)Latitude (°N)Elevation (m)
SummerWinterSummer
TehranHot Semidesert37.8−4.419.435.681190.0
Table 4. The TOPSIS results for different orientations of the building type A.
AlternativeNormalized Objective Functions (F)d+dClRank
QlQhQcCO2-eqAAPPDAUDIDiscomfort
A-00.50090.51230.44390.47200.49870.47500.02720.12240.81811
A-900.49900.48660.54660.52270.49000.51260.12060.03420.22113
A-1800.50090.50980.45270.47850.51250.50320.04430.10530.70372
A-2700.49910.49080.54700.52440.49850.50830.12070.02600.17714
Table 5. The TOPSIS results for different orientations of the building type B.
AlternativeNormalized Objective Functions (F)d+dClRank
QlQhQcCO2-eqAAPPDAUDIDiscomfort
B-00.48170.49100.59110.53830.53350.49120.23810.05700.19324
B-900.49520.52420.40580.47200.49650.47510.06190.20620.76922
B-1800.51990.50270.37770.45760.46830.51750.06100.23830.79621
B-2700.50250.48110.58580.52730.49950.51500.22630.05890.20653
Table 6. The TOPSIS results for different orientations of the building type C.
AlternativeNormalized Objective Functions (F)d+dClRank
QlQhQcCO2-eqAAPPDAUDIDiscomfort
C-00.50050.51100.47270.49070.50850.48380.03360.12880.79342
C-900.49950.49730.45520.48310.49050.48120.00710.14930.95461
C-1800.50100.50120.48020.48370.49940.50300.03610.12050.76973
C-2700.49910.49020.58210.54020.50150.53040.14800.02200.12954
Table 7. The TOPSIS results for the optimal orientations of the three different building types, including, types A, B, and C.
AlternativeNormalized Objective Functions (F)d+dClRank
QlQhQcCO2-eqAAPPDAUDIDiscomfort
A-00.55960.52640.53900.53610.56770.51490.16720.35670.68092
B-1800.61410.42080.42750.48110.53110.63990.13770.49480.78241
C-900.55650.73880.72580.69370.62900.57040.49790.09030.15353
Publisher’s Note: MDPI stays neutral with regard to jurisdictional claims in published maps and institutional affiliations.

