
Remote Monitoring and Fault Diagnosis of Ocean Current Energy Hydraulic Transmission and Control Power Generation System


1
School of Mechanical Engineering, Xi’an Jiaotong University, Xi’an 710049, China
2
School of Energy and Power Engineering, Xi’an Jiaotong University, Xi’an 710049, China
*
Author to whom correspondence should be addressed.
Energies 2021, 14(13), 4047; https://0-doi-org.brum.beds.ac.uk/10.3390/en14134047
Submission received: 29 May 2021
/
Revised: 26 June 2021
/
Accepted: 2 July 2021
/
Published: 5 July 2021
Abstract
:The development of clean and environmentally friendly energy is necessary to address significant energy challenges, and abundant sea current energy, which plays a key role in the decarbonization of our energy systems and has attracted increasing attention among researchers. In the present study, a remote monitoring and diagnosis system was designed in accordance with the requirements of a 50 kW hydraulic transmission and control power generation system. Hardware selection and software function requirement analysis were then performed. The causes of system faults were analyzed, the output fault types of the improved model were determined, and effective monitoring parameters were selected. The accuracy of traditional spectra in diagnosing faults is poor; however, the generalization capability of support vector machines (SVM) is robust. Thus, an improved particle swarm algorithm optimized SVM fault diagnosis model for the hydraulic transmission control power generation system was proposed to rapidly and effectively determine the key parameters. Remote monitoring software for the hydraulic transmission and control power generation system was also developed. The results of remote monitoring and diagnostic tests showed that the software was able to satisfy the functional requirements of the hydraulic transmission control power generation remote monitoring system, and the operation effect was consistent with expectations. By comparing the test accuracy of different diagnostic models, the improved PSVM model has the highest test accuracy with a classification accuracy of 99.4% in the case of normal operation, accumulator failure, relief valve failure and motor failure. In addition, the proposed diagnostic method was effective, thereby ensuring safe and reliable operation of the hydraulic transmission control power generation system.
1. Introduction
Ocean current energy generation technology has gained increasing attention from a large number of countries due to its renewable and sustainable characteristics, and is currently experiencing rapid development [1,2,3]. China’s ocean area amounts to 30% of its land area, and ocean current energy can provide significant benefits to economic development by taking advantage of the vast ocean area [4,5].
At present, the main technologies of sea current energy generation include permanent magnet synchronous generation [6], double-fed asynchronous generation [7], and hydraulic transmission and control generation. Among these technologies, permanent magnet synchronous generation and double-fed asynchronous generation are more mature and have been used in practice and hydraulic transmission is characterized by its flexible layout [8]. Hydraulic transmission control power generation is a relatively new field, but has been the subject of a gradual increase in attention and research interest in the field of new energy generation due to the unique advantages of the hydraulic system compared with other transmission systems. Wei Zhang obtained the optimal design scheme and regulation strategy to the hydraulic conversion system [9]. Zengguang Liu et al. employed a double closed-loop control scheme to meet the need for a constant motor speed regardless of the change in load power [10]. Figure 1 shows the power generation principle of a hydraulic transmission control power generation system. The system generates electricity by secondary energy conversion via the path of current energy–mechanical energy–hydraulic energy–mechanical energy–electrical energy. As a result, a synchronous generator outputs a constant frequency of electrical energy. Therefore, the operation state of the system determines the characteristics of the entire power generation system and affects the quality of the final power generation.
A combination of manual and instrumentation fault diagnosis systems is currently used [11]. In particular, the instrumentation detection component is used to collect various signals, such as the pressure and flow of the system, to predict indicators of faults and determine the fault location, for the monitoring and diagnosis of the operation conditions of hydraulic transmission and control power generation systems. Mehdi Hosseinzadeh, etc. presents the performance of a wind power system under two sources of failures in the lubricant system, and a procedure is proposed to detect the failure [12]. Kevin Leahy investigated a new methodology for predicting and classifying turbine faults [13]. Mehdi Hosseinzadeh, etc. provides an overview of islanding fault detection in microgrids in [14]. R. Lily Hu used minimal-redundancy-maximal relevance criterion (mRMR) feature selection to select the most important of features [15]. However, due to the complex working environment of these systems, on-site diagnosis can be required, which increases the risk to personal safety. Manual and instrumental testing and diagnosis are also inefficient.
In addition, monitoring and diagnosis of hydraulic transmission and control power generation systems is conducted online. Cheng Gang Yang elaborated the theory analysis of active online test of hydraulic diagnosis technology [16]. Online monitoring and diagnosis can be used to monitor a system’s operation status in real time by observing the system’s core parameters, such as system pressure, motor speed, and temperature. However, online monitoring and diagnosis can be restricted in laboratories due to the high requirements of the working environment due to leakages in the hydraulic pump station and pipeline, which cause pollution, installation accidents, noise, and other problems. Shen Yin compared the basic data-driven methods for process monitoring and fault diagnosis (PM–FD) [17]. Gaowei Xu introduced a simple but effective online fault diagnosis method to convert measured sensor signals to fault images [18]. Therefore, investigations have been undertaken of remote monitoring and diagnosis technology, which can avoid shortcomings such as the operation noise of the hydraulic pump station, without affecting the operating characteristics of the hydraulic transmission and power generation system.
To date, improvements to traditional fault diagnosis of hydraulic transmission-controlled power generation systems include the use of signal feature extraction and the establishment of fault diagnosis network models to extract the features of the system signals by wavelet processing, empirical modal processing, and information entropy. Traditional fault diagnosis methods are primarily based on mechanism, feature frequency or fault feature extraction [19]. Quan Zhou modified adaptive neuro-fuzzy inference system to establish the fault early warning and diagnosis model [20]. In the case of multiple concurrent faults in hydraulic transmission and control power generation systems, the main diagnostic methods are extreme learning machines and support vector machines (SVMs). Arana-Daniel reviewed proposals to extend the SVM algorithm to deal with complex and hypercomplex-valued inputs, outputs, and kernels [21]. As we know, support vector machine (SVM) and k-Nearest Neighbor (kNN) algorithms can manage the nonlinearity issues. In order to train SVM efficiently, Emre developed a new training algorithm CKSVM (clustering k-NN support vector machines) which has provided efficiency for fast classification via weighted distances for multi-class classification [22]. Narinder Singh and S. B. Singh presented a newly hybrid algorithm HPSOGWO which is the combination of Particle Swarm Optimization (PSO) and Grey Wolf Optimizer (GWO) with the idea to improve the ability of exploitation in PSO with the ability of exploration in GWO to produce both variants’ strength [23]. Nicholas et al. proposed a hybrid PSO/ACO (ant colony optimization) algorithm for the discovery of classification rules [24]. Ahmed et al. presented a hybrid PSO algorithm (HPSOM) that uses the mutation process to improve the standard PSO algorithm [25]. Esmin et al. proposes a new model called Hybrid Particle Swarm Optimizer with Mutation (HPSOM), by integrating the mutation process often used in GA into PSO [26]. Ben Niu et al. presents a new hybrid global optimization parallel algorithm PSODE combining PSO with differential evolution (DE) which is simple, and no extra parameters are introduced [27]. Hydraulic transmission and control power generation systems are easily disturbed by signals such as vibration and noise. Unfavorable noise is accompanied by the pressure pulsations in the flapper-nozzle valve flow field [28]. The noise and vibration of hydraulic pumps usually exhibit high spatial variations [29]. Thus, traditional machine learning can only extract and classify linear features of faults, and numerous factors, such as the external environment, may interfere with the performance of this approach. Deep learning has stronger nonlinear fitting ability, and can autonomously perceive fault features hidden within various disturbing signals. However, the requirement for the computer’s CPU is also higher as deep learning requires a large number of training samples to ensure the accuracy of the model, thereby resulting in a higher cost of system fault diagnosis.
In summary, the complex environment may possibly cause a series of faults in hydraulic transmission and control power generation systems, and increase the difficulty of system maintenance. Effective and stable monitoring and diagnosis should be carried out to maintain the normal operation of the system and ensure the quality of power generation. In addition, the difficulty associated with extracting fault characteristics and possible loss of signals during long-distance information transmission due to the complex environment should be addressed. Remote monitoring and diagnosis of hydraulic transmission and control power generation systems are important to realize real-time monitoring of system operation status, even when not at the site of the equipment. Fault location can be rapidly and effectively determined, and the system can be repaired using the collected real-time signals, in conjunction with the deep learning diagnosis model of the system, when a fault occurs. Michael Short proposed system potentially delivers a flexible and low-cost industrial digitalization platform for condition monitoring and predictive maintenance applications [30]. This ensures safe and reliable operation of the hydraulic transmission and control power generation system, thereby reducing both the required number of on-site maintenance personnel and the system downtime due to maintenance. Therefore, remote monitoring and fault diagnosis methods of hydraulic transmission control power generation systems should be studied. The 50 kW hydraulic power generation remote monitoring and fault diagnosis system devised in this study can be applied not only to other hydraulic system monitoring and diagnosis fields, but also to other new energy generation systems.
2. Overall Design of the Remote Monitoring and Fault Diagnosis System for Hydraulic Transmission Control Power Generation
In this study, the working principles and actual working characteristics of the hydraulic transmission and control power generation system were combined; typical fault analysis of the system was conducted; fault types for diagnosis were determined; the monitoring parameters of the system were selected according to the working characteristics of the system; and the foundation for fault diagnosis of the hydraulic transmission and control power generation system was established. In accordance with the selected monitoring parameters and the output fault type of the diagnostic model, the system’s hardware was designed. In addition, the system’s remote monitoring and diagnostic software was designed in accordance with the actual system requirements.
2.1. Composition of Hydraulic Transmission Control Power Generation System
The hydraulic power generation experimental equipment consisted of the main hydraulic system, oil replenishment subsystem, loading subsystem, and control system. The main hydraulic system consisted of pumps, valve sets, pipes, motors, and corresponding test sensors. Real-time regulation was performed by changing the pump speed and motor displacement, with the motor output speed as the control target. Figure 2 shows the schematic of the hydraulic system.
As shown in Figure 2, the hydraulic pump (1) is driven by an electric motor, and the pressure of the loading system is changed by adjusting the relief valve (16), which in turn changes the load on the motor (5). The system consists of two circuits, which can be switched between different operating modes by adjusting the shut-off valve (4). The oil constantly circulates internally during the operation of the closed hydraulic system. Thus, the hydraulic system is replenished with oil through a replenishment system to ensure there is sufficient oil.
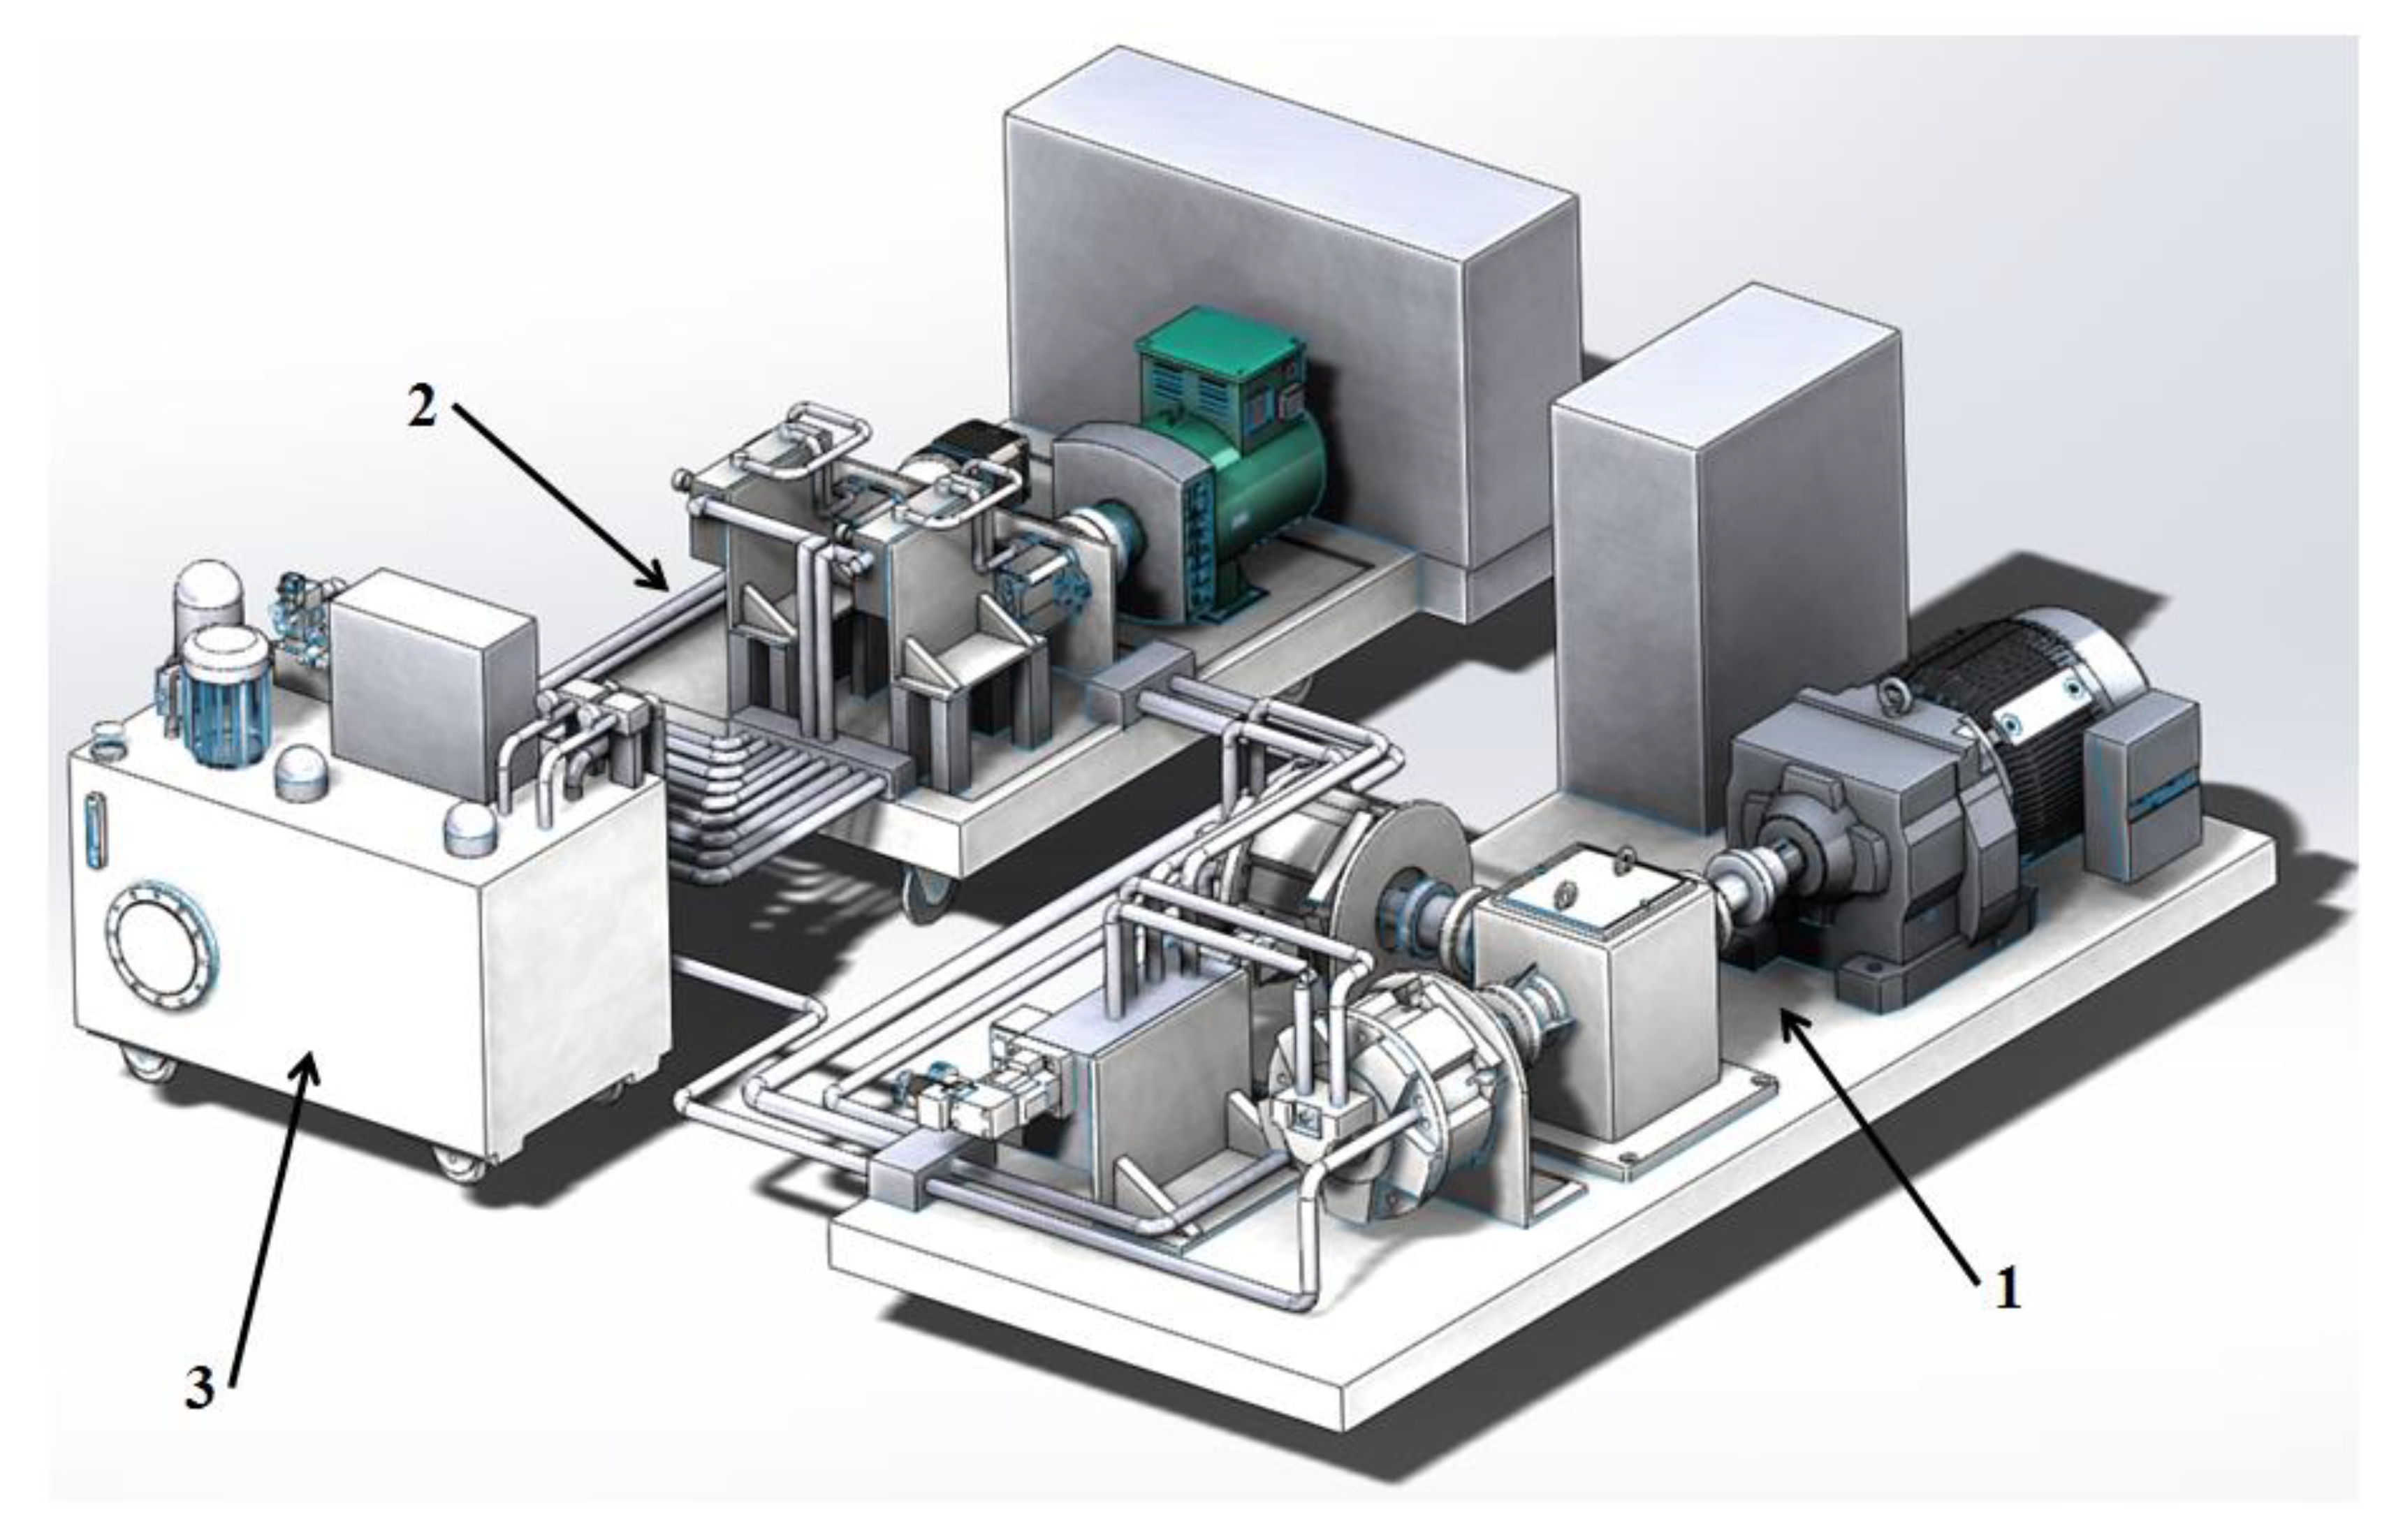
Figure 3 shows the overall structural composition of the hydraulic power generation system. The composition and layout of the entire system is shown more intuitively in Figure 3, where (1) is the pump source, also known as the simulated turbine area. It consists of a control cabinet, inverter motor, reducer, radial piston pump, and corresponding hydraulic valve. The numbers (2) and (3) represent the load simulation area and hydraulic station, respectively, consisting of a hydraulic motor, generator, system control cabinet, hydraulic oil tank, and the corresponding hydraulic valve.
The system is a pump-controlled motor-closed system; the pump working speed is set in the range of 30–60 r/min to simulate the actual sea current energy condition. After calculating that the displacement of the variable motor needs to exceed 16.88 mL/r, we chose a variable motor with a nominal displacement of 25 mL/r and a basic model number 25BCY14-1B. After calculation, the displacement of the quantitative pump selection should exceed 277.72 mL/r, we choose to use the nominal displacement of 300 mL/r, model INM2-300 quantitative pump. We chose a gear pump with a nominal displacement of 6 mL/r, model CBW-F306, as the charge pump. At the same time, in order to protect the dosing pump and set the main circuit pressure of the hydraulic system, the relief valve inlet pressure is set to 21 MPa. Therefore, the main frequency of flow pulsation and pressure pulsation in the system is low, but the pulsation amplitude and pulsation discontinuity are higher in the low-speed operating condition due to the superposition of the plunger cavity suction, discharge oil discontinuity, load impedance, and other factors.
2.2. Remote Monitoring and Diagnosis System Scheme
The constant speed monitoring module monitors the change in turbine speed, causing the speed of the pump to change continuously. In addition, the variable motor displacement is adjusted to enable the generator connected with the motor to maintain a constant frequency of 50 Hz output. The state monitoring module collects the parametric data monitored by the sensors; analyses and processes the data, and makes a final judgment; responds to and adjusts the system on the basis of the judgment result to complete the real-time monitoring; and provides a control and alarm for the entire power generation system. The oil charge monitoring module is mainly responsible for opening the oil charge circuit, setting the loading pressure, and opening the control oil circuit. The fault diagnosis module is mainly responsible for fault diagnosis, the alarm, recording, and enabling inquiries of the hydraulic transmission control power generation system. Figure 4 shows the remote monitoring and diagnosis scheme of the hydraulic transmission and control power generation system.
2.3. Software Design of Remote Monitoring and Diagnosis System for Hydraulic Transmission Control Power Generation
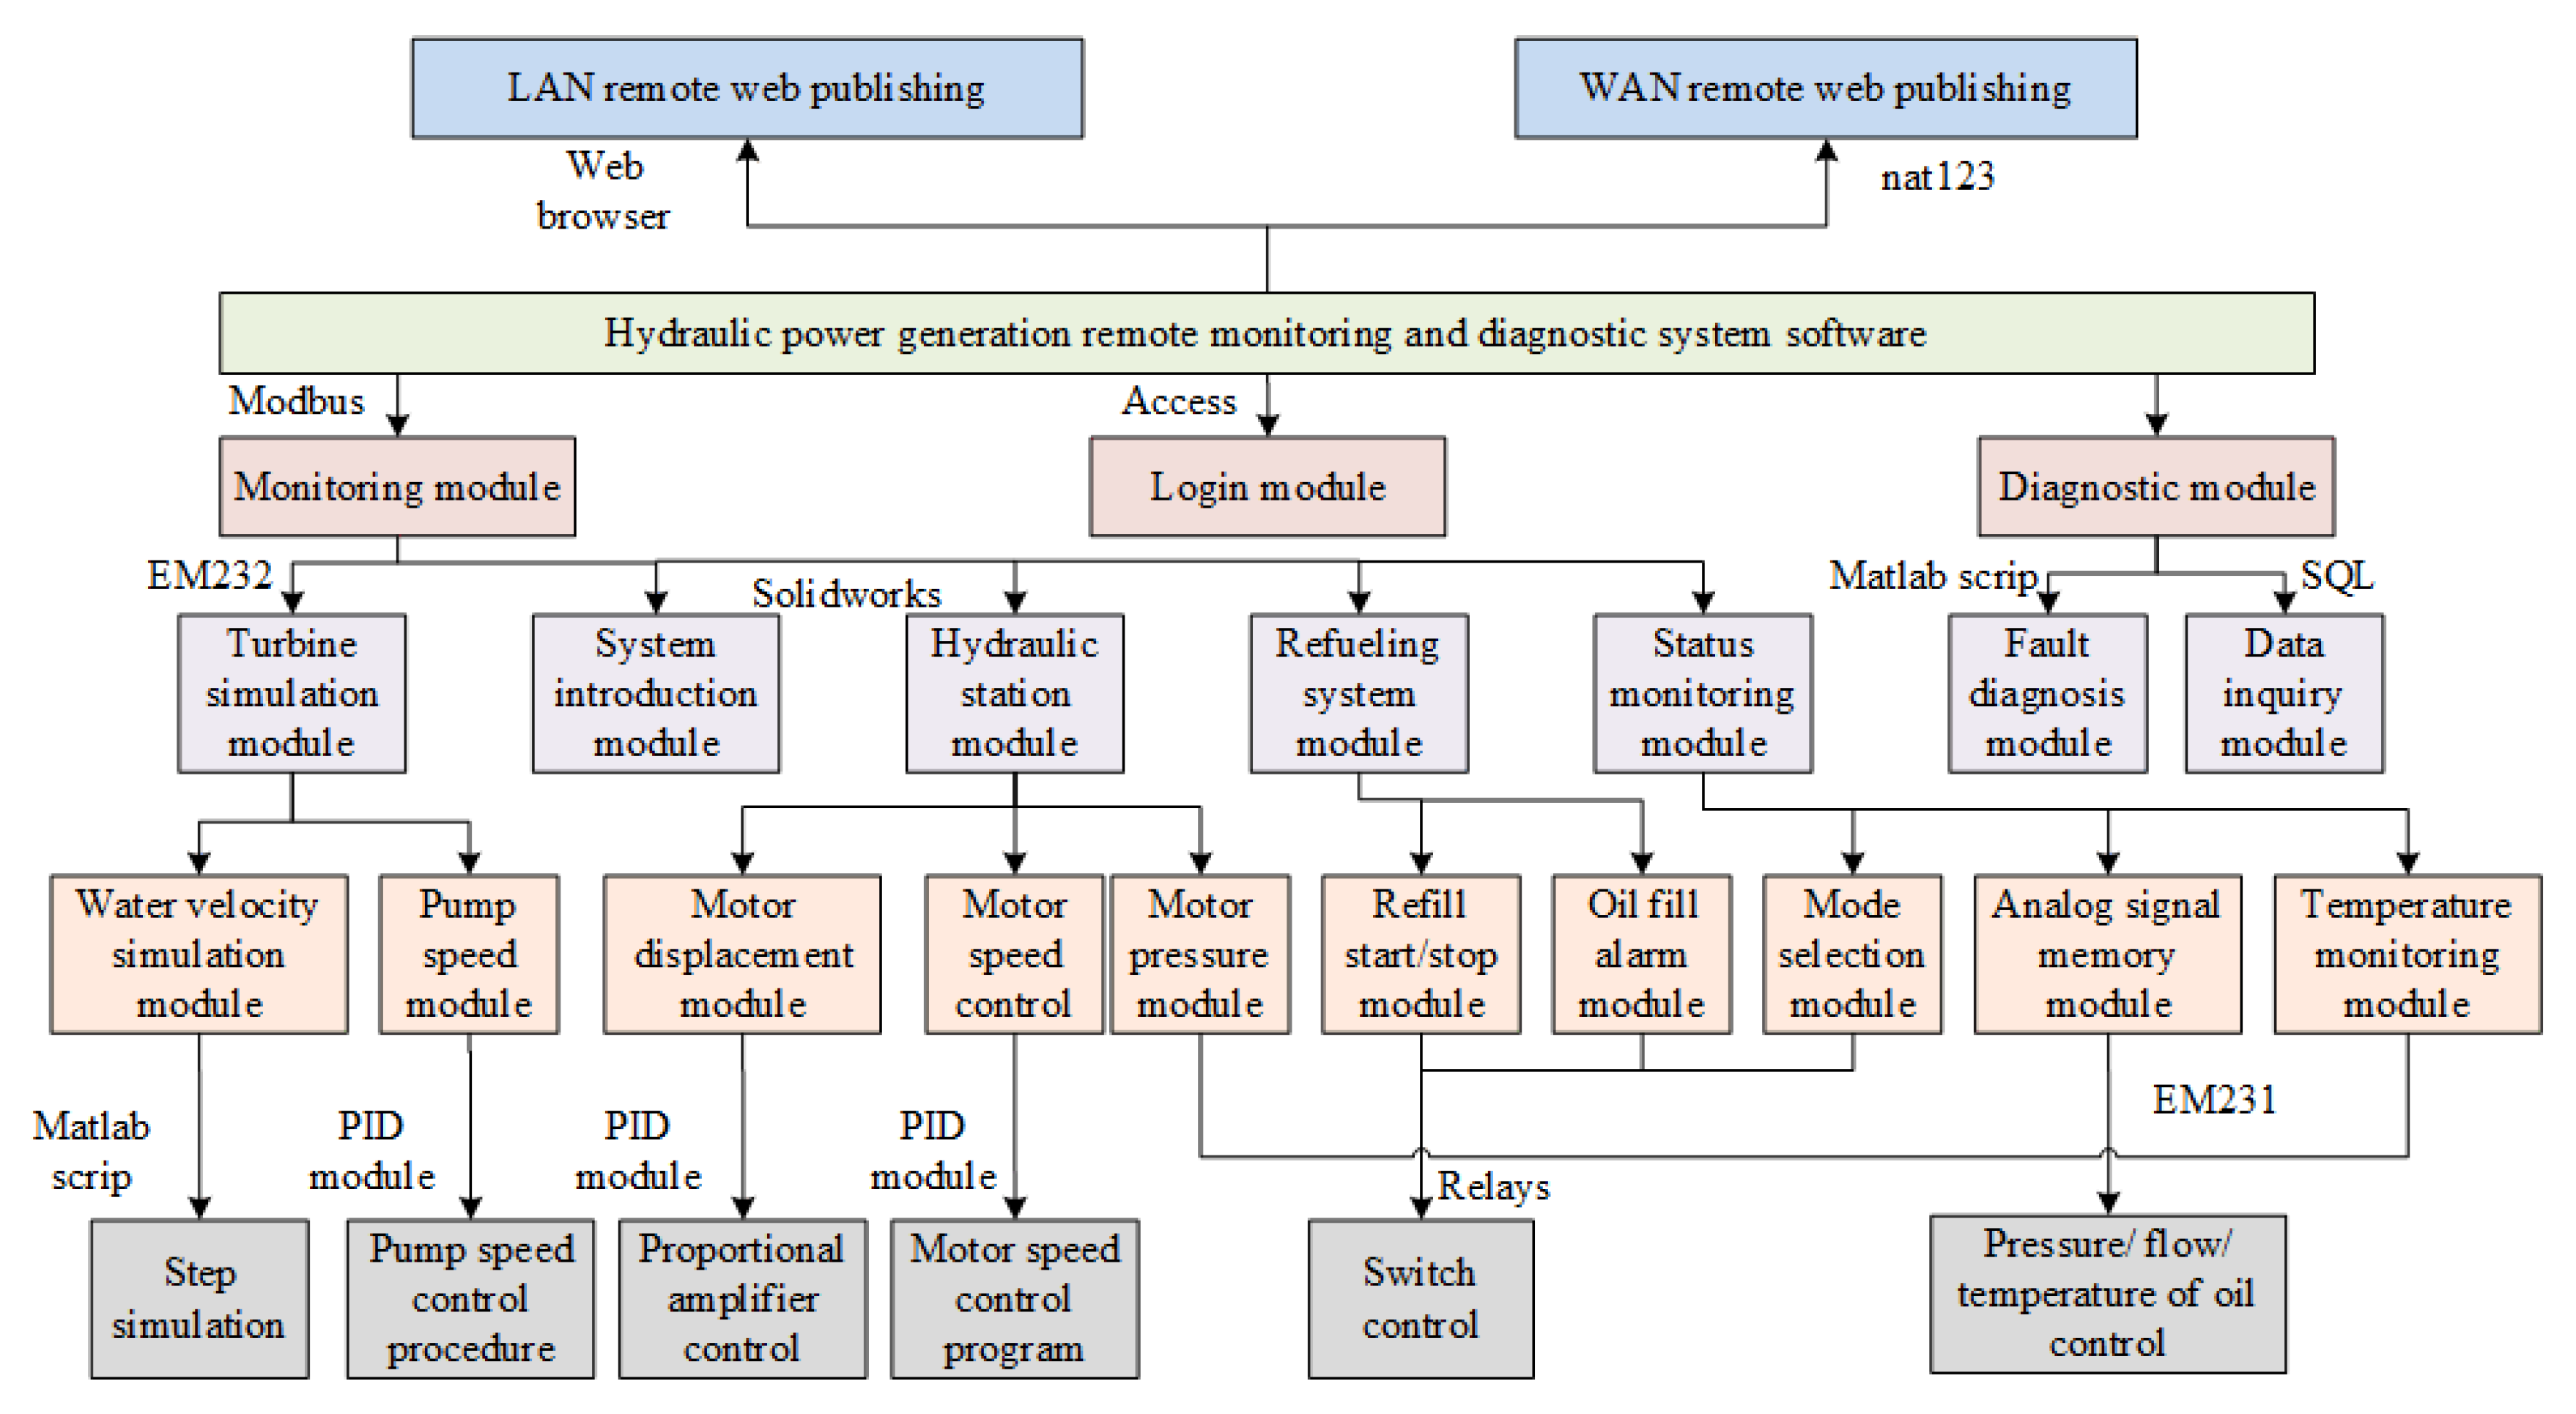
Figure 5 shows the functional architecture of the PC-based monitoring and diagnostic system software. The functions of the software can be summarized as follows.
- (1)
- Real-time monitoring: Real-time monitoring of the operating parameters of the hydraulic transmission and control power generation control, including motor output speed, pump speed, system flow, motor inlet pressure, inverter output frequency, system temperature, charge pressure, system pressure, return pressure, and generator voltage;
- (2)
- Real-time curve display: Real-time curve display of motor output speed, pump speed, motor inlet pressure, system temperature, and inverter output frequency in the hydraulic transmission, and control power generation system;
- (3)
- Historical data storage: Data storage of operating parameters in the hydraulic transmission and control power generation system, with a storage frequency of 100 Hz, to facilitate subsequent data analysis and processing;
- (4)
- Alarm data management: The upper and lower limits of the alarm value are set for specific variables, such as the liquid level and pressure of the hydraulic transmission and control power generation system;
- (5)
- Remote control function: Remote start/stop and parameter setting function for the oil replenishment and hydraulic station systems;
- (6)
- Fault diagnosis function: Fault diagnosis of the system’s normal operation, and failure of the accumulator, relief valve, hydraulic motor, and hydraulic pump, via a combination of the hydraulic transmission and control remote monitoring system and the proposed improved fault diagnosis model;
- (7)
- Data query function: The data query system is implemented using a database, in which the type and time of each failure are stored, and all information relating to previous failures in the system can be accessed via a query.
3. SVM Fault Diagnosis Based on Improved Particle Swarm Algorithm Optimization
As one of the most well-known metaheuristics, particle swarm optimization (PSO) was proposed by Kennedy and Eberhart to solve the problems of constrained optimization comprising continuous variables and non-linear programming [31]. Support vector machines (SVMs) is a supervised non-parametric statistical learning technique to find a hyperplane that separates the dataset into a discrete predefined number of classes with the training examples [32]. In order to solve the problem of SVM parameter setting, the particle swarm optimization algorithm is combined with support vector machines to optimize the parameters of the SVM by using the particle wandering of the PSO to build a new SVM model, PSVM.
The traditional frequency spectrum is used to find the fault frequency. However, the fault degree and accuracy of the hydraulic components cannot be determined, even when the fault point is identified. The support vector machine (SVM) introduces a hyperplane to distinguish between different types of data. An improved particle swarm optimization (PSO)-optimized SVM hydraulic transmission control power generation system fault diagnosis model is proposed to classify nonlinear and multi-fault small sample data. The proposed model rapidly and effectively determines the key parameters of the SVM, and the particle swarm algorithm was improved in this study. Through experimental comparison, it can be shown that the SVM optimized by the improved particle swarm algorithm has better performance than the SVM optimized using other optimization algorithms.
Improved Particle Swarm Algorithm
The particle swarm algorithm considers the solution of the problem as the spatial search for a particle, and provides each particle with an adaptation value; each particle flies toward the location of the optimal particle. The particles are continuously updated, and the update formula is as follows:
where ; ; m is the particle size; D is the particle dimension; t is the current evolutionary algebra; are the acceleration factors; and are the uniformly distributed random numbers.
The inertia weighting factor is introduced as follows:
where is the maximum inertia weight; is the minimum inertia weight; t is the current evolutionary algebra; and T is the maximum number of iterations.
On the basis of the analysis results, an improved particle swarm algorithm was proposed to enhance several components of the basic particle swarm algorithm, such as the inertia weight factor, acceleration factor, local optimal stagnation perturbation and position iteration formula:
- (1)
- Inertial weighting factor. The inertia weight factor was 0.3–0.7; this range of values was able to better neutralize the effect of local and global searches. In addition, a nonlinear decreasing change in inertia weight factor was proposed. As a result, the inertia weight factor was in the optimal interval in the iterations, and its formula is as follows:where is the maximum inertia weight and ; is the minimum inertia weight and ; t is the current evolutionary algebra; and T is the maximum number of iterations.
- (2)
- Acceleration factor. The acceleration factors (decreasing) and (increasing) can improve the algorithm effect during the iterative process. We proposed nonlinear decreasing variation in acceleration factor from 2.5 to 0.5, and in acceleration factor from 0.5 to 2.5. Its equation is as follows:where t is the current evolutionary algebra and T is the maximum number of iterations.
- (3)
- Local optimal stagnation perturbation. The particle is prone to local optimum phenomenon when searching in space. A method to cope with particles in stagnation was proposed to prevent this phenomenon from causing meaningless iterations and to determine whether the particle is in stagnation. This phenomenon was avoided by particle local optimum perturbation, which is obtained as follows:where is the current local optimum of the ith particle; is the local optimum after stagnation processing; indicates the uniform random numbers between 0 and 1; and t is the current evolutionary algebra.
- (4)
- Update of particle speed and position. Based on the optimized particle’s local optimum solution, the joint update of the formula for the particle velocity can be derived, as follows:
The global optimum is also substituted into the formula update, which allows the particles to randomly approach the global optimum and speeds up the convergence of the model at a later stage. The improved PSO position update is obtained as follows:
where represents uniform random numbers between 0 and 1 (); and t is the current evolutionary algebra.
The system fault sample data used was taken from a 50 kW hydraulic transmission and control power generation system test bench. The four types of faults diagnosed included normal operation, accumulator faults, relief valve faults, and motor faults. A total of 188,000 system fault samples were collected.
4. Realization of Remote Monitoring and Fault Diagnosis System for Hydraulic Transmission Control Power Generation
The remote monitoring software and fault diagnosis model were combined to reduce the influence of environmental factors. This also allows operators to control the system at all times from any location, to realize the integration of the monitoring and diagnosis of hydraulic transmission and power generation system. The six main functional modules of the software can be further subdivided into the detailed design of functions and submodules, thus providing the foundation for the subsequent implementation of the software by combining the requirements of the software and the functional division.
Implementation of the remote monitoring and diagnosis system software was undertaken as follows:
4.1. Database Selection
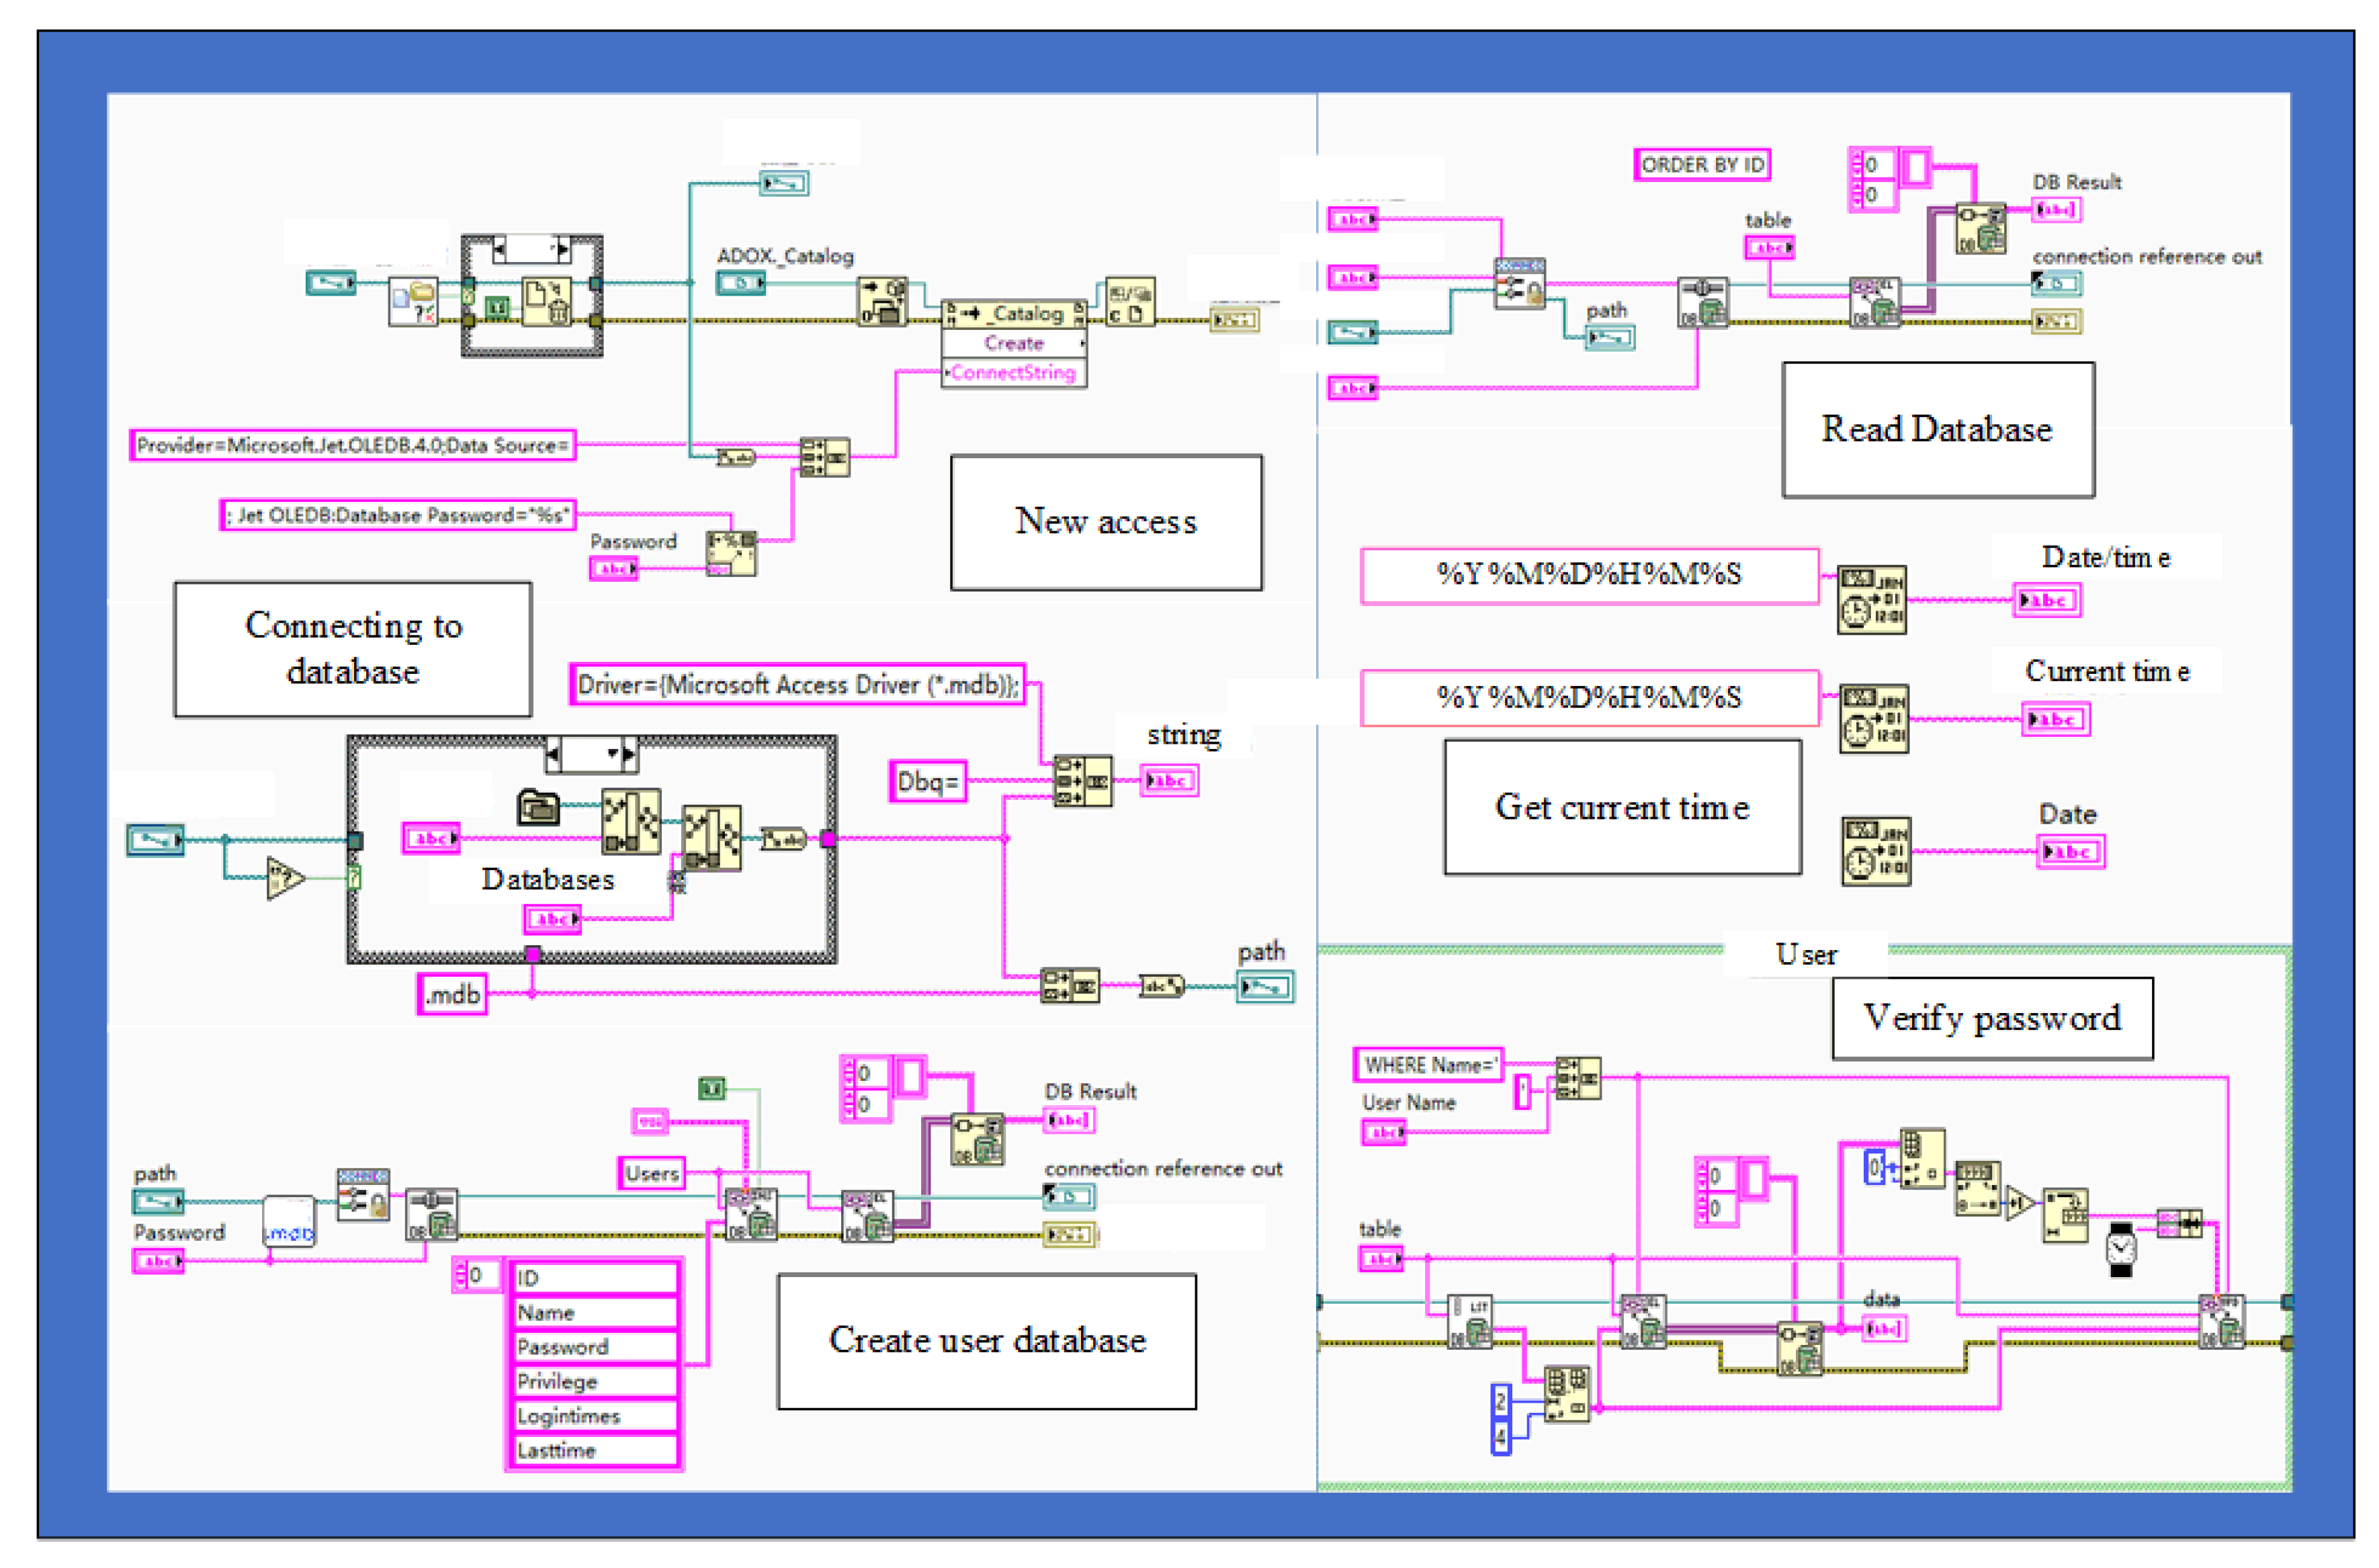
The database is one of the most important sources of information and storage in the hydraulic transmission control power generation system, and its quality affects the efficiency and stability of the system. An Office series Access database is suitable for the handling of small data. Thus, an Access database was selected to rapidly query and process the system data as the system continuously generates power and a small amount of data. The hydraulic transmission and control power generation system mainly stores login information, and the amount of stored information is small. Thus, the creation of a login information table can be completed rapidly using an Access database. The main functions and effects of the login interface are shown in Figure 6.
4.2. Operation Management Module
In accordance with the design requirements of the hydraulic transmission and control power generation monitoring and diagnosis system, the monitoring content of the entire system can be divided into the parameter setting module, data display, and storage module, operation and operation module, and fault diagnosis module. An introduction interface was added to show the actual situation, in addition to a 3D simulation model to provide a more attractive and complete system. Thus, the user is able to gain a preliminary impression of the entire system. The introduction interface is shown in Figure 7.
4.3. Parameter Setting Module
The parameter setting module is shown in Figure 8. The selection of operation mode is designed according to the actual situation, and has manual and automatic operation modes. The two modes are unable to be used simultaneously, and the manual mode cannot be used after the automatic mode is turned on. The hydraulic transmission and control power generation system was designed as a distributed structure, with one motor connected to the generator and another motor connected to the fixed pump. In addition, the corresponding system mode can be selected according to different commissioning situations. The pump speed setting value is changed by the frequency setting value of the inverter.
4.4. Run Operation Module
The hydraulic pump speed is controlled by a frequency converter, such as analogue water speed and step signals. Figure 9 shows the motor speed control. If the Proportional-Integral-Derivative (PID) control switch is turned off, the system runs the default feed-forward control, and the operator can change the type of the controller at any time from the front panel.
4.5. Data Display, Storage Module
The temperature of the hydraulic oil is usually controlled between 30 and 50 °C. Maximum and minimum temperatures are set for the hydraulic oil, and the system sounds an alarm when the system temperature is higher than the maximum and lower than the minimum temperature. The motor output speed, motor set speed, pump speed, system flow rate, and motor outlet pressure are shown in Figure 10.
5. Test
The proposed 50 kW hydraulic transmission and control power generation system was arranged in a distributed structure. It included a simulated turbine module, a hydraulic conversion energy generation module, and an oil change cooling module. The system was a new energy device that uses hydraulic energy transfer to generate electricity as its core, featuring high power, fast response, compact structure, and a flexible and fast layout.
Figure 11 shows the system that simulates the turbine module, including the inverter and gear motor. The inverter generates alternating current with continuously changing frequency to control the speed of the gear motor. Thus, it continuously changes to simulate the sea current energy flow rate.
Figure 12 shows the system hydraulic conversion energy generation module, which includes various valves, pumps, variable motors, and their actuators. The module turns sea current energy, which is difficult to control, into easily controlled hydraulic energy; adjusts the displacement of variable motors using intelligent control algorithms; transforms the disorderly input of quantitative pumps into the constant speed output of variable motors; and finally converts the transmitted mechanical energy into smooth electrical energy through synchronous generators.
Figure 13 shows the system oil change cooling module. The module adopts a synchronous laminar flow heat exchange through the temperature difference between the oil in the pipe and tank and the surrounding space. In addition, heat circulation is forced by a fan to distribute the heat in the air. Thus, the temperature in the tank can be effectively controlled, and the system works efficiently in a thermally balanced environment.
The system aims to achieve a stable motor speed output, and the selection of a suitable speed sensor has a large impact on the system. The sensors used in the power generation, and the pump source test bench, are shown in Figure 14. A GW636 model speed sensor was selected, and a magnet was placed in front of the sensor to ensure that the end surfaces of the sensor and encoder gears were aligned to reduce errors caused by system vibration.
The system used the actual working environment of the 50 kW hydraulic transmission and control power generation system as the background, collected sensor data at different time periods, transmitted these to the server and then to the client platform, and analyzed and processed the data. Figure 15 shows the laboratory environment in which the hydraulic transmission and control power generation system was located.
6. Results
In response to the shortcomings of the existing hydraulic transmission and control power generation monitoring system, remote monitoring and diagnosis software of hydraulic transmission and control power generation, for PC and cell phone, was developed by combining the technical characteristics of hydraulic transmission and control power generation with the working condition of a 50 kW test bench. Furthermore, functional testing of the software was undertaken on the 50 kW test bench. In addition, the fault diagnosis type of the improved model was selected and collected according to the system fault characteristics and monitoring parameters. To address the problems of insufficient accuracy and slow convergence of the current hydraulic system fault diagnosis model, a fault diagnosis model based on the improved particle swarm algorithm optimized via an SVM, for a hydraulic transmission control power generation system, was proposed, analyzed, and compared with other SVM-optimized algorithm fault diagnosis models.
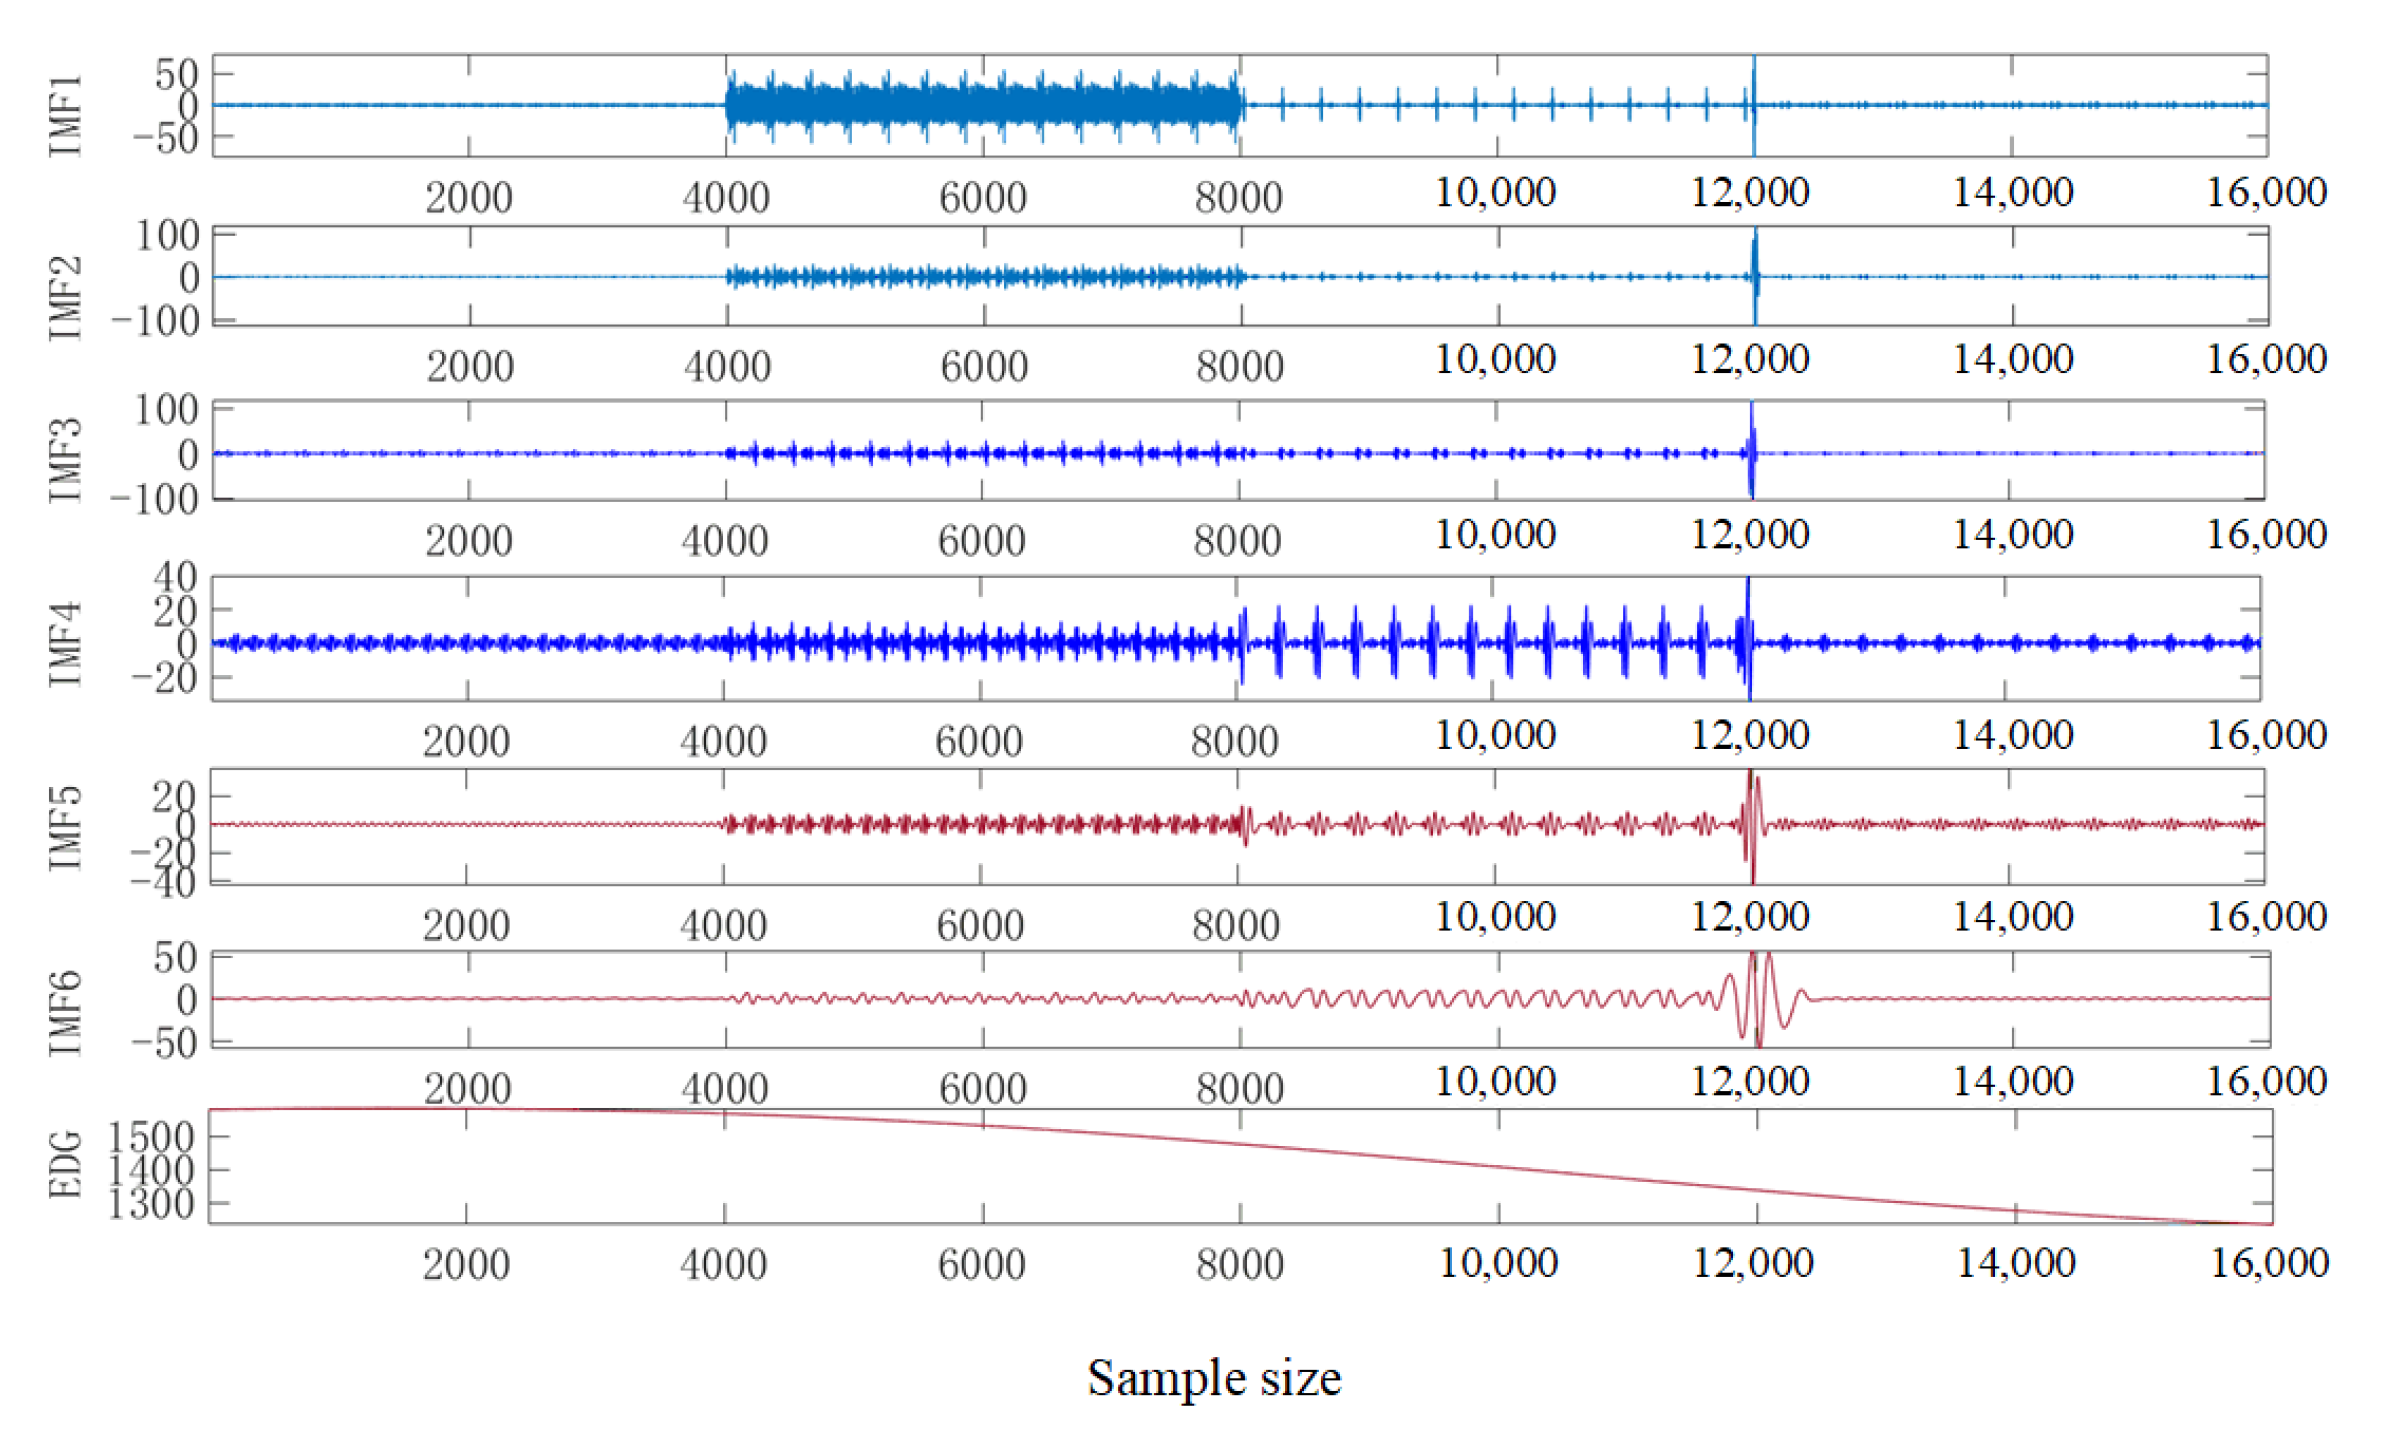
Figure 16 shows feature signals extracted from the noise of non-linear and non-smooth processes. The first six components are selected based on the correlation coefficients and the permutation values are obtained, and the permutation feature vectors of the 6-dimensional components are constructed. Figure 17 shows tests after dimensionality reduction by principal component analysis and before treatment. Analyzed from the perspective of combination features, the model test accuracy of combination feature 4 is the highest, and the model test accuracy corresponding to combination features 1, 2, and 3 will be lower. From the perspective of classification models, classification model number 7, which is the support vector machine model optimized by the PSVM in this paper, has the highest test accuracy, 99.4%.
We compare the two improved fault diagnosis models for hydraulic transmission and control power generation systems in Table 1. The four indicators: running time, training accuracy, testing accuracy, and root mean square error (RMSE) show that the improved PSVM model has a higher training and testing accuracy, and the root mean square error of 0.0006497 is much lower than that of the improved PSO.
We proposed an improved SVM hydraulic transmission and control power generation system fault diagnosis model optimized by particle swarm algorithm. The inertia weight factor, acceleration factor, local optimal stagnation perturbation, and position iteration formula of the particle swarm algorithm were changed to continuously train the model to reach optimality. The remote monitoring and diagnostic software for the hydraulic transmission and control power generation system was developed.
The PC remote monitoring software uses the programmable logic controller (PLC) as the lower computer to monitor each component of the system. However, the actuator PLC responds to the commands of the upper computer to carry out actions to control the normal operation of the entire system. In addition, the monitoring software was combined with the proposed improved fault diagnosis model to integrate system monitoring and diagnosis.
Functional tests were conducted on each module of the remote monitoring and diagnostic software. The test results show that the software facilitates the functions of operation management, data display and storage, status parameter setting, and fault diagnosis. In addition, it allows steady remote monitoring of the hydraulic transmission and control power generation system, and can be used to effectively carry out fault diagnosis, monitor fault alarms, and provide fault information storage of the system. This finding is consistent with the expected design effect, and the proposed system meets the design objectives and requirements.
7. Discussion
The PC-based remote monitoring and diagnostic software designed in this paper has achieved good results in the application of a 50 kW hydraulic transmission and control power generation system test bench. The test results show that the software is capable of operation management, data display and storage, status parameter setting and fault diagnosis, and that the hydraulic power transmission system can be monitored and controlled remotely in a stable manner, and that fault diagnosis, fault alarm, and fault information can be stored effectively. The remote monitoring software and the optimized fault diagnosis model developed in this paper are not limited to hydraulic transmission and control power generation systems, but also have some reference value for other hydraulic systems. In order to better promote and apply it to other hydraulic systems, on the basis of the existing ones, we should give more consideration to the following aspects.
- (1)
- Due to restrictions relating to the experimental conditions, although numerous types of system faults exist, only four types of single faults that do not have serious impacts on the system were selected. However, actual system failure, which is not a normal operation, is caused by multiple faults, and the case of multiple concurrent faults should be considered to improve the fault diagnosis system;
- (2)
- The control index of this subject was studied under the condition of constant motor output speed. Several dynamic parameters could be simultaneously selected as control targets, thereby allowing a more accurate fault diagnosis of the system;
- (3)
- The data used in the proposed fault diagnosis model related to the hydraulic transmission and control power generation system, as the data of the entire life cycle were unavailable. However, diagnosis results would be more accurate if the data of the entire life cycle were analyzed.
In summary, we have considered four main types of common hydraulic system fault states in our 50 kW hydraulic transmission and control power generation system test system. However, in order to perform more accurate system fault diagnosis, we also need to carry out algorithmic model studies with multiple dynamic parameters as the control objective, as well as full life cycle data analysis and diagnosis in order to study the complete cycle data more comprehensively.
8. Future Work
Although the fault diagnosis model studied in this paper enables fault diagnosis of 50 kW hydraulic transmission power generation systems, in order to better study and compare the performance of different algorithms and further improve the level of fault diagnosis performance, we can carry out the following work in the future:
- (1)
- Compare the performance of the SVM and kNN algorithms for fault diagnosis of ocean current energy hydraulic transmission and control power generation system;
- (2)
- Carry out a comparison of the PSO + SVM algorithm with the PSO + KNN algorithm, including comparing the accuracy and the expectation aftereffect of the two algorithms;
- (3)
- Develop a hybrid algorithm of PSO + GWO to carry out our research for the fault diagnosis of ocean current energy hydraulic transmission and control power generation system and compare with our previous algorithms.
Author Contributions
All authors (W.S., H.W., P.G. and R.G.) have collaboratively contributed to the manuscript. All authors have read and agreed to the published version of the manuscript.
Funding
This research received no external funding.
Institutional Review Board Statement
Not applicable.
Informed Consent Statement
Not applicable.
Data Availability Statement
Not applicable.
Acknowledgments
This project was supported by the equipment pre-research and sharing technology project of the equipment development department of China Military Commission (No. 41421080302).
Conflicts of Interest
The authors declare no conflict of interest.
References
- Leijon, J.; Forslund, J.; Thomas, K.; Boström, C. Marine Current Energy Converters to Power a Reverse Osmosis Desalination Plant. Energies 2018, 11, 2880. [Google Scholar] [CrossRef] [Green Version]
- Shadman, M.; Silva, C.; Faller, D.; Wu, Z.; de Freitas Assad, L.; Landau, L.; Levi, C.; Estefen, S. Ocean Renewable Energy Potential, Technology, and Deployments: A Case Study of Brazil. Energies 2019, 12, 3658. [Google Scholar] [CrossRef] [Green Version]
- Khan, N.; Kalair, A.; Abas, N.; Haider, A. Review of Ocean Tidal, Wave and Thermal Energy Technologies. Renew. Sustain. Energy Rev. 2017, 72, 590–604. [Google Scholar] [CrossRef]
- Xu, W.; Dong, Y.; Teng, X.; Zhang, P. Evaluation of the Development Intensity of China’s Coastal Area. Ocean. Coast. Manag. 2018, 157, 124–129. [Google Scholar] [CrossRef]
- Alipoor, J.; Miura, Y.; Ise, T. Power System Stabilization Using Virtual Synchronous Generator with Alternating Moment of Inertia. IEEE J. Emerg. Sel. Top. Power Electron. 2015, 3, 451–458. [Google Scholar] [CrossRef]
- Tian, P.; Li, Z.; Hao, Z. A Doubly-Fed Induction Generator Adaptive Control Strategy and Coordination Technology Compatible with Feeder Automation. Energies 2019, 12, 4463. [Google Scholar] [CrossRef] [Green Version]
- Chen, X.; Liu, Z. Impedance Modeling and Stability Analysis of the Converters in a Double-Fed Induction Generator (DFIG)-Based System. Energies 2019, 12, 2500. [Google Scholar] [CrossRef] [Green Version]
- Chen, W.; Wang, X.; Zhang, F.; Liu, H.; Lin, Y. Review of the Application of Hydraulic Technology in Wind Turbine. Wind Energy 2020, 23, 1495–1522. [Google Scholar] [CrossRef]
- Zhang, W. Parameter Adjustment Strategy and Experimental Development of Hydraulic System for Wave Energy Power Generation. Symmetry 2020, 12, 711. [Google Scholar] [CrossRef]
- Liu, Z.; Yang, G.; Wei, L.; Yue, D.; Tao, Y. Research on the Robustness of the Constant Speed Control of Hydraulic Energy Storage Generation. Energies 2018, 11, 1310. [Google Scholar] [CrossRef] [Green Version]
- Cai, B.; Liu, H.; Xie, M. A Real-Time Fault Diagnosis Methodology of Complex Systems Using Object-Oriented Bayesian Networks. Mech. Syst. Signal. Process. 2016, 80, 31–44. [Google Scholar] [CrossRef]
- Hosseinzadeh, M.; Rajaei Salmasi, F. Analysis and Detection of a Wind System Failure in a Micro-Grid. J. Renew. Sustain. Energy 2016, 8, 043302. [Google Scholar] [CrossRef]
- Leahy, K.; Hu, R.L.; Konstantakopoulos, I.C.; Spanos, C.J.; Agogino, A.M. Diagnosing Wind Turbine Faults Using Machine Learning Techniques Applied to Operational Data. In Proceedings of the 2016 IEEE International Conference on Prognostics and Health Management (ICPHM), Ottawa, ON, Canada, 20–22 June 2016; pp. 1–8. [Google Scholar]
- Hosseinzadeh, M.; Rajaei Salmasi, F. Islanding Fault Detection in Microgrids—A Survey. Energies 2020, 13, 3479. [Google Scholar] [CrossRef]
- Hu, R.L.; Leahy, K.; Konstantakopoulos, I.C.; Auslander, D.M.; Spanos, C.J.; Agogino, A.M. Using Domain Knowledge Features for Wind Turbine Diagnostics. In Proceedings of the 2016 15th IEEE International Conference on Machine Learning and Applications (ICMLA), Anaheim, CA, USA, 18–20 December 2016; pp. 300–307. [Google Scholar]
- Yang, C.G.; Zhang, C.H.; Zhao, J.Y.; Zhao, S.M. Research on Active Online Diagnosis Technology of Hydraulic System. In Applied Mechanics and Materials; Trans Tech Publications, Ltd.: Freienbach, Switzerland, 2014; Volume 599–601, pp. 1032–1035. [Google Scholar] [CrossRef]
- Yin, S.; Ding, S.X.; Haghani, A.; Hao, H.; Zhang, P. A Comparison Study of Basic Data-Driven Fault Diagnosis and Process Monitoring Methods on the Benchmark Tennessee Eastman Process. J. Process. Control. 2012, 22, 1567–1581. [Google Scholar] [CrossRef]
- Xu, G.; Liu, M.; Jiang, Z.; Shen, W.; Huang, C. Online Fault Diagnosis Method Based on Transfer Convolutional Neural Networks. IEEE Trans. Instrum. Meas. 2020, 69, 509–520. [Google Scholar] [CrossRef]
- Tang, S.; Yuan, S.; Zhu, Y. Deep Learning-Based Intelligent Fault Diagnosis Methods Toward Rotating Machinery. IEEE Access 2020, 8, 9335–9346. [Google Scholar] [CrossRef]
- Zhou, Q.; Xiong, T.; Wang, M.; Xiang, C.; Xu, Q. Diagnosis and Early Warning of Wind Turbine Faults Based on Cluster Analysis Theory and Modified ANFIS. Energies 2017, 10, 898. [Google Scholar] [CrossRef] [Green Version]
- Arana-Daniel, N. Complex and Hypercomplex-Valued Support Vector Machines: A Survey. Appl. Sci. 2019, 9, 3090. [Google Scholar] [CrossRef] [Green Version]
- Çomak, E.; Arslan, A. A New Training Method for Support Vector Machines: Clustering k-NN Support Vector Machines. Expert Syst. Appl. 2008, 35, 564–568. [Google Scholar] [CrossRef]
- Singh, N.; Singh, S.B. Hybrid Algorithm of Particle Swarm Optimization and Grey Wolf Optimizer for Improving Convergence Performance. J. Appl. Math. 2017, 2017, 2030489. [Google Scholar] [CrossRef]
- Holden, N.; Freitas, A.A. A Hybrid PSO/ACO Algorithm for Discovering Classification Rules in Data Mining. J. Artif. Evol. Appl. 2008, 2008, 316145. [Google Scholar] [CrossRef] [Green Version]
- Esmin, A.A.A.; Matwin, S. HPSOM: A hybrid particle swarm optimization algorithm with genetic mutation. Int. J. Innov. Comput. Inf. Control 2013, 9, 1919–1934. [Google Scholar]
- Esmin, A.A.A.; Lambert-Torres, G.; Alvarenga, G.B. Hybrid Evolutionary Algorithm Based on PSO and GA Mutation. In Proceedings of the 2006 Sixth International Conference on Hybrid Intelligent Systems (HIS’ 06), Rio de Janeiro, Brazil, 13–15 December 2006; p. 57. [Google Scholar]
- Niu, B.; Li, L. A Novel PSO-DE-Based Hybrid Algorithm for Global Optimization. In Proceedings of the Advanced Intelligent Computing Theories and Applications. With Aspects of Artificial Intelligence, Shanghai, China, 15–18 September 2008; Huang, D.-S., Wunsch, D.C., Levine, D.S., Jo, K.-H., Eds.; Springer: Berlin/Heidelberg, Germany, 2008; pp. 156–163. [Google Scholar]
- Woo, S.; Vacca, A. Experimental Characterization and Evaluation of the Vibroacoustic Field of Hydraulic Pumps: The Case of an External Gear Pump. Energies 2020, 13, 6639. [Google Scholar] [CrossRef]
- Shang, X.; Zhou, H.; Yang, H. Improving Performance of a Resonant String-Based Pulsation Attenuator in Hydraulic Systems. Appl. Sci. 2020, 10, 8526. [Google Scholar] [CrossRef]
- Short, M.; Twiddle, J. An Industrial Digitalization Platform for Condition Monitoring and Predictive Maintenance of Pumping Equipment. Sensors 2019, 19, 3781. [Google Scholar] [CrossRef] [PubMed] [Green Version]
- Kennedy, J.; Eberhart, R.C. Particle Swarm Optimization. In Proceedings of the IEEE International Conference on Neural Networks, IEEE Service Center, Perth, Australia, 27 November–1 December 1995; pp. 1942–1948. [Google Scholar]
- Mountrail, G.; Im, J.; Ogole, C. Support Vector Machines in Remote Sensing: A Review. ISPRS J. Photogramm. Remote Sens. 2011, 66, 247–259. [Google Scholar] [CrossRef]
Figure 1.
Schematic of ocean current energy hydraulic power generation and remote monitoring system.
Figure 1.
Schematic of ocean current energy hydraulic power generation and remote monitoring system.

Figure 2.
Hydraulic system schematic. 1—hydraulic pump, 2—relief valve, 3—check valve, 4—on/off valve, 5—hydraulic motor, 6—oil suction filter, 7—oil refill pump, 8—high-pressure filter, 9—oil fill check valve, 10—oil fill directional valve, 11—relief valve, 12—control directional valve, 13—cooler, 14—throttle valve, 15—loading pumps, and 16—loading relief valve.

Figure 3.
Hydraulic power generation system structure. 1—pump source, 2—load simulation area, and 3—hydraulic station.
Figure 3.
Hydraulic power generation system structure. 1—pump source, 2—load simulation area, and 3—hydraulic station.

Figure 4.
Remote monitoring and diagnostic solutions.

Figure 5.
System software functional architecture.

Figure 6.
Data management.

Figure 7.
System introduction interface.

Figure 8.
Parameter setting interface.

Figure 9.
Operation module.

Figure 10.
Data display and storage module.

Figure 11.
Turbine speed simulation module.

Figure 12.
Hydraulic conversion energy generation module.

Figure 13.
Oil change cooling module.

Figure 14.
Speed sensor for test bench. (a) Power generation test bench; (b) pump source test bench.
Figure 14.
Speed sensor for test bench. (a) Power generation test bench; (b) pump source test bench.

Figure 15.
System experimental environment.

Figure 16.
Component alignment feature analysis.

Figure 17.
Tests after dimensionality reduction.


Table 1.
Comparison of fault diagnosis models.
| Models | Running Time/h | Training Accuracy/% | Testing Accuracy/% | RMSE |
|---|---|---|---|---|
| PSO | 20 | 99.97 | 89.52 | 0.0192 |
| PSVM | 12 | 99.96 | 99.72 | 0.0006497 |
Publisher’s Note: MDPI stays neutral with regard to jurisdictional claims in published maps and institutional affiliations. |
© 2021 by the authors. Licensee MDPI, Basel, Switzerland. This article is an open access article distributed under the terms and conditions of the Creative Commons Attribution (CC BY) license (https://creativecommons.org/licenses/by/4.0/).
Share and Cite
MDPI and ACS Style
Su, W.; Wei, H.; Guo, P.; Guo, R. Remote Monitoring and Fault Diagnosis of Ocean Current Energy Hydraulic Transmission and Control Power Generation System. Energies 2021, 14, 4047. https://0-doi-org.brum.beds.ac.uk/10.3390/en14134047
AMA Style
Su W, Wei H, Guo P, Guo R. Remote Monitoring and Fault Diagnosis of Ocean Current Energy Hydraulic Transmission and Control Power Generation System. Energies. 2021; 14(13):4047. https://0-doi-org.brum.beds.ac.uk/10.3390/en14134047
Chicago/Turabian StyleSu, Wenbin, Hongbo Wei, Penghua Guo, and Ruizhe Guo. 2021. "Remote Monitoring and Fault Diagnosis of Ocean Current Energy Hydraulic Transmission and Control Power Generation System" Energies 14, no. 13: 4047. https://0-doi-org.brum.beds.ac.uk/10.3390/en14134047
Note that from the first issue of 2016, this journal uses article numbers instead of page numbers. See further details here.