
Impact of Energy Monitoring and Management Systems on the Implementation and Planning of Energy Performance Improved Actions: An Empirical Analysis Based on Energy Audits in Italy


Abstract
:1. Introduction
2. Context
3. Materials and Methods
- -
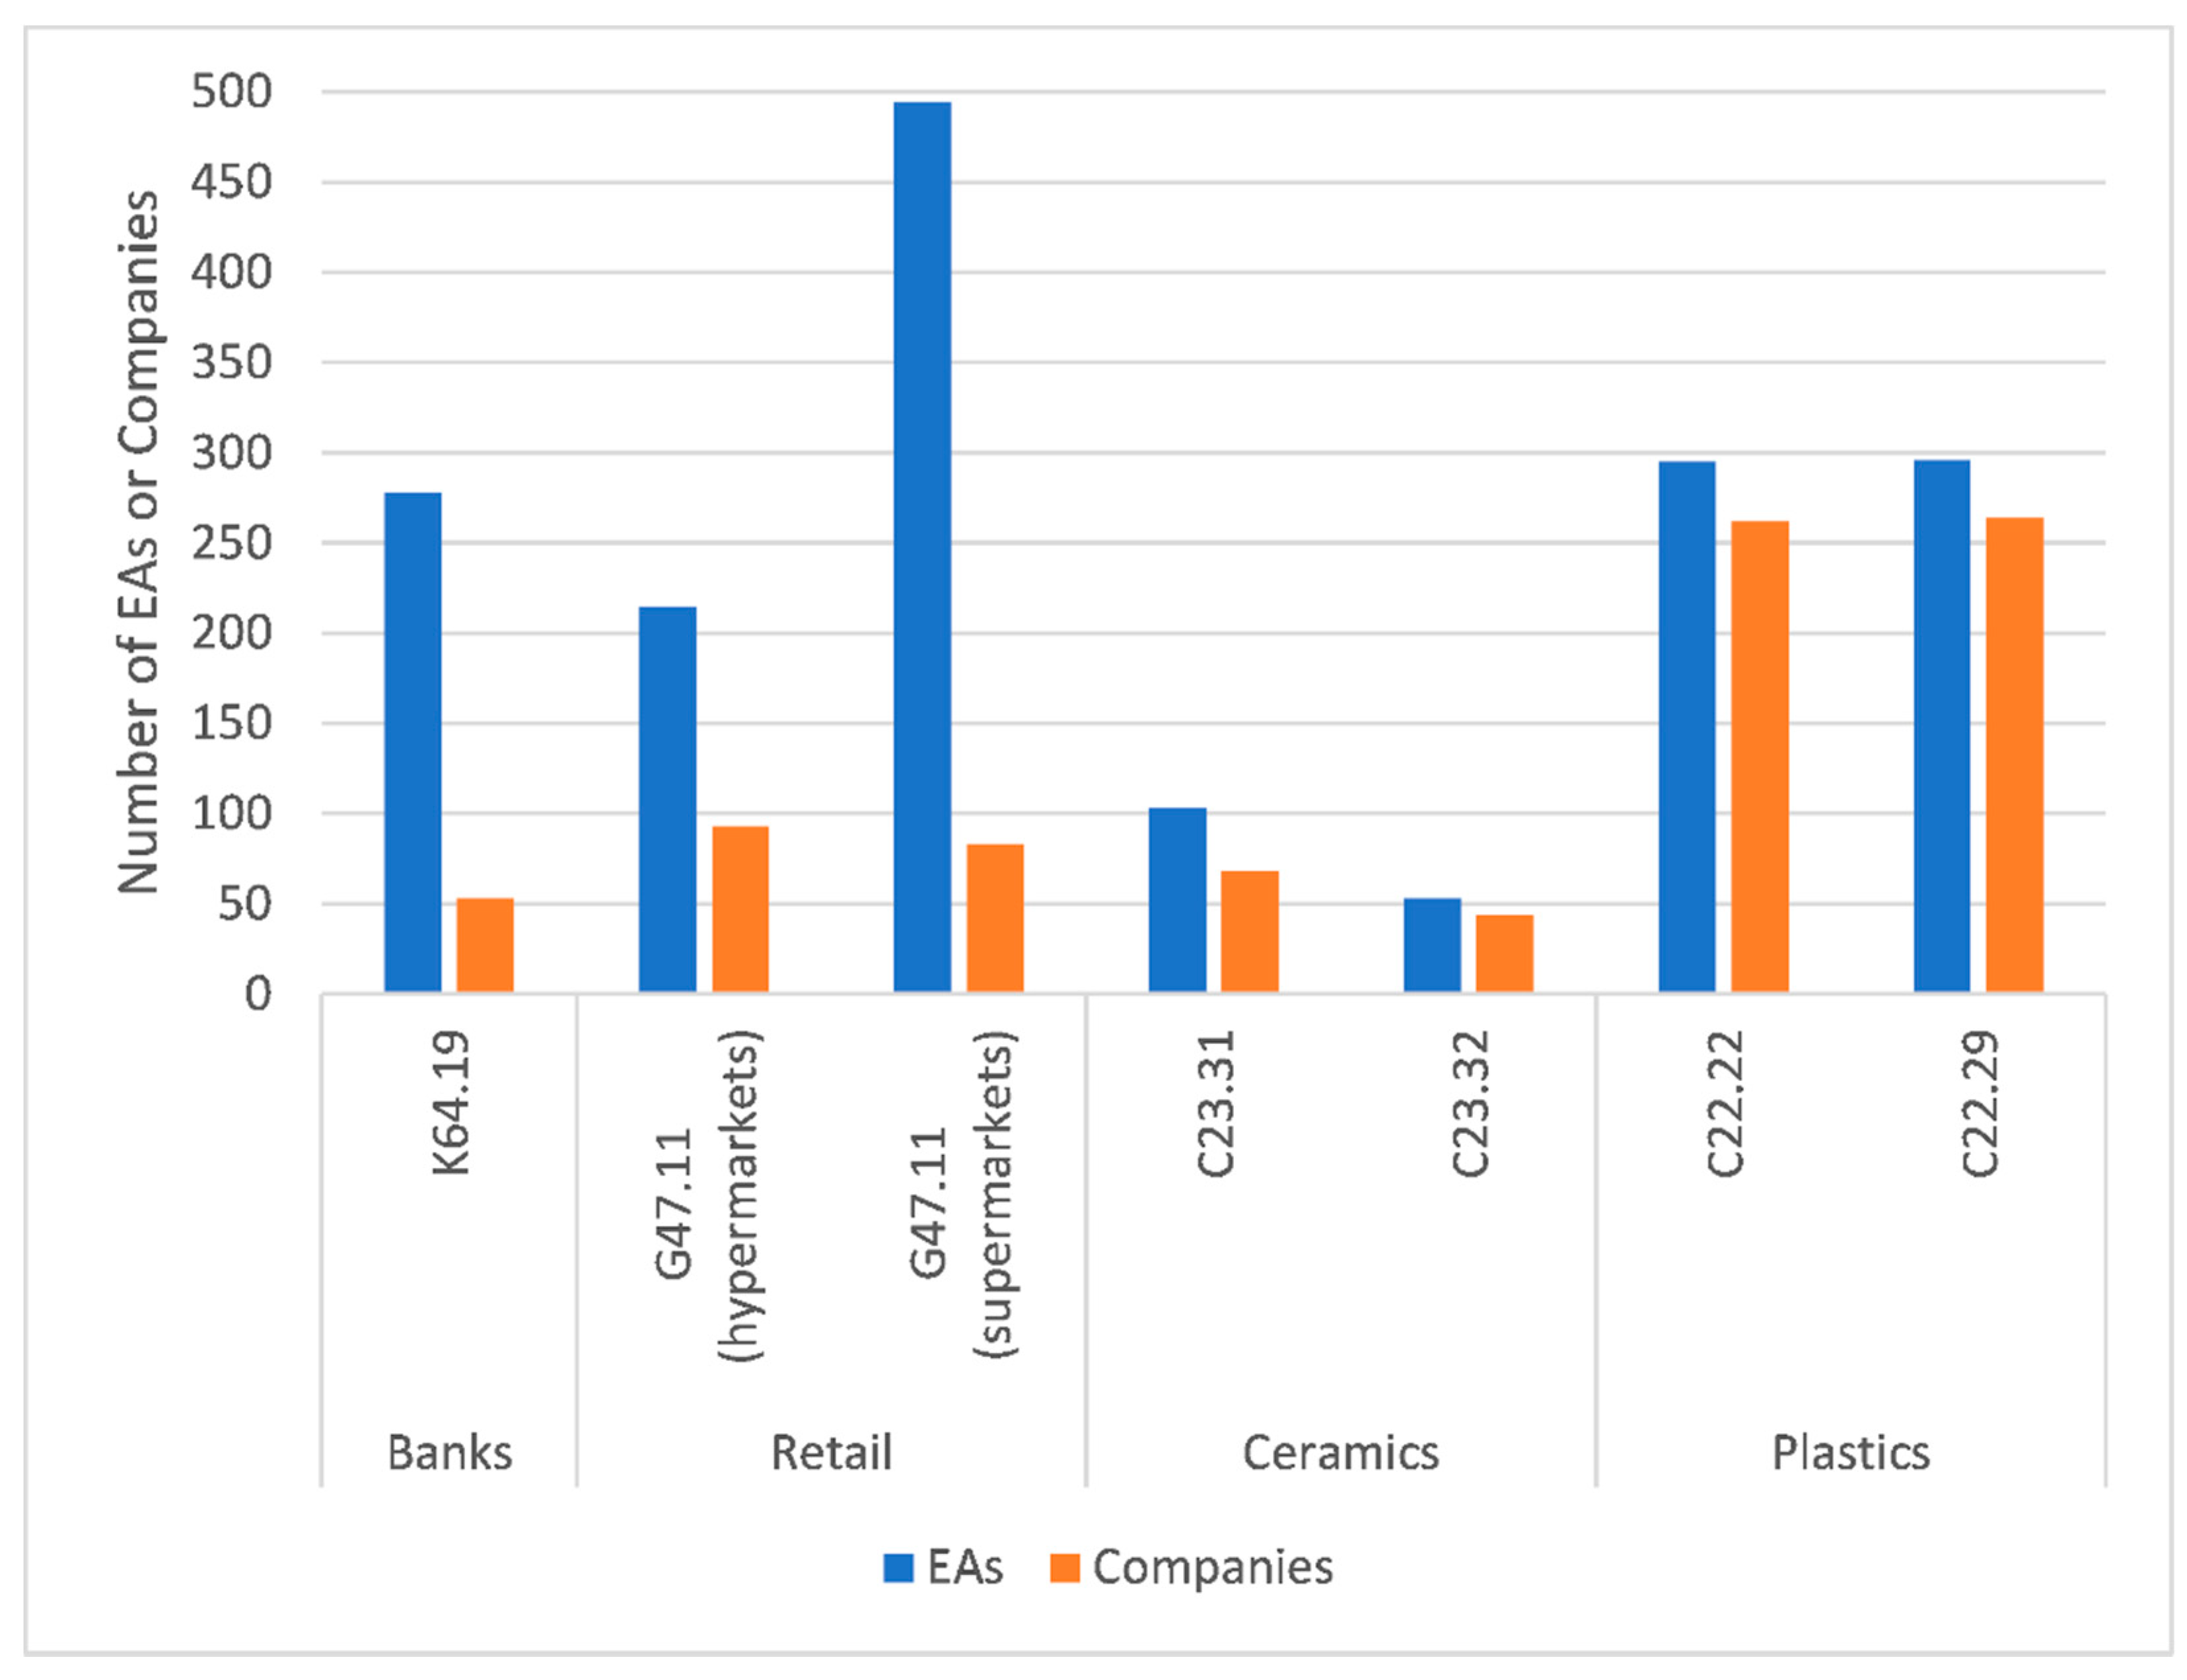
- Banks: K64.19—other monetary intermediation;
- -
- Retail: G47.11—retail sale in nonspecialised stores (hyper- and supermarkets);
- -
- Ceramics: C23.31—manufacture of ceramic tiles and flags and C23.32—manufacture of bricks, tiles, and construction products in baked clay;
- -
- Plastics: C22.22—manufacture of plastic packing goods and C22.29—manufacture of other plastic products.
- -
- Number of EPIAs per site: it refers to all interventions, as well as those with no saving or investment information available.
- -
- Energy saving per site or per company: it refers to final energy saving, and it is computed excluding sites without saving information.
- -
- Saving: it is computed as the share of saving in total energy consumption of the relevant NACE code. Since the indicator includes only the available information on EPIA reporting savings, it represents a lower threshold for both achieved savings (EPIAs) and potential savings (identified EPIAs). In the second case, the potential nature of savings should be highlighted; namely, they are not likely to be achieved in full since companies would implement only part of the identified EPIAs and in different periods. These potential savings are not presented in this work, but they are employed in the calculation of the average cost effectiveness of the identified EPIAs.
- -
- Investment per site: it is computed by excluding sites without investment information.
- -
- Average cost effectiveness: it is computed as the average of the ratio between investment and saving calculated for each EPIA and identified EPIA, and it refers only to EPIAs including both figures. Such indicator is aimed at representing the cost of saving a toe of final energy and then the effectiveness of different NACE sectors in investing in energy efficiency.
- -
- PBT: it represents simple payback time computed as the ratio between investment cost and energy saving expressed in economic terms. Such information is available only for identified EPIAs.
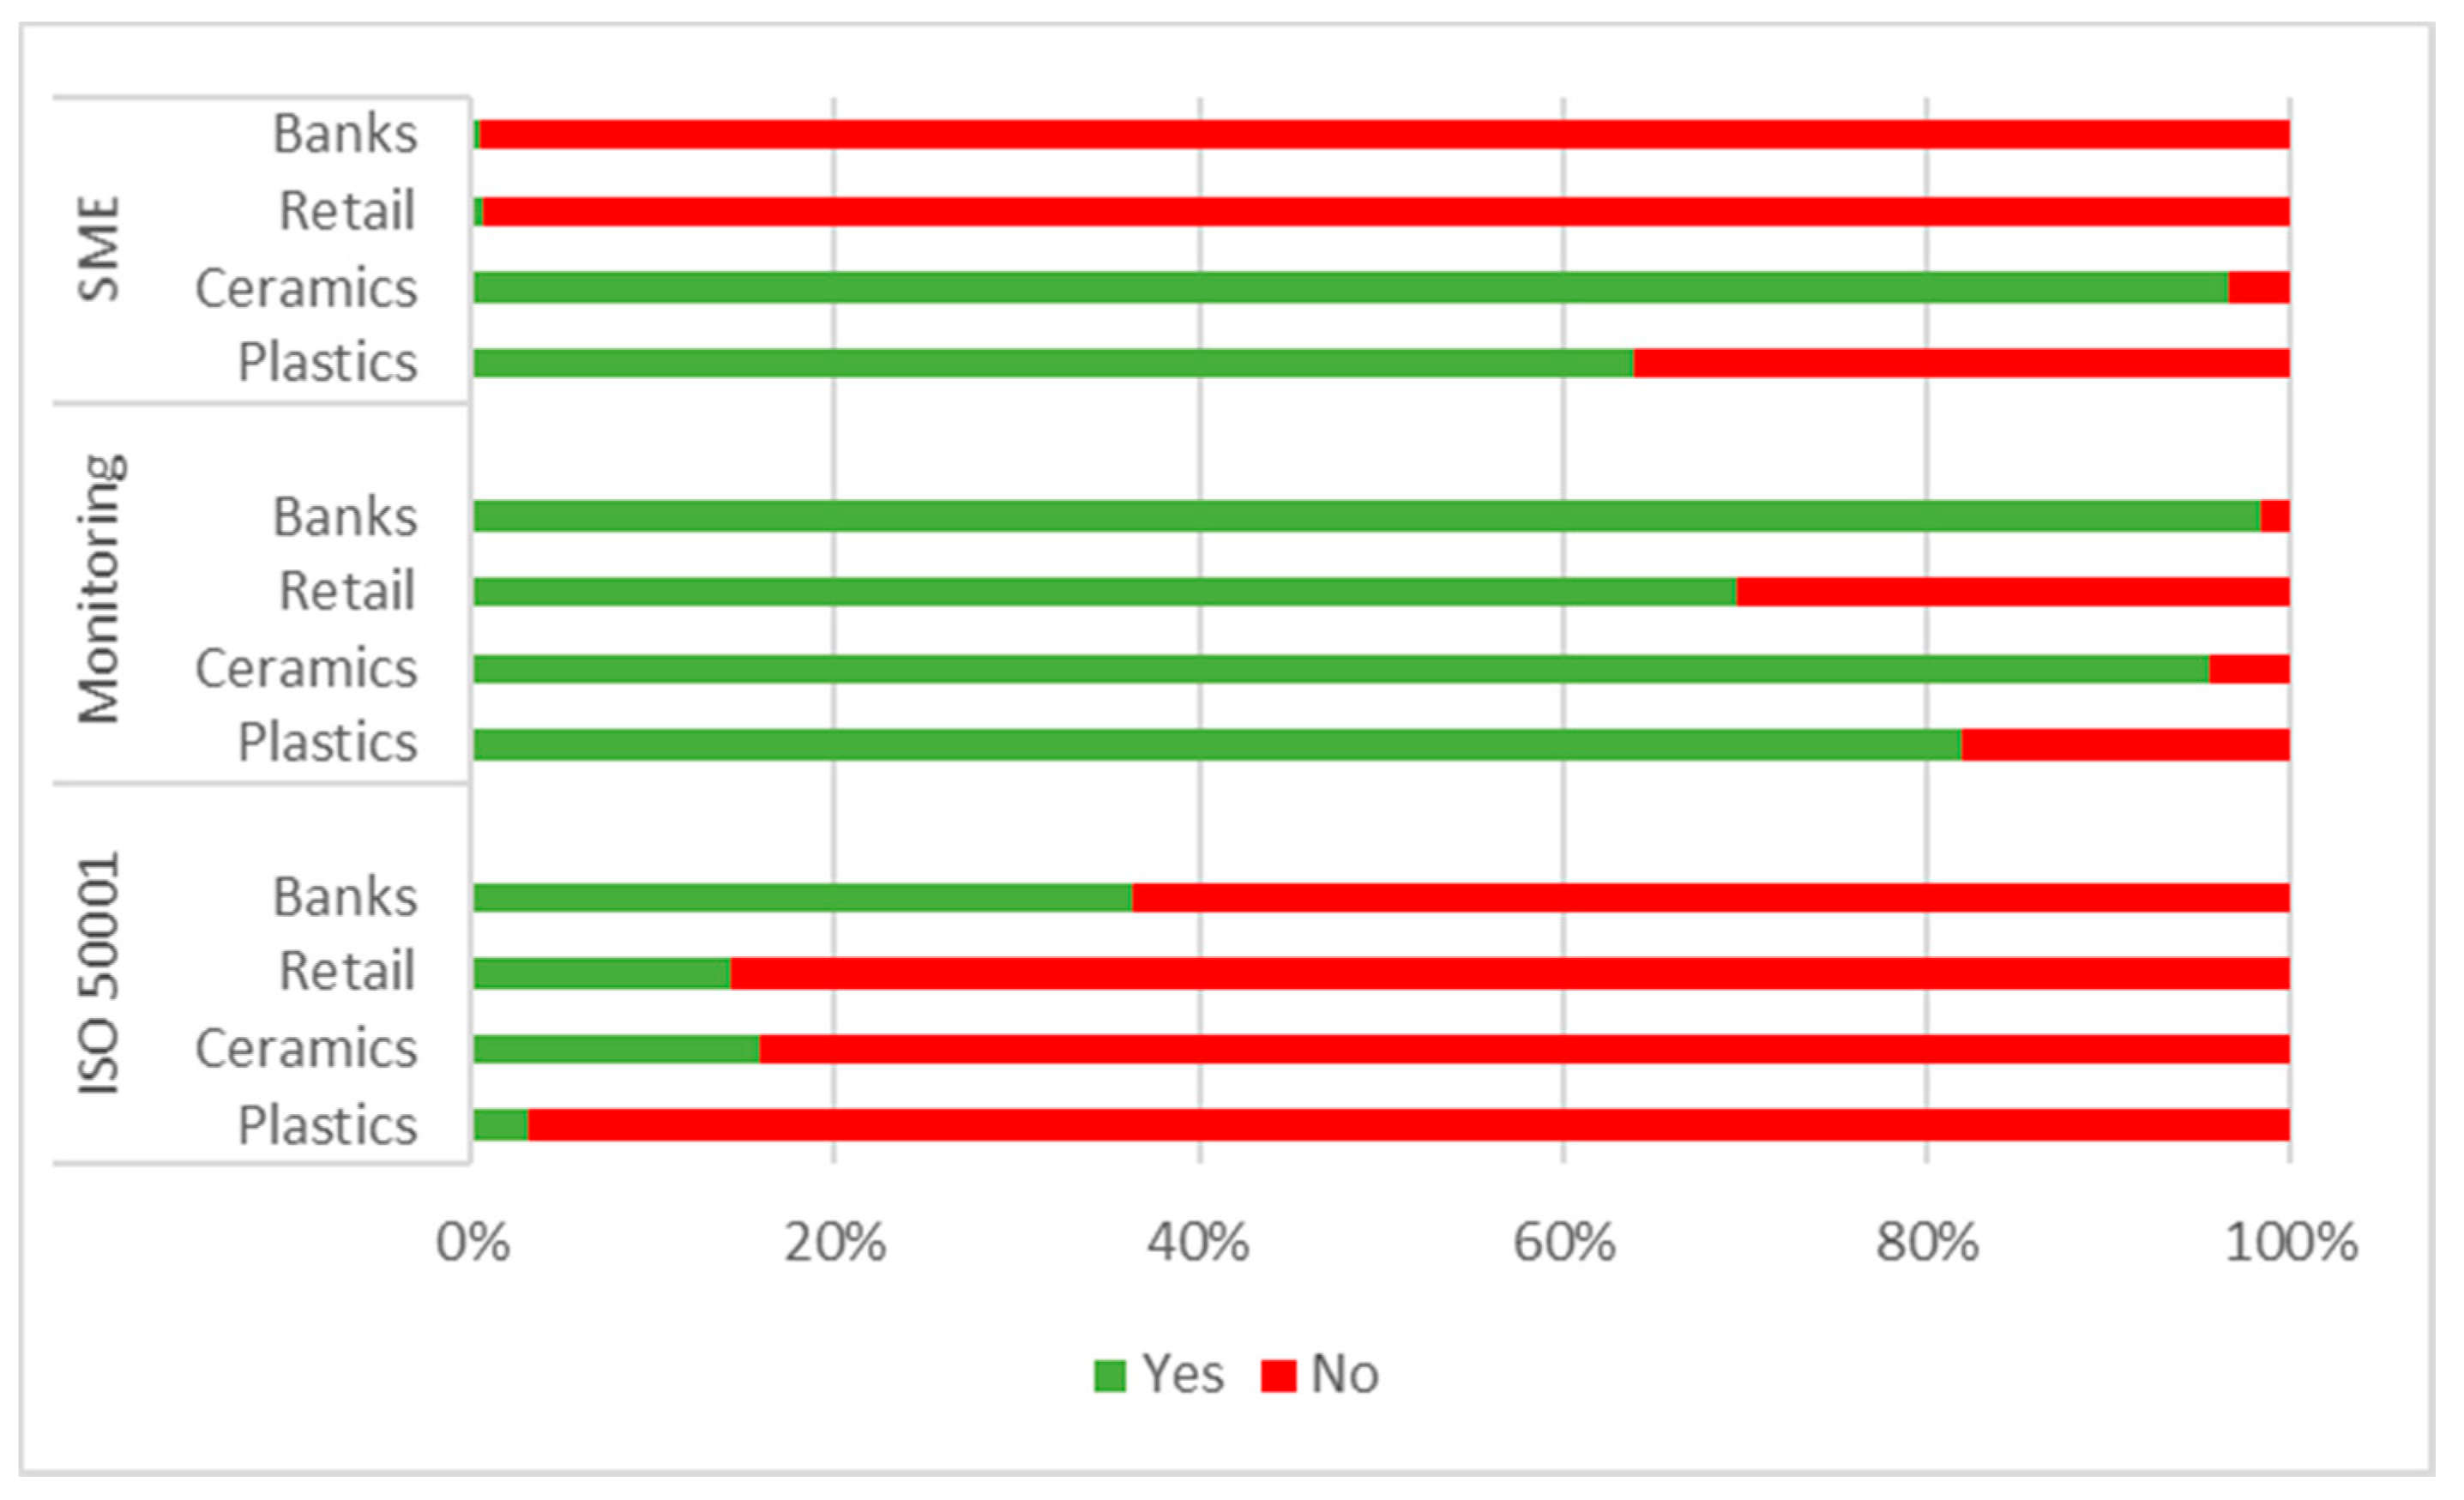
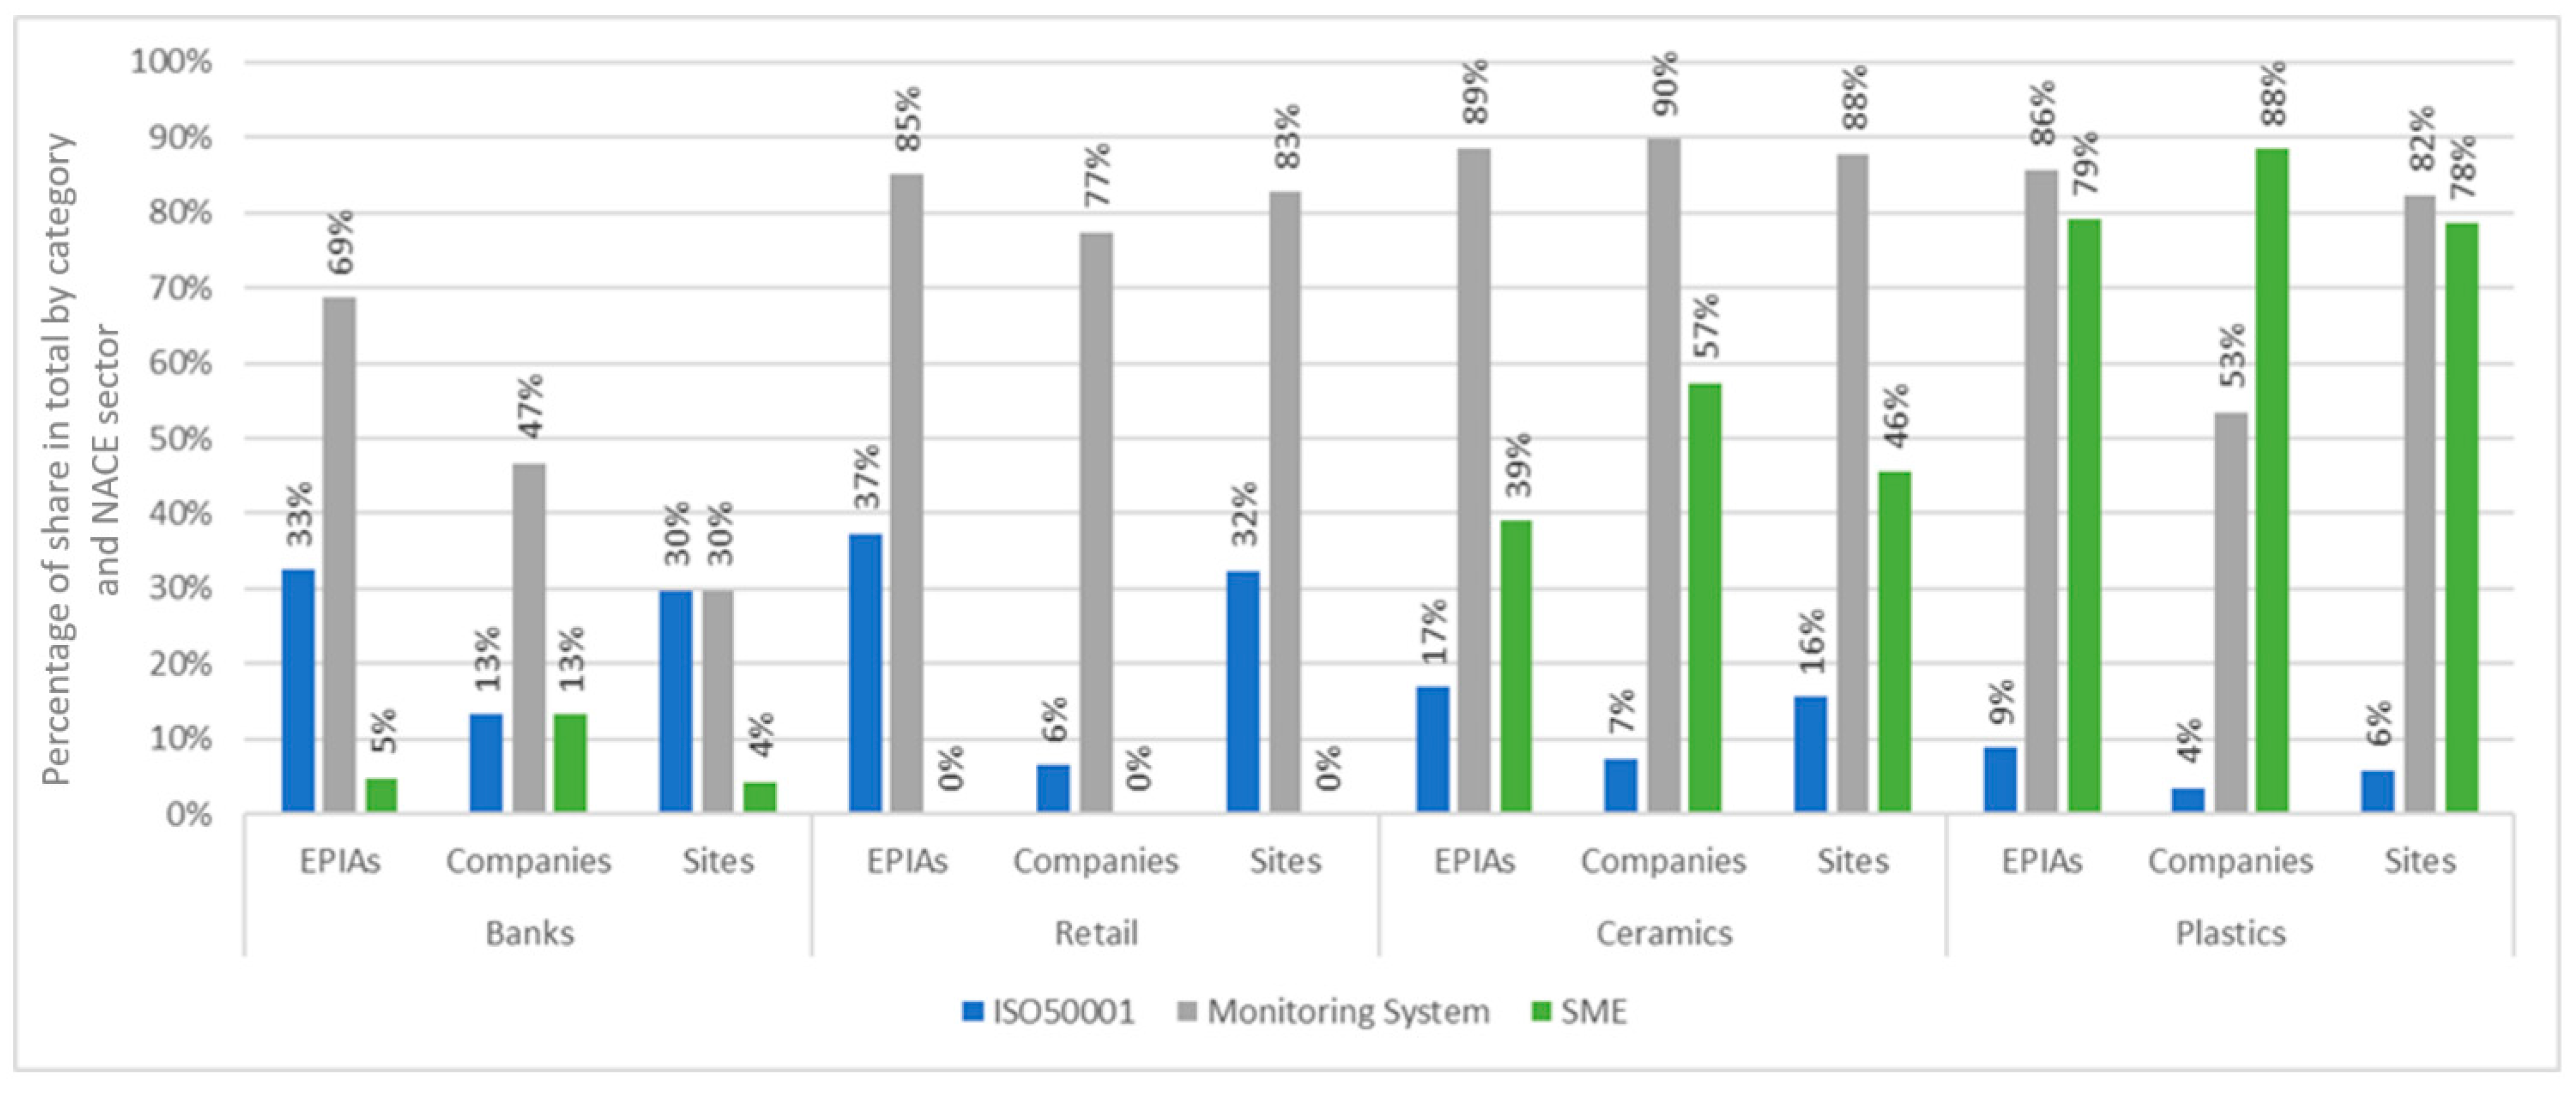
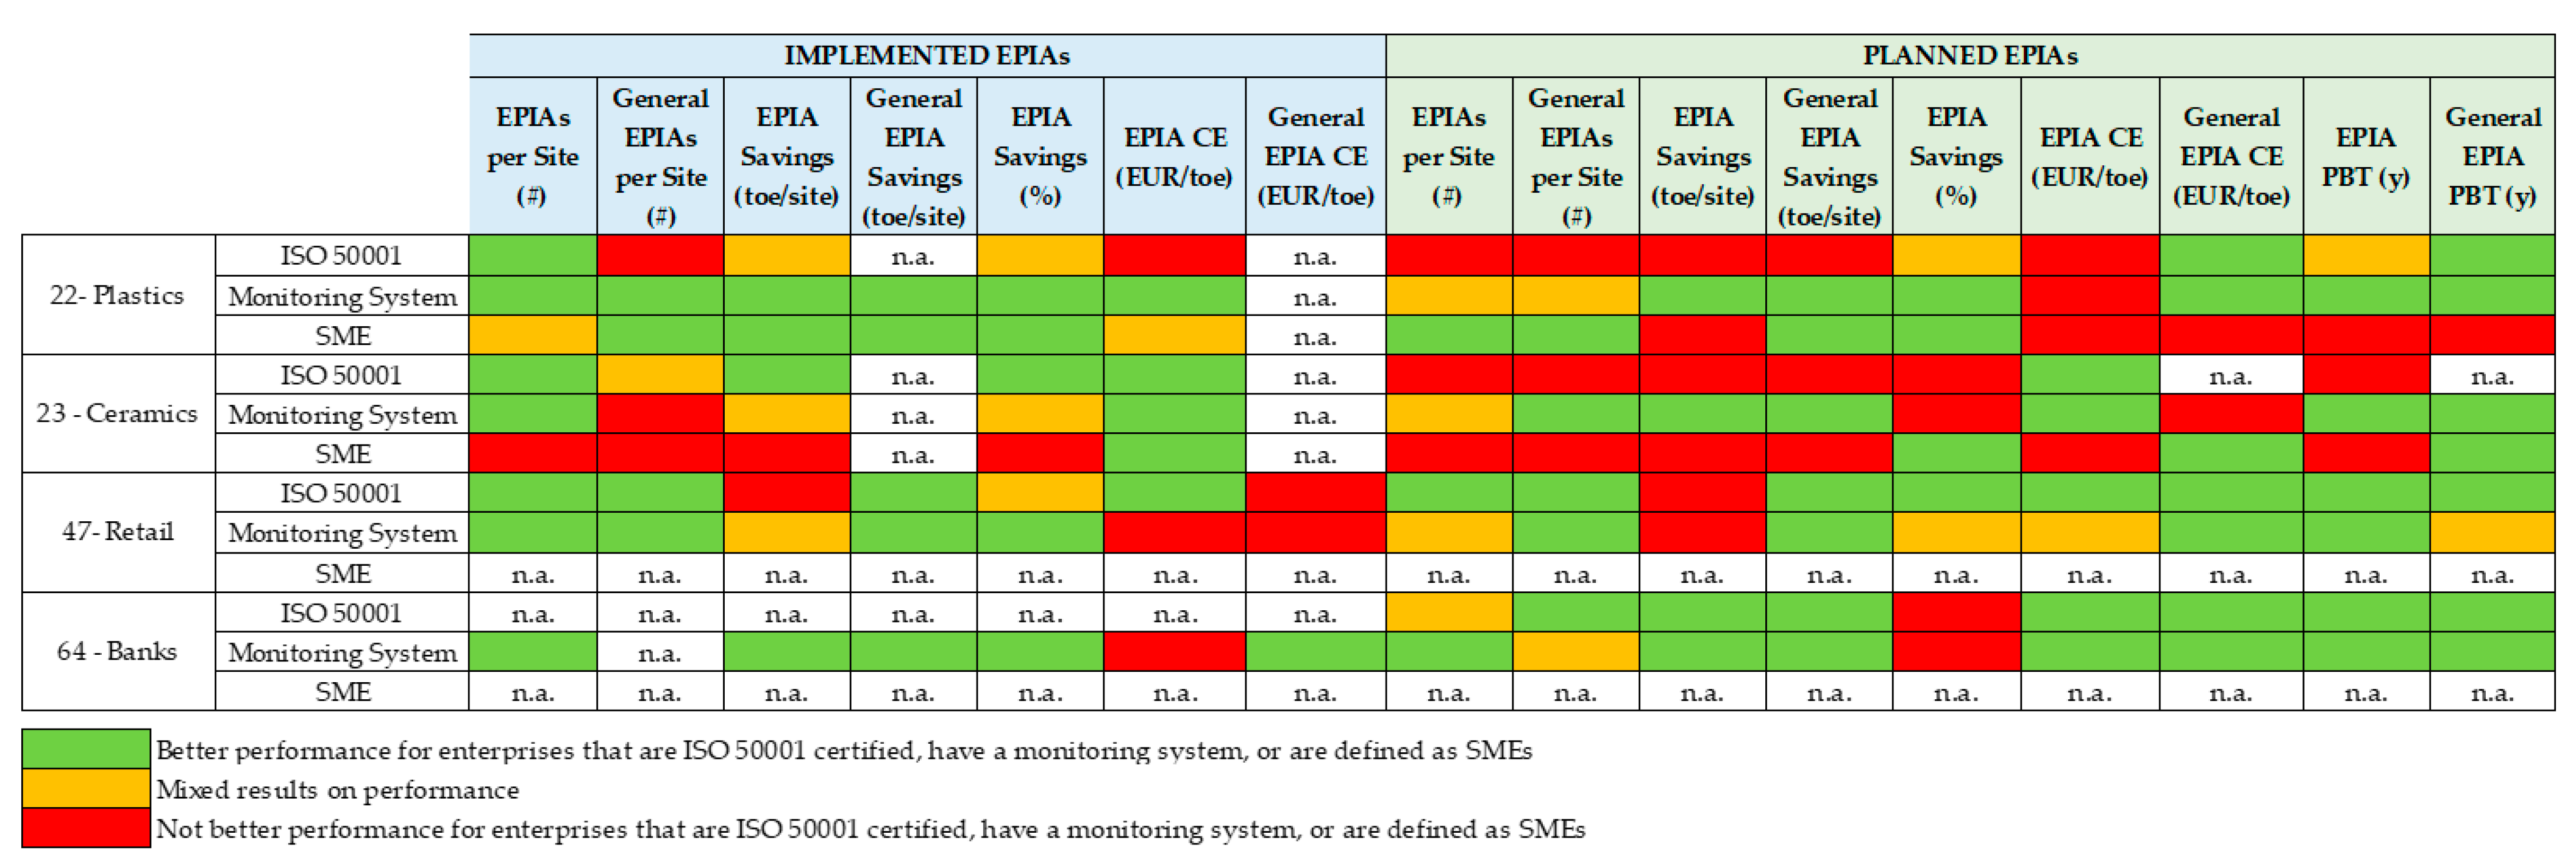
4. Results and Discussion
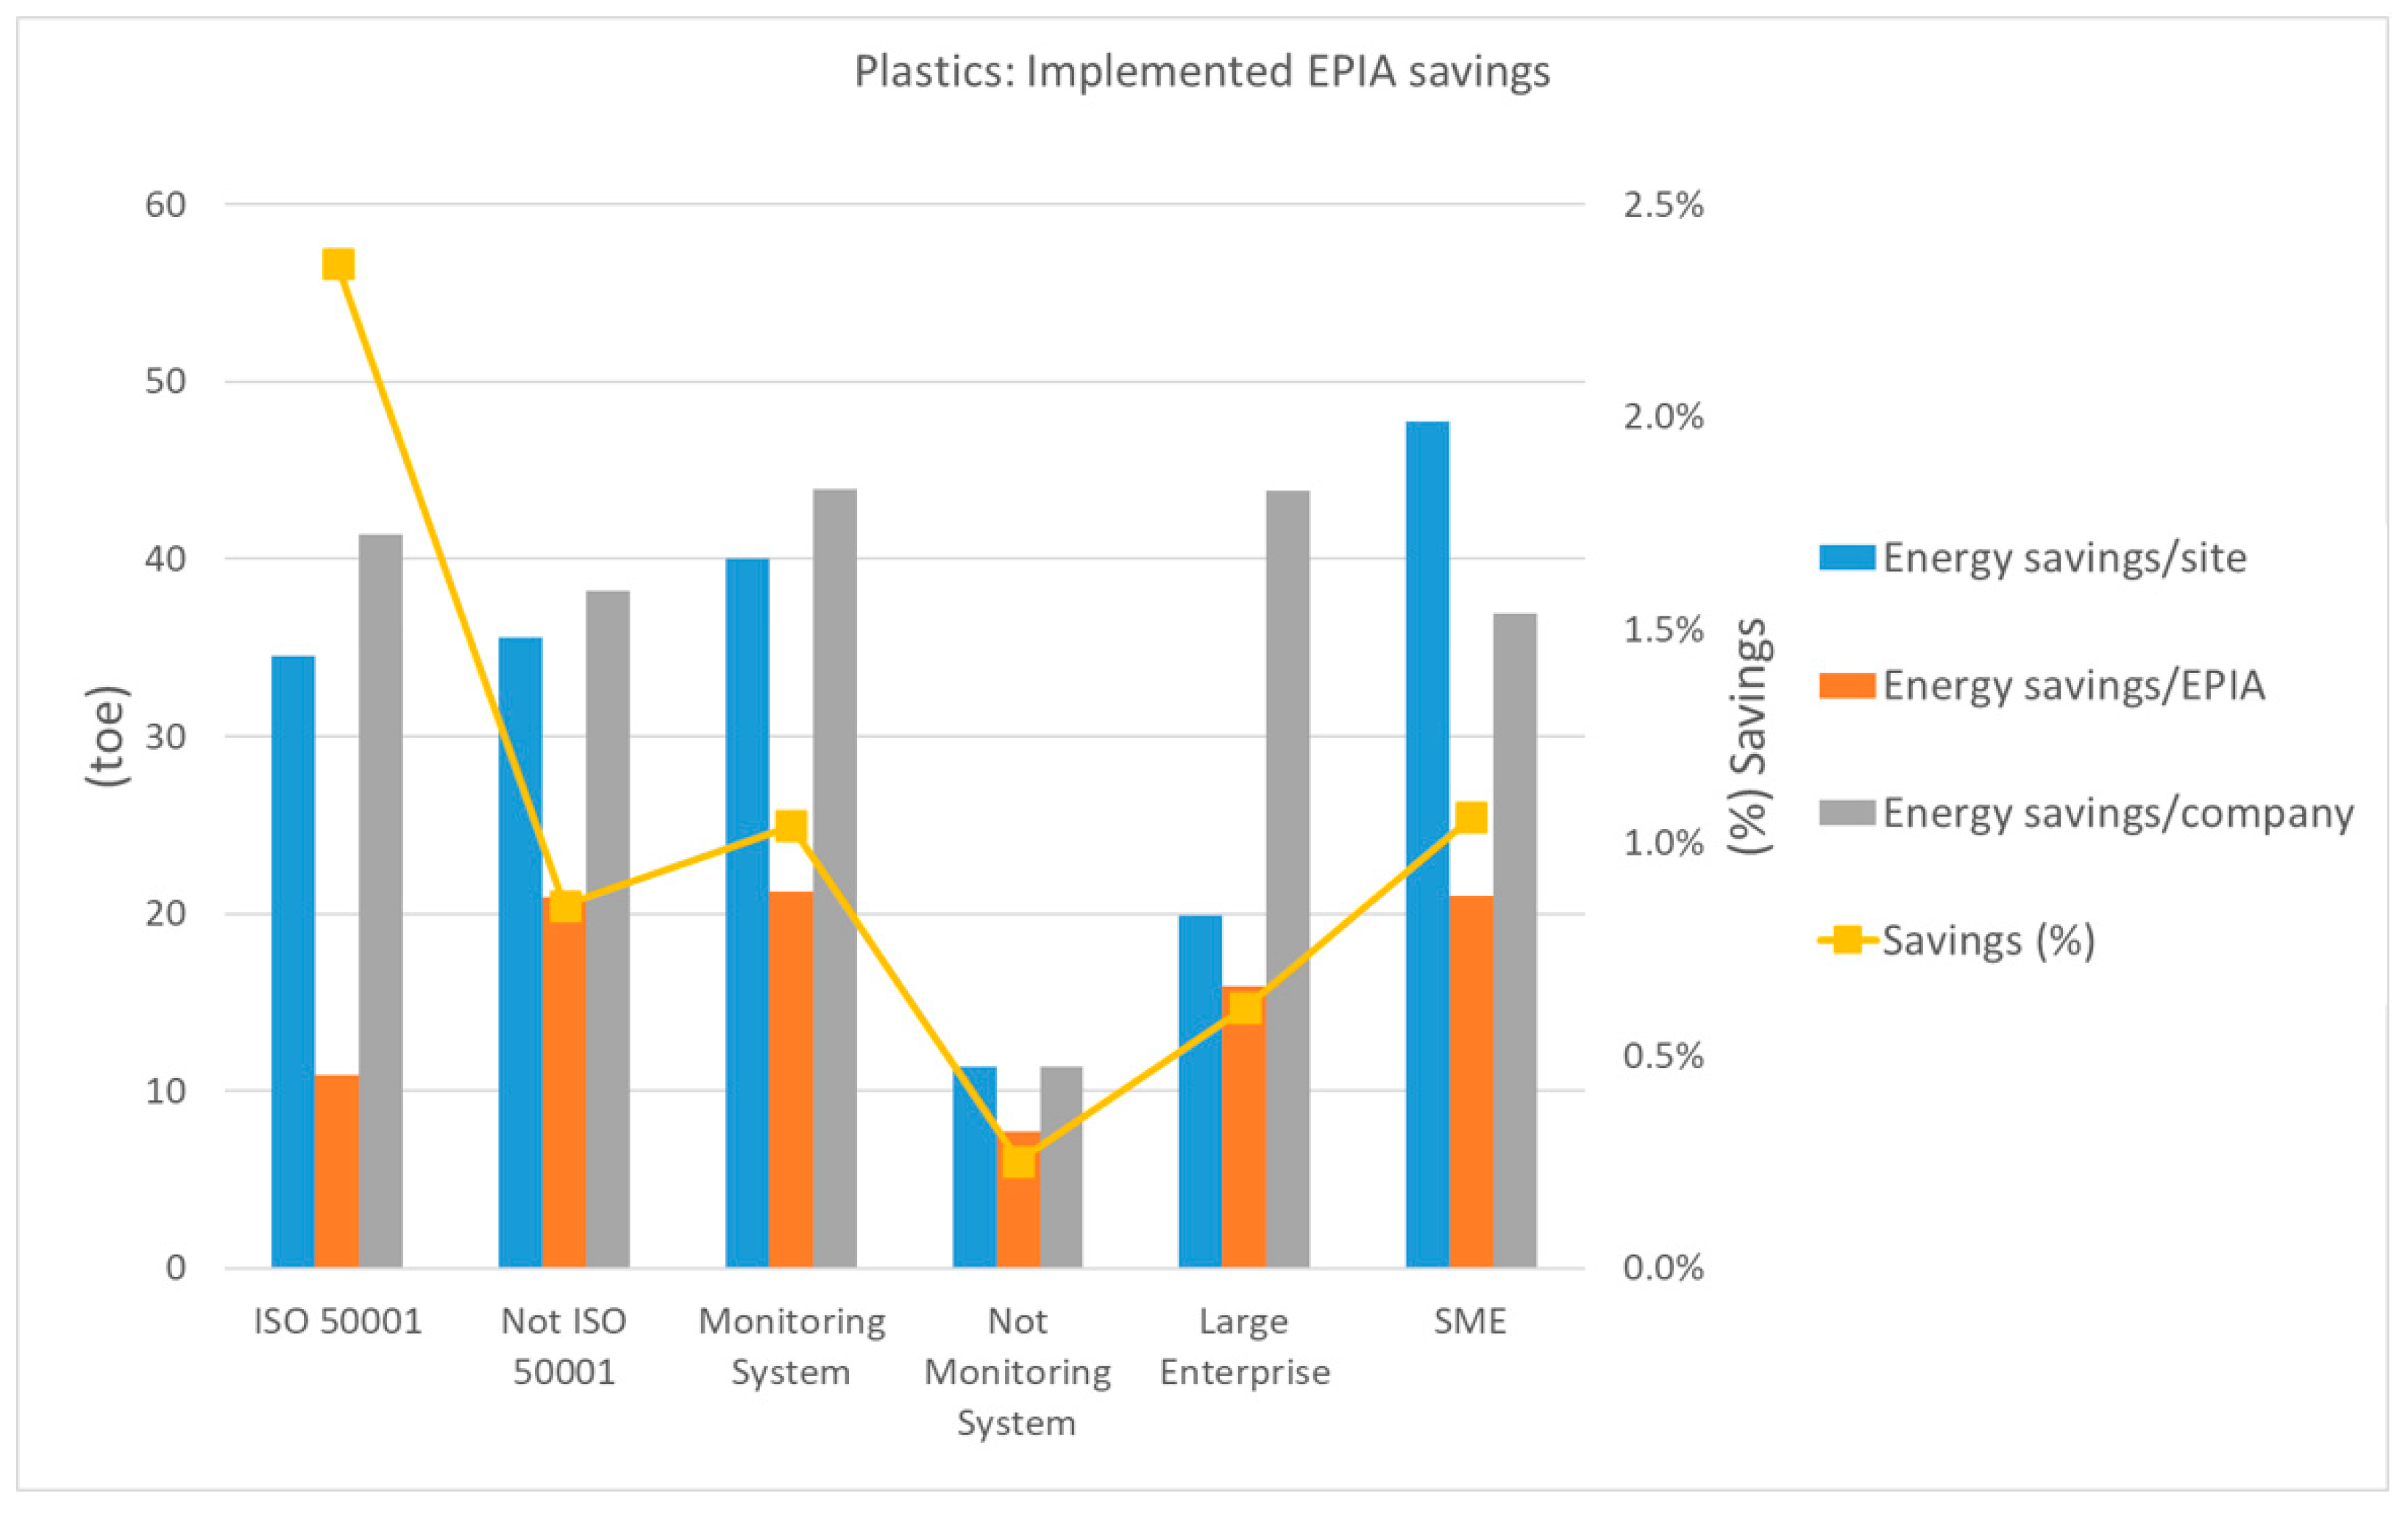
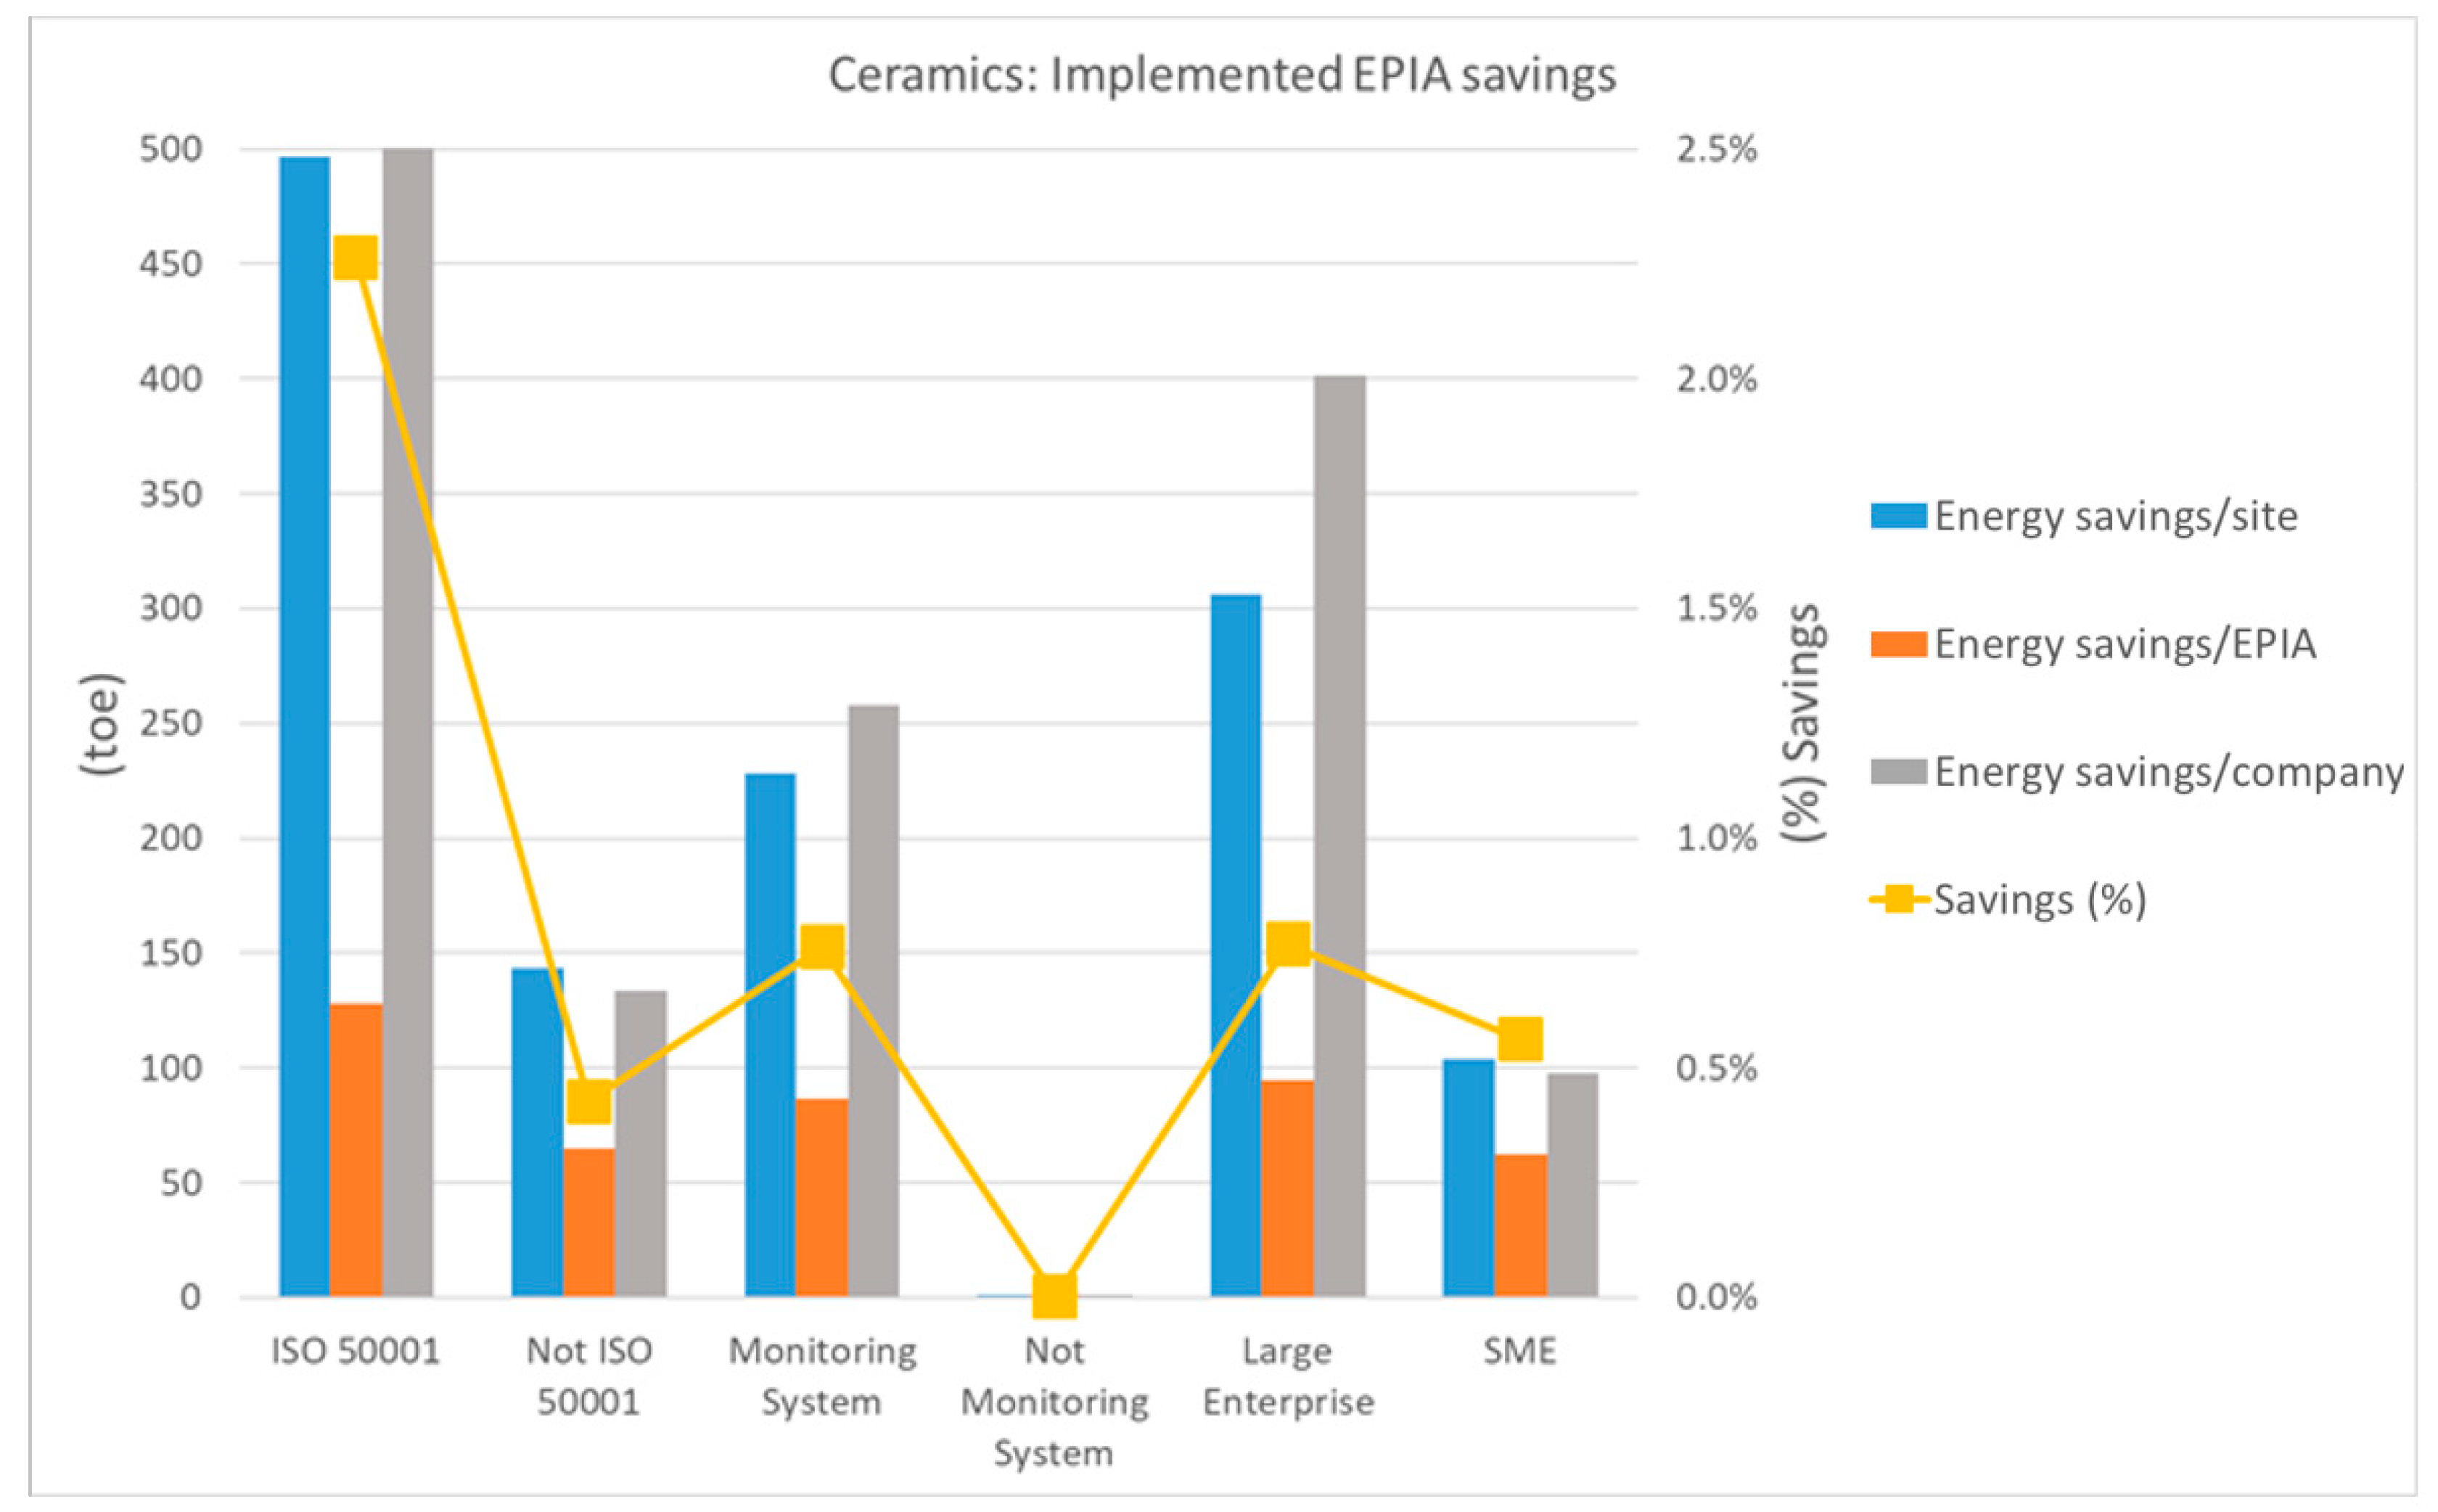
4.1. Ceramics and Plastics
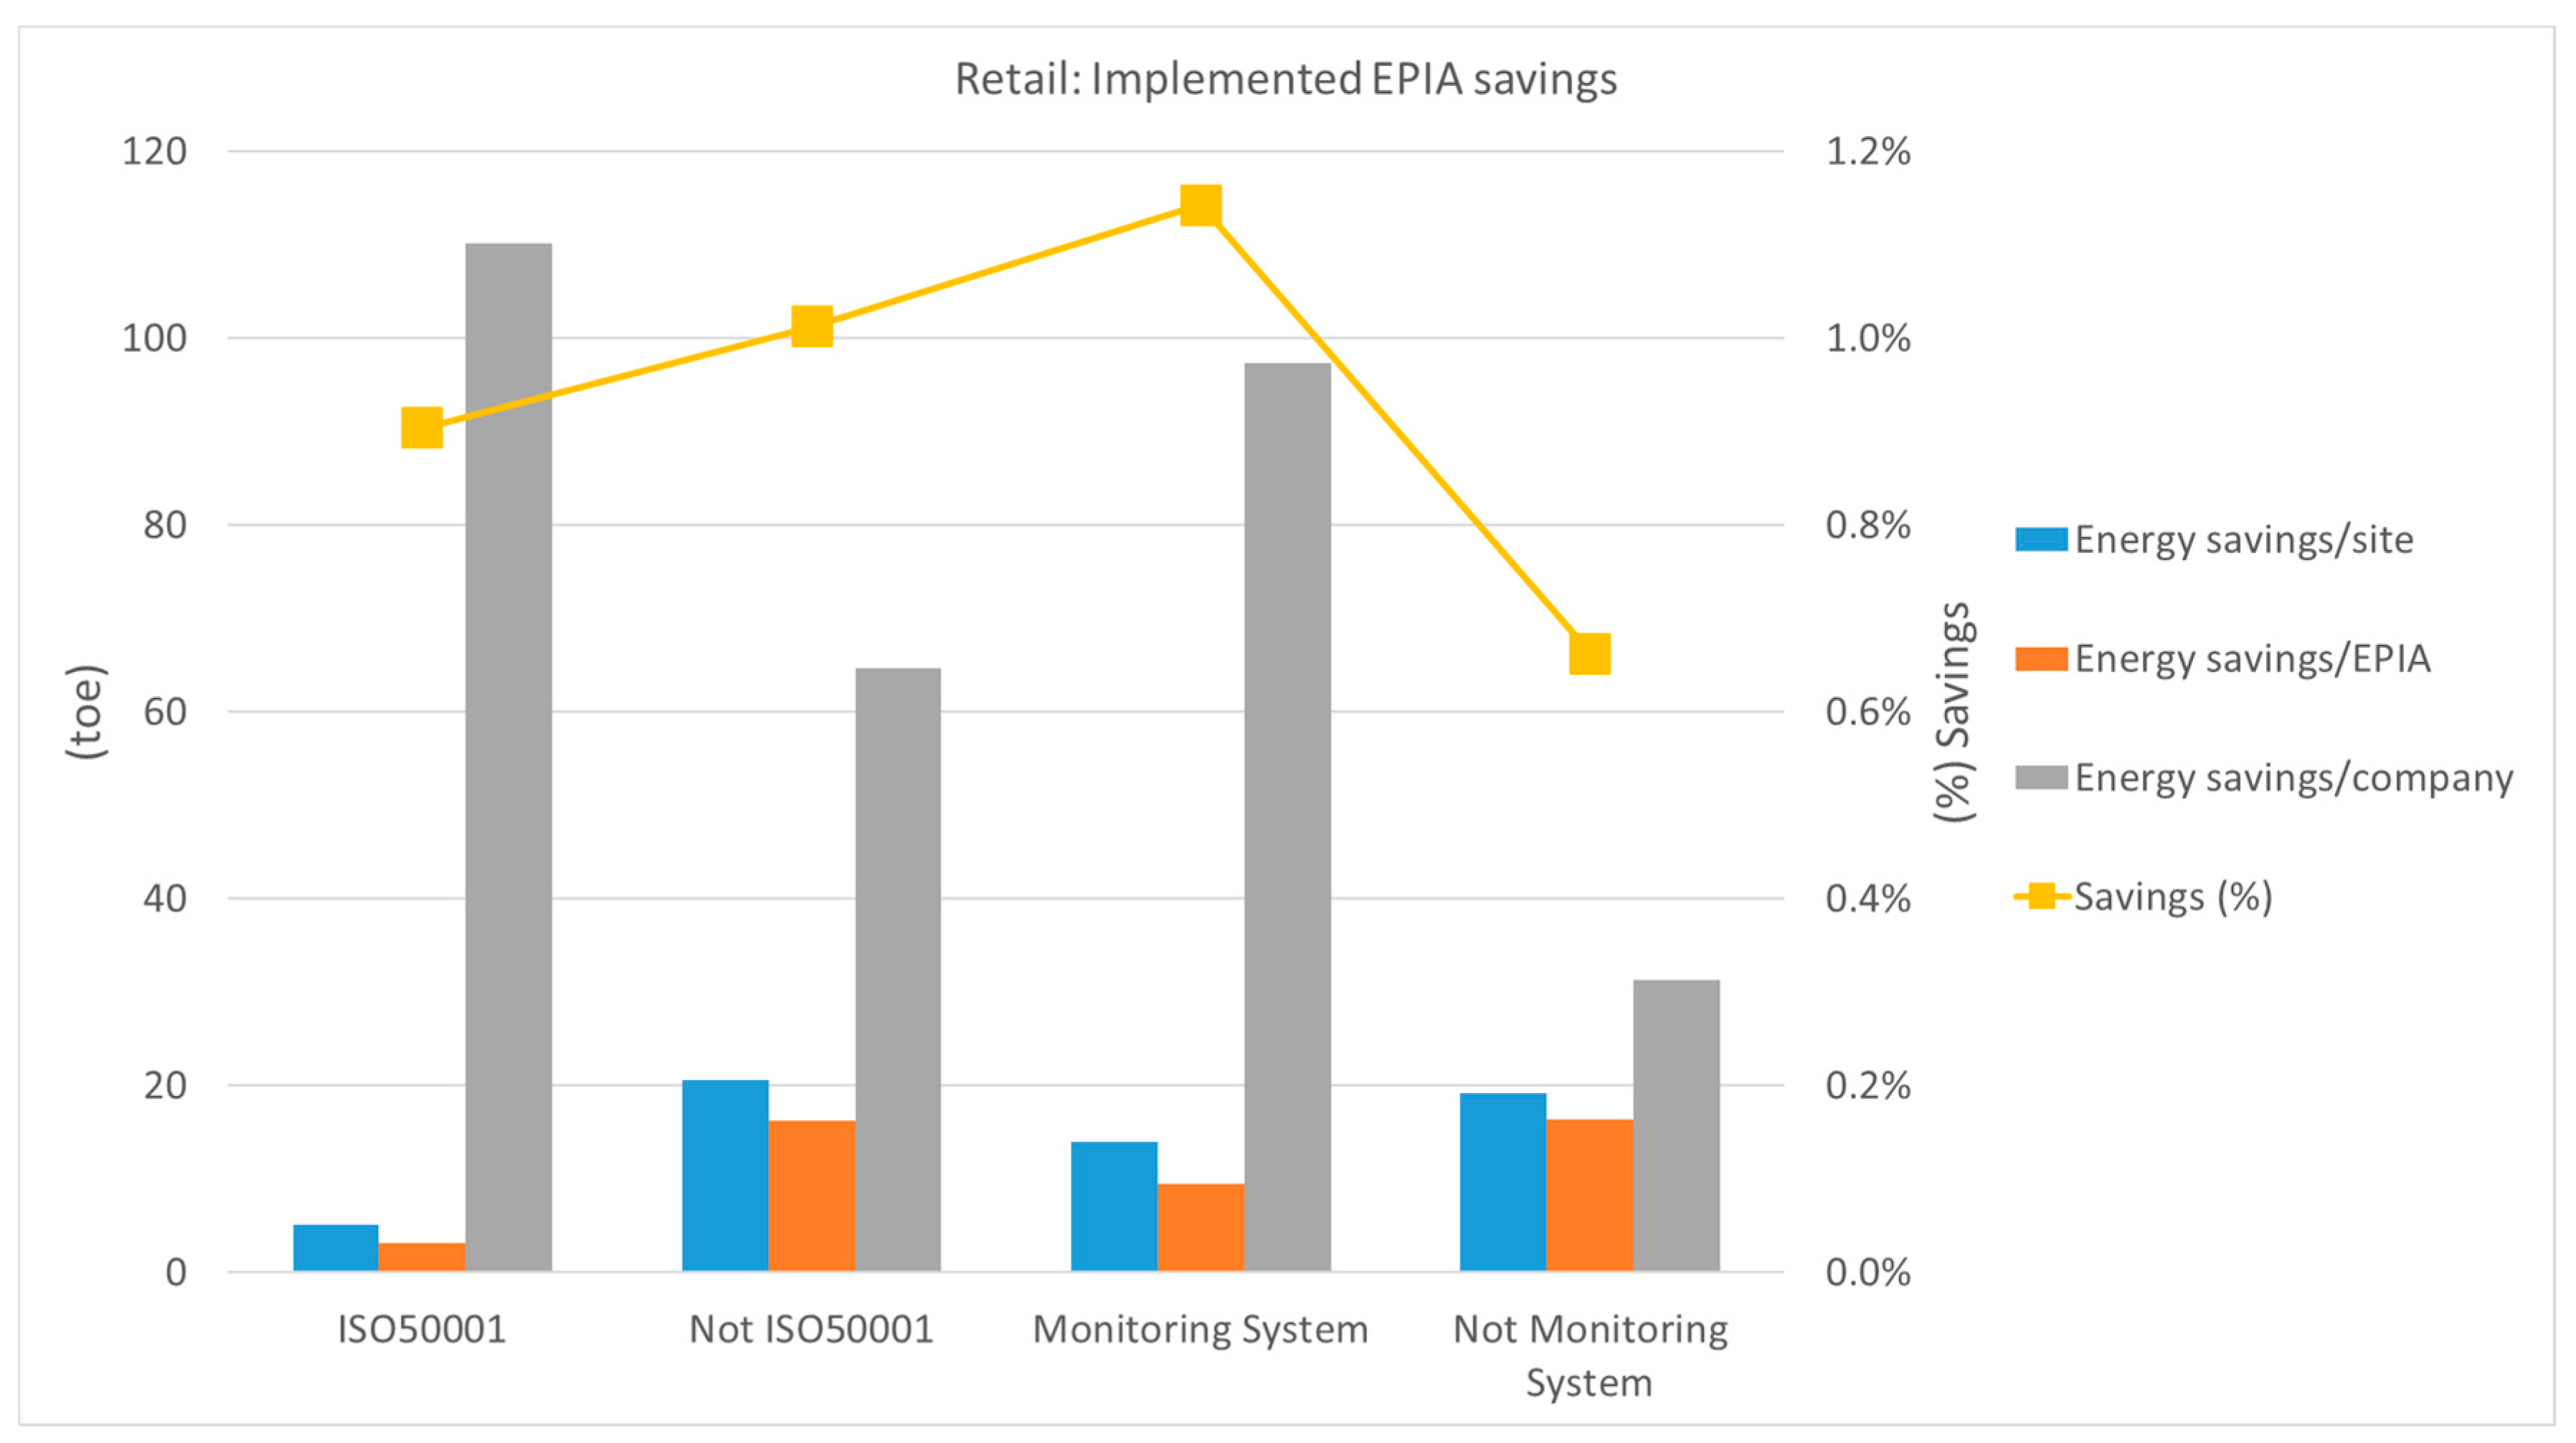
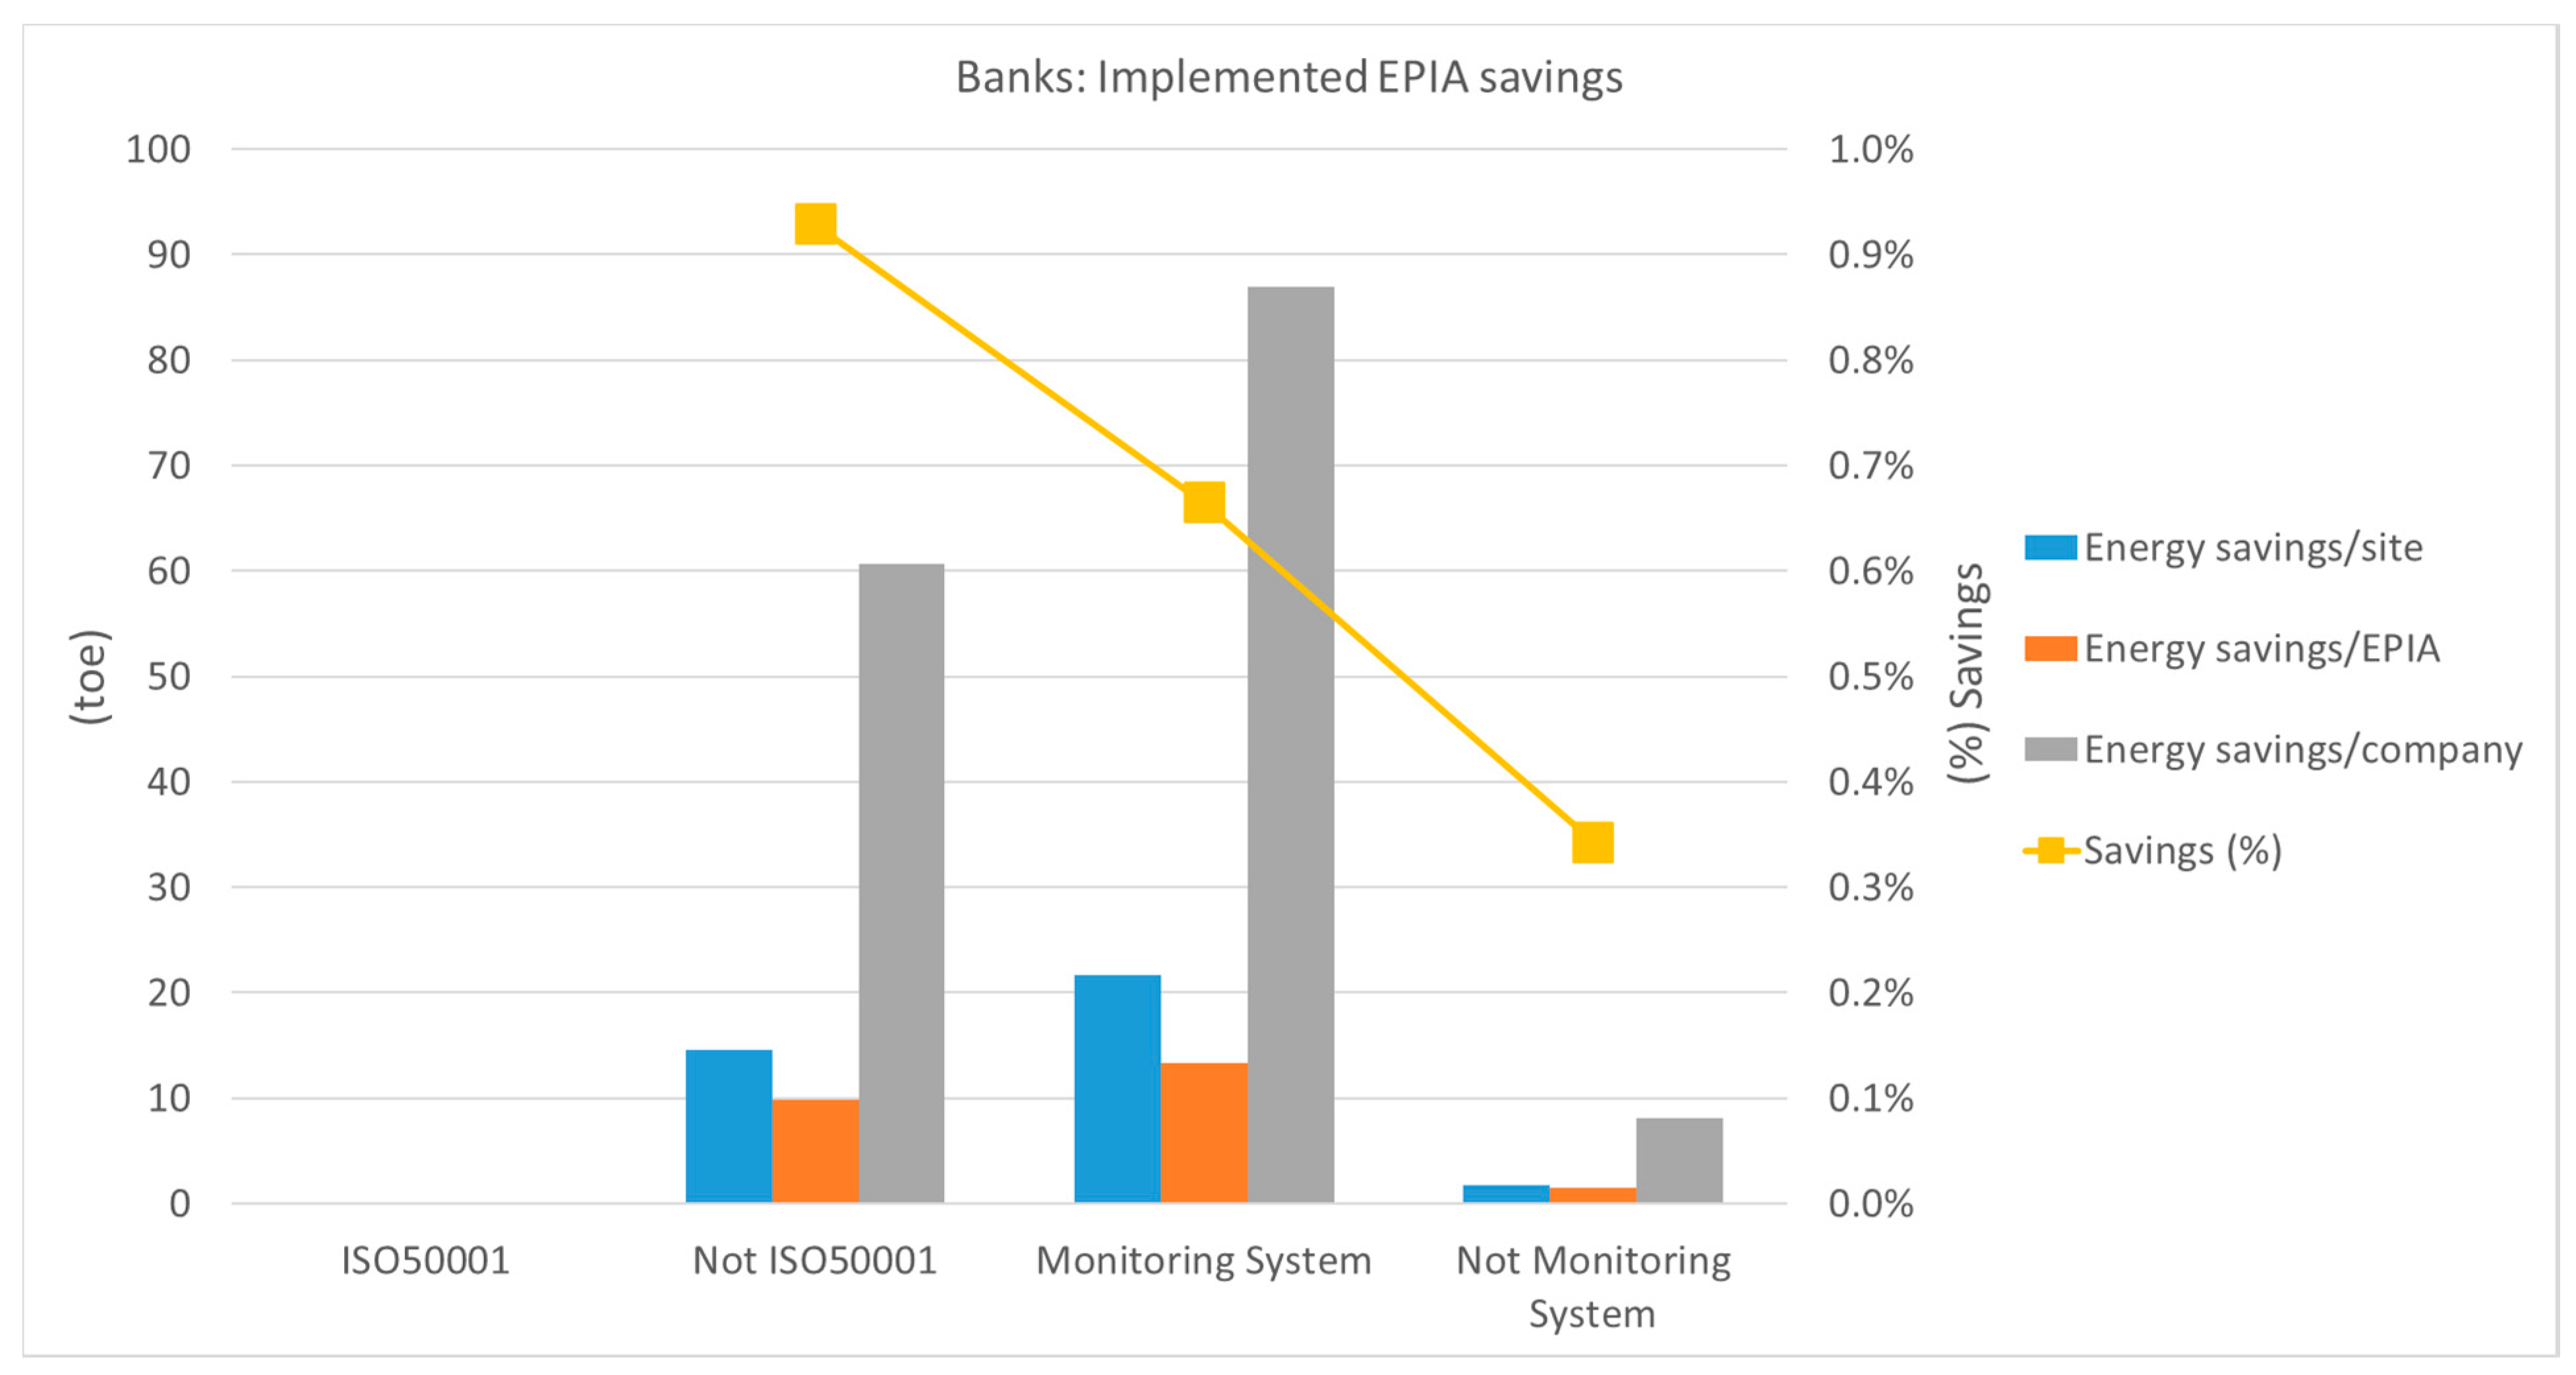
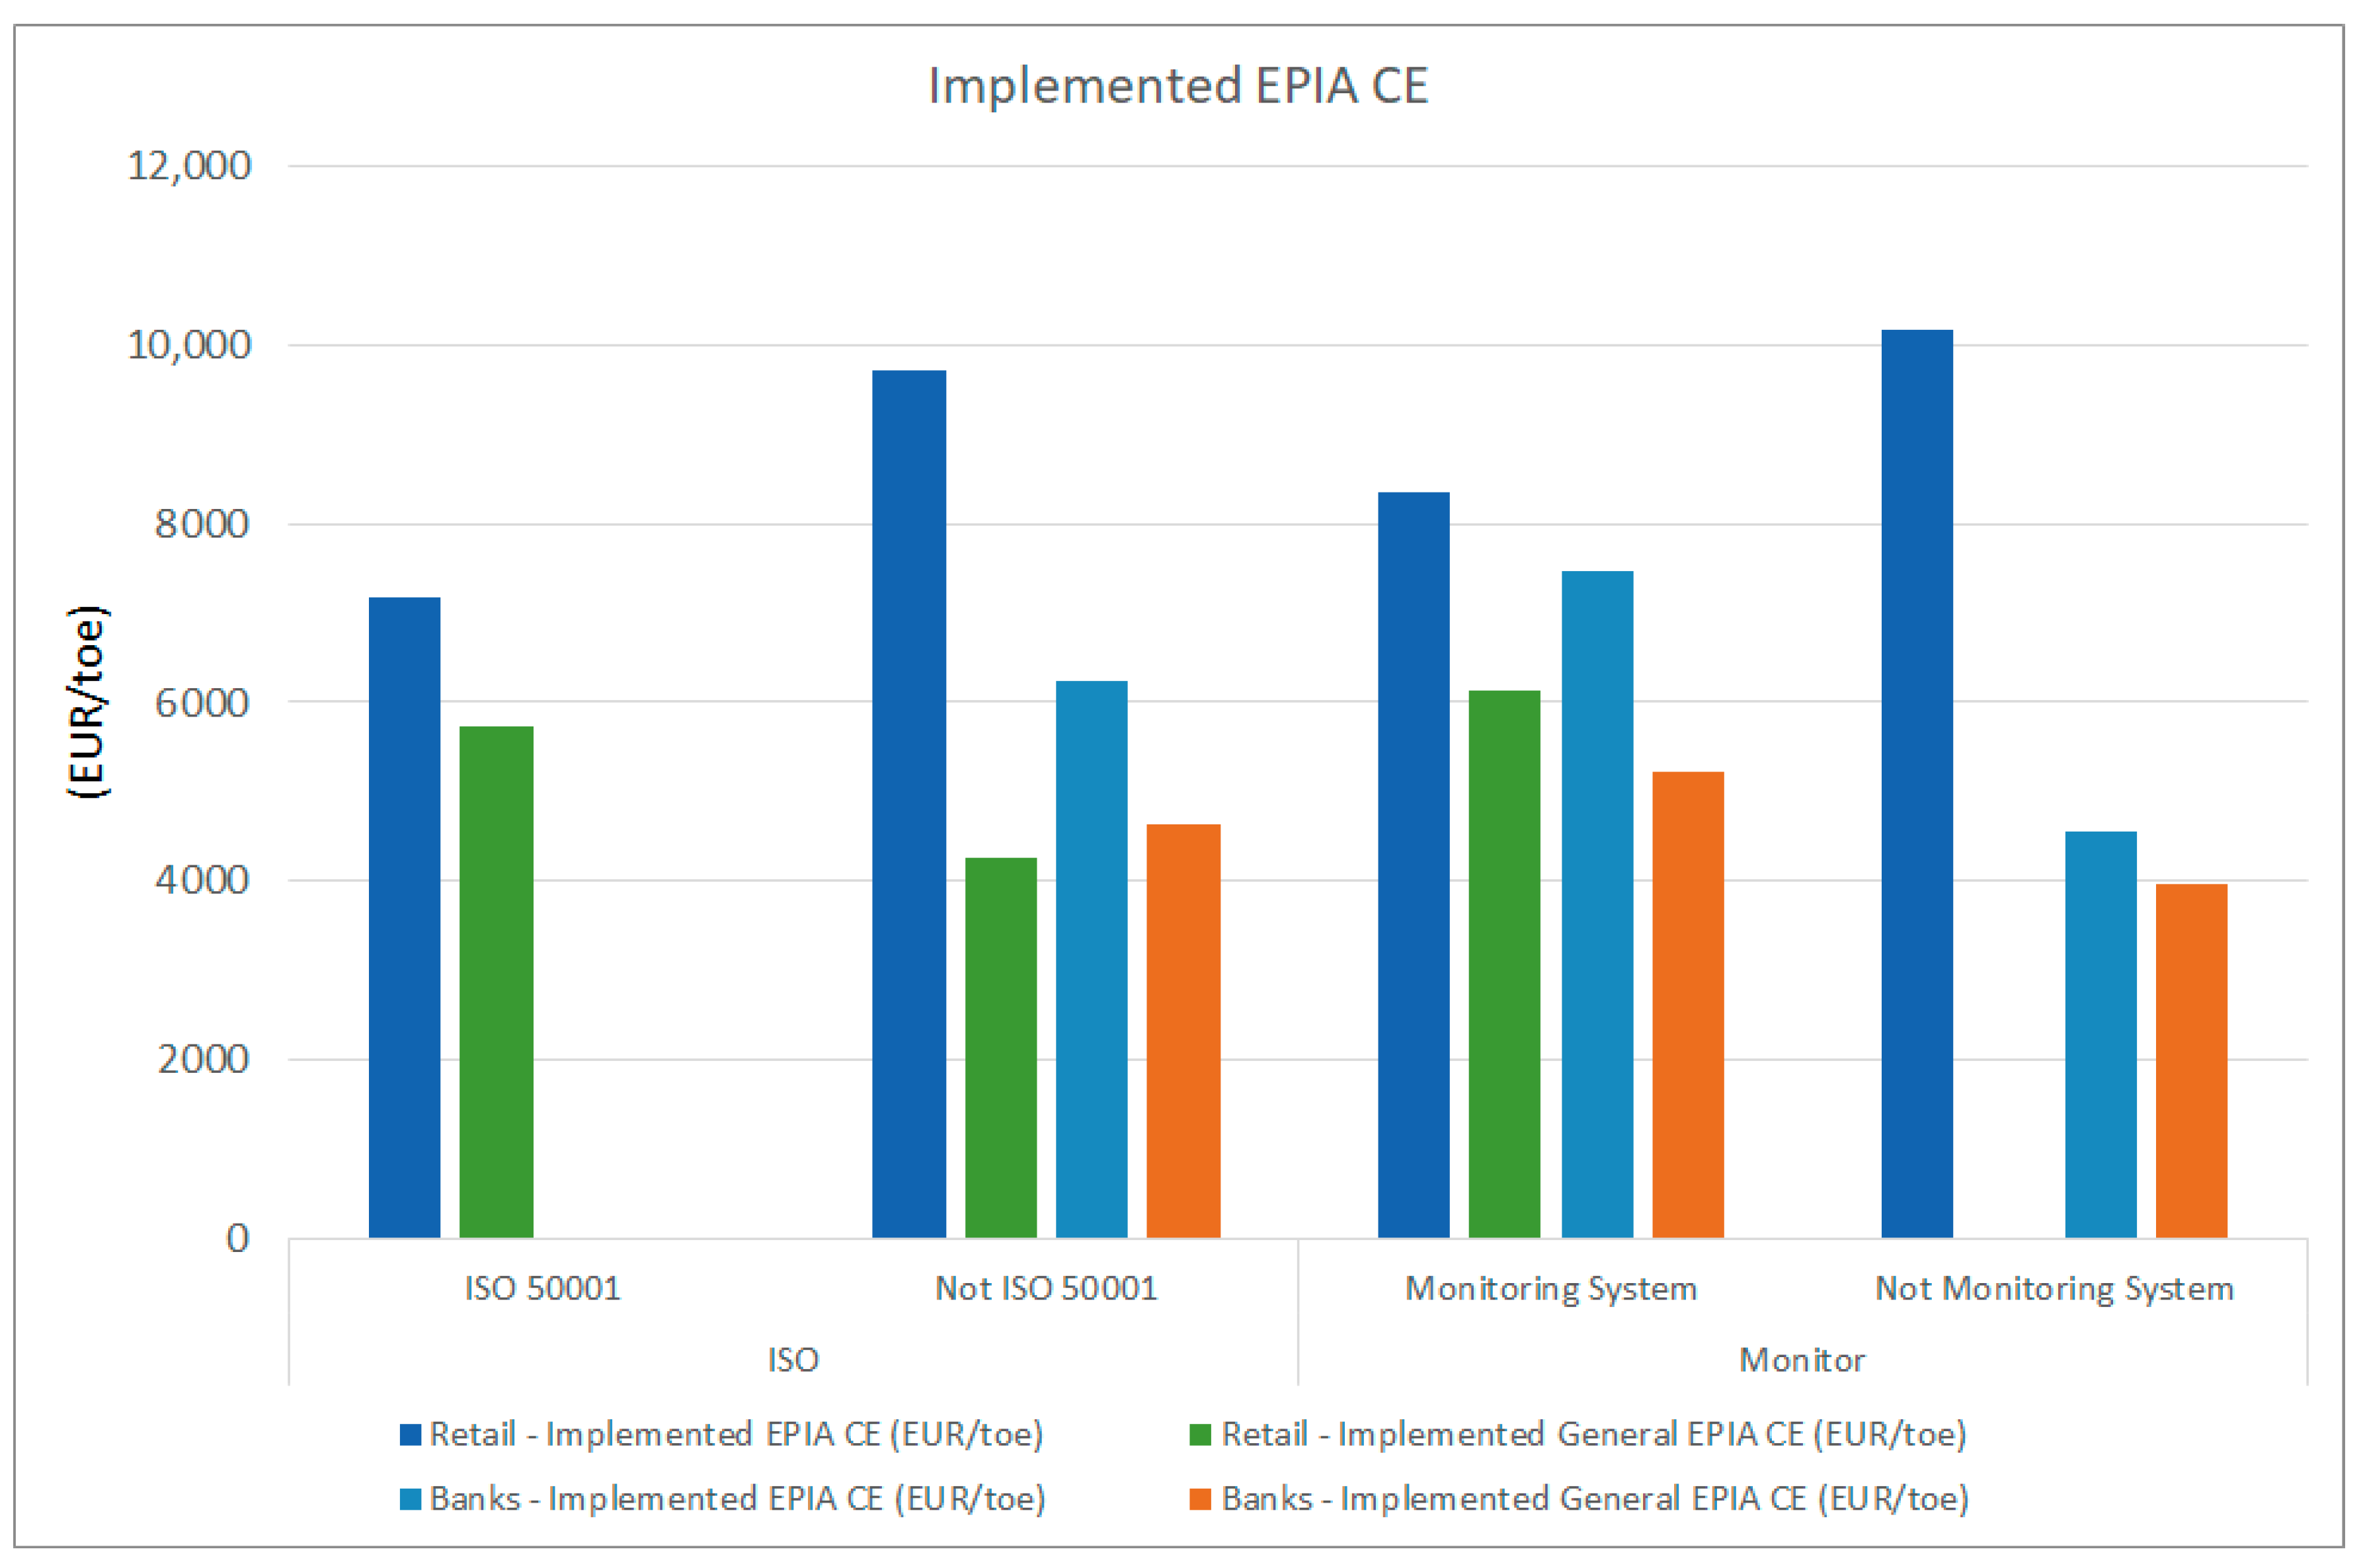
4.2. Banks and Retail
4.3. Synthesis
5. Conclusions
Author Contributions
Funding
Conflicts of Interest
Nomenclature
| EA | energy audit |
| AFNOR | French Standardization Association |
| CE | cost effectiveness (EUR/toe saved) |
| CEI | Italian Electrotechnical Committee |
| CHP | combined heat and power, cogeneration |
| CSEA | Environmental Energy Services Fund (in Italian, Cassa per i servizi energetici e ambientali) |
| CTI | Italian Thermotechnical Committee |
| EC | European Commission |
| EE | energy efficiency |
| EED | European Energy Efficiency Directive |
| EIB | European Investment Bank |
| EMS | environmental management systems (e.g., ISO 14001) |
| ENEA | Italian National Agency for New Technologies, Energy, and Sustainable Economic Development |
| EnMS | energy management system |
| EPIA | energy performance improved action |
| ESCO | energy service company |
| FIRE | Italian Federation for Energy Efficiency (in Italian, Federazione Italiana per l’uso Razionale dell’Energia) |
| HVAC | heating, ventilation, and air-conditioning |
| ISO | International Organization for Standardization |
| ISO 50001 | international standard on energy management systems |
| LE | large enterprise |
| LED | light-emitting diode |
| NACE | Statistical Classification of Economic Activities in the European Community |
| PBT | simple payback time (y) |
| RES | renewable energy source |
| SME | small and medium-sized enterprise |
| toe | tonne of oil equivalent (=41.868 GJ) |
Appendix A. Statistical Analysis

| Final Energy Consumption | Implemented EPIA Energy Savings (% vs. Consumptions) | General EPIA Energy Savings (% vs. All EPIA Savings) | |||||||
|---|---|---|---|---|---|---|---|---|---|
| 22—PLASTICS | EAs | Companies | (toe) | (%) | (toe) | (%) | (toe) | (%) | |
| ISO 50001 | 22 | 17 | 17,545 | 3% | 414 | 2.36% | - | 0.00% | |
| Not ISO 50001 | 569 | 509 | 559,669 | 97% | 4770 | 0.85% | - | 0.00% | |
| Monitoring System | 412 | 359 | 473,514 | 82% | 4923 | 1.04% | 185 | 3.76% | |
| Not Monitoring System | 179 | 167 | 103,699 | 18% | 261 | 0.25% | 22 | 8.28% | |
| Large Enterprise | 104 | 76 | 207,955 | 36% | 1272 | 0.61% | 29 | 2.31% | |
| SME | 487 | 450 | 369,259 | 64% | 3912 | 1.06% | 176 | 4.50% | |
| Total | 591 | 526 | 577,214 | 100% | 5184 | 0.90% | 206 | 3.97% | |
| 23—CERAMICS | EAs | Companies | (toe) | (%) | (toe) | (%) | (toe) | (%) | |
| ISO 50001 | 17 | 6 | 175,586 | 16% | 3974 | 2.26% | - | 0.00% | |
| Not ISO 50001 | 140 | 106 | 938,853 | 84% | 4012 | 0.43% | - | 0.00% | |
| Monitoring System | 133 | 91 | 1,047,030 | 94% | 7985 | 0.76% | - | 0.00% | |
| Not Monitoring System | 24 | 21 | 67,408 | 6% | 1 | 0.00% | - | 0.00% | |
| Large Enterprise | 69 | 32 | 836,010 | 75% | 6424 | 0.77% | - | 0.00% | |
| SME | 88 | 80 | 278,429 | 25% | 1562 | 0.56% | - | 0.00% | |
| Total | 157 | 112 | 1,114,438 | 100% | 7986 | 0.72% | 12 | 0.15% | |
| 47—RETAIL | EAs | Companies | (toe) | (%) | (toe) | (%) | (toe) | (%) | |
| ISO 50001 | 105 | 9 | 24,376 | 14% | 220 | 0.90% | 164 | 74.60% | |
| Not ISO 50001 | 604 | 167 | 146,813 | 86% | 1486 | 1.01% | 43 | 2.92% | |
| Monitoring System | 458 | 135 | 119,165 | 70% | 1362 | 1.14% | 208 | 15.26% | |
| Not Monitoring System | 251 | 41 | 52,024 | 30% | 345 | 0.66% | - | 0.00% | |
| Large Enterprise | 698 | 162 | 170,175 | 99% | 1706 | 1.00% | 208 | 12.18% | |
| SME | 11 | 14 | 1014 | 1% | - | 0.00% | - | - | |
| Total | 709 | 176 | 171,189 | 100% | 1706 | 1.00% | 208 | 12.18% | |
| 64—BANKS | EAs | Companies | (toe) | (%) | (toe) | (%) | (toe) | (%) | |
| ISO 50001 | 40 | 2 | 17,838 | 31% | - | 0.00% | - | - | |
| Not ISO 50001 | 238 | 51 | 39,208 | 69% | 364 | 0.93% | 175 | 47.92% | |
| Monitoring System | 147 | 13 | 52,293 | 92% | 348 | 0.67% | 161 | 46.21% | |
| Not Monitoring System | 131 | 40 | 4752 | 8% | 16 | 0.34% | 14 | 84.41% | |
| Large Enterprise | 275 | 52 | 56,970 | 100% | 361 | 0.63% | 174 | 48.13% | |
| SME | 3 | 1 | 76 | 0% | 3 | 4.53% | 1 | 26.22% | |
| Total | 278 | 53 | 57,046 | 100% | 364 | 0.64% | 175 | 47.92% | |
| IMPLEMENTED | PLANNED | ||||||||||||
|---|---|---|---|---|---|---|---|---|---|---|---|---|---|
| 22—PLASTICS | Sites with EPIA Data | EPIAs with Savings Data | General EPIAs with Savings Data | Sites with EPIA Data | EPIAs with Savings Data | General EPIAs with Savings Data | |||||||
| (#) | (%) | (#) | (%) | (#) | (%) | (#) | (%) | (#) | (%) | (#) | (%) | ||
| ISO 50001 | 12 | 63.6% | 49 | 77.6% | 1 | 33.3% | 22 | 100% | 52 | 91.2% | 5 | 71.4% | |
| Not ISO 50001 | 134 | 39.2% | 509 | 44.8% | 16 | 20.3% | 513 | 90.2% | 1426 | 89.5% | 215 | 71.4% | |
| Monitoring System | 123 | 47.3% | 478 | 48.5% | 17 | 22.4% | 371 | 90.0% | 1018 | 88.8% | 137 | 69.2% | |
| Not Monitoring | 23 | 23.5% | 80 | 42.5% | 0 | 0.0% | 164 | 91.6% | 460 | 91.3% | 83 | 75.5% | |
| Large Cos | 64 | 49.0% | 117 | 68.4% | 2 | 14.3% | 94 | 90.4% | 148 | 58.7% | 24 | 77.4% | |
| SME | 82 | 38.2% | 441 | 42.2% | 15 | 22.1% | 441 | 90.6% | 1330 | 95.1% | 196 | 70.8% | |
| Total | 146 | 40.1% | 558 | 47.7% | 17 | 20.7% | 535 | 90.5% | 1478 | 89.5% | 220 | 71.4% | |
| 23—CERAMICS | Sites with EPIA Data | EPIAs with Savings Data | General EPIAs with Savings Data | Sites with EPIA Data | EPIAs with Savings Data | General EPIAs with Savings Data | |||||||
| (#) | (%) | (#) | (%) | (#) | (%) | (#) | (%) | (#) | (%) | (#) | (%) | ||
| ISO 50001 | 8 | 82.4% | 37 | 83.8% | 0 | 0.0% | 11 | 64.7% | 14 | 100% | 0 | n.a. | |
| Not ISO 50001 | 28 | 54.3% | 181 | 34.3% | 4 | 16.7% | 131 | 93.6% | 401 | 83.5% | 32 | 44.4% | |
| Monitoring System | 35 | 59.4% | 193 | 47.7% | 4 | 19.0% | 119 | 89.5% | 346 | 83.6% | 28 | 45.2% | |
| Not Monitoring | 1 | 45.8% | 25 | 4.0% | 0 | 0.0% | 23 | 95.8% | 69 | 86.3% | 4 | 40.0% | |
| Large Cos | 21 | 71.0% | 133 | 51.1% | 2 | 10.5% | 65 | 94.2% | 196 | 79.4% | 14 | 33.3% | |
| SME | 15 | 46.6% | 85 | 29.4% | 2 | 20.0% | 77 | 87.5% | 219 | 88.7% | 18 | 60.0% | |
| Total | 36 | 57.3% | 218 | 42.7% | 4 | 13.8% | 142 | 90.4% | 415 | 84.0% | 32 | 44.4% | |
| 47—RETAIL | Sites with EPIA Data | EPIAs with Savings Data | General EPIAs with Savings Data | Sites with EPIA Data | EPIAs with Savings Data | General EPIAs with Savings Data | |||||||
| (#) | (%) | (#) | (%) | (#) | (%) | (#) | (%) | (#) | (%) | (#) | (%) | ||
| ISO 50001 | 43 | 41.0% | 72 | 100% | 58 | 100% | 97 | 92.4% | 339 | 99.7% | 106 | 100% | |
| Not ISO 50001 | 90 | 14.9% | 92 | 76.0% | 6 | 42.9% | 361 | 59.8% | 864 | 99.3% | 86 | 97.7% | |
| Monitoring System | 110 | 24.0% | 143 | 87.2% | 64 | 88.9% | 331 | 72.3% | 881 | 99.9% | 167 | 98.8% | |
| Not Monitoring | 23 | 9.2% | 21 | 72.4% | 0 | n.a. | 127 | 50.6% | 322 | 98.2% | 25 | 100% | |
| Large Cos | 133 | 19.1% | 164 | 85.0% | 64 | 88.9% | 454 | 65.0% | 1186 | 99.4% | 188 | 99.5% | |
| SME | 0 | n.a | 0 | n.a | 0 | n.a. | 4 | 36.4% | 17 | 100% | 4 | 80.0% | |
| Total | 133 | 18.8% | 164 | 85.0% | 64 | 88.9% | 458 | 64.6% | 1203 | 99.4% | 192 | 99.0% | |
| 64—BANKS | Sites with EPIA Data | EPIAS with Savings Data | General EPIAs with Savings Data | Sites with EPIA Data | EPIAS with Savings Data | General EPIAs with Savings Data | |||||||
| (#) | (%) | (#) | (%) | (#) | (%) | (#) | (%) | (#) | (%) | (#) | (%) | ||
| ISO 50001 | 14 | 35.0% | 0 | 0.0% | 1 | 20.0% | 37 | 92.5% | 100 | 81.3% | 21 | 58.3% | |
| Not ISO 50001 | 33 | 13.9% | 37 | 66.1% | 16 | 76.2% | 154 | 64.7% | 482 | 92.5% | 83 | 89.2% | |
| Monitoring System | 14 | 9.5% | 26 | 45.6% | 9 | 50.0% | 98 | 66.7% | 317 | 85.4% | 45 | 69.2% | |
| Not Monitoring | 33 | 25.2% | 11 | 42.3% | 8 | 100% | 93 | 71.0% | 265 | 97.1% | 59 | 92.2% | |
| Large Cos | 45 | 16.4% | 33 | 41.8% | 16 | 64.0% | 188 | 68.4% | 578 | 90.3% | 104 | 80.6% | |
| SME | 2 | 66.7% | 4 | 100% | 1 | 100% | 3 | 100% | 4 | 100% | 0 | n.a. | |
| Total | 47 | 16.9% | 37 | 44.6% | 17 | 65.4% | 191 | 68.7% | 582 | 90.4% | 104 | 80.6% | |
| IMPLEMENTED EPIAs | ||||||
|---|---|---|---|---|---|---|
| EPIA CE (EUR/toe) | General EPIA CE (EUR/toe) | Investment per Site (EUR) | ||||
| MEAN | SD | MEAN | SD | MEAN | SD | |
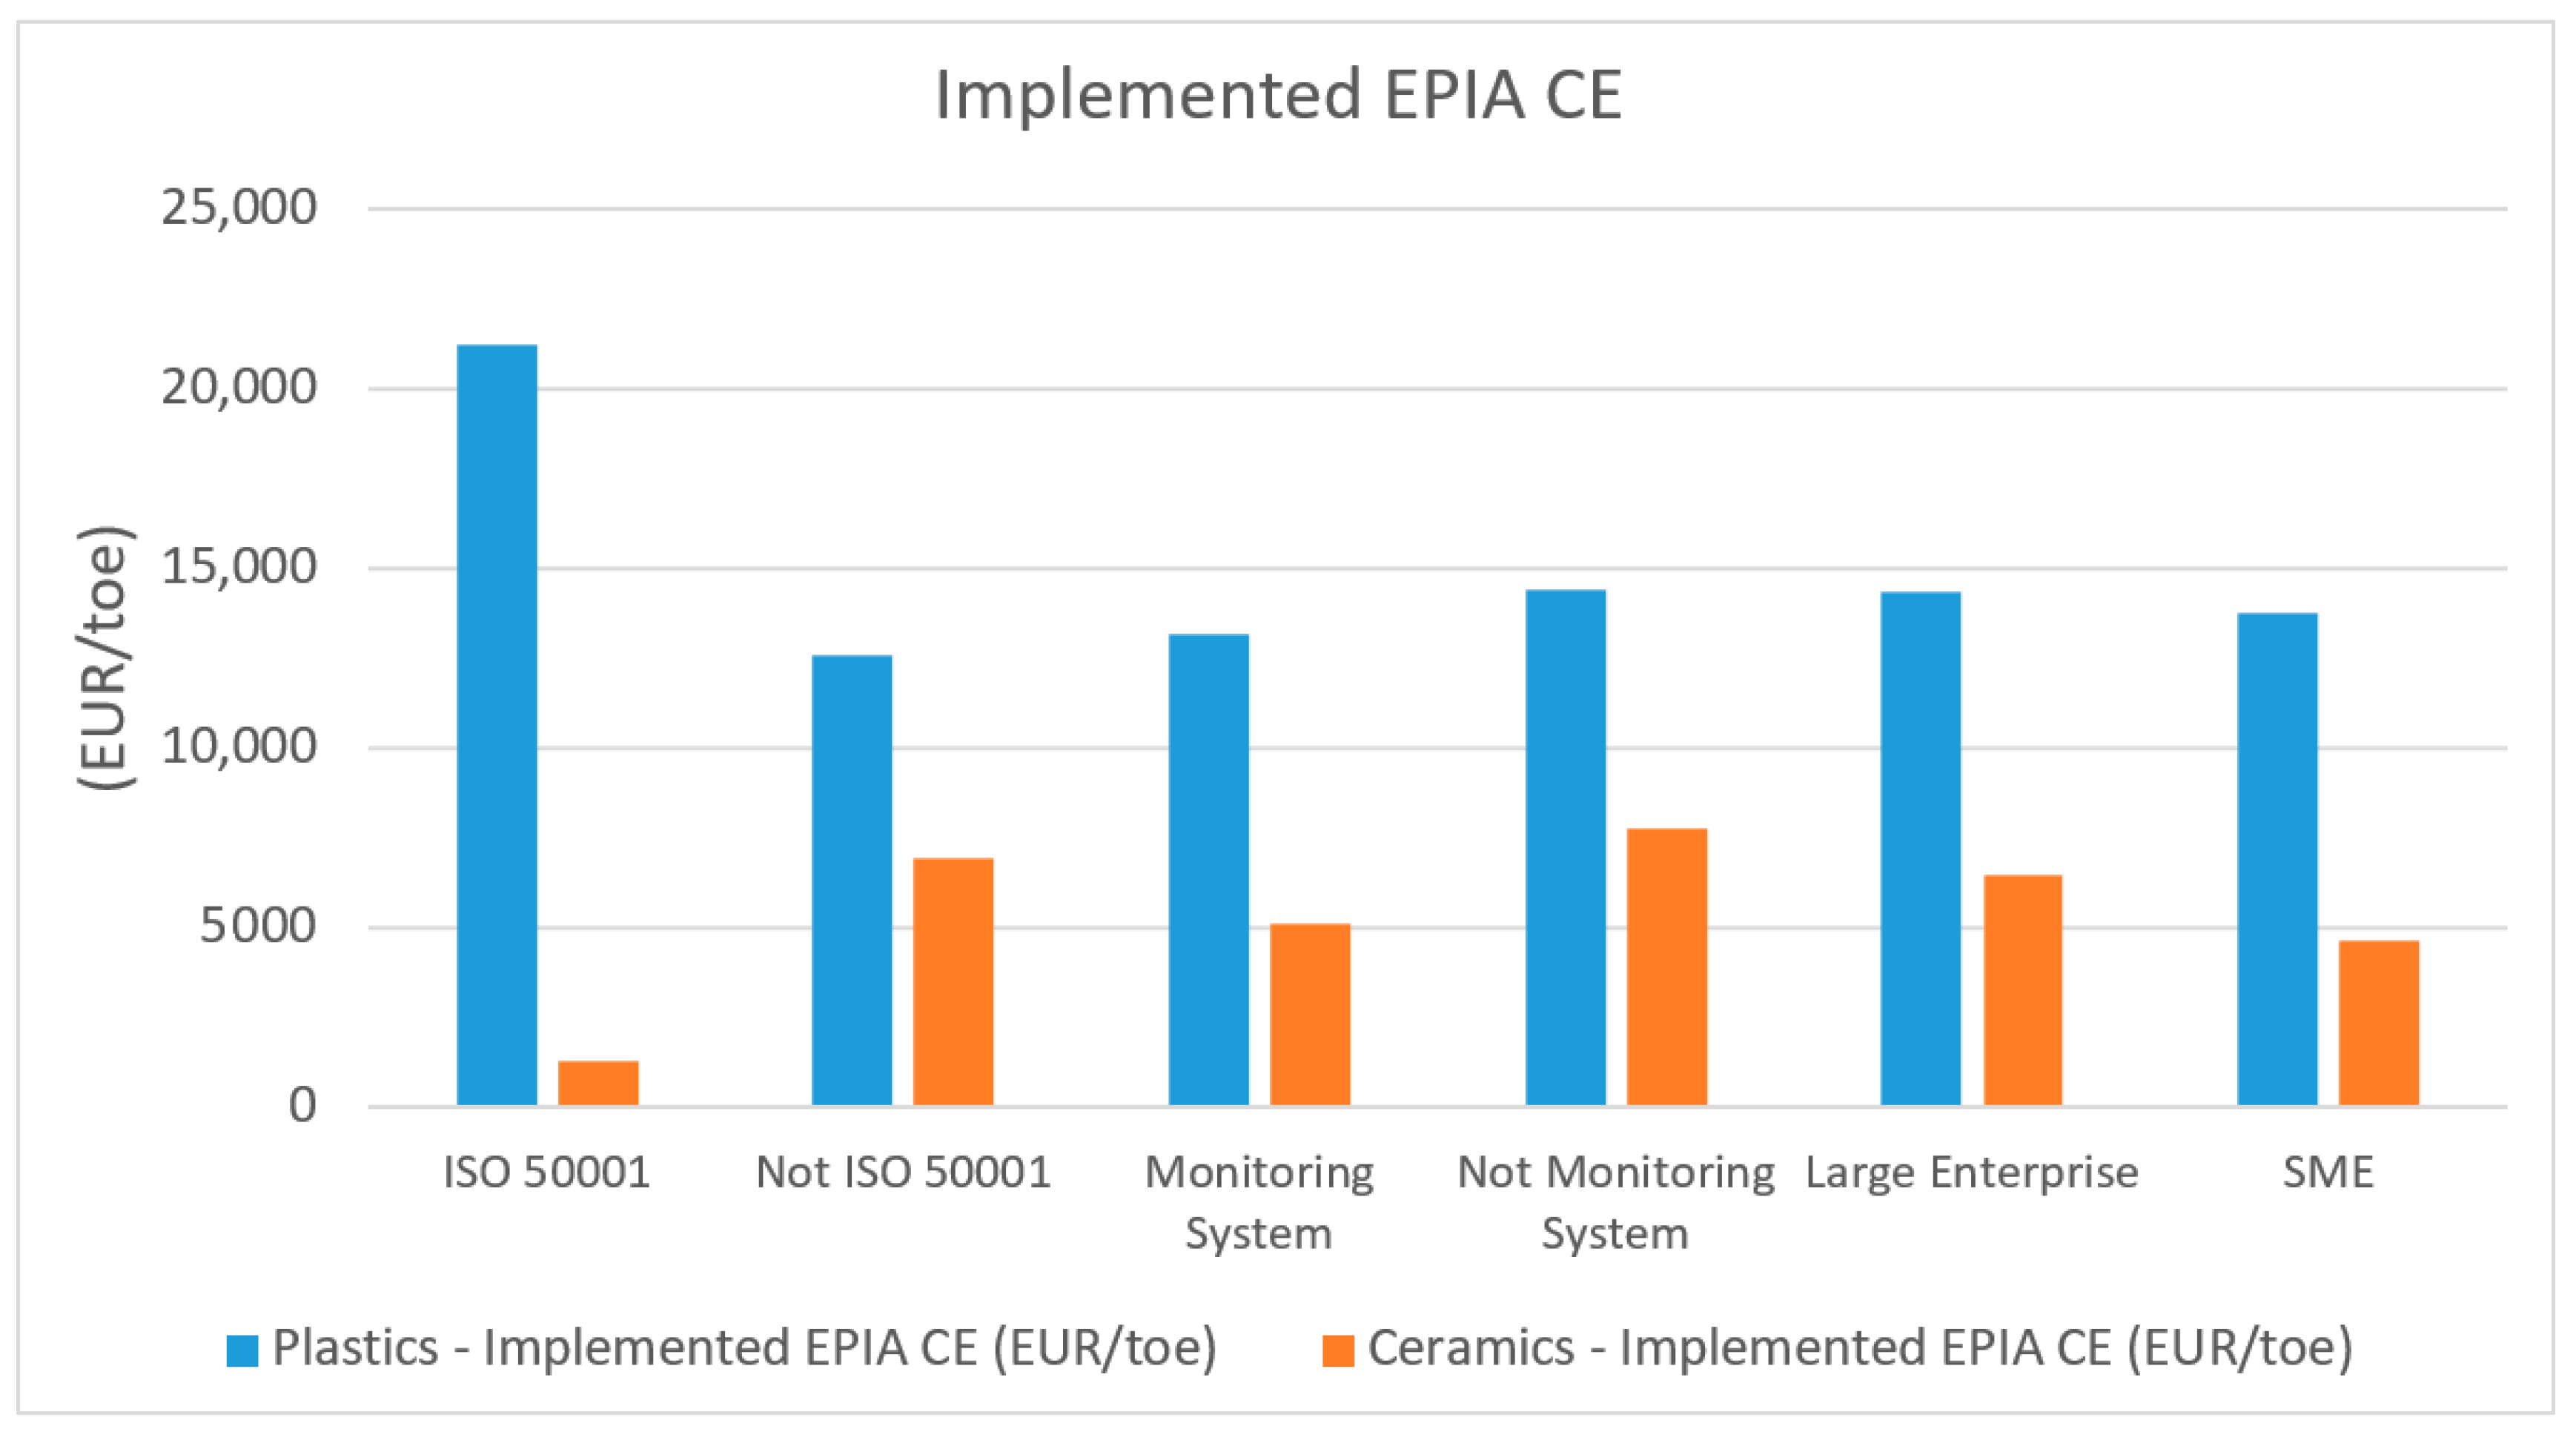
| 22—Plastics Total | 14,254 | 24,468 | 8098 | 8392 | 370,991 | 664,765 |
| 23—Ceramics Total | 6552 | 12,747 | n.a. | n.a. | 482,053 | 1,099,639 |
| 47—Retail Total | 8584 | 6878 | 5804 | 4571 | 81,629 | 148,132 |
| 64—Banks Total | 6238 | 8271 | 4640 | 7313 | 32,690 | 52,763 |
| PLANNED EPIAs | ||||||||
|---|---|---|---|---|---|---|---|---|
| EPIA CE (EUR/toe) | General EPIA CE (EUR/toe) | EPIA PBT (y) | General EPIA PBT (y) | |||||
| MEAN | SD | MEAN | SD | MEAN | SD | MEAN | SD | |
| 22—Plastics Total | 6028 | 9953 | 3277 | 4641 | 4.4 | 4.1 | 3.2 | 10.0 |
| 23—Ceramics Total | 5355 | 6465 | 3692 | 4913 | 4.2 | 3.1 | 2.2 | 2.1 |
| 47—Retail Total | 7111 | 8451 | 4133 | 3238 | 4.0 | 3.7 | 2.4 | 1.9 |
| 64—Banks Total | 15,201 | 16,429 | 7256 | 4925 | 8.0 | 11.1 | 4.5 | 4.3 |
References
- Directive 2012/27/Eu of the European Parliament and of the Council of 25 October 2012 on Energy Efficiency 2012. Available online: https://eur-lex.europa.eu/legal-content/EN/TXT/HTML/?uri=CELEX:32012L0027&from=EN (accessed on 3 August 2021).
- Directive (Eu) 2018/2002 of the European Parliament and of the Council of 11 December 2018 Amending Directive 2012/27/Eu on Energy Efficiency 2018. Available online: https://eur-lex.europa.eu/legal-content/EN/TXT/HTML/?uri=CELEX:32018L2002&from=EN (accessed on 3 August 2021).
- Schleich, J. Do Energy Audits Help Reduce Barriers To Energy Efficiency? An Empirical Analysis for Germany. Int. J. Energy Technol. Policy 2004, 2, 226–239. [Google Scholar] [CrossRef]
- Communication from the Commission Guidelines on State Aid for Environmental Protection and Energy 2014–2020. Available online: https://eur-lex.europa.eu/legal-content/EN/TXT/HTML/?uri=CELEX:52014XC0628(01)&from=ITA (accessed on 3 August 2021).
- Santino, D.; Biele, E.; Salvio, M. Guidelines for Energy Audits Under Article 8 of the EED: Italy ’s Implementation Practices and Tools; ENEA: Rome, Italy, 2019; Available online: https://www.efficienzaenergetica.enea.it/component/jdownloads/?task=download.send&id=377&catid=40&Itemid=101. (accessed on 3 August 2021).
- Schleich, J.; Fleiter, T.; Hirzel, S. Effects of Energy Audits on the Adoption of Energy Efficiency Measures. In Proceedings of the 38th IAEE International Conference, Antalya, Turkey, 25–27 May 2015. [Google Scholar]
- Kalantzis, F.; Revoltella, D. How Energy Audits Promote SMEs’ Energy Efficiency Investment; EIB Working Papers; European Investement Bank: Luxembourg, 2019; Available online: https://op.europa.eu/en/publication-detail/-/publication/0c515b9e-3fcb-11e9-8d04-01aa75ed71a1/language-en (accessed on 3 August 2021).
- Chiu, T.-Y.; Lo, S.-L.; Tsai, Y.-Y. Establishing an Integration-Energy-Practice Model for Improving Energy Performance Indicators in ISO 50001 Energy Management Systems. Energies 2012, 5, 5324–5339. [Google Scholar] [CrossRef] [Green Version]
- IEA. Multiple Benefits of Energy Efficiency; IEA: Paris, France, 2019; Available online: https://www.iea.org/reports/multiple-benefits-of-energy-efficiency (accessed on 3 August 2021).
- Introna, V.; Cesarotti, V.; Benedetti, M.; Biagiotti, S.; Rotunno, R. Energy Management Maturity Model: An Organizational Tool to Foster the Continuous Reduction of Energy Consumption in Companies. J. Clean. Prod. 2014, 83, 108–117. [Google Scholar] [CrossRef]
- Poveda-Orjuela, P.P.; García-Díaz, J.C.; Pulido-Rojano, A.; Cañón-Zabala, G. ISO 50001: 2018 and Its Application in a Comprehensive Management System with an Energy-Performance Focus. Energies 2019, 12, 4700. [Google Scholar] [CrossRef] [Green Version]
- Poveda-Orjuela, P.P.; García-Díaz, J.C.; Pulido-Rojano, A.; Cañón-Zabala, G. Parameterization, Analysis, and Risk Management in a Comprehensive Management System with Emphasis on Energy and Performance (ISO 50001: 2018). Energies 2020, 13, 5579. [Google Scholar] [CrossRef]
- Solnørdal, M.T.; Thyholdt, S.B. Absorptive Capacity and Energy Efficiency in Manufacturing Firms—An Empirical Analysis in Norway. Energy Policy 2019, 132, 978–990. [Google Scholar] [CrossRef]
- Backlund, S.; Thollander, P.; Palm, J.; Ottosson, M. Extending the Energy Efficiency Gap. Energy Policy 2012, 51, 392–396. [Google Scholar] [CrossRef] [Green Version]
- Cagno, E.; Worrell, E.; Trianni, A.; Pugliese, G. A Novel Approach for Barriers to Industrial Energy Efficiency. Renew. Sustain. Energy Rev. 2013, 19, 290–308. [Google Scholar] [CrossRef]
- Laskurain, I.; Ibarloza, A.; Larrea, A.; Allur, E. Contribution to Energy Management of the Main Standards for Environmental Management Systems: The Case of ISO 14001 and EMAS. Energies 2017, 10, 1758. [Google Scholar] [CrossRef] [Green Version]
- Fiedler, T.; Mircea, P.-M. Energy Management Systems According to the ISO 50001 Standard—Challenges and Benefits. In Proceedings of the 2012 International Conference on Applied and Theoretical Electricity (ICATE), Craiova, Romania, 25–27 October 2012; pp. 1–4. [Google Scholar]
- Fuchs, H.; Aghajanzadeh, A.; Therkelsen, P. Identification of Drivers, Benefits, and Challenges of ISO 50001 through Case Study Content Analysis. Energy Policy 2020, 142, 111443. [Google Scholar] [CrossRef]
- Marimon, F.; Casadesús, M. Reasons to Adopt ISO 50001 Energy Management System. Sustainability 2017, 9, 1740. [Google Scholar] [CrossRef] [Green Version]
- António Da Silva Gonçalves, V.; Mil-Homens Dos Santos, F.J. Energy Management System ISO 50001:2011 and Energy Management for Sustainable Development. Energy Policy 2019, 133, 110868. [Google Scholar] [CrossRef]
- Mckane, A.; Therkelsen, P.; Scodel, A.; Rao, P.; Aghajanzadeh, A.; Hirzel, S.; Zhang, R.; Prem, R.; Fossa, A.; Lazarevska, A.M.; et al. Predicting the Quantifiable Impacts of ISO 50001 on Climate Change Mitigation. Energy Policy 2017, 107, 278–288. [Google Scholar] [CrossRef]
- Schleich, J. Barriers To Energy Efficiency: A Comparison Across the German Commercial and Services Sector. Ecol. Econ. 2009, 68, 2150–2159. [Google Scholar] [CrossRef]
- Thollander, P.; Danestig, M.; Rohdin, P. Energy Policies for Increased Industrial Energy Efficiency: Evaluation of a Local Energy Programme for Manufacturing SMEs. Energy Policy 2007, 35, 5774–5783. [Google Scholar] [CrossRef] [Green Version]
- Locmelis, K.; Blumberga, D.; Blumberga, A.; Kubule, A. Benchmarking of Industrial Energy Efficiency. Outcomes of an Energy Audit Policy Program. Energies 2020, 13, 2210. [Google Scholar] [CrossRef]
- Fleiter, T.; Schleich, J.; Ravivanpong, P. Adoption of Energy-Efficiency Measures in SMEs—An Empirical Analysis Based on Energy Audit Data from Germany. Energy Policy 2012, 51, 863–875. [Google Scholar] [CrossRef]
- Sousa Lira, J.M.; Salgado, E.G.; Beijo, L.A. Which Factors Does the Diffusion of ISO 50001 in Different Regions of the World is Influenced? J. Clean. Prod. 2019, 226, 759–767. [Google Scholar] [CrossRef]
- Bonacina, F.; Corsini, A.; De Propris, L.; Marchegiani, A.; Mori, F. Industrial Energy Management Systems in Italy: State of the Art and Perspective. Energy Procedia 2015, 82, 562–569. [Google Scholar] [CrossRef] [Green Version]
- FIRE-CEI-CTI. Indagine sui Sistemi di Gestione Dell’energia Certificati ISO 50001 in Italia; FIRE-CEI-CTI: Rome, Italy, 2016; (In Italian). Available online: https://fire-italia.org/indagine-50001-2016 (accessed on 3 August 2021).
- ACCREDIA. Le Certificazioni Accreditate per l’Efficienza Energetica; ACCREDIA—National Accreditation Body: Rome, Italy, 2017; (In Italian). Available online: https://www.accredia.it/app/uploads/2017/07/Quaderno_Osservatorio_ACCREDIA_Le_certificazione_accreditate_per_leffic....pdf (accessed on 3 August 2021).
- ENEA. Energy Efficiency Annual Report 2020. Analysis and Results from Energy Efficiency Policies in Italy; ENEA: Rome, Italy, 2020; (In Italian). Available online: https://www.efficienzaenergetica.enea.it/component/jdownloads/?task=download.send&id=453&catid=40%20&Itemid=101 (accessed on 3 August 2021).
- Trianni, A.; Cagno, E. Dealing with Barriers to Energy Efficiency and SMEs: Some Empirical Evidences. Energy 2012, 37, 494–504. [Google Scholar] [CrossRef]
- Cantini, A.; Leoni, L.; De Carlo, F.; Salvio, M.; Martini, C.; Martini, F. Technological Energy Efficiency Improvements in Cement Industries. Sustainability 2021, 13, 3810. [Google Scholar] [CrossRef]
- Branchini, L.; Bignozzi, M.C.; Ferrari, B.; Mazzanti, B.; Ottaviano, S.; Salvio, M.; Toro, C.; Martini, F.; Canetti, A. Cogeneration Supporting the Energy Transition in the Italian Ceramic Tile Industry. Sustainability 2021, 13, 4006. [Google Scholar] [CrossRef]
- Timma, L.; Skudritis, R.; Blumberga, D. Benchmarking Analysis of Energy Consumption in Supermarkets. Energy Procedia 2016, 95, 435–438. [Google Scholar] [CrossRef] [Green Version]
- Tallini, A.; Cedola, L. Evaluation Methodology for Energy Efficiency Measures in Industry and Service Sector. Energy Procedia 2016, 101, 542–549. [Google Scholar] [CrossRef]
- Spyropoulos, G.N.; Balaras, C.A. Energy Consumption and the Potential of Energy Savings in Hellenic Office Buildings Used as Bank Branches—A Case Study. Energy Build. 2011, 43, 770–778. [Google Scholar] [CrossRef]
- Aranda, A.; Ferreira, G.; Mainar-Toledo, M.D.; Scarpellini, S.; Llera Sastresa, E. Multiple Regression Models to Predict the Annual Energy Consumption in the Spanish Banking Sector. Energy Build. 2012, 49, 380–387. [Google Scholar] [CrossRef]
- Polzin, F.; Sanders, M. How To Finance the Transition to Low-Carbon Energy in Europe? Energy Policy 2020, 147, 111863. [Google Scholar] [CrossRef]
- Ochieng, E.G.; Jones, N.; Price, A.D.F.; Ruan, X.; Egbu, C.O.; Zuofa, T. Integration of Energy Efficient Technologies in Uk Supermarkets. Energy Policy 2014, 67, 388–393. [Google Scholar] [CrossRef]
- Brown, D.; Sorrell, S.; Kivimaa, P. Worth the Risk? an Evaluation of Alternative Finance Mechanisms for Residential Retrofit. Energy Policy 2019, 128, 418–430. [Google Scholar] [CrossRef]


| IMPLEMENTED EPIAs | General EPIAs (%) | EPIAs per Site (#) | General EPIAs per Site (#) | General EPIA Savings (toe/site) | General EPIA Cost Effectiveness (EUR/toe) | Investment per Site (EUR) | |
|---|---|---|---|---|---|---|---|
| 22—Plastics | ISO 50001 | 6% | 3.50 | 0.17 | n.a | n.a. | 675,910 |
| Not ISO 50001 | 16% | 2.28 | 0.30 | n.a. | n.a. | 355,375 | |
| Monitoring | 16% | 2.45 | 0.30 | 1.50 | 9956 | 456,916 | |
| Not Monitoring | 8% | 1.90 | 0.18 | 0.94 | n.a. | 253,641 | |
| Large Enterprise | 12% | 2.29 | 0.17 | 0.46 | n.a. | 497,732 | |
| SME | 15% | 2.37 | 0.32 | 2.15 | 7387 | 376,688 | |
| Total | 15% | 2.35 | 0.28 | 1.41 | 7847 | 369,088 | |
| 23—Ceramics | ISO 50001 | 14% | 2.64 | 0.36 | n.a. | n.a. | 733,731 |
| Not ISO 50001 | 13% | 2.38 | 0.32 | n.a. | n.a. | 399,433 | |
| Monitoring | 11% | 2.44 | 0.27 | n.a. | n.a. | 513,983 | |
| Not Monitoring | 32% | 2.27 | 0.73 | n.a. | n.a. | 126,500 | |
| Large Enterprise | 14% | 2.71 | 0.39 | n.a. | n.a. | 640,374 | |
| SME | 12% | 2.07 | 0.24 | n.a. | n.a. | 221,288 | |
| Total | 13% | 2.42 | 0.32 | n.a. | n.a. | 466,292 |
| PLANNED EPIAs | Companies (#) | Sites (#) | EPIAs (#) | General EPIAs (#) | EPIA Cost Effectiveness (EUR/toe) | General EPIA Cost Effectiveness (EUR/toe) | EPIA PBT (y) | General EPIA PBT (y) | |
|---|---|---|---|---|---|---|---|---|---|
| 22—PLASTICS | ISO 50001 | 17 | 22 | 57 | 7 | 8294 | 2804 | 4.0 | 1.8 |
| Not ISO 50001 | 470 | 513 | 1594 | 301 | 5929 | 3476 | 4.1 | 3.4 | |
| Monitoring | 329 | 371 | 1147 | 198 | 6438 | 3146 | 3.8 | 3.2 | |
| Not Monitoring | 158 | 164 | 504 | 110 | 5679 | 3739 | 4.4 | 3.7 | |
| Large Enterprise | 73 | 94 | 252 | 31 | 5417 | 1839 | 3.8 | 1.9 | |
| SME | 414 | 441 | 1399 | 277 | 6116 | 3657 | 4.1 | 3.5 | |
| Total | 487 | 535 | 1651 | 308 | 6011 | 3303 | 4.1 | 3.3 | |
| 23—CERAMICS | ISO 50001 | 3 | 11 | 14 | 0 | 4699 | n.a. | 9.0 | n.a. |
| Not ISO 50001 | 101 | 131 | 480 | 72 | 5399 | 3691 | 3.9 | 2.2 | |
| Monitoring | 84 | 119 | 414 | 62 | 5245 | 3963 | 4.0 | 2.2 | |
| Not Monitoring | 20 | 23 | 80 | 10 | 6307 | 1859 | 4.4 | 2.0 | |
| Large Enterprise | 30 | 65 | 247 | 42 | 5153 | 5700 | 3.8 | 2.4 | |
| SME | 74 | 77 | 247 | 30 | 5640 | 2242 | 4.3 | 2.0 | |
| Total | 104 | 142 | 494 | 72 | 5374 | 3691 | 4.1 | 2.2 |
| IMPLEMENTED EPIAs | General EPIAs (%) | EPIAs per Site (#) | General EPIAs per Site (#) | General EPIA Savings (toe/site) | General EPIA Cost Effectiveness (EUR/toe) | Investment per Site (EUR) | |
|---|---|---|---|---|---|---|---|
| 47— RETAIL | ISO 50001 | 81% | 1.7 | 1.3 | 3.8 | 5791 | 19,653 |
| Not ISO 50001 | 12% | 1.3 | 0.2 | 0.6 | 5926 | 142,402 | |
| Monitoring | 44% | 1.5 | 0.7 | 2.1 | 5804 | 80,533 | |
| Not Monitoring | 0% | 1.3 | 0 | n.a. | n.a. | 83,501 | |
| Large Enterprise | 37% | 1.5 | 0.5 | 1.8 | 5804 | 81,819 | |
| SME | n.a. | n.a. | n.a. | n.a. | n.a. | n.a. | |
| Total | 37% | 1.5 | 0.5 | 1.8 | 5804 | 81,819 | |
| 64—BANKS | ISO 50001 | 19% | 1.9 | 0.4 | n.a | n.a | 5016 |
| Not ISO 50001 | 38% | 1.7 | 0.6 | 7.0 | 4640 | 34,270 | |
| Monitoring | 32% | 4.1 | 1.3 | 10.0 | 5225 | 31,119 | |
| Not Monitoring | 31% | 1 | 0.2 | 1.5 | 3982 | 34,537 | |
| Large Enterprise | 32% | 1.8 | 0.6 | 7.5 | 4292 | 35,966 | |
| SME | n.a. | n.a. | n.a. | n.a. | n.a. | n.a. | |
| Total | 31% | 1.8 | 0.6 | 7.0 | 4640 | 32,690 |
| PLANNED EPIAs | Companies (#) | Sites (#) | EPIAs (#) | General EPIAs (#) | EPIA Cost Effectiveness (EUR/toe) | General EPIA Cost Effectiveness (EUR/toe) | EPIA PBT (y) | General EPIA PBT (y) | |
|---|---|---|---|---|---|---|---|---|---|
| 47—RETAIL | ISO 50001 | 4 | 97 | 340 | 106 | 5474 | 3368 | 3.3 | 2.2 |
| Not ISO 50001 | 75 | 365 | 870 | 88 | 7782 | 5292 | 4.3 | 2.7 | |
| Monitoring | 42 | 334 | 882 | 169 | 7050 | 3968 | 3.8 | 2.4 | |
| Not Monitoring | 37 | 128 | 328 | 25 | 7280 | 5464 | 4.4 | 2.4 | |
| Large Enterprise | 75 | 457 | 1193 | 189 | 7072 | 3970 | 4.0 | 2.4 | |
| SME | 4 | 5 | 17 | 5 | 10,903 | 13,805 | 4.6 | 4.5 | |
| Total | 79 | 462 | 1210 | 194 | 7111 | 4133 | 4.0 | 2.4 | |
| 64—BANKS | ISO 50001 | 2 | 40 | 123 | 36 | 18,478 | 6279 | 4.2 | 1.6 |
| Not ISO 50001 | 39 | 170 | 521 | 93 | 14,775 | 7318 | 8.8 | 4.9 | |
| Monitoring | 13 | 116 | 371 | 65 | 13,733 | 5875 | 7.2 | 3.8 | |
| Not Monitoring | 28 | 94 | 273 | 64 | 16,766 | 8023 | 9.1 | 5.0 | |
| Large Enterprise | 40 | 207 | 640 | 129 | 15,307 | 7256 | 8.1 | 4.5 | |
| SME | 1 | 3 | 4 | 0 | 1938 | n.a. | 1.9 | n.a. | |
| Total | 41 | 210 | 644 | 129 | 15,201 | 7256 | 8.0 | 4.5 |
Publisher’s Note: MDPI stays neutral with regard to jurisdictional claims in published maps and institutional affiliations. |
© 2021 by the authors. Licensee MDPI, Basel, Switzerland. This article is an open access article distributed under the terms and conditions of the Creative Commons Attribution (CC BY) license (https://creativecommons.org/licenses/by/4.0/).
Share and Cite
Herce, C.; Biele, E.; Martini, C.; Salvio, M.; Toro, C. Impact of Energy Monitoring and Management Systems on the Implementation and Planning of Energy Performance Improved Actions: An Empirical Analysis Based on Energy Audits in Italy. Energies 2021, 14, 4723. https://0-doi-org.brum.beds.ac.uk/10.3390/en14164723
Herce C, Biele E, Martini C, Salvio M, Toro C. Impact of Energy Monitoring and Management Systems on the Implementation and Planning of Energy Performance Improved Actions: An Empirical Analysis Based on Energy Audits in Italy. Energies. 2021; 14(16):4723. https://0-doi-org.brum.beds.ac.uk/10.3390/en14164723
Chicago/Turabian StyleHerce, Carlos, Enrico Biele, Chiara Martini, Marcello Salvio, and Claudia Toro. 2021. "Impact of Energy Monitoring and Management Systems on the Implementation and Planning of Energy Performance Improved Actions: An Empirical Analysis Based on Energy Audits in Italy" Energies 14, no. 16: 4723. https://0-doi-org.brum.beds.ac.uk/10.3390/en14164723