
Thermal Absorption Performance Evaluation of Water-Based Nanofluids (CNTs, Cu, and Al2O3) for Solar Thermal Harvesting


Department of Energy and Mechanical Engineering, Gyeongsang National University, Tongyeonghaean-ro 2, Tongyeong-si 53064, Gyeongsangnam-do, Korea
*
Author to whom correspondence should be addressed.
Energies 2021, 14(16), 4875; https://0-doi-org.brum.beds.ac.uk/10.3390/en14164875
Submission received: 20 July 2021
/
Revised: 5 August 2021
/
Accepted: 6 August 2021
/
Published: 10 August 2021
(This article belongs to the Special Issue Advances in Reduction Technologies of Gas Emissions (CO2, NOx, and SO2) in Combustion-Related Applications)
Abstract
:For solar thermal harvesting, an experimental study was performed on the thermal absorption performance of water-based carbon nanotubes (CNTs), Cu, and Al2O3 nanofluids using a halogen lamp-based thermal radiation system. The effect of nanoparticle concentrations (0.01 wt.%, 0.1 wt.%, and 1 wt.%) on the nanofluid dispersion, stability, and thermal absorption characteristics was investigated, and a comparative analysis was performed for each type of nanofluid. All types of nanofluids increased the absorbance and electrical conductivity with increasing nanoparticle concentration, which contributed to improving the thermal absorption performance of nanofluids. The results showed that the thermal absorption performance was high in the order of carbon-based nanofluids (CNTs), metal-based nanofluids (Cu), and oxide-based nanofluids (Al2O3). In CNTs nanofluids, the thermal absorption performance expressed the time reduction rate, which was 12.8%, 16.3%, and 16.4% at 0.01 wt.%, 0.1 wt.%, and 1 wt.% test cases, respectively. Therefore, the 0.1 wt.%-CNTs nanofluid is more economical and appropriate. However, in Al2O3 nanofluids, the time reduction rate of the 1 wt.% nanofluid was significantly higher than that of the 0.01 wt.% and 0.1 wt.% nanofluids. In Cu nanofluids, unlike CNTs and Al2O3 nanofluids, the time reduction rate constantly increased as the nanoparticle concentration increased.
Keywords:
nanofluid; nanoparticle; alumina; carbon nanotube; copper; dispersion; stability; absorption; solar energy; heat transfer1. Introduction
Owing to the continuously increasing energy consumption and undesirable consequences of environmental pollution, researchers need to develop environmentally friendly, clean, and sustainable energy resources, such as solar, wind, and geothermal energy. Solar energy reaches Earth mainly through radiation and convection, and it is mainly harvested through photovoltaic (PV) and photothermal (PT) systems. PV technology faces many challenges because of its high manufacturing costs, low cell efficiency, and the inability to utilize the primary spectrum of incoming sunlight [1]. By contrast, unlike PV systems, PT solar systems absorb a broad spectrum (nearly 95%) of incoming solar radiation based on an absorbing medium, making it the most straightforward, economical, and practical approach to harness solar energy [2,3]. The total solar radiation coming to the Earth’s surface per year has been reported to be equal to 1800 teraton standard coal [4].
One of the main methods of collecting solar energy is through a solar collector, which is the most basic method. However, depending on the size of the solar collector and the collection method, the efficiency varies significantly. A general solar collector has a black surface, absorbs solar energy, and collects and converts energy [5]. The energy absorbed in this way is collected by receiving energy from the working fluid flowing through the built-in tube. Through this process, the collection efficiency of solar energy varies greatly depending on the amount of absorption and the energy transfer fluid [6]. Nanofluids that can significantly change a wide range of working fluid properties (light absorption and thermal conductivity) are considered the best option for solar collector applications [7]. There is an extensive review of the utilization of nanomaterials for increasing the efficiency of flat plate solar collectors [8]. Research on the effects of flow mixing and nanomaterial on heat transfer enhancement in solar collector systems has been published [9,10,11]. Therefore, various nanoparticles such as carbon-(CNTs and graphene), metal-(Ag, Au, and Cu), and oxide-based (Al2O3, CuO, SiO2, TiO2, and ZnO) nanoparticles are mixed with the working fluid (water, alcohol, oil, etc.) to manufacture nanofluids. In particular, the investigation of the effect of the concentration and type of nanoparticles on the heat absorption performance of nanofluids is essential [12,13,14,15,16].
Wang et al. [4] reported that the nanofluid of carbon black (or Chinese ink) has a surprisingly higher efficiency of photothermal conversion than Cu and CuO nanoparticles. Yousfi et al. [17,18] used water-based Al2O3 and multiwalled carbon nanotubes (MWCNTs) nanofluids as working fluids for flat-plate solar collectors, demonstrating that both nanomaterials have higher thermal collection efficiencies than water. Kim et al. [19] reported that the thermal conductivity increased with respect to the nanofluid concentration, and the thermal efficiency of the solar collector improved in the order of MWCNTs, CuO, Al2O3, TiO2, and SiO2. Lee et al. [20] reported that, compared with the water-based system, the thermal and electrical efficiencies of a photovoltaic thermal system using CuO/water as a nanofluid increased by 21.30% and 0.07%, respectively. Filho et al. [21] reported that the thermal efficiency increased by 52%, 93%, and 144% for silver nanoparticle concentrations of 1.62, 3.25, and 6.5 ppm, respectively. He et al. [22] reported that Cu/water nanofluids have good thermal absorption ability for solar energy. The highest temperature of the Cu/water nanofluid (0.1 wt.%) can increase up to 25.3% compared to deionized water. Faizal et al. [23] showed that a higher density and lower specific heat of nanoparticles led to higher thermal efficiency. The CuO nanofluid had the highest value compared to the SiO2, TiO2, and Al2O3 nanofluids.
Recently, Lee et al. [24] investigated the effect of nanoparticle concentration (0.1 wt.%, 0.3 wt.%, and 0.5 wt.%) on the solar thermal absorption performance of Al2O3/water nanofluids in an actual environment. They concluded that the temperature increases for the 0.1 wt.%, 0.3 wt.%, and 0.5 wt.% alumina nanofluids were 3.1%, 12.5%, and 13.9% higher, respectively, than distilled water (DW). Shin et al. [25] reported that, in the same experiments of [24], the temperature increases for the 0.01 wt.%, 0.05 wt.%, and 0.1 wt.% CNTs/water nanofluids were 13.6%, 18.2%, and 22.1% higher than that of DW, respectively. Both studies suggested that the efficiency could be further improved by using different types of nanoparticles and dispersion methods in addition to alumina and CNTs nanofluids. Constant solar thermal radiation is required in absorption performance experiments to obtain more consistent quantitative data for different types and concentrations of nanofluids. In addition, as discussed above, many studies have been conducted on the solar thermal absorption performance evaluation for individual nanofluids, but there have been few studies that comprehensively evaluated the thermal absorption performance of carbon-, metal-, and oxide-based nanofluids.
Therefore, in this study, the thermal absorption performance of nanofluids was compared to that of DW for different types and concentrations of nanofluids by continuously supplying a halogen lamp-based thermal source. To investigate the effects of the types and concentrations of nanoparticles on the thermal absorption performance of the nanofluids (carbon-, metal-, and oxide-based nanoparticles), CNTs, Cu, and Al2O3 nanoparticles were mixed with DW as the base fluid at weight ratios of 0.01 wt.%, 0.1 wt.%, and 1 wt.%. The thermal absorption performance was compared and analyzed with the time reduction rate by measuring the time required for each nanofluid to reach the same temperature (20–50 °C).
2. Materials and Methods
2.1. Preparation of Nanofluids
DW was used as the base fluid to manufacture three different types of nanofluids. Then, the nanoparticles, namely carbon nanotubes (CNTs), copper (Cu), and aluminum oxide (Al2O3), were mixed into the DW. Although nanofluids use many types of nanomaterials, we selected CNTs, Cu, and Al2O3 as the representative samples of carbon-, metal-, and oxide-based nanoparticles, respectively, because water-based CNTs, Cu, and Al2O3 nanofluids are commonly applied to solar thermal systems [13,26]. The Al2O3, CNTs (multiwalled type), and Cu nanoparticles were purchased from Sigma-Aldrich, Carbon Nano-Material Technology, and Nano Technology, respectively. Table 1 lists the properties of the nanoparticles [27,28,29,30]. The nanoparticle sizes reported by the providers were ~100 nm for Cu, ~50 nm for Al2O3, and ~20 nm for CNTs with a length of ~5 μm. The concentrations of nanoparticles dispersed in the DW (0 wt.%) were 0.01 wt.%, 0.1 wt.%, and 1 wt.% for 300 mL of nanofluid. The total volume of the working fluid was 1000 mL in previous studies [24,25]. The total volume of the working fluid was reduced to 300 mL to obtain rapid results in this experiment, which can shorten the experimental time required to obtain the results. Figure 1 shows images of CNTs nanofluids with varying concentrations (0.01 wt.%, 0.1 wt.%, and 1 wt.%). Left- and right-side images represent nanoparticles and mixtures of nanoparticles and DW, respectively. For example, as shown in Figure 1c, 1 wt.% of nanofluid was prepared by mixing 297 g of DW and 3 g of CNTs nanoparticles. For minimized sedimentation and maximized nanoparticle dispersion, the nanofluids were ultrasonicated for 2 h using an ultrasonic cleaner (SK5200GT, LABOTEC Co., Ltd., Seoul, South Korea) at 35 kHz and 200 W, as described in Ref. [31].
2.2. Analysis of Dispersion Characteristics and Electrical Conductivity of Nanofluids
The UV/Vis spectrophotometer (X-ma-3100, Human Corporation Co., Ltd., Seoul, South Korea) was used to investigate the dispersion characteristics of six different nanofluids with nanoparticle concentrations of 0.01 wt.%, 0.1 wt.%, and 1.0 wt.% in a total of 18 test cases. The spectrophotometer used in this study provides absorbance data that effectively analyze the degree of dispersibility of the nanofluids. The absorbance of each nanofluid was measured at 25 °C. The electrical conductivity (EC) of the nanofluids was measured using an EC meter (CM-25R, DKK-TOA Co., Ltd., Tokyo, Japan) at 50 °C. The EC meter used in this study was a contacting-type sensor with a titanium-palladium alloy electrode. Before the EC measurements, calibration was performed with standard potassium chloride (1.41, 12.86 μS/cm).
2.3. Halogen Lamp-Based Solar Simulator
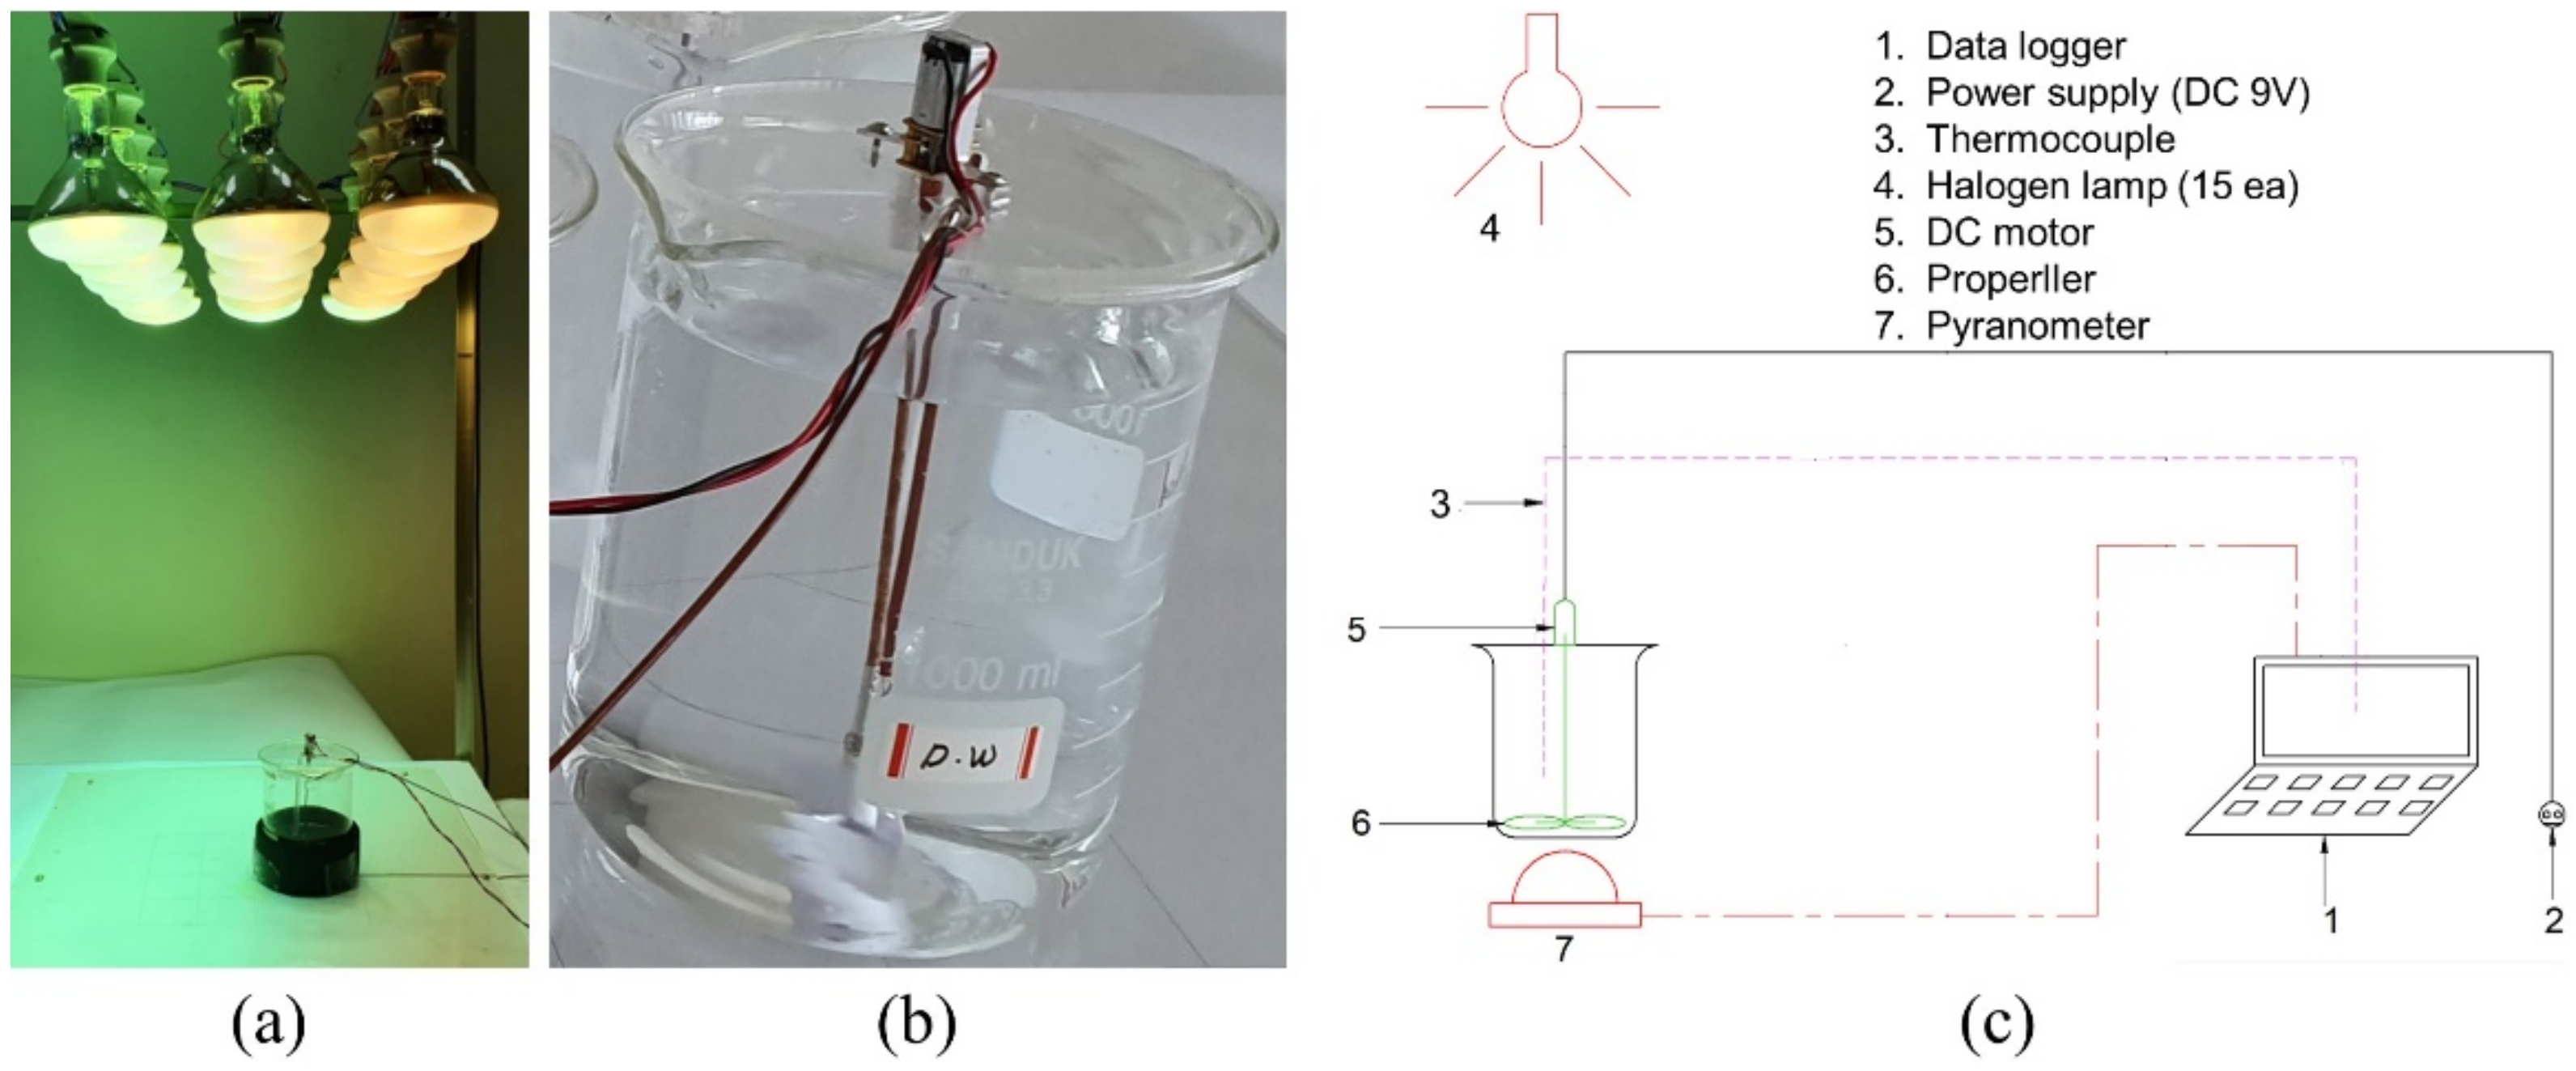
Figure 2 shows the photothermal energy conversion experimental setup. In Figure 2a, to make a thermal source similar to solar thermal radiation, 15 halogen lamps (300 W × 15 = 4500 W) were installed with a power supply and data logger. A thermal collector containing nanofluids was placed directly beneath the lamp array. Assuming that the thermal radiation of the lamps was received vertically, the side of the nanofluid container was insulated. The fluid temperature was measured inside the nanofluid using K-type thermocouples, and the measurement location was kept constant. All nanofluids were supplied with insolation under the same conditions. The temperature was measured every 2 s, and the experiment was performed at nanofluid temperatures ranging from 21.4 °C to 50.4 °C. The thermal performance of the nanofluid was compared using the time taken to reach the target temperature of 50.4 °C. The experimental equipment was installed indoors to minimize the external factors. In addition, to prevent the sedimentation of nanoparticles, a fan and a DC motor were used at a 9 V and 325 rpm, respectively, as shown in Figure 2b. The schematic diagram of the experimental setup is shown in Figure 2c.
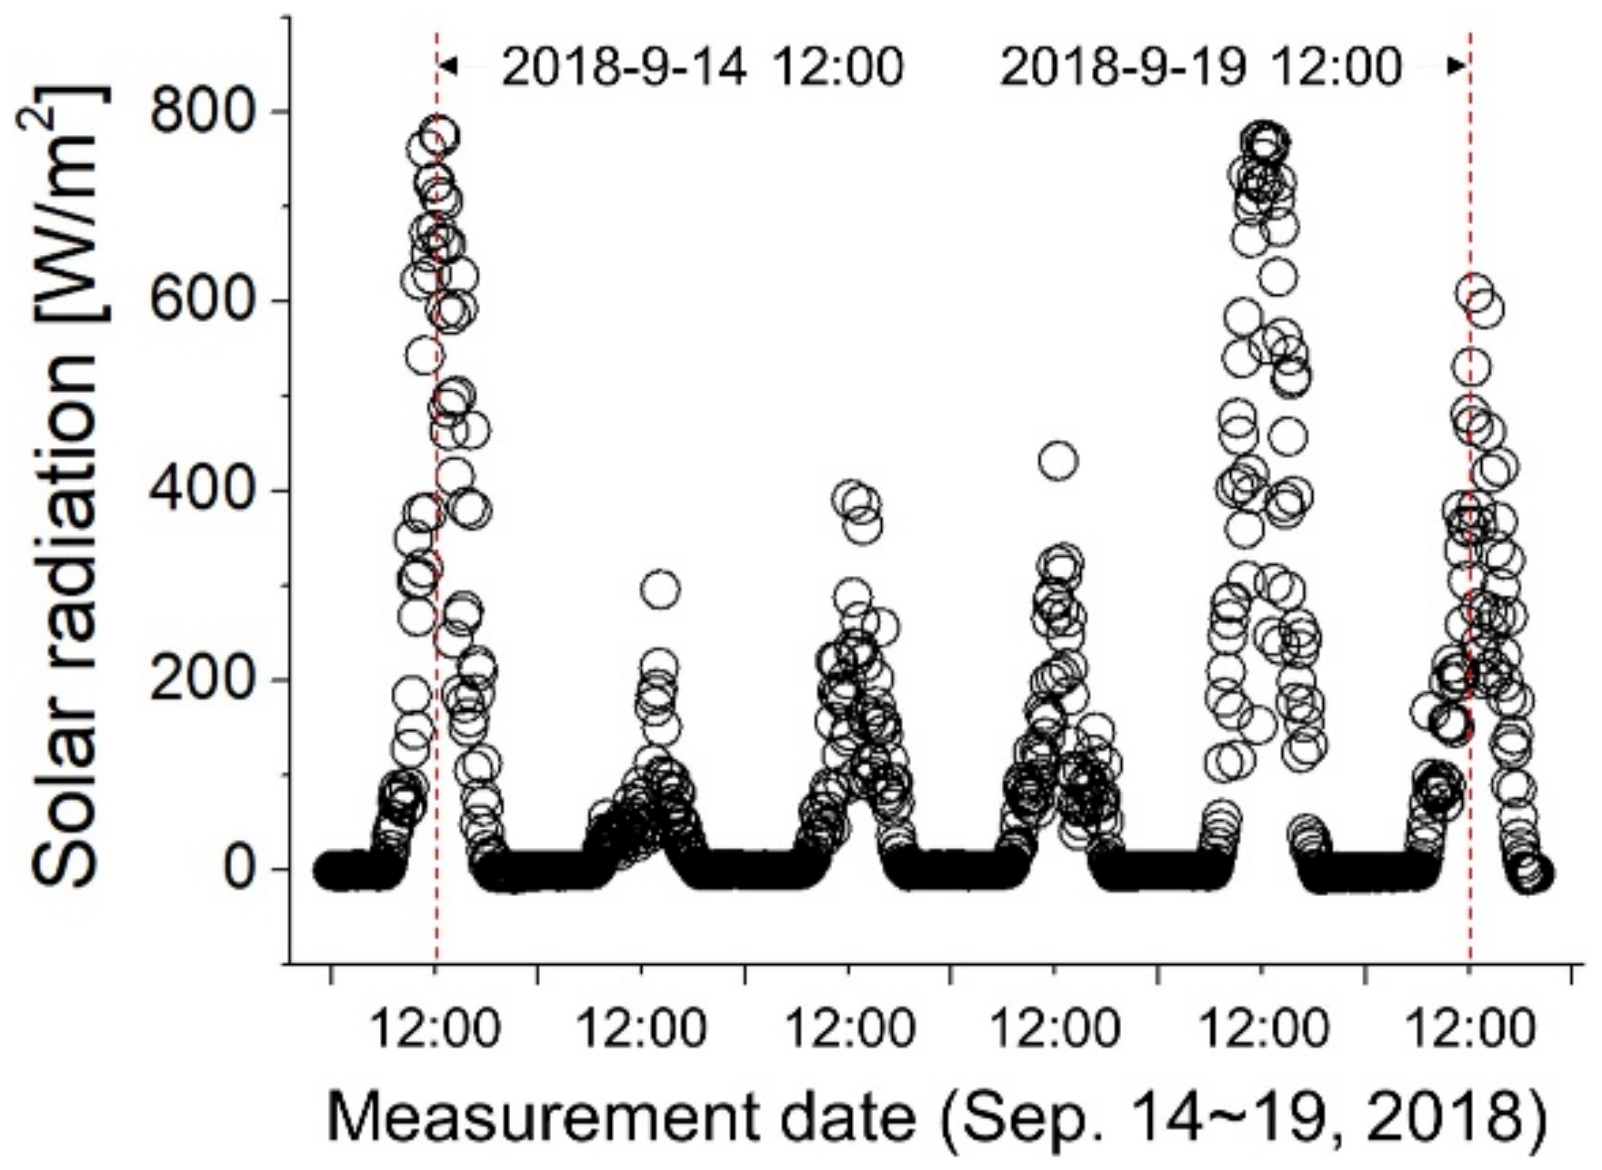
South Korea is located between 35.9° N latitude and 127.7° E longitude, and the average monthly solar radiation is estimated to range from 2.56–5.48 kWh/m2 [32]. Figure 3 shows the instantaneous solar radiation measured in Tongyeong City, South Korea, for the selected dates in September 2018. The solar radiation was measured using a pyranometer (MS-802, EKO Instruments Co., Ltd., Tokyo, Japan). The level of thermal radiation fluctuated with time and date; however, for most of the day, the highest radiation occurred at around 13:00. The maximum solar radiation was approximately 800 W/m2. Therefore, in this study, more than 800 W/m2 of thermal radiation was supplied by 15 halogen lamps for the thermal absorption of nanofluids. The same pyranometer was used to measure thermal emitted from the light source, as shown in Figure 3. Figure 4 shows the thermal radiation color map for different measurement positions. By adjusting the distance between the halogen lamps and the thermal collector, the height of the lamp that generated approximately 870 W/m2 of thermal radiation was found, and the experiment was conducted by locating the thermal collector at that point.
3. Results and Discussion
3.1. Dispersion Characteristics of Nanofluids
The dispersion characteristics of the three nanofluid groups with different nanoparticle concentrations were compared for absorbance in the visible wavelength range of 400–700 nm. Figure 5 shows the absorbance of nanofluids with different nanoparticles (CNTs, Cu, and Al2O3) and their blending ratios as a function of wavelength. The absorbance tends to decrease slightly with increasing wavelength, but the decrease in absorbance with wavelength is not significantly different for all test cases, as shown in Figure 5a–c. However, the absorbance of each nanofluid showed a significant difference according to the nanoparticle concentration. As the concentration of the nanoparticles increased, the absorbance of the nanofluid showed a tendency to increase. In addition, the increase in absorbance differed according to the nanoparticle type. In the carbon-based nanofluid (CNTs), as shown in Figure 5a, the absorbance showed a similar level in between 0.1 and 1.0 wt.% of nanoparticle concentrations. However, in the metallic nanofluid (Cu), as shown in Figure 5b, it was confirmed that the absorbance gradually increased as the concentration of nanoparticles increased. The test case of oxide-based nanofluid (Al2O3), as shown in Figure 5c, showed a similar trend to that of the metallic nanofluid as the concentration of nanoparticles increased.
The absorbance was compared at a wavelength of 600 nm to clarify the effects of the nanoparticle type and concentration on the absorbance characteristics, as shown in Figure 5d. As the concentration of nanoparticles increased, the dispersibility of the nanofluid improved. The dispersibility of nanofluids showed different impacts of increasing nanoparticle concentration depending on the type of nanoparticle. Metal- and oxide-based nanofluids gradually increased absorbance with respect to the concentration of nanoparticles, whereas carbon-based nanofluids showed similar absorbance levels in the 0.1 wt.% and 1 wt.% test cases. Therefore, to improve the dispersion characteristics of the carbon-based nanofluid with the highest dispersibility, a nanoparticle concentration of 0.1 wt.% is more suitable than a nanoparticle concentration of 1 wt.% in consideration of economics.
Consequently, the absorbance values were high in the order of carbon-based nanofluids, metal-based nanofluids, and oxide-based nanofluids. As expected, the CNTs nanofluid with the lowest density and size of the nanoparticles showed the highest dispersion level, as listed in Table 1. In contrast, the dispersion results of the Cu and Al2O3 nanofluids showed opposite results for the density and particle size. To further clarify this, we indicate that the zeta potential or EC measurements are needed in terms of the stability and dispersion of nanofluids.
3.2. Electrical Conductivity of Nanofluids
The stability of the nanofluids depends on the electrostatic property, that is, the zeta potential. Moreover, the EC can provide information about the dispersion state and stability of nanoparticle suspensions in nanofluids [33,34]. Figure 6 shows the EC measured at 25 °C for the three nanofluid groups with varying nanoparticle concentrations. The EC of the nanofluids under all nanoparticle test conditions increased with increasing nanoparticle concentration. The EC values were high in the order of carbon-based nanofluids, metal-based nanofluids, and oxide-based nanofluids. These results are consistent with the results of the absorbance measurements, as shown in Figure 5. Kumar et al. [35] showed similar results as in this study, in that the absorbance of nanofluids increased as the concentration of nanoparticles increased, and the EC of the nanofluids was improved. The measured value of EC for DW was 6.13 μS/cm at 25 °C, and this measurement was consistent with the measurement of Sarojini et al. [36] in deionized water. The maximum electrical conductivities occurred at the test cases of CNTs, and their values at the 0.01, 0.1, and 1 wt.% test cases were 16.03, 24.2, and 29.1 μS/cm, respectively. For the CNTs nanofluid, the EC enhancement compared to DW was approximately three times at 0.01 wt.%, four times at 0.1 wt.%, and five times at 1.0 wt.%. However, the Al2O3 nanofluid showed the lowest improvement in EC compared to DW. The enhancement values were by 31–58% in the nanoparticle concentration range of 0.01–1.0 wt.%. This result is in qualitative agreement with that obtained by Ganguly et al. [37], who reported an EC enhancement rate of approximately 10–80% in 0.5–3 vol% nanoparticle concentration ranges of A2O3 nanofluids.
3.3. Effects of Material Types and Particle Concentrations of Nanofluids on Thermal Performance
In the solar thermal simulation system performance experiment of nanofluids, the temperature of the nanofluid with the ultrasonically treated nanofluid at 20 °C increased as the light source exposure time increased. In this experiment, the thermal absorption performance was compared and analyzed by measuring the time until the nanofluid temperature reached 50 °C. The thermal radiation was maintained at 870 W/m2. Figure 7 shows the temperature history as a function of light source exposure time for the three nanofluid types with different nanoparticle concentrations. For every nanofluid from CNTs to Al2O3, as shown in Figure 7a–c, the temperature distributions showed a similar tendency. The temperature increased with the nanoparticle concentration and light source exposure time. Previous studies by Boldoo et al. [38] and Chen et al. [39] obtained similar results, and the temperature increased as the nanoparticle concentration increased. For all samples, the temperature rise of the nanofluid was more pronounced than that of the DW at all nanoparticle concentrations. The time taken to reach 50 °C from 20 °C of DW was 3756 s. Table 2 summarizes the time to reach 50 °C according to the nanoparticle concentration for each nanofluid. In Figure 7a, the shortening times for CNTs nanofluids with different nanoparticle concentrations were 484, 614, and 618 s for 0.01 wt.%, 0.1 wt.%, and 1 wt.%, respectively. For the three types of nanofluids, the maximum value of the shortest time occurred in the 1 wt.% test cases. The values for CNTs, Cu, and Al2O3 were 618, 594, and 372 s, respectively, as shown in Figure 7d. The difference in improved thermal absorption performance with different types of nanofluids is mainly due to the superior thermophysical properties in Table 1 and the nanofluid dispersion characteristics (or stability), as discussed in Figure 5 and Figure 6.
To further understand the thermal absorption characteristics of nanofluids, the effect of nanoparticle type and the nanofluid concentration on the time reduction rate (based on DW) to reach 50 °C from an initial temperature of 20 °C are presented in Figure 8. At the nanoparticle concentration of 1 wt.%, the maximum time reduction rate for each type of nanofluid was CNTs, Cu, and Al2O3, and their values were 16.6%, 15.5%, and 10.2%, respectively. In the case of carbon-based nanofluids, when the time reduction rate of 0.01 wt.% nanofluid was compared with the time reduction rate of 0.1 wt.% and 1 wt.% nanofluid, it was found that the time reduction rate of 0.01 wt.% nanofluid was relatively lower than that of the 0.1 wt.% and 1 wt.% nanofluids. The results of the thermal absorption performance of the CNTs nanofluids with increasing concentrations are consistent with the absorbance results shown in Figure 5d. Thus, adding approximately 0.1 wt.% of nanoparticles is more economical than increasing the concentration of nanoparticles. This can reduce adverse effects such as channel clogging and increased pumping force due to the flow of nanoparticles and can reduce pipeline damage in heat transfer systems. Therefore, according to the results of the thermal absorption performance for CNTs nanofluids in this study, 0.1 wt.% was the optimal concentration. In the case of metal-based nanofluids (Cu), unlike carbon-based nanofluids (CNTs), the time reduction rate increased constantly compared to the increase in nanoparticle concentration. In the oxide-based nanofluid (Al2O3), the time reduction rates were 7.4%, 9.4%, and 14.1% for 0.01 wt.%, 0.1 wt.%, and 1 wt.%, respectively. Test cases for 0.01 wt.% and 0.1 wt.% nanofluids showed similar time reduction rates, and the 1 wt.% nanofluid showed a large increase in time reduction rates. The thermal absorption performance of the Al2O3 nanofluids with increasing concentrations is consistent with the EC results shown in Figure 6. These results are different from those of CNTs and Cu nanofluids, and it was confirmed that Al2O3 nanofluids have high economic feasibility of 1 wt.% nanofluid. Therefore, it was confirmed that the heat transfer performance of the oxide-based nanofluid exhibited a tendency opposite to that of the carbon-based nanofluid.
The specific heat contributes to the faster and improved rate of heat transfer of the nanofluid, which results in a lower energy requirement for the similar temperature increment that decreases the specific heat value [40,41]. The smaller the specific heat value for a nanofluid, the less energy is required to raise the temperature [23]. The specific heat of DW and each tested nanofluid was calculated using the following equation [40]:
where and are the nanofluid (or DW in pure DW test case) and specific heat, respectively, is the fluid temperature difference () between the initial and final states, is the exposure time, is the area exposed to the thermal radiation source of halogen lamps, and is the thermal radiation intensity fixed at 870 W/m2.
Table 3 lists the specific heat variation for varying nanoparticle concentrations of different nanofluids; as the concentration of nanoparticles increases, the specific heat of all nanofluids decreases. This means that the higher the nanofluid concentration, the less heat input is required to raise the temperature of the nanofluid, or the time required to reach 50 °C with the same thermal input is reduced. For Al2O3/water nanofluids, the specific heat values obtained in this study were qualitatively similar to those obtained by Pandey and Nema [42], ranging from 3430 to 4039 J/kg °C for nanoparticle concentrations of 2 vol.% to 4 vol.%.
In this study, the thermal absorption performance increased with increasing nanofluid concentration. As discussed in previous studies [43,44,45,46], we can achieve much better results if we improve the dispersibility and stability of nanoparticles. Therefore, further studies on the preparation and application of highly dispersed nanofluids are required to obtain better thermal absorption performance. In addition, because the geometry and size of nanoparticles affect the dispersibility and stability of nanofluids, further studies focusing on the effect of the shape and size of nanoparticles on the thermal absorption performance of solar radiation systems are needed.
4. Conclusions
This paper presents experimental studies on the thermal absorption performance evaluation of various nanofluids in a halogen lamp-based solar simulator. The effect of different types and concentrations of nanoparticles on thermal absorption performance was investigated. DW was used as the base fluid, and three different types of nanoparticles (CNTs, Cu, and Al2O3) were used as 0.01, 0.1, and 1 wt.%, respectively. The main results of this study are summarized as follows:
- (1)
- For the dispersion characteristics of nanofluids, the absorbance values were high in the order of carbon-based nanofluids (CNTs), metal-based nanofluids (Cu), and oxide-based nanofluids (Al2O3). The Cu and Al2O3 nanofluids gradually increased absorbance with respect to the concentration of nanoparticles, whereas CNTs nanofluids showed similar absorbance levels in the 0.1 wt.% and 1 wt.% test cases. The increment of absorbance levels at the 0.1 wt.% was 255% between CNTs and Al2O3 nanofluids and 132% between CNTs and Cu nanofluids.
- (2)
- In all nanofluids used in the experiment, the absorbance and EC increased as the concentration of nanoparticles increased. The maximum electrical conductivities occurred at the test cases of CNTs, and the EC enhancement compared to DW was approximately 300% at 0.01 wt.%, 400% at 0.1 wt.%, and 500% at 1.0 wt.%.
- (3)
- For the thermal absorption performance, the CNTs nanofluids showed the best heat transfer performance. The time reduction rate compared to DW at concentrations of 0.01, 0.1, and 1 wt.% were 12.8%, 16.3%, and 16.4%, respectively. Since the increase in the time reduction rate is not large when the concentration of nanoparticles is more than 0.1 wt.%, the 0.1 wt.% of the CNTs nanofluid is more economically suitable than 1 wt.%. In Cu nanofluids, unlike CNTs nanofluids, the time reduction rate increased gradually as the concentration of nanoparticles increased. In Al2O3 nanofluids, compared to 0.01 wt.% and 0.1 wt.% nanofluids, the time reduction rate of 1 wt.% nanofluid significantly increased. These results are in contrast to those of CNTs nanofluids.
Author Contributions
Conceptualization, H.J.; methodology, H.J.; software, Y.L.; validation, Y.L.; formal analysis, Y.L.; investigation, Y.L.; resources, Y.L.; data curation, Y.L.; writing—original draft preparation, Y.S.; writing—review and editing, Y.S.; visualization, Y.L.; supervision, H.J.; project administration, Y.S.; funding acquisition, Y.S. All authors have read and agreed to the published version of the manuscript.
Funding
This work was supported by a National Research Foundation of Korea (NRF) grant funded by the Korean government (MSIT) (No. 2020R1F1A1049268).
Conflicts of Interest
The authors declare no conflict of interest.
References
- Mitra, D.; Chattopadhyay, K.K.; Chattopadhyay, P. Generation of stable thermal gradient by solar energy harvesting in porous cobalt oxide based nanofluid. Sustain. Energy Technol. Assess. 2021, 47, 101390. [Google Scholar] [CrossRef]
- Chen, L.; Liu, J.; Fang, X.; Zhang, Z. Reduced graphene oxide dispersed nanofluids with improved photothermal conversion performance for direct absorption solar collectors. Sol. Energy Mater. Sol. Cells 2017, 163, 125–133. [Google Scholar] [CrossRef]
- Otanicar, T.P.; Phelan, P.E.; Prasher, R.S.; Rosengarten, G.; Taylor, R.A. Nanofluid-based direct absorption solar collector. J. Renew. Sustain. Energy 2010, 2, 033102. [Google Scholar] [CrossRef] [Green Version]
- Wang, H.; Yang, W.; Cheng, L.; Guan, C.; Yan, H. Chines ink: High performance nanofluids for solar energy. Sol. Energy Mater. Sol. Cells 2018, 176, 374–380. [Google Scholar] [CrossRef]
- Kalogirou, S.A. Solar thermal collectors and applications. Prog. Energy Combust. Sci. 2004, 30, 231–295. [Google Scholar] [CrossRef]
- Ni, G.; Miljkovic, N.; Ghasemi, H.; Huang, X.; Boriskina, S.V.; Lin, C.T.; Wang, J.; Xu, Y.; Rahman, M.M.; Zhang, T.J.; et al. Volumetric solar heating of nanofluids for direct vapor generation. Nano Energy 2015, 17, 290–301. [Google Scholar] [CrossRef] [Green Version]
- Sidik, N.A.C.; Adamu, I.M.; Jamil, M.M.; Kefayati, G.H.R.; Mamat, R.; Najafi, G. Recent progress on hybrid nanofluids in heat transfer applications: A comprehensive review. Int. Commun. Heat Mass Transf. 2016, 78, 68–79. [Google Scholar] [CrossRef]
- Sheikholeslami, M.; Farshas, S.A.; Ebrahimpour, Z.; Said, Z. Recent progress on flat plate solar collectors and photovoltaic systems in the presence of nanofluid: A review. J. Clean Prod. 2021, 293, 126119. [Google Scholar] [CrossRef]
- Sheikholeslami, M.; Farshas, S.A.; Said, Z. Analyzing entropy and thermal behavior of nanomaterials through solar collector involving new tapes. Int. Commun. Heat Mass Transf. 2021, 123, 105190. [Google Scholar] [CrossRef]
- Sheikholeslami, M.; Farshas, S.A. Investigation of solar collector system with turbulator considering hybrid nanoparticles. Renew. Energy 2021, 171, 1128–1158. [Google Scholar] [CrossRef]
- Sheikholeslami, M.; Jafaryar, M.; Said, Z.; Alsabery, A.I.; Babazadeh, H.; Shafee, A. Modification for helical turbulator to augment heat transfer behavior of nanomaterial via numerical approach. Appl. Therm. Eng. 2021, 182, 115935. [Google Scholar] [CrossRef]
- Mahian, O.; Kianifar, A.; Kalogirou, S.A.; Pop, I.; Wongwises, S. A review of the applications of nanofluids in solar energy. Int. J. Heat Mass Transf. 2013, 57, 582–594. [Google Scholar] [CrossRef]
- Khanafer, K.; Vafai, K. A review on the applications of nanofluids in solar energy field. Energy 2018, 123, 398–406. [Google Scholar] [CrossRef]
- Said, Z.; Sajid, M.H.; Alim, M.A.; Saidur, R.; Rahim, N.A. Experimental investigation of the thermophysical properties of Al2O3-nanofluid and its effect on a flat plate solar collector. Int. Commun. Heat Mass Transf. 2013, 48, 99–107. [Google Scholar] [CrossRef]
- Rashidi, S.; Akar, S.; Bovand, M.; Ellahi, R. Volume of fluid model to simulate the nanofluid flow and entropy generation in a single slope solar still. Renew. Energy 2018, 115, 400–410. [Google Scholar] [CrossRef]
- Tyagi, H.; Phelan, P.; Prasher, R.; Menezes, A.; Wen, D. Predicted efficiency of a low-temperature nanofluid-based direct absorption solar collector. J. Sol. Energy Eng. Trans. 2009, 131, 041004. [Google Scholar] [CrossRef]
- Yousefi, T.; Veysi, F.; Shojaeizadeh, E.; Zinadini, S. An experimental investigation on the effect of Al2O3-H2O nanofluid on the efficiency of flat-plate solar collectors. Renew. Energy 2012, 39, 293–298. [Google Scholar] [CrossRef]
- Yousefi, T.; Shojaeizadeh, E.; Veysi, F.; Zinadini, S. An experimental investigation on the effect of pH variation of MWCNT-H2O nanofluid on the efficiency of a flat-plate solar collector. Sol. Energy 2012, 86, 771–779. [Google Scholar] [CrossRef]
- Kim, H.; Ham, J.; Park, C.; Cho, H. Theoretical investigation of the efficiency of a U-tube solar collector using various nanofluids. Energy 2016, 94, 497–507. [Google Scholar] [CrossRef]
- Lee, J.H.; Hwang, S.G.; Lee, G.H. Efficiency improvement of a photovoltaic thermal (PVT) system using nanofluids. Energies 2019, 12, 3063. [Google Scholar] [CrossRef] [Green Version]
- Filho, E.P.B.; Mendoza, O.S.H.; Beicker, C.L.L.; Menezes, A.; Wen, D. Experimental investigation of a silver nanoparticle-based direct absorption solar thermal system. Energy Convers. Manag. 2014, 84, 261–267. [Google Scholar] [CrossRef]
- He, Q.; Wang, S.; Zeng, S.; Zheng, Z. Experimental investigation on photothermal properties of nanofluids for direct absorption solar thermal energy systems. Energy Convers. Manag. 2013, 73, 150–157. [Google Scholar] [CrossRef]
- Faizal, M.; Saidur, R.; Mekhilef, S.; Alim, M.A. Energy, economic and environmental analysis of metal oxides nanofluid for flat-plate solar collector. Energy Convers. Manag. 2013, 76, 162–168. [Google Scholar] [CrossRef]
- Lee, Y.; Jeong, H.; Park, J.T.; Delgado, A.; Kim, S. Experimental investigation on evaluation of thermal performance of solar heating system using Al2O3 nanofluid. Appl. Sci. 2020, 10, 5521. [Google Scholar] [CrossRef]
- Shin, D.W.; Kim, S.D.; Jeong, H.M. An experimental study on the solar radiation for heat absorption characteristics of CNT nanofluids. J. Korean Soc. Power Syst. 2019, 6, 19–25. [Google Scholar]
- Das, S.K.; Choi, S.U.S.; Patel, H.E. Heat transfer in nanofluids—A review. Heat Transf. Eng. 2006, 27, 3–19. [Google Scholar] [CrossRef]
- Sarkar, J. A critical review on convective heat transfer correlations of nanofluids. Renew. Sustain. Energy Rev. 2011, 15, 3271–3277. [Google Scholar] [CrossRef]
- Kamyar, A.; Saidur, R.; Hasanuzzaman, M. Application of computational fluid dynamics (CFD) for nanofluids. Int. J. Heat Mass Tran. 2012, 55, 4104–4115. [Google Scholar] [CrossRef]
- Choi, S.U.S.; Zhang, Z.G.; Yu, W.; Lockwood, F.E.; Grulke, E.A. Anomalous thermal conductivity enhancement in nanotube suspensions. Appl. Phys. Lett. 2001, 79, 2252–2254. [Google Scholar] [CrossRef]
- Muhammad, S.; Ali, G.; Shah, Z.; Islam, S.; Hussain, S.A. The rotating flow of magneto hydrodynamic carbon nanotubes over a stretching sheet with the impact of non-linear thermal radiation and heat generation/absorption. Appl. Sci. 2018, 8, 482. [Google Scholar] [CrossRef] [Green Version]
- Back, S.; Shin, D.; Kim, G.; Lee, A.; Noh, J.; Choi, B.; Huh, S.; Jeong, H.; Sung, Y. Influence of amphoteric and anionic surfactants on stability, surface tension, and thermal conductivity of Al2O3/water nanofluids. Case Stud. Therm. Eng. 2021, 25, 100995. [Google Scholar] [CrossRef]
- Alsharif, M.H.; Kim, J.; Kim, J.H. Opportunities and challenges of solar and wind energy in South Korea: A review. Sustainability 2018, 10, 1822. [Google Scholar] [CrossRef] [Green Version]
- Zawrah, M.F.; Khattab, R.M.; Girgis, L.G.; El Daidamony, H.; Abdel Aziz, R.E. Stability and electrical conductivity of water-base Al2O3 nanofluids for different applications. HBRC J. 2014, 12, 227–234. [Google Scholar] [CrossRef] [Green Version]
- Chereches, E.I.; Minea, A.A. Electrical conductivity of new nanoparticle enhanced fluids: An experimental study. Nanomaterials 2019, 9, 1228. [Google Scholar] [CrossRef] [Green Version]
- Kumar, P.G.; Sakthivadivel, D.; Meikandan, M.; Vigneswaran, V.S.; Velraj, R. Experimental study on thermal properties and electrical conductivity of stabilized H2O-solar glycol mixture based multi-walled carbon nanotube nanofluids: Developing a new correlation. Heliyon 2019, 5, e02385. [Google Scholar] [CrossRef] [Green Version]
- Sarojini, K.G.K.; Manoj, S.V.; Singh, P.K.; Pradeep, T.; Das, S.K. Electrical conductivity of ceramic and metallic nanofluids. Colloid Surf. A Physicochem. Eng. Asp. 2013, 417, 39–46. [Google Scholar] [CrossRef]
- Gnaguly, S.; Sikdar, S.; Basu, S. Experimental investigation of the effective electrical conductivity of aluminum oxide nanofluids. Powder Technol. 2009, 196, 326–330. [Google Scholar] [CrossRef]
- Boldoo, T.; Ham, J.; Cho, H. Comprehensive experimental study on the thermophysical characteristics of DI water based Co0.5Zn0.5Fe2O4 nanofluid for solar thermal harvesting. Energies 2020, 13, 6218. [Google Scholar] [CrossRef]
- Chen, M.; He, Y.; Huang, J.; Zhu, J. Synthesis and solar photo-thermal conversion of Au, Ag, and Au-Ag blended plasmonic nanoparticles. Energy Convers. Manag. 2016, 127, 293–300. [Google Scholar] [CrossRef]
- Kulkarni, D.P.; Vajjha, R.S.; Das, D.K.; Oliva, D. Application of aluminum oxide nanofluids in diesel electric generator as jacket water coolant. Appl. Therm. Eng. 2008, 28, 1774–1781. [Google Scholar] [CrossRef]
- Ijam, A.; Saidur, R.; Ganesan, P.; Golsheikh, A.M. Stability, thermo-physical properties, and electrical conductivity of graphene oxide-deionized water/ethylene glycol based nanofluid. Int. J. Heat Mass Tran. 2015, 87, 92–103. [Google Scholar] [CrossRef]
- Pandey, S.D.; Nema, S.K. Experimental analysis of heat transfer and friction factor of nanofluid as a coolant in a corrugated plate heat exchanger. Exp. Therm. Fluid Sci. 2012, 38, 248–256. [Google Scholar] [CrossRef]
- Lee, A.; Beak, S.; Lee, S.; Kim, G.; Noh, J.; Huh, S.; Choi, B.; Sung, Y.; Jeong, H. Functionalized carbon nanotube-cellulose nanocrystal (CNT-CNC) composite buckypaper via various methods for improved hydrophilicity performance and behavior. Appl. Nanosci. 2021, 1–10. [Google Scholar] [CrossRef]
- Baek, S.; Lee, A.; Lee, S.; Park, Y.; Kim, J.; Sung, Y.; Noh, J.; Huh, S.; Choi, B.; Jeong, H. Experimental study on the enhanced thermal performance of two-phase closed thermosiphon using mechanical and chemical treated MWCNTs nanofluids. Microgravity Sci. Technol. 2021, 33, 30. [Google Scholar] [CrossRef]
- Lee, A.; Beak, S.; Lee, S.; Kim, G.; Lee, D.C.; Kim, S.; Sung, Y.; Jeong, H. Hydrophilic/hydrophobic characteristics on the carbon nanotube buckypapers with various mechanical and chemical manufacture process. Diam. Relat. Mat. 2020, 110, 108152. [Google Scholar] [CrossRef]
- Dovjuu, O.; Kim, S.; Lee, A.; Baek, S.; Kim, J.; Noh, J.; Huh, S.; Choi, B.; Sung, Y.; Jeong, H. Structural characteristics of the crystalline nanocellulose and nanocellulose-reinforced carbon buckypaper. Diam. Relat. Mat. 2020, 106, 107821. [Google Scholar] [CrossRef]
Figure 1.
CNTs nanofluid of varying concentrations. (a) 0.01 wt.%, (b) 0.1 wt.%, and (c) 1 wt.%.

Figure 2.
Pictures of the photothermal energy conversion experimental setup. (a) Halogen lamp light source solar simulator, (b) detail of the thermal collector, and (c) schematic diagram of the experimental setup.
Figure 2.
Pictures of the photothermal energy conversion experimental setup. (a) Halogen lamp light source solar simulator, (b) detail of the thermal collector, and (c) schematic diagram of the experimental setup.

Figure 3.
Measured solar radiation in Tongyeong City, South Korea.

Figure 4.
Thermal radiation colormap on halogen lamps and photograph of pyranometer. The marked × represents the center position of the lamps array.
Figure 4.
Thermal radiation colormap on halogen lamps and photograph of pyranometer. The marked × represents the center position of the lamps array.

Figure 5.
Vis absorbance spectra of nanofluids with three different nanoparticle concentrations (where “1 wt.%” indicates distilled water 99 wt.% + 1 wt.% of a certain type of nanoparticles). (a) Multiwalled carbon nanotube, (b) Cu, (c) Al2O3, and (d) absorbance at 600 nm.
Figure 5.
Vis absorbance spectra of nanofluids with three different nanoparticle concentrations (where “1 wt.%” indicates distilled water 99 wt.% + 1 wt.% of a certain type of nanoparticles). (a) Multiwalled carbon nanotube, (b) Cu, (c) Al2O3, and (d) absorbance at 600 nm.

Figure 6.
Electrical conductivity measured at 25 °C for three nanofluid groups with three different nanoparticle concentrations.
Figure 6.
Electrical conductivity measured at 25 °C for three nanofluid groups with three different nanoparticle concentrations.

Figure 7.
Temperature profiles of nanofluids with three different nanoparticle concentrations (where “DW” indicates 100% distilled water). (a) CNTs, (b) Cu, (c) Al2O3, and (d) exposure time at 50 °C.
Figure 7.
Temperature profiles of nanofluids with three different nanoparticle concentrations (where “DW” indicates 100% distilled water). (a) CNTs, (b) Cu, (c) Al2O3, and (d) exposure time at 50 °C.

Figure 8.
Time reduction rate to reach 50 °C of nanofluids with three different nanoparticle concentrations.
Figure 8.
Time reduction rate to reach 50 °C of nanofluids with three different nanoparticle concentrations.


| Material | Specific Heat, Cp (J/kg·K) | Thermal Conductivity, κ (W/m·K) | Density, ρ (kg/m3) |
|---|---|---|---|
| Multiwalled carbon nanotubes (CNTs) | 796 | 3000 | 1600 |
| Copper (Cu) | 385 | 401 | 8940 |
| Alumina (Al2O3) | 773 | 40 | 3960 |
| Base fluid, distilled water (DW) | 4197 | 613 | 997 |
Table 2.
Effect of varying nanoparticle concentration on the exposure time (s) at 50 °C.
| Type | 0.01 wt.% | 0.1 wt.% | 1 wt.% |
|---|---|---|---|
| CNTs nanofluid | 3272 | 3142 | 3138 |
| Cu nanofluid | 3342 | 3268 | 3162 |
| Al2O3 nanofluid | 3476 | 3458 | 3384 |
| Base fluid, DW | 3756 | 3756 | 3756 |
Table 3.
Effect of varying nanoparticle concentration on the specific heat (J/kg·°C) of nanofluids obtained from the experiment.
Table 3.
Effect of varying nanoparticle concentration on the specific heat (J/kg·°C) of nanofluids obtained from the experiment.
| Type | 0.01 wt.% | 0.1 wt.% | 1 wt.% |
|---|---|---|---|
| CNTs nanofluid | 3752 | 3648 | 3635 |
| Cu nanofluid | 3820 | 3752 | 3660 |
| Al2O3 nanofluid | 3934 | 3919 | 3862 |
| Base fluid, DW | 4200 | 4200 | 4200 |
Publisher’s Note: MDPI stays neutral with regard to jurisdictional claims in published maps and institutional affiliations. |
© 2021 by the authors. Licensee MDPI, Basel, Switzerland. This article is an open access article distributed under the terms and conditions of the Creative Commons Attribution (CC BY) license (https://creativecommons.org/licenses/by/4.0/).
Share and Cite
MDPI and ACS Style
Lee, Y.; Jeong, H.; Sung, Y. Thermal Absorption Performance Evaluation of Water-Based Nanofluids (CNTs, Cu, and Al2O3) for Solar Thermal Harvesting. Energies 2021, 14, 4875. https://0-doi-org.brum.beds.ac.uk/10.3390/en14164875
AMA Style
Lee Y, Jeong H, Sung Y. Thermal Absorption Performance Evaluation of Water-Based Nanofluids (CNTs, Cu, and Al2O3) for Solar Thermal Harvesting. Energies. 2021; 14(16):4875. https://0-doi-org.brum.beds.ac.uk/10.3390/en14164875
Chicago/Turabian StyleLee, Youngho, Hyomin Jeong, and Yonmo Sung. 2021. "Thermal Absorption Performance Evaluation of Water-Based Nanofluids (CNTs, Cu, and Al2O3) for Solar Thermal Harvesting" Energies 14, no. 16: 4875. https://0-doi-org.brum.beds.ac.uk/10.3390/en14164875
Note that from the first issue of 2016, this journal uses article numbers instead of page numbers. See further details here.