
Optimal Sizing of PV/Wind/Battery Hybrid Microgrids Considering Lifetime of Battery Banks

1
College of Electrical Engineering and Automation, Fuzhou University, Fuzhou 350108, China
2
Department of Electrical Engineering, Yuan Ze University, 135, Yuan-Tung Road, Chung-Li, Taoyuan 32003, Taiwan
3
Department of Electrical Engineering, National Taiwan University of Science and Technology, 43, Keelung Road, Section 4, Taipei 10607, Taiwan
*
Author to whom correspondence should be addressed.
Energies 2021, 14(20), 6655; https://0-doi-org.brum.beds.ac.uk/10.3390/en14206655
Submission received: 4 September 2021
/
Revised: 30 September 2021
/
Accepted: 9 October 2021
/
Published: 14 October 2021
(This article belongs to the Special Issue Frontiers in Smart Grids: Systems and Devices)
Abstract
:Power system scheduling of renewable energy sources has been studied extensively due to the severe increase in pollution caused by conventional energy sources. In this study, a multi-objective scheduling model of a hybrid microgrid is proposed to minimize the cost of hybrid microgrids and maximize the power supply reliability. The main power generation units such as the wind turbines, photovoltaic (PV) cells, and battery banks are used in this hybrid microgrid. In this study, the optimal sizing of PV panels and battery banks are obtained using multi-objective particle swarm optimization (MOPSO) for the proposed multi-objective scheduling model. The lifetime of battery banks is considered in the energy storage system (ESS) model. Finally, the practicality of the scheduling model proposed in this study is verified by four examples.
1. Introduction
1.1. Background
The emergence of energy shortages and environmental pollution has led to the optimization of the size of distributed generations (DGs), particularly for renewable power sources (wind power and photovoltaic (PV) cells) [1,2,3]. A microgrid can integrate DGs, an energy storage system (ESS), and a load, and it can operate in the islanded mode or grid-connected mode, which is an important aspect of future power systems [4].
The increase in capacity proportion of wind power generation and PV power generation in microgrids has resulted in challenges regarding power dispatch of the power system because of its intermittency characteristics and the uncertainties related to the output power of renewable energy [5]. The ESS ensures the safety and reliability of power systems [6]. Additionally, it is important to optimize the size of PV power generation, wind power generation, and battery banks in power systems. Sufficient PV power generation, wind power generation, and battery banks can fulfill the load demand of the users. Simultaneously, they can also increase the cost of the hybrid microgrid. Conversely, insufficient PV power generation, wind power generation, and battery banks cannot fulfill the load demand of the users.
1.2. Literature Reviews
Recently, several scholars have conducted multiple studies to optimize the number of hybrid microgrids with PV panels, wind turbines, and battery banks. In [7], the capacities of hybrid microgrids of PV generation and wind generation were optimized to maximize the economic profit based on an evaluation performed using a profit–cost ratio. In [8], the optimal sizes for wind turbines, PVs, and diesel generators were obtained by minimizing the investment and fuel costs. The Markov model was applied to the genetic algorithm, and the optimal numbers of wind turbines, PVs, and diesel generators were determined. In [9], a method of determining the optimal number of PV cells and wind turbines in a stand-alone hybrid microgrid system, consisting of wind power, PV panels, and diesel energy, was obtained by solving the economic dispatch. In [10], the optimum size of ESS was determined by adapting to the specific photo-voltaic penetration level on the distribution feeder. In [11], a clustering based on a time-dependent approach was proposed to evaluate the effect of wind and solar generators to improve the reliability of power supply. This approach is efficient compared with that of existing methods. In [12], an optimal sizing model was proposed to determine the optimum system configuration by minimizing the annualized cost of the systems. In [13], a system with a load, PV power, and wind power generation was presented to optimize the size of intermittent renewable energy resources in microgrids. In [14], an optimum sizing model was proposed to optimize the number of several power generation units of the hybrid microgrid. The functions of electricity cost and the reliability of power supply were considered in this model.
1.3. Aim and Contributions
The abovementioned studies focus on optimizing the size of DGs based on a variety of dispatch models such as the economic dispatch model and emission dispatch model. However, the lifetime of the battery banks has rarely been considered while determining the cost of battery banks used in hybrid microgrids. The cost of battery banks was commonly expressed by the depreciation of the investment cost of battery banks.
In this study, a multi-objective scheduling model that considers the lifetime of battery banks is proposed to optimize the number of battery banks and PV panels. The multi-objective function of the proposed scheduling model is to minimize the loss of power supply probability (LPSP) and the cost of the hybrid microgrid.
1.4. Paper Organization
In Section 2, we present the generation unit models, including the PV generator, wind generator, and ESS. The ESS model considers the lifetime of battery banks. Section 3 proposes a multi-objective scheduling model, which includes the multi-objective function and a set of constraints. The flowchart of the scheduling model is described, and the multi-objective particle swarm optimization (MOPSO) algorithm is presented in Section 4. In Section 5, the simulation results of the four different cases are compared to verify the practicality of the multi-objective scheduling model. Finally, the conclusion is presented in Section 6.
2. Generation Unit Models
In this work, a hybrid microgrid consists of battery banks, PV generation, and wind generation. These DGs, inverters, and controllers are the essential components in a hybrid microgrid. The mathematical models of the DGs are introduced as follows.
2.1. PV Generation Model
Solar radiation intensity and temperature are the critical factors that determine the output power of PV panels [15]. The output power of the PV model can be expressed as follows [16,17,18]:
where PPV is the PV power, Tr is the standard PV temperature of panels (which is set to 25 °C), TS is the surface temperature of the PV panels, n is the temperature coefficient which is set to −3.7 × 10⁻³ (1/°C), GSTC is the solar radiation intensity in the standard test environment, GC is the solar radiation intensity, and Pmax is the maximum PV power at the standard test conditions.
2.2. Wind Generation Model
The wind power curve is the foundation of the wind generation model. Generally, the output power of a wind turbine is determined by the following parameters: (1) cut-in wind speed (a starting wind speed for the wind turbine), and (2) cut-off wind speed (a stopping wind speed for the wind turbine). If the wind speed is excessively high, the wind turbine should be slowed down to improve the safety of wind turbine. The wind generation model can be expressed as follows [19]:
where Pwind(t) is the output power of wind time t, and vin and vout are the cut-in and cut-out wind speed, respectively. v(t) is the wind speed at time t, Pr is the rated power of the wind turbine, ,, and vrated is the rated wind speed.
2.3. ESS Lifetime Model
The output power of wind turbines and PV panels cannot ensure power supply to microgrids in islands due to the randomness and fluctuation in wind speed and solar radiation, respectively. Therefore, the ESS is supplemented to reduce the shortage of power supply. ESS promotes the penetration of renewable DG resources and improves the power supply reliability [20]. In this work, the lifetime of battery banks was considered in the ESS model.
The operation process of ESS can be divided into two processes: the discharging process and the charging process. During the operation of ESS, the state of charge (SOC) is increased during the charging process and the SOC is decreased during the discharging process.
During the charging process, the SOC of ESS can be expressed as [21]:
where S(t) is the SOC of ESS at time t, Eess is the rated capacity of ESS, Pchar(t) is the charging power of ESS at time t, and ηchar is the charging efficiency of ESS.
During the discharging process of ESS, the SOC of ESS can be expressed as [21]:
where ηdis is the discharging efficiency of ESS and Pdis(t) is the discharging power of ESS at time t.
Generally, the cost of ESS is divided into two parts [21]: the operational and maintenance cost, and the depreciation cost. The cost of ESS can be described as the following equation:
where CESS is the cost of ESS, CESS.DP is the depreciation cost of ESS, and CESS.mainten is the operational and maintenance cost of ESS.
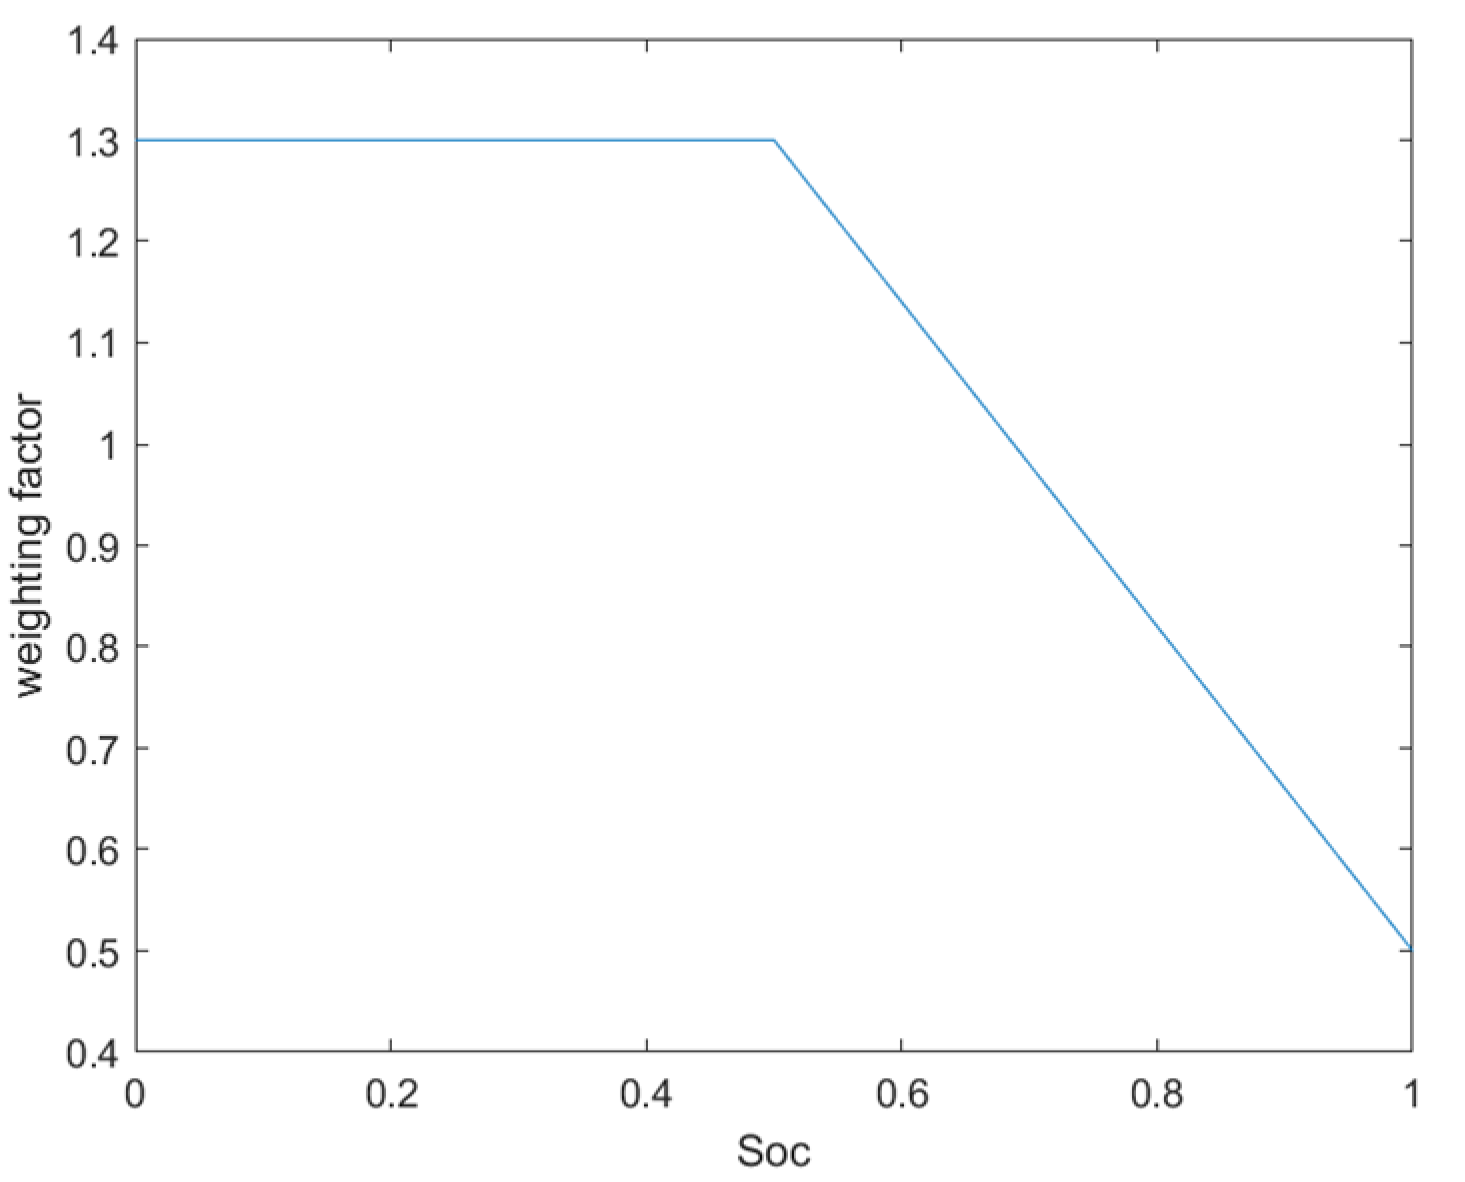
The depreciation cost of ESS is determined by the investment cost of battery banks and the SOC of battery banks [22]. Therefore, in this study, the depreciation cost of ESS was evaluated by considering the lifetime of battery banks. The energy throughput of battery lifetime is mainly related to its rated capacity, and it was assumed that it is a fixed value [6]. As shown in Figure 1 [23], at a lower value of SOC, the discharging power of 1 kWh will consume additional energy from the energy throughput of the battery lifetime.
As shown in Figure 1, the relationship between the state of charge and weighting coefficient can be expressed as:
where f(S(t)) is the weighting coefficient related to SOC.
From the above analysis, the battery loss coefficient considering its lifetime can be expressed by the following equation:
where λESS is the battery loss coefficient and Etotal is the energy throughput of the battery lifetime.
where NC is the number of discharge cycles during the battery lifetime and Pdischar is the output power of one cycle discharge of ESS.
Subsequently, the depreciation cost of ESS can be expressed as follows:
where CE is the investment cost coefficient of ESS energy capacity, CP is the investment cost of ESS power capacity, and Pess is the rated power of ESS.
3. Problem Formulation
3.1. Multi-Objective Scheduling Model
The economy and power supply reliability are the most important optimization problems of power system scheduling. The multi-objective scheduling model proposed in this paper minimizes the cost of the hybrid microgrid and the LPSP.
The purpose of the proposed multi-objective scheduling model is to optimize the number of battery banks and PV panels. It should be noted that the rated capacity of wind turbines was fixed in this work. In this section, the proposed multi-objective function is described as:
3.1.1. Economic Objective
The economic objective aims to minimize the cost of the hybrid microgrid, including the annualized cost of wind power, PV power, and battery banks. The cost in the hybrid microgrid, f1, is minimized in this objective, and it can be expressed as:
The first item of (10), the cost of wind power, Cwind, can be expressed as:
where Cwind.invest is the investment cost of wind power generation, Cwind.mainten is the operational and maintenance cost of wind power, r is the annual interest rate, and n1 is the lifetime of wind turbines.
The second item of (10), the cost of PV power, CPV, can be expressed as:
where CPV.invest is the investment cost of PV power generation, CPV.mainten is the operational and maintenance cost of PV power, and n2 is the lifetime of PV panels.
The third item of (10), the cost of ESS, CESS, can be expressed as:
where kmainten is the operational and maintenance factor of battery banks.
3.1.2. Power Supply Reliability Objective
The second objective is to ensure the reliability of the power supply, which is represented by LPSP in this paper. The LPSP is minimized in this objective, which is expressed as [18]:
where NPV is the number of PV panels, L(t) is the load at time t.
3.2. Constraints
The generation units are subjected to several constraints. Therefore, the following constraints should be considered: the power balance constraints, PV power constraints, wind power constraints, ESS constraints, and the number of generator constraints.
3.2.1. Power Balance Constraint
Power generation and load demand subjected to the power balance constraint can be expressed as:
3.2.2. PV Power Constraint
The PV power should be limited by the output power of PV panels. Therefore, the PV power constraint is expressed as:
where PPV.max(t) is the maximum value of PV power at time t.
3.2.3. Wind Power Constraint
Wind power should be limited by the output power of wind turbines. The wind power constraint can be expressed as:
where Pwind.max(t) is the maximum value of wind power at time t.
3.2.4. ESS Constraint
The constraints of ESS include the SOC constraint of battery banks and the constraints of battery bank discharging and charging power. The SOC of ESS should be limited to a set range and it is expressed as:
where Smin is the lower limit SOC of battery banks, and Smax is the upper limit SOC of battery banks.
For the SOC of ESS, the initial value SOC is equal to the final SOC during the whole dispatch process. This constraint can be expressed as:
The charging power and discharging power of battery banks are limited as follows:
where Pdis.max is the upper limit of discharging power of a battery bank, Pchar.max is the upper limit of charging power of a battery bank, and Nbattery is the number of battery banks.
3.2.5. Control Variables
The capacity of wind turbines was fixed in the hybrid microgrid. Therefore, the number of battery banks and PV panels were the control variables in the multi-objective scheduling model. Therefore, these control variables should be subjected as following:
where NPV.max is the upper number of PV panels, and Nbattery.max is the upper number of battery banks. Additionally, NPV.max and Nbattery.max were set to 600 and 200, respectively.
4. Optimization Algorithm
In this work, MOPSO [24] was used to solve the proposed multi-objective function, and to determine the optimum number of battery banks and PV panels.
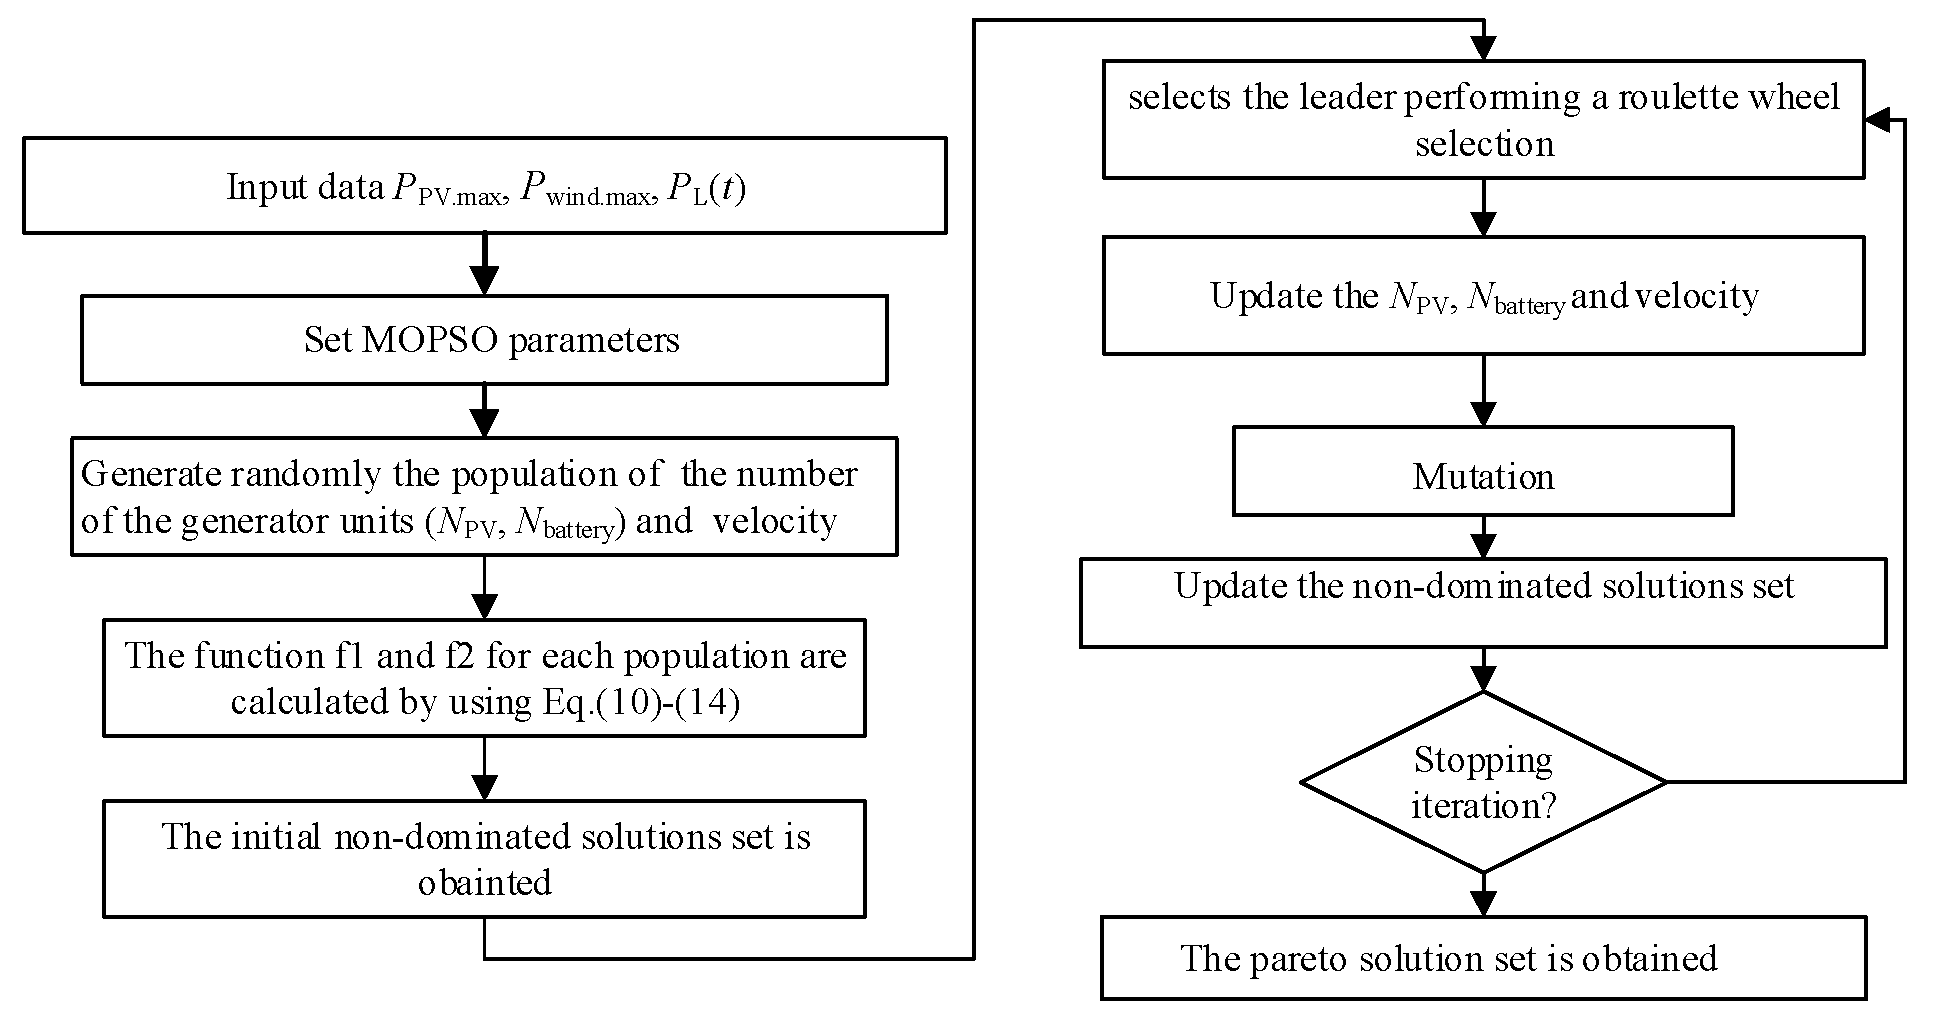
Figure 2 describes the flowchart of the multi-objective scheduling model using MOPSO. Finally, a Pareto optimal set was obtained. The stepwise procedure of optimization is described as follows:
- (1)
- Input the data, including load demands, the output power of wind turbines, and a PV panel.
- (2)
- Set MOPSO parameters.
- (3)
- Generate the population of control variables (NPV and Nbattery).
- (4)
- Calculate the multi-objective function f1 and f2 for each population using (10)–(14).
- (5)
- Search the initial nondominated solutions set from the population set generated in Step 3.
- (6)
- Select the leader by performing a roulette wheel selection.
- (7)
- Update the NPV, Nbattery.
- (8)
- Mutate and update the nondominated solutions.
- (9)
- Should the iteration procedure be stopped? If the iteration procedure is continued, go to Step 6; if the iteration procedure is stopped, the Pareto solution set is obtained.
From the above optimization algorithm, the Pareto optimal set can be determined using MOPSO. Since there are several optimal solutions in the Pareto optimal set, one optimal solution should be selected according to a determined preference [25]. The optimal solution is selected using the following formula:
where Mn is the normalized function value of n optimal solution, n is the total number of Pareto solutions, mk is the standardized objective function of k objective function, Fk is the value of k objective function, and Fk.max and Fk.min are the maximum and minimum value of k objective function, respectively. Subsequently, the optimal solution is obtained according to the maximum value of Mn.
5. Case Study
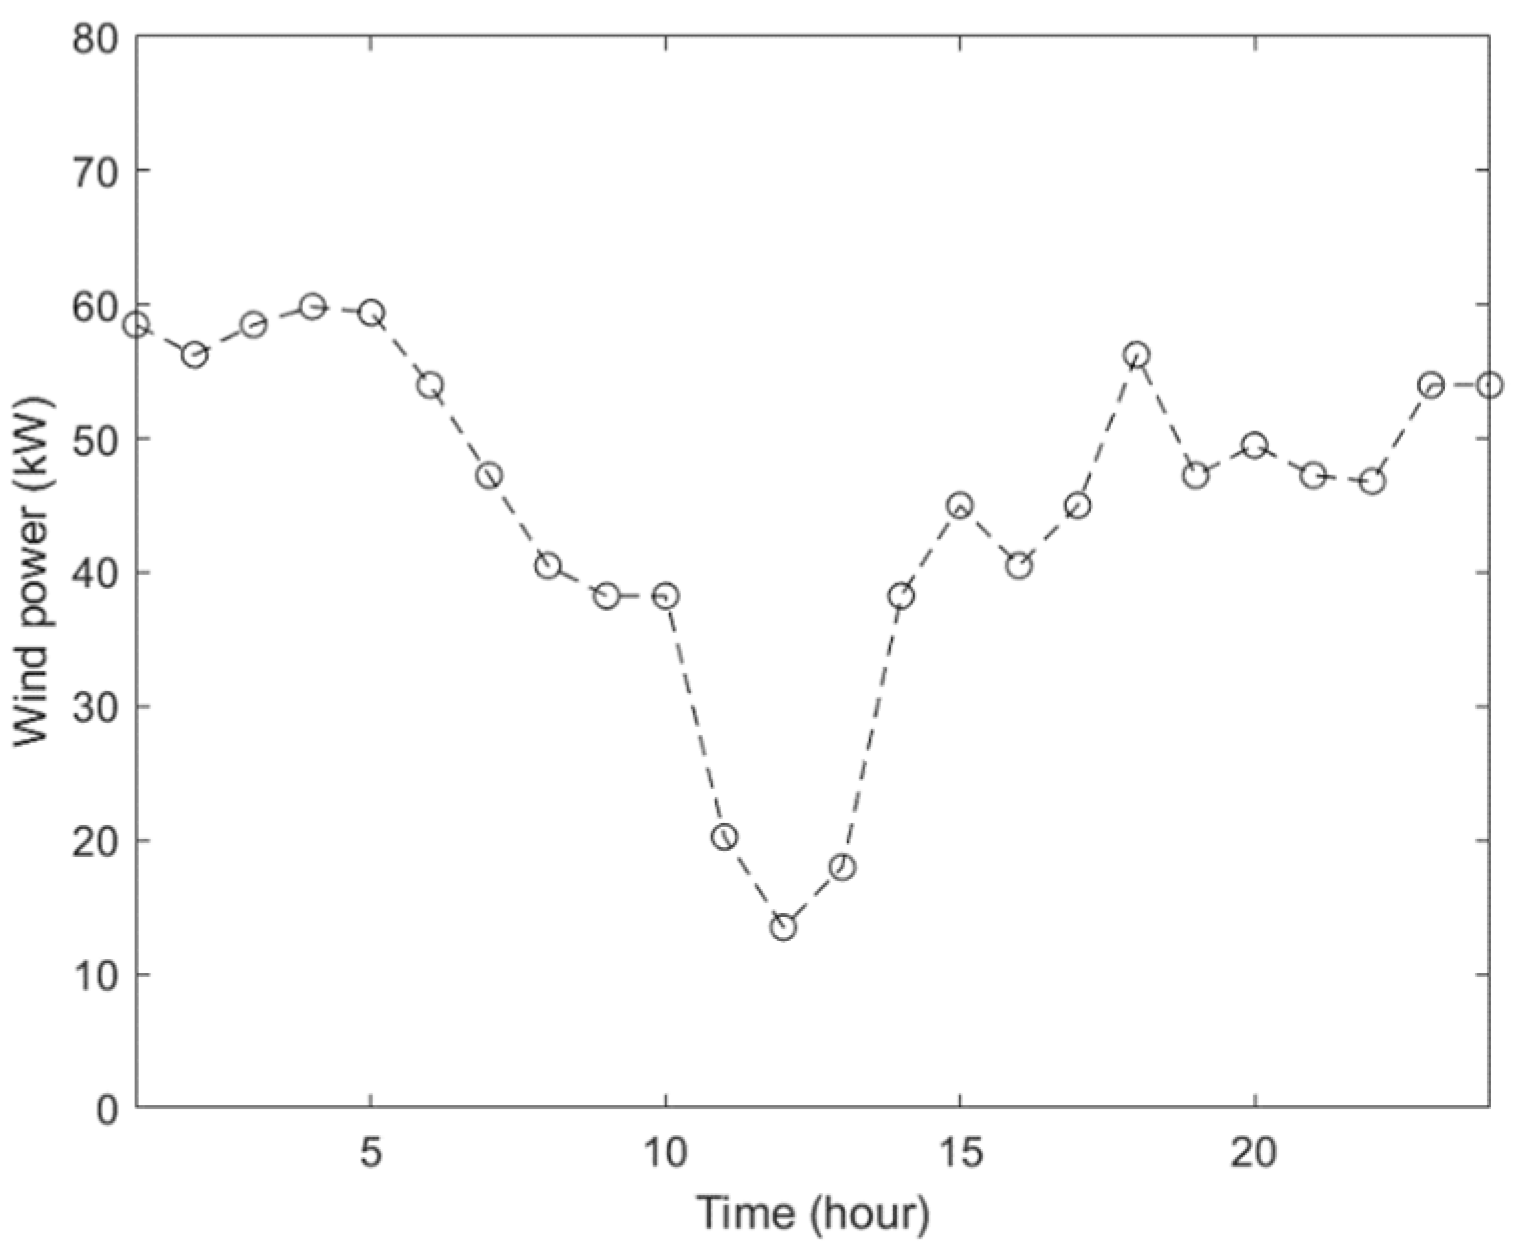
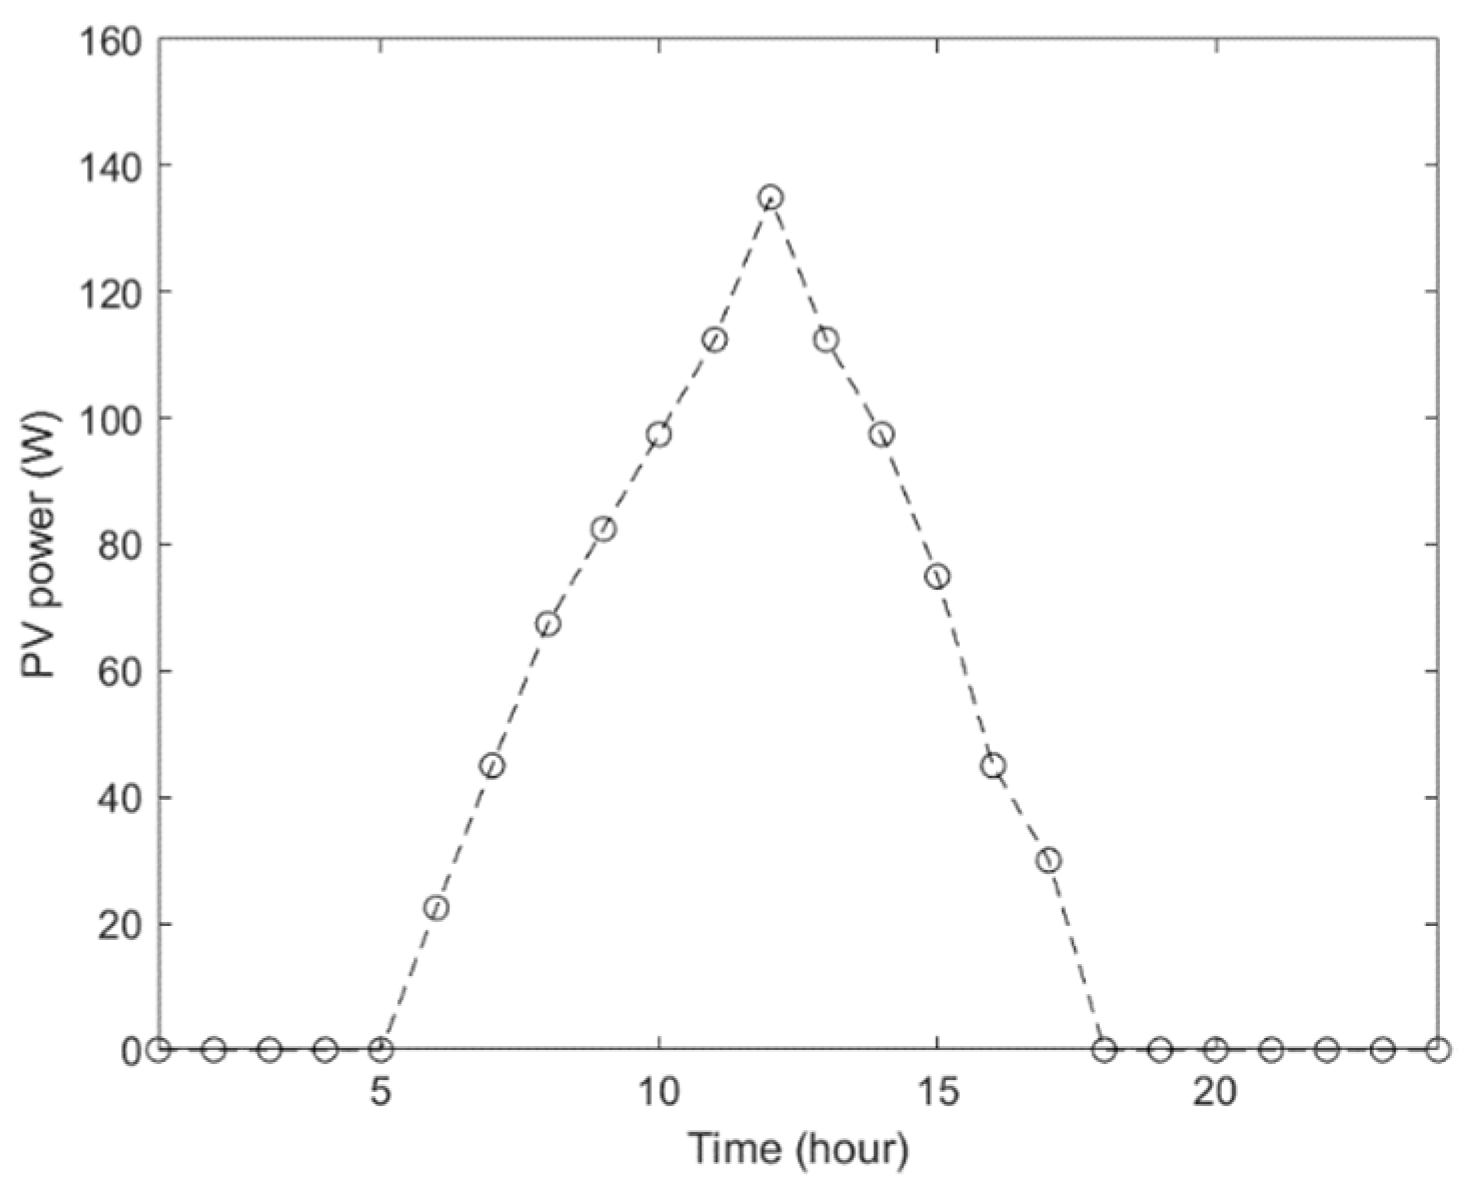
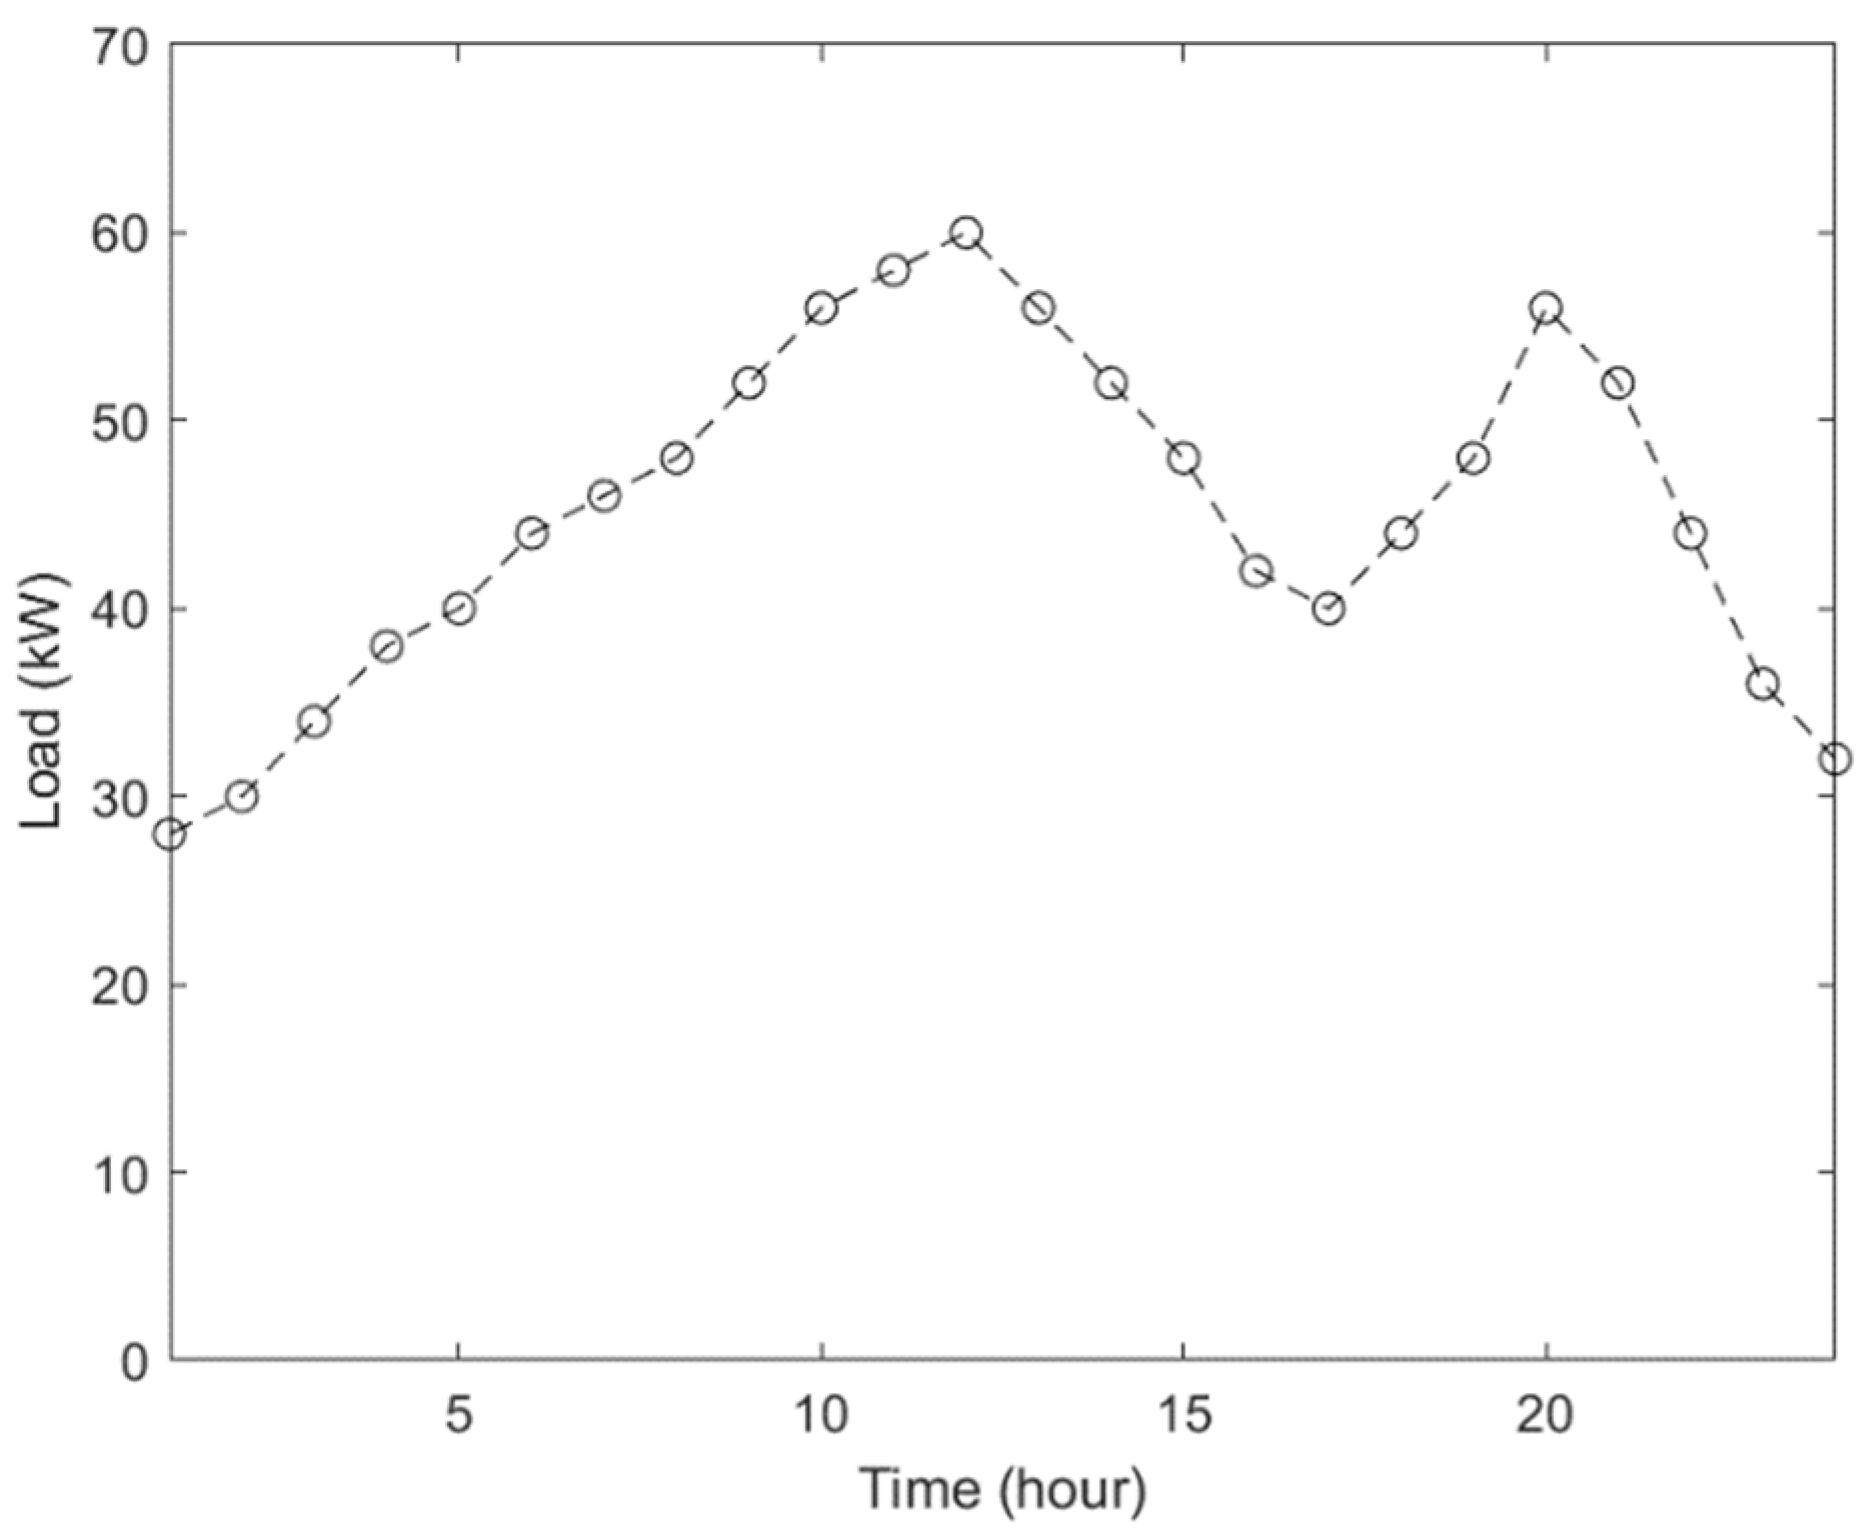
A hybrid microgrid with PV power generation, wind power generation, and ESS was constructed to validate the proposed multi-objective scheduling model. The parameters of the battery bank shown in Table 1 are extracted from [6,26] with a few modifications. The parameters of the PV panel and wind turbine are shown in Table 2, which were extracted from [27]. The rated capacity of wind turbines was fixed to 6000 kW in the hybrid microgrid. The daily output power curve with the PV panel is shown in Figure 3, and the daily output power curve of wind turbines is shown in Figure 4. Figure 5 illustrates the daily load demand curve. The upper limit of PV panels and battery banks in the hybrid microgrid was set to 500 in this section.
The proposed multi-objective scheduling model was solved using MOPSO. The parameters of MOPSO are described as follows: the repository size was 100, the population size was 100, and the iteration number was 100. The MOPSO algorithm was implemented on MATLAB.
Considering the uncertain characteristics of load demand, solar radiation, and wind speed, it was assumed that the deviations of load demand, wind output power, and PV output power followed the standard normal distribution. According to the historical data, the following scenarios were proposed to present the probability distribution of wind output power, PV output power, and load demand in several scenarios:
where load, PV, and wind are the set of load demand, PV power, and wind power, respectively. Each set has five scenarios and their corresponding probabilities.
Four different cases were proposed in this section to verify the practicality of the multi-objective scheduling model. The number of battery banks and PV panels was optimized by solving the proposed multi-objective scheduling model for these four cases. The simulation results of these four cases were analyzed. The effects of lifetime and upper limits of SOC for ESS were taken into account. The detailed differences between the four cases are described as follows:
Case 1: The lifetime of the battery banks is considered. The upper limit of SOC of battery banks is 0.9 in this case. Additionally, the wind power generation, PV power generation, and ESS constitute the hybrid microgrid.
Case 2: The hybrid microgrid includes the PV power generation, wind power generation, and ESS. The upper limit of SOC of the battery banks is 0.9. It is assumed that the relationship between the SOC of the battery and the weighting factor is fixed at 1. This means that the effect of SOC on the depreciation cost of ESS is ignored in this case.
Case 3: The hybrid microgrid includes the PV power generation, wind power generation, and ESS. The lifetime of the battery is considered in this case. The upper limit of SOC of the battery banks is 0.8.
Case 4: The hybrid microgrid only includes the PV power generation and wind power generation, without the ESS.
5.1. Comparison Analysis
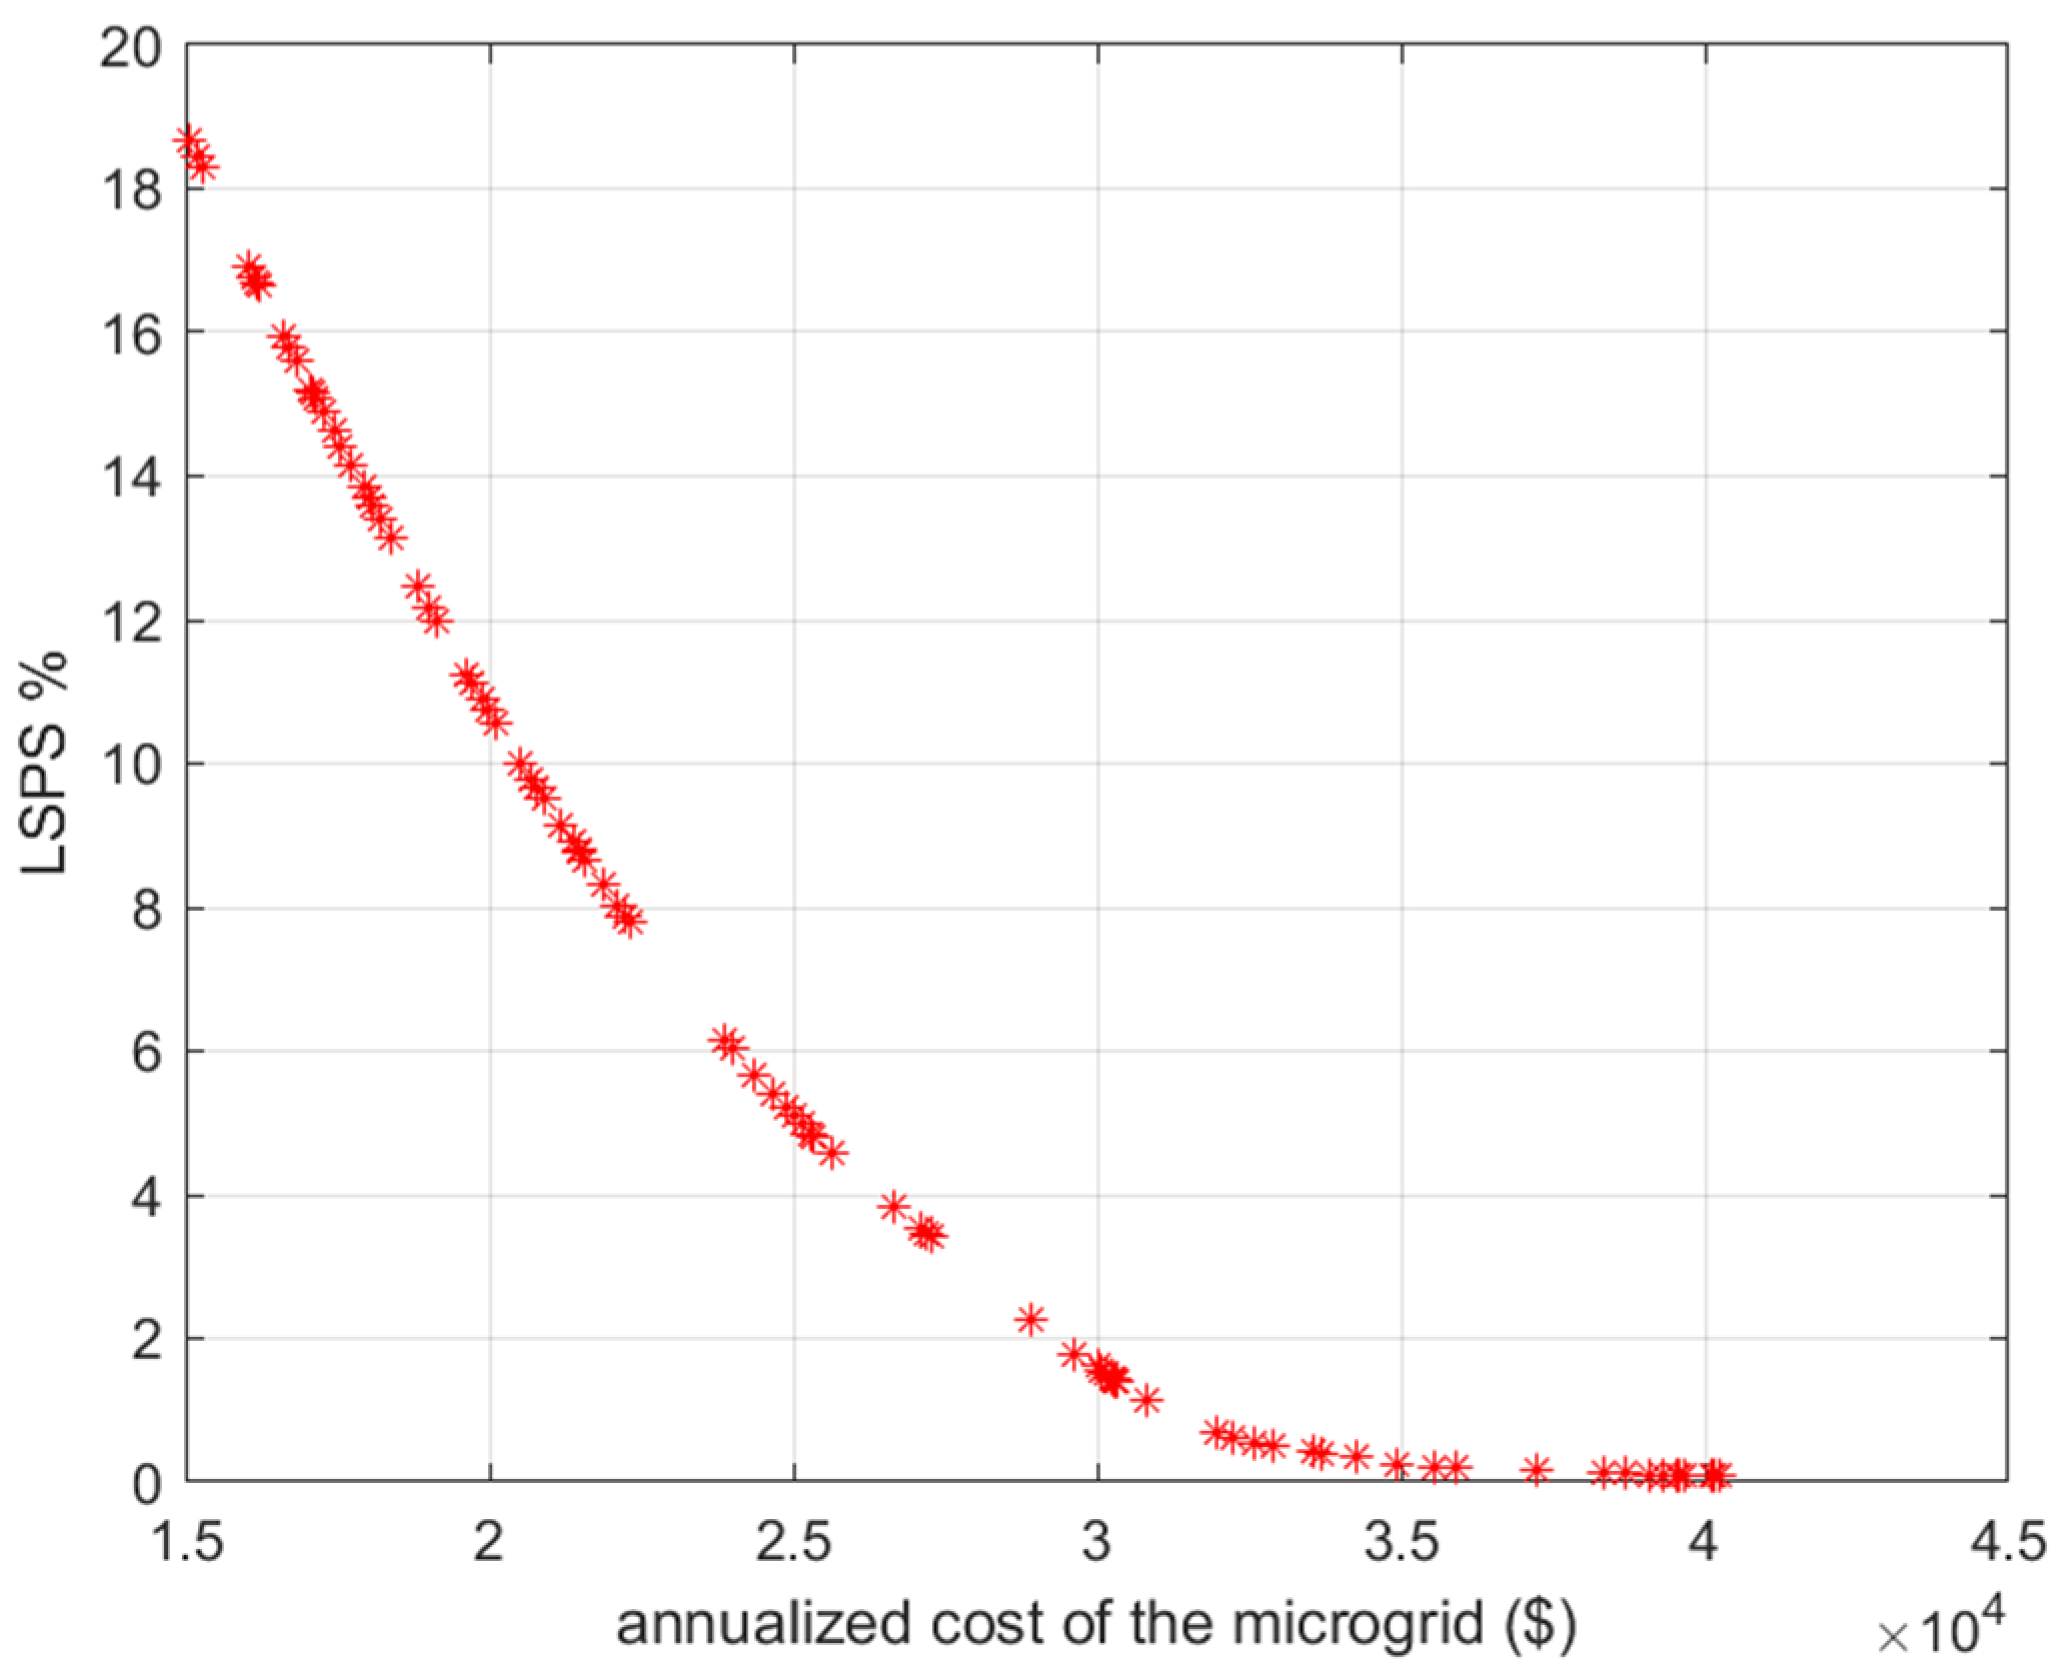
The power shortage is related to the power supply reliability of the hybrid microgrid. For an islanding microgrid, the reliability of the hybrid microgrid is determined by the capacity configuration of each power source; however, this has a significant effect on the annualized cost of the hybrid microgrid. The relationship between the power shortage rate and cost of the hybrid microgrid is shown in Figure 6.
It can be observed from Figure 6 that the power supply reliability of the hybrid microgrid increased with a decrease in LPSP. However, the annualized cost of the hybrid microgrid increased significantly due to the increase in power supply configuration. This indicates that the improvement of system reliability should increase the investment. When the capacity configuration is sufficiently large, a reliable power supply can be ensured, but the annualized cost is significantly high.
The simulation results of the four cases are shown in Table 3. Table 3 depicts the multi-objective function, the cost of the DGs, the optimal number of battery banks, and the optimal number of PV panels. Figure 7 and Figure 8 show the SOC curve of the ESS in these cases.
In Case 1, the optimal number of PV panels and battery banks were 282 and 79, respectively. The total cost of the hybrid microgrid was USD 30,557. The cost of the battery banks and PV power generations were USD 4165 and USD 11,433, respectively. The depreciation cost of battery banks was USD 3691. This case served as a baseline to analyze the effect of the lifetime of battery banks, the effect of the maximum SOC of battery banks, and the effect of the ESS.
5.2. Effect of Lifetime for ESS
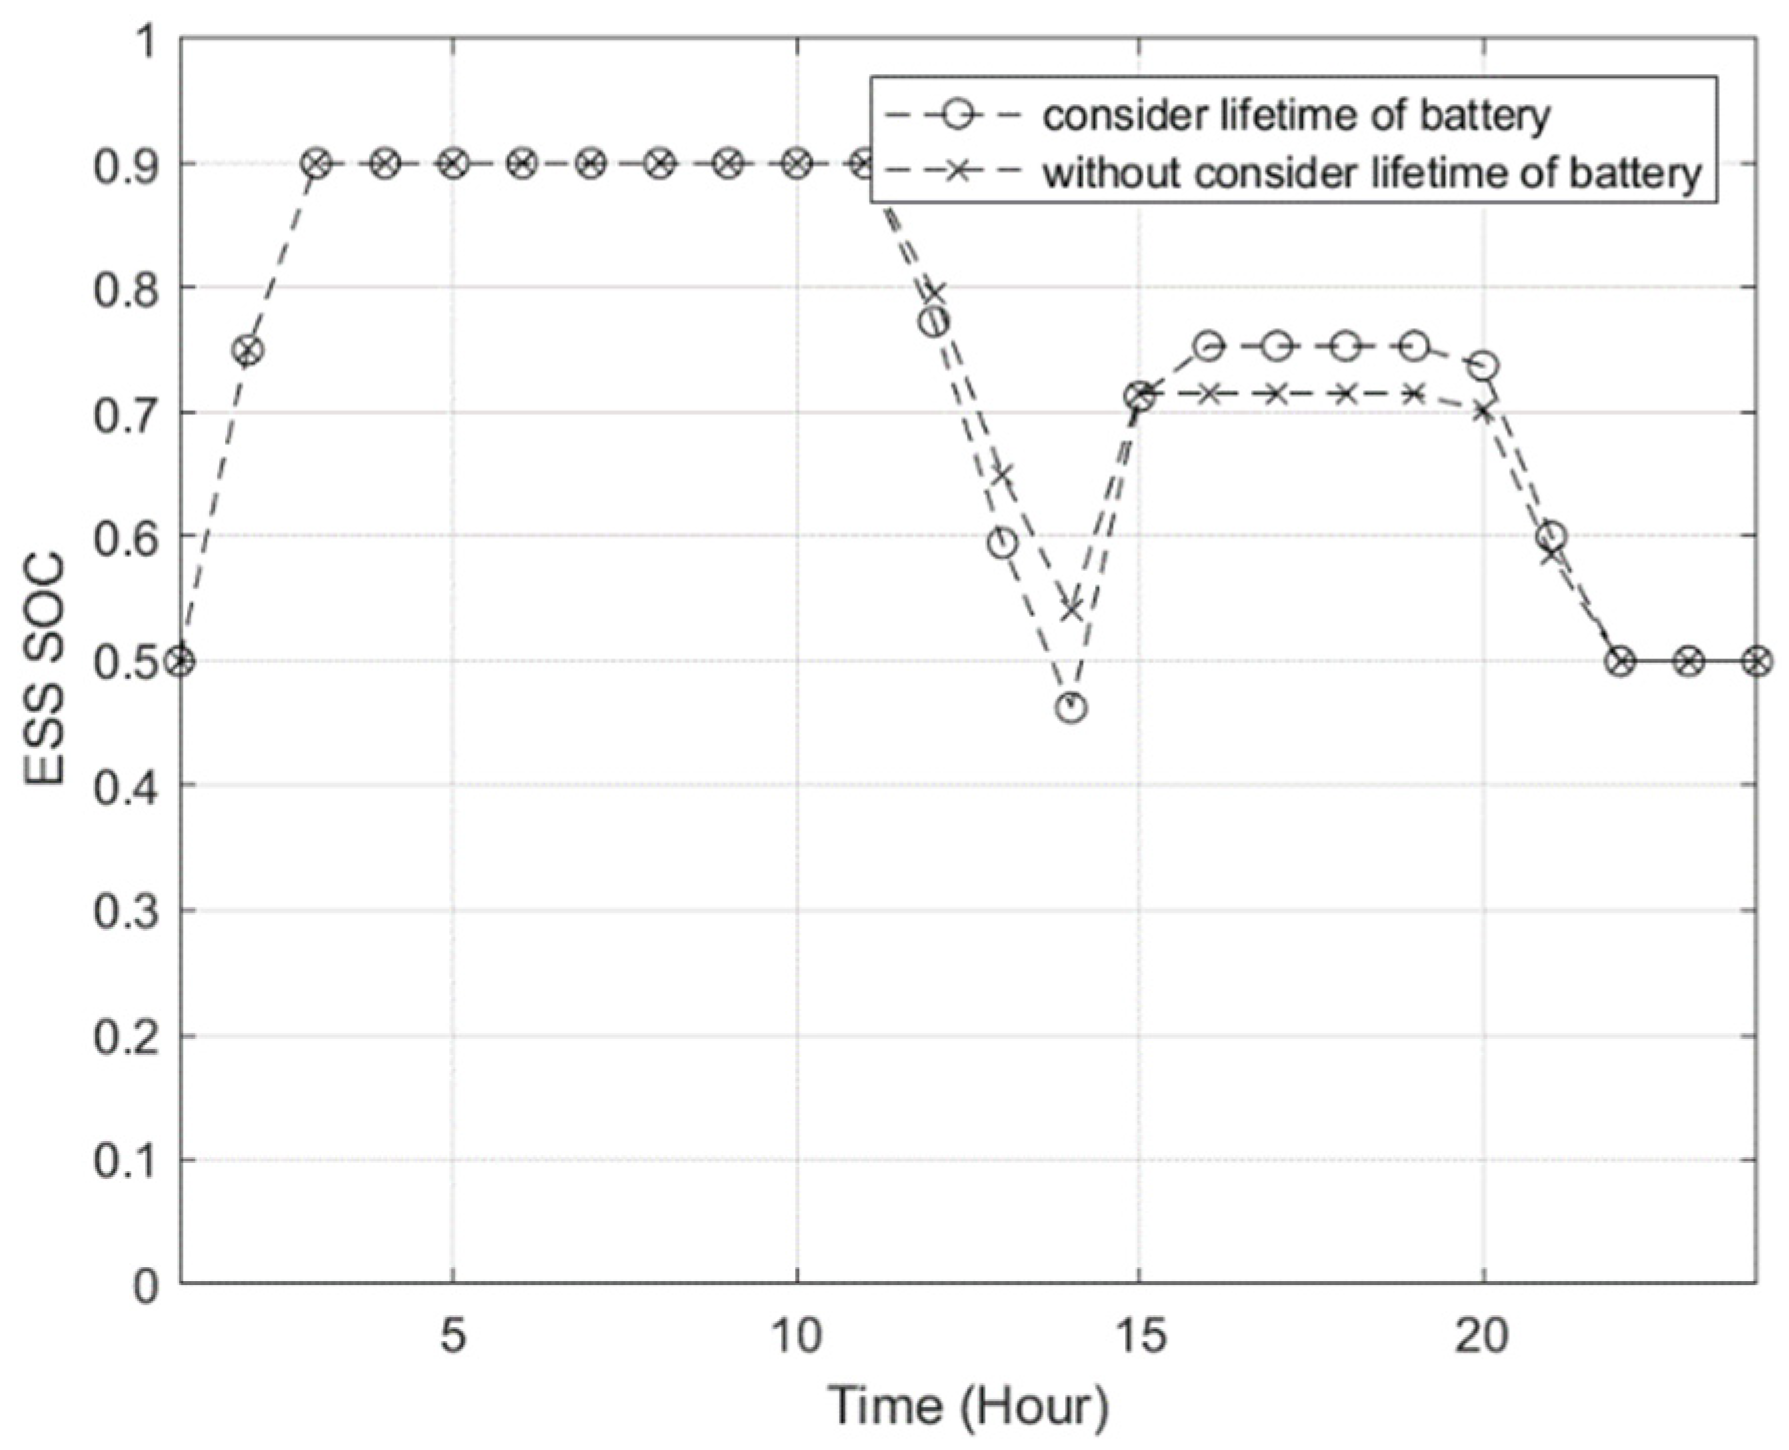
The difference between Case 1 and Case 2 is the consideration of the lifetime of battery banks. The simulation results of these two cases are shown in the second and third rows of Table 3, and the SOC curves of the ESS are shown in Figure 7.
From the simulation results shown in Figure 7, it can be observed that the SOC of the ESS of Case 1 was slightly higher than that of Case 2. This is observed because the effect of SOC on the depreciation cost of the ESS was considered in Case 1. This maximizes the SOC of the ESS to minimize the depreciation cost of the ESS. In contrast, neglecting the lifetime of battery banks in Case 2 increased NPV and Nbattery by 2 and 14, respectively. The costs of the microgrid, the PV panels, and the battery banks increased by USD 322, USD 81, and USD 241, respectively. However, since the number of battery banks and PV panels in Case 2 was greater than that in Case 1, the LPSP in Case 1 was worse than that in Case 2. Therefore, the power supply reliability in Case 1 was lower than that in Case 2.
5.3. Effect of Upper Limit of SOC for ESS
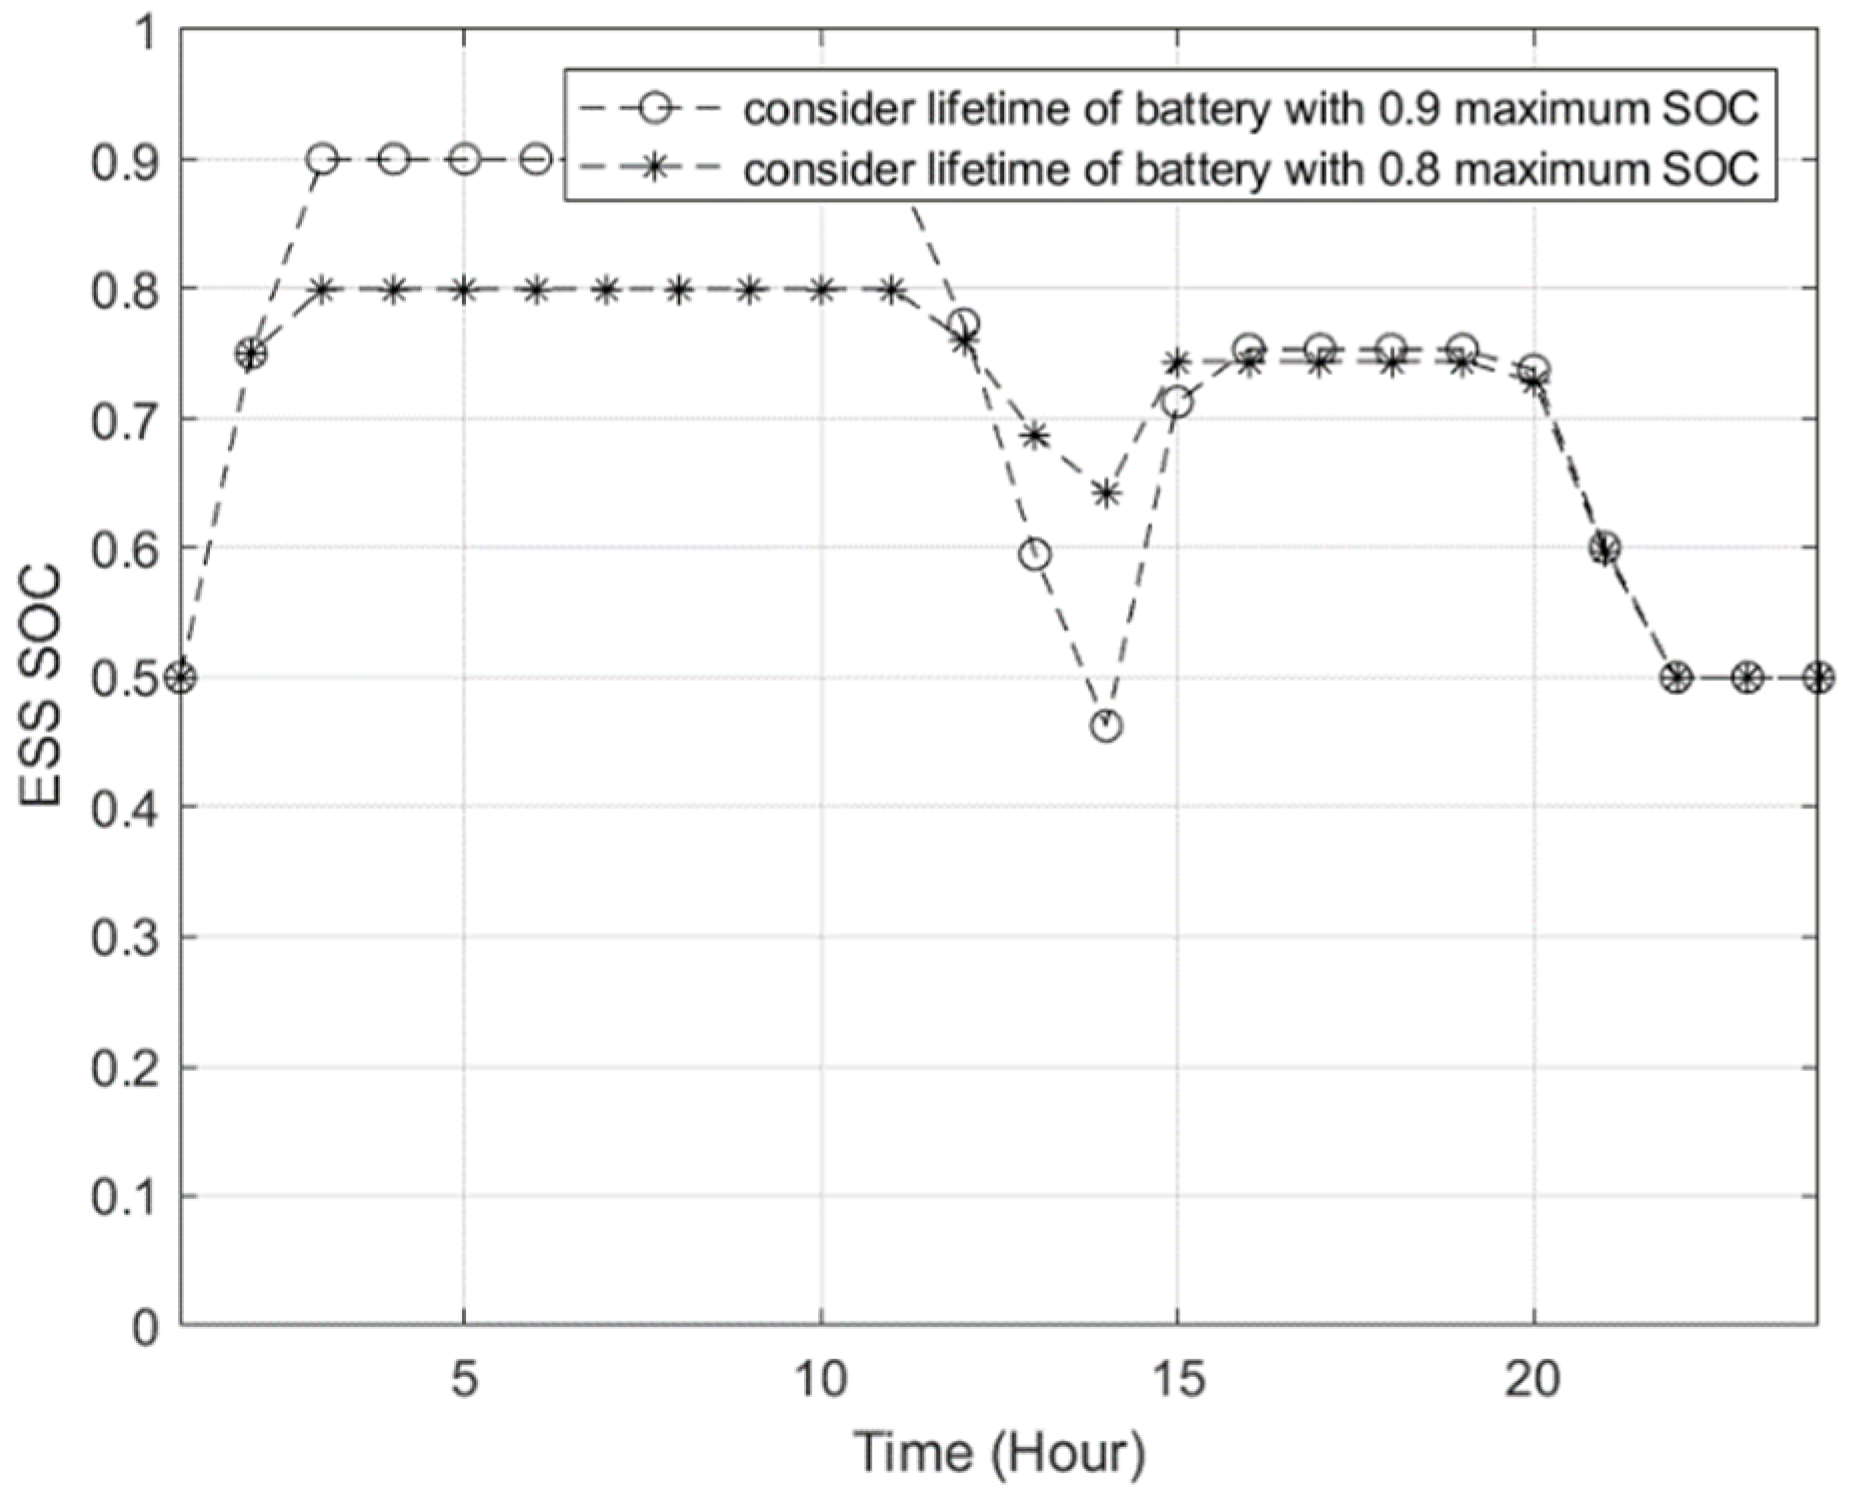
The difference between Case 1 and Case 3 is the maximum SOCs of the ESS. The lifetime of the battery was considered in Case 1 and Case 3. The simulation results for Case 3 are shown in the fourth row of Table 3. The SOC curves of Case 1 and Case 3 are all shown in Figure 8.
By comparing the simulation results of Case 1 and Case 3, it can be observed that the additions of PV panels and battery banks in Case 3 were 36 and 3, respectively. The lower maximum SOC of battery banks in Case 3 decreased the discharging and charging power of the ESS. The number of PV panels and battery banks connected to the microgrid was increased. Additionally, the cost of PV power, and the operational and maintenance cost of ESS increased by USD 1459 and USD 18, respectively. Furthermore, the LPSP decreased by 0.31% because the number of PV panels and battery banks connected to the hybrid microgrid increased. Figure 8 depicts that the charging and discharging power was greater in Case 1 than that in Case 3.
5.4. Effect of ESS
The ESS was not applied in Case 4, and the simulation results in Case 4 are shown in Table 3.
It can be observed from the simulation results that the optimal number of PV panels in Case 4 increased by 79 because the discharging and charging power for ESS were zero. The LPSP increased by 1.12%. In this result, the effect of the ESS on improving the reliability of the power supply is reflected. However, the annualized cost of the microgrid decreased by USD 963 because the number of battery banks was zero in Case 4.
After considering the lifetime of battery banks, an accurate number of battery banks was obtained for microgrid operation.
6. Conclusions
In this work, a multi-objective optimal scheduling model for hybrid microgrids with PV power generation, wind power generation, and ESS was proposed. The optimal solutions were determined using MOPSO for the multi-objective function, and the cost of the hybrid microgrid and the LPSP were minimized. By comparing four different cases, the proposed multi-objective scheduling model considering the lifetime of the battery was verified. Additionally, an accurate number of battery banks was determined. The effect of maximum SOC for the ESS was evaluated. The results demonstrate that the lower maximum SOC of the ESS increased the cost of the hybrid microgrid and the power supply reliability. Additionally, ESS improved the power supply reliability and promoted the penetration of renewable DG resources.
Author Contributions
Conceptualization, N.Z. and N.-C.Y.; Data curation, N.Z.; Formal analysis, N.Z.; Funding acquisition, N.-C.Y.; Investigation, N.Z.; Methodology, N.Z. and N.-C.Y.; Software, N.Z.; Supervision, N.-C.Y. and J.-H.L.; Validation, N.Z. and N.-C.Y.; Visualization, N.-C.Y.; Writing—original draft, N.Z.; Writing—review & editing, N.-C.Y. All authors have read and agreed to the published version of the manuscript.
Funding
This work was partially supported by the Ministry of Science and Technology (MOST) in Taiwan (MOST 109-3111-8-011-001) and Delta–NTUST Joint Research Center.
Acknowledgments
This work was partially supported by the Ministry of Science and Technology (MOST) in Taiwan. The authors would like to thank the funding provided by MOST (MOST 109-3111-8-011-001) and DELTA-NTUST Joint Research Center.
Conflicts of Interest
The authors declare no conflict of interest.
References
- Kapsali, M.; Kaldellis, J.K. Combining hydro and variable wind power generation by means of pumped-storage under economically viable terms. Appl. Energy 2010, 87, 3475–3485. [Google Scholar] [CrossRef]
- Wu, Z.; Tazvinga, H.; Xia, X. Demand side management of photovoltaic-battery hybrid system. Appl. Energy 2015, 148, 294–304. [Google Scholar] [CrossRef] [Green Version]
- Zong, W.G. Size optimization for a hybrid photovoltaic–wind energy system. Int. J. Electr. Power Energy Syst. 2012, 42, 448–451. [Google Scholar]
- Ogunjuyigbe, A.S.O.; Ayodele, T.R.; Akinola, O.A. Optimal allocation and sizing of PV/Wind/Split-diesel/Battery hybrid energy system for minimizing life cycle cost, carbon emission and dump energy of remote residential building. Appl. Energy 2016, 171, 153–171. [Google Scholar] [CrossRef]
- Ju, L.; Tan, Z.; Yuan, J.; Tan, Q.; Li, H.; Dong, F. A bi-level stochastic scheduling optimization model for a virtual power plant connected to a wind–photovoltaic–energy storage system considering the uncertainty and demand response. Appl. Energy 2016, 171, 184–199. [Google Scholar] [CrossRef] [Green Version]
- Liu, C.; Wang, X.; Wu, X.; Guo, J. Economic scheduling model of microgrid considering the lifetime of batteries. Iet Gener. Transm. Distrib. 2017, 11, 759–767. [Google Scholar] [CrossRef]
- Lee, T.Y.; Chen, C.L. Wind-photovoltaic capacity coordination for a time-of-use rate industrial user. Iet Renew. Power Gener. 2009, 3, 150–152. [Google Scholar] [CrossRef]
- Hong, Y.Y.; Lian, R.C. Optimal Sizing of Hybrid Wind/PV/Diesel Generation in a Stand-Alone Power System Using Markov-Based Genetic Algorithm. IEEE Trans. Power Deliv. 2012, 27, 640–647. [Google Scholar] [CrossRef]
- Belfkira, R.; Lu, Z.; Barakat, G. Optimal sizing study of hybrid wind/PV/diesel power generation unit. Sol. Energy 2011, 85, 100–110. [Google Scholar] [CrossRef]
- Bass, R.; Carr, J.; Aguilar, J.; Whitener, K. Determining the Power and Energy Capacities of a Battery Energy Storage System to Accommodate High Photovoltaic Penetration on a Distribution Feeder. IEEE Power Energy Technol. Syst. J. 2016, 3, 119–127. [Google Scholar] [CrossRef] [Green Version]
- Mosadeghy, M.; Yan, R.; Saha, T.K. A Time-Dependent Approach to Evaluate Capacity Value of Wind and Solar PV Generation. IEEE Trans. Sustain. Energy 2015, 7, 129–138. [Google Scholar] [CrossRef]
- Yang, H.; Zhou, W.; Lou, C. Optimal design and techno-economic analysis of a hybrid solar-wind power generation system. Appl. Energy 2009, 86, 163–169. [Google Scholar] [CrossRef]
- Yang, D.; Jiang, C.; Cai, G.; Huang, N. Optimal sizing of a wind/solar/battery/diesel hybrid microgrid based on typical scenarios considering meteorological variability. IET Renew. Power Gener. 2019, 13, 1446–1455. [Google Scholar] [CrossRef]
- Kaabeche, A.; Belhamel, M.; Ibtiouen, R. Sizing optimization of grid-independent hybrid photovoltaic/wind power generation system. Energy 2011, 36, 1214–1222. [Google Scholar] [CrossRef]
- Sujil, A.; Agarwal, S.K.; Kumar, R. Centralized multi-agent implementation for securing critical loads in PV based microgrid. J. Mod. Power Syst. Clean Energy 2014, 2, 77–86. [Google Scholar] [CrossRef] [Green Version]
- Hemmati, R.; Saboori, H. Stochastic optimal battery storage sizing and scheduling in home energy management systems equipped with solar photovoltaic panels. Energy Build. 2017, 152, 290–300. [Google Scholar] [CrossRef]
- Kaur, R.; Krishnasamy, V.; Kandasamy, N.K. Optimal sizing of wind–PV-based DC microgrid for telecom power supply in remote areas. Iet Renew. Power Gener. 2018, 12, 859–866. [Google Scholar] [CrossRef]
- Maleki, A.; Pour Fa Yaz, F. Optimal sizing of autonomous hybrid photovoltaic/wind/battery power system with LPSP technology by using evolutionary algorithms. Sol. Energy 2015, 115, 471–483. [Google Scholar] [CrossRef]
- Behzadi Forough, A.; Roshandel, R. Multi objective receding horizon optimization for optimal scheduling of hybrid renewable energy system. Energy Build. 2017, 150, 583–597. [Google Scholar] [CrossRef]
- Atwa, E.S.; El-Saadany, E.F. Optimal Allocation of ESS in Distribution Systems With a High Penetration of Wind Energy. IEEE Trans. Power Syst. 2010, 25, 1815–1822. [Google Scholar] [CrossRef]
- Chen, C.; Duan, S.; Cai, T.; Liu, B.; Hu, G. Smart energy management system for optimal microgrid economic operation. Renew. Power Gener. Iet 2011, 5, 258–267. [Google Scholar] [CrossRef]
- Zhao, B.; Zhang, X.; Chen, J.; Wang, C.; Guo, L. Operation Optimization of Standalone Microgrids Considering Lifetime Characteristics of Battery Energy Storage System. IEEE Trans. Sustain. Energy 2013, 4, 934–943. [Google Scholar] [CrossRef]
- Dong, X.; Zhang, Y.; Jiang, T. Planning-operation Co-optimization Model of Active Distribution Network with Energy Storage Considering the Lifetime of Batteries. IEEE Access 2018, 6, 59822–59832. [Google Scholar] [CrossRef]
- Sobu, A.; Wu, G. Optimal operation planning method for isolated micro grid considering uncertainties of renewable power generations and load demand. In Proceedings of the Innovative Smart Grid Technologies-Asia, Tianjin, China, 21–24 May 2012. [Google Scholar]
- Lokeshgupta, B.; Sivasubramani, S. Multi-objective dynamic economic and emission dispatch with demand side management. Int. J. Electr. Power Energy Syst. 2018, 97, 334–343. [Google Scholar] [CrossRef]
- Jenkins, D.P.; Fletcher, J.; Kane, D. Lifetime prediction and sizing of lead-acid batteries for microgeneration storage applications. IET Renew. Power Gener. 2007, 2, 191–200. [Google Scholar] [CrossRef]
- Akram, U.; Khalid, M.; Shafiq, S. Optimal sizing of a wind/solar/battery hybrid grid-connected microgrid system. IET Renew. Power Gener. 2017, 12, 72–80. [Google Scholar] [CrossRef]
Figure 1.
Relationship between the state of charge and weighting coefficient.

Figure 2.
Flowchart of the multi-objective scheduling model.

Figure 3.
Daily output power of wind turbines.

Figure 4.
Daily output power of a PV panel.

Figure 5.
Daily load demand.

Figure 6.
Relationship between power supply reliability and annualized cost.

Figure 7.
SOC curve of the ESS in Case 1, Case 2.

Figure 8.
SOC curve of battery banks in Case 1, Case 3.


Table 1.
Parameters of the battery bank.
| Item | Value |
|---|---|
| Rated capacity (kWh) | 0.6 |
| Rated power (kW) | 0.15 |
| Charge efficiency | 1 |
| Discharge efficiency | 1 |
| Lower limit SOC | 0.1 |
| Upper limit SOC | 0.9 |
| Initial SOC value | 0.5 |
| kmainten (USD/N) | 10 |
| CE (USD/kWh/y) | 13,500 |
| CP (USD/kW/y) | 10 |
| NC | 390 |
| Lifetime (year) | 5 |
| Maximum discharging power/kW | 0.15 |
| Maximum charging power/kW | 0.15 |
| Annual interest rate % | 6.7 |
Table 2.
Parameters of wind and PV generator.
| PV Generator | Wind Generator | |
|---|---|---|
| Operation and maintenance cost coefficient USD/kW/year | 16 | 33 |
| Investment cost coefficient USD/kW | 2025 | 2346 |
| Lifetime (year) | 20 | 20 |
| Rated power (kW) | 0.2 | 60 |
| Annual interest rate % | 6.7 | 6.7 |
Table 3.
Simulation results of four cases for the hybrid microgrid.
| NPV | Nbattery | Charge and Discharge Power of ESS (kW) | Cess.DP (USD) | Cess.mainten (USD) | Cess (USD) | CPV (USD) | Cwind (USD) | Total Annualized Cost (USD) | LPSP (%) | |
|---|---|---|---|---|---|---|---|---|---|---|
| Case 1 | 282 | 79 | 30.900 | 3691 | 474 | 4165 | 11,433 | 14,959 | 30,557 | 1.28 |
| Case 2 | 284 | 93 | 32.197 | 3849 | 558 | 4406 | 11,514 | 14,959 | 30,879 | 1.12 |
| Case 3 | 318 | 82 | 24.485 | 3069 | 492 | 3561 | 12,892 | 14,959 | 31,412 | 0.97 |
| Case 4 | 361 | — | — | — | — | 14,636 | 14,959 | 29,594 | 2.40 |
Publisher’s Note: MDPI stays neutral with regard to jurisdictional claims in published maps and institutional affiliations. |
© 2021 by the authors. Licensee MDPI, Basel, Switzerland. This article is an open access article distributed under the terms and conditions of the Creative Commons Attribution (CC BY) license (https://creativecommons.org/licenses/by/4.0/).
Share and Cite
MDPI and ACS Style
Zhang, N.; Yang, N.-C.; Liu, J.-H. Optimal Sizing of PV/Wind/Battery Hybrid Microgrids Considering Lifetime of Battery Banks. Energies 2021, 14, 6655. https://0-doi-org.brum.beds.ac.uk/10.3390/en14206655
AMA Style
Zhang N, Yang N-C, Liu J-H. Optimal Sizing of PV/Wind/Battery Hybrid Microgrids Considering Lifetime of Battery Banks. Energies. 2021; 14(20):6655. https://0-doi-org.brum.beds.ac.uk/10.3390/en14206655
Chicago/Turabian StyleZhang, Ning, Nien-Che Yang, and Jian-Hong Liu. 2021. "Optimal Sizing of PV/Wind/Battery Hybrid Microgrids Considering Lifetime of Battery Banks" Energies 14, no. 20: 6655. https://0-doi-org.brum.beds.ac.uk/10.3390/en14206655
Note that from the first issue of 2016, this journal uses article numbers instead of page numbers. See further details here.