
Risk-Adjusted Discount Rate and Its Components for Onshore Wind Farms at the Feasibility Stage


 , and
, and
Abstract
:1. Introduction
- Industry expectations with respect to the project returns;
- The risk factors associated with energy projects in general, and
- The risk factors associated with the specificity of the project.
2. Methods
- (1)
- own the asset and
- (2)
- take on the risk of ownership
- (1)
- (2)
- discussion with some renewable energy analysts,
- analysis of the investment at the feasibility stage;
- 100% equity cash flows;
- zero inflation,
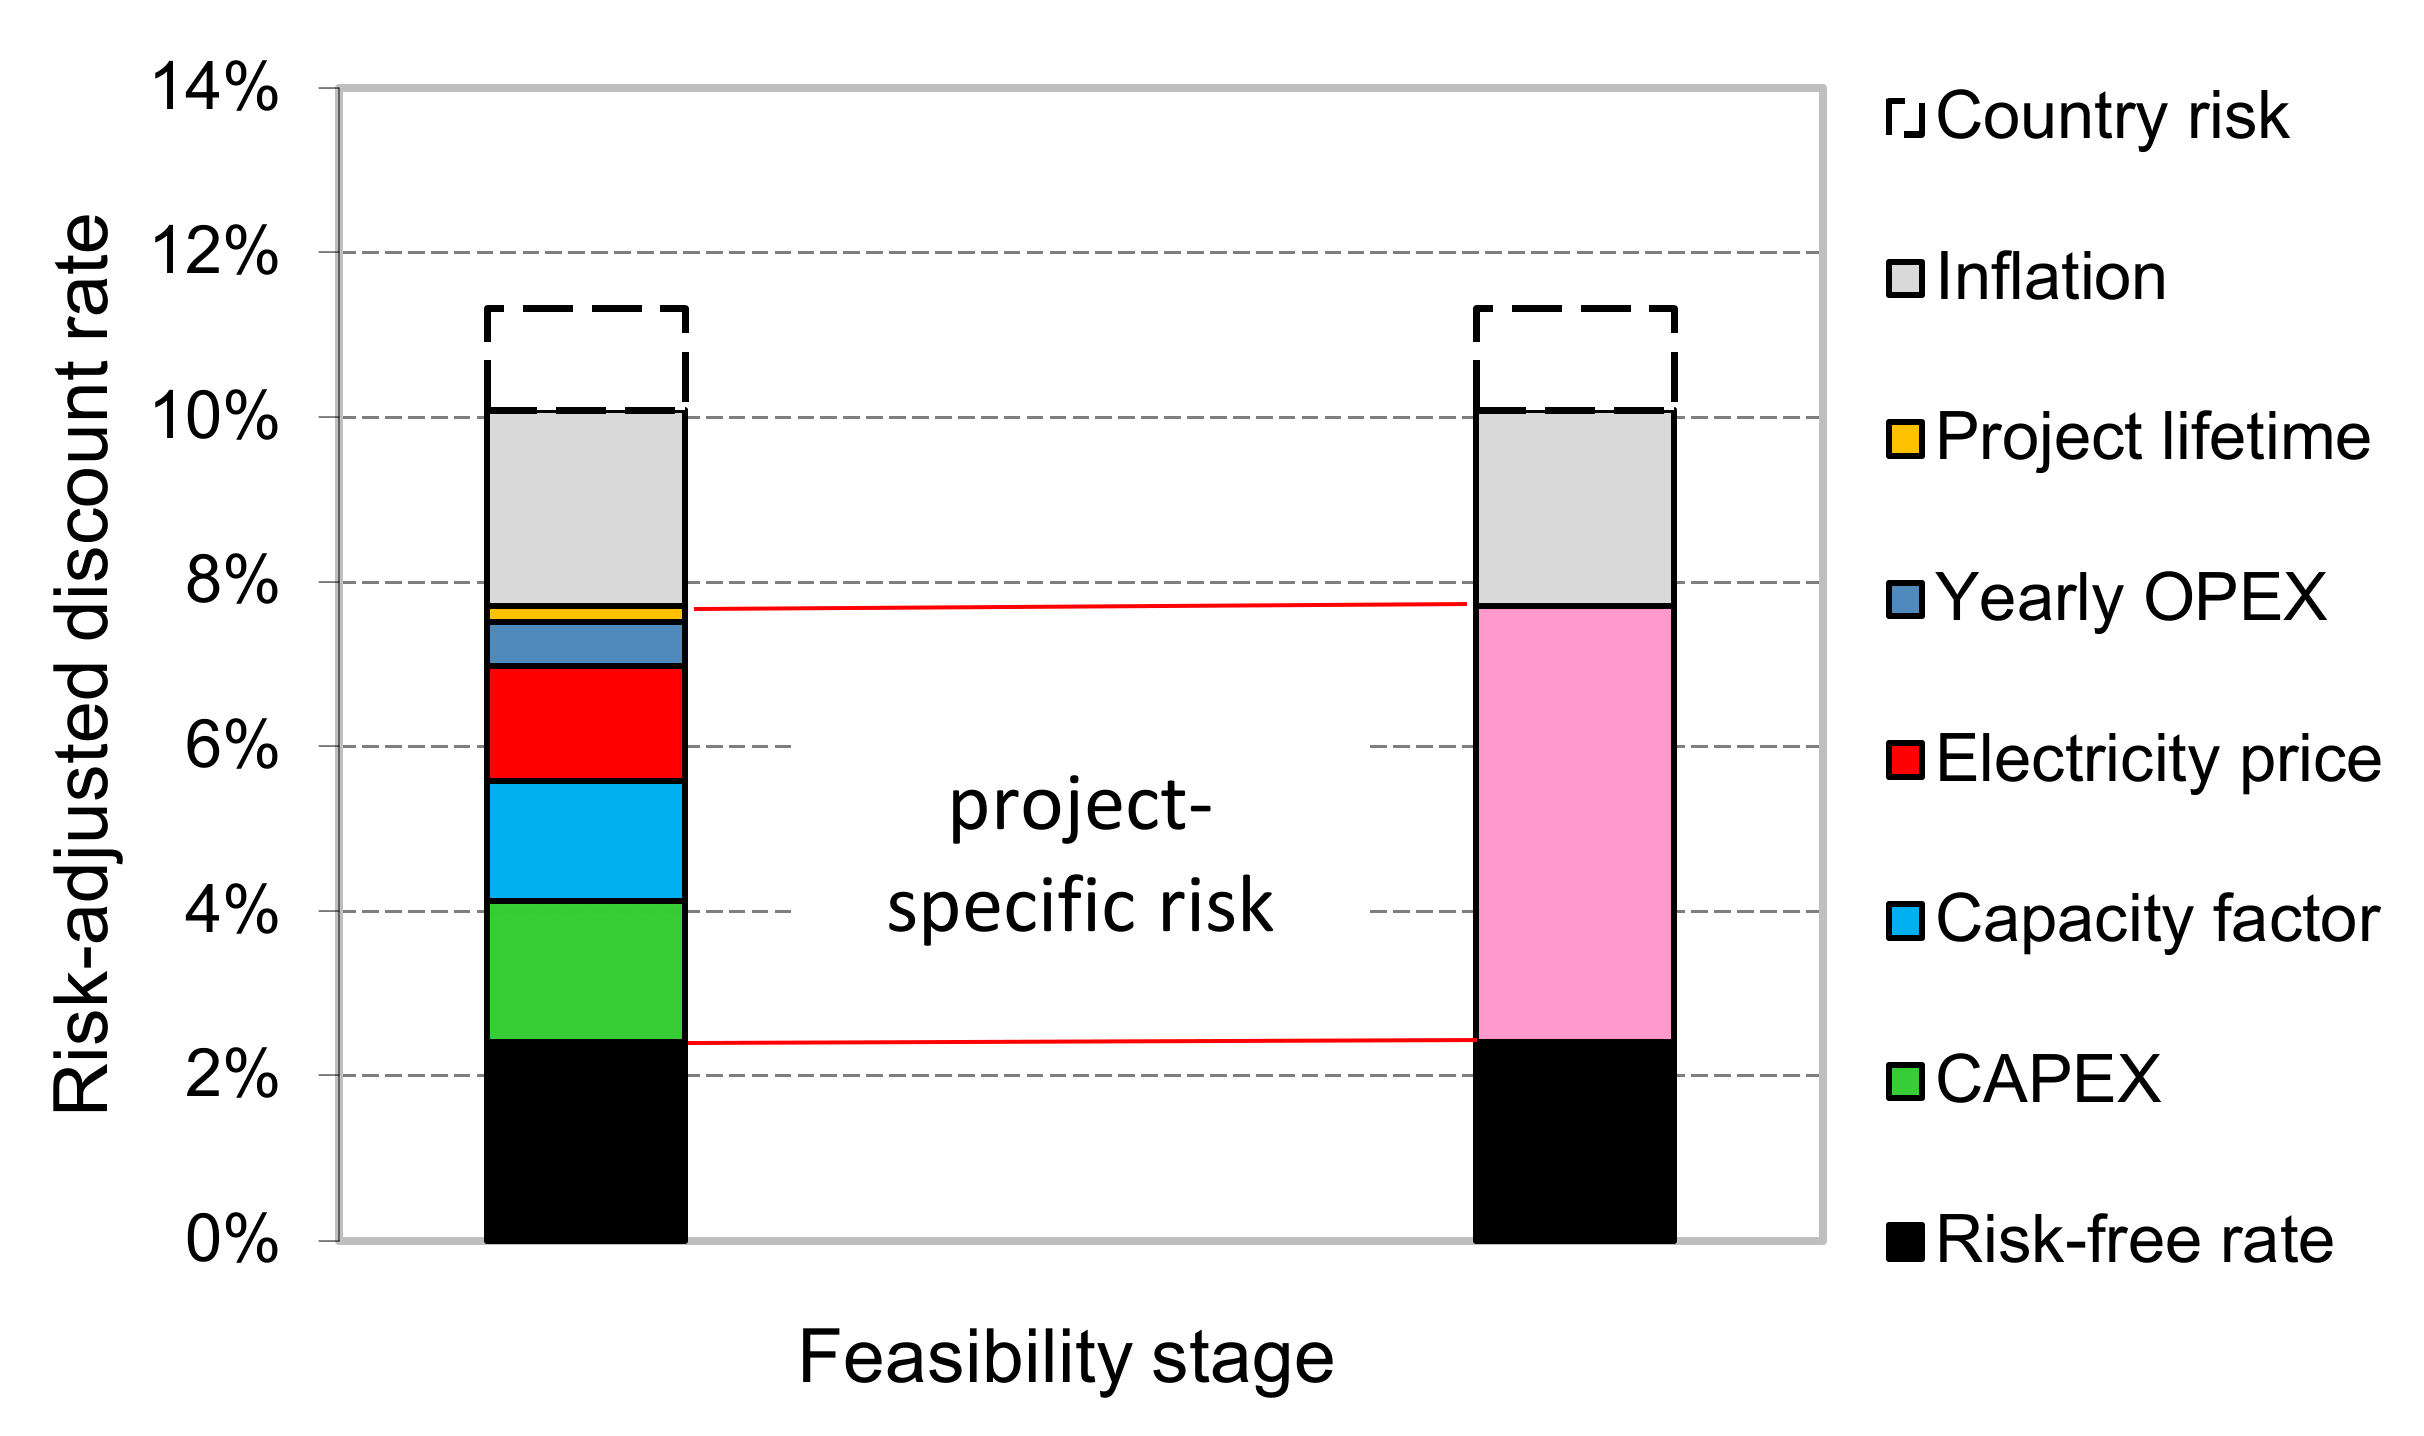
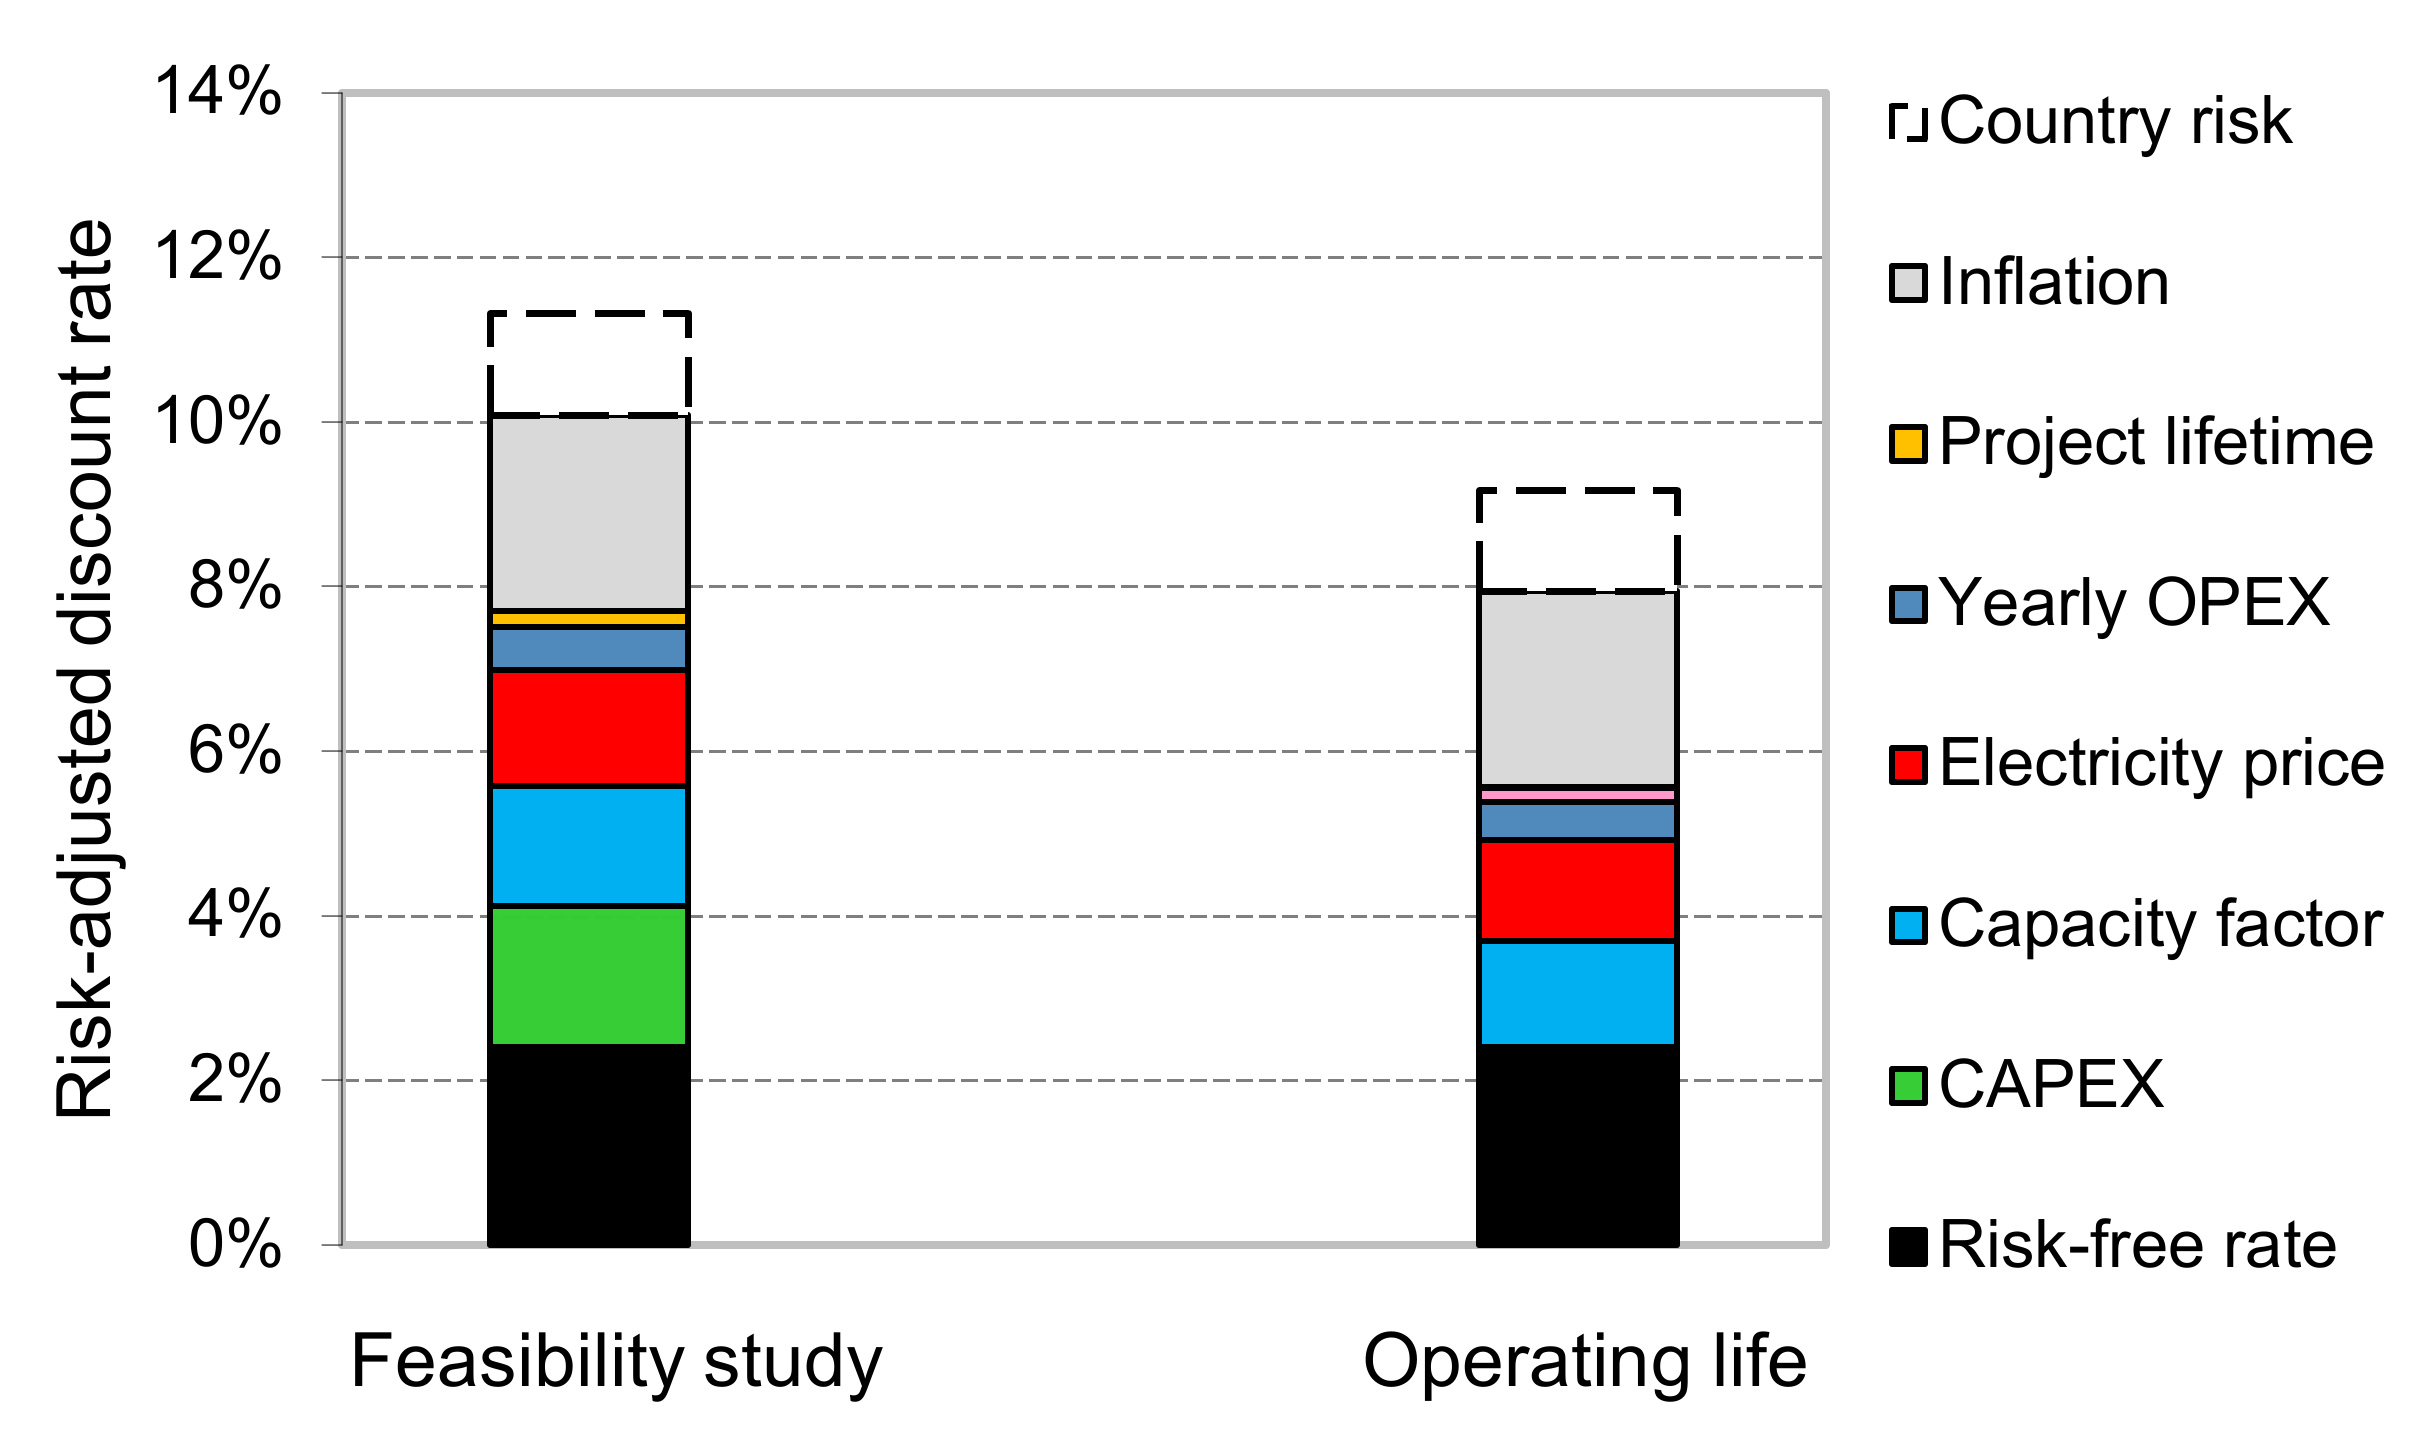
- risk-free rate;
- specific risk;
- country risk;
- installed capacity of the wind farm: 90 MW (45 wind turbines);
- investment period: 3 years;
- operating period: 22 years;
- decommissioning: in the last (25th) year of the project life;
- capital expenditures, CAPEX: 5.5 M PLN/MW [33,34]; distribution of CAPEX [17,24,35,36,37] as follow:
- year 1–2% CAPEX;
- year 2–18% CAPEX;
- year 3–80% CAPEX;
(CAPEX, after deducting the salvage (residual) value, were subjected to straight-line depreciation/amortization); - working capital: 6.03 M PLN (8.33% of annual revenues) [36]; spending—year ‘0’, recovery—year 25;
- decommissioning cost: 0.6 M PLN per turbine [39];
- capacity factor, CF: 0.36 [16,41,42]; the factor was selected in relation to the advancement in wind technology with an assumption that in reference to the reduction of power generated by the wind plant along with time and technical wear and tear [5], it is going to decrease from the 15th to 19th year of the project lifetime by 0.1 annually (and from the 19th to the 25th year by 0.2 annually—to the final value of 0.23).
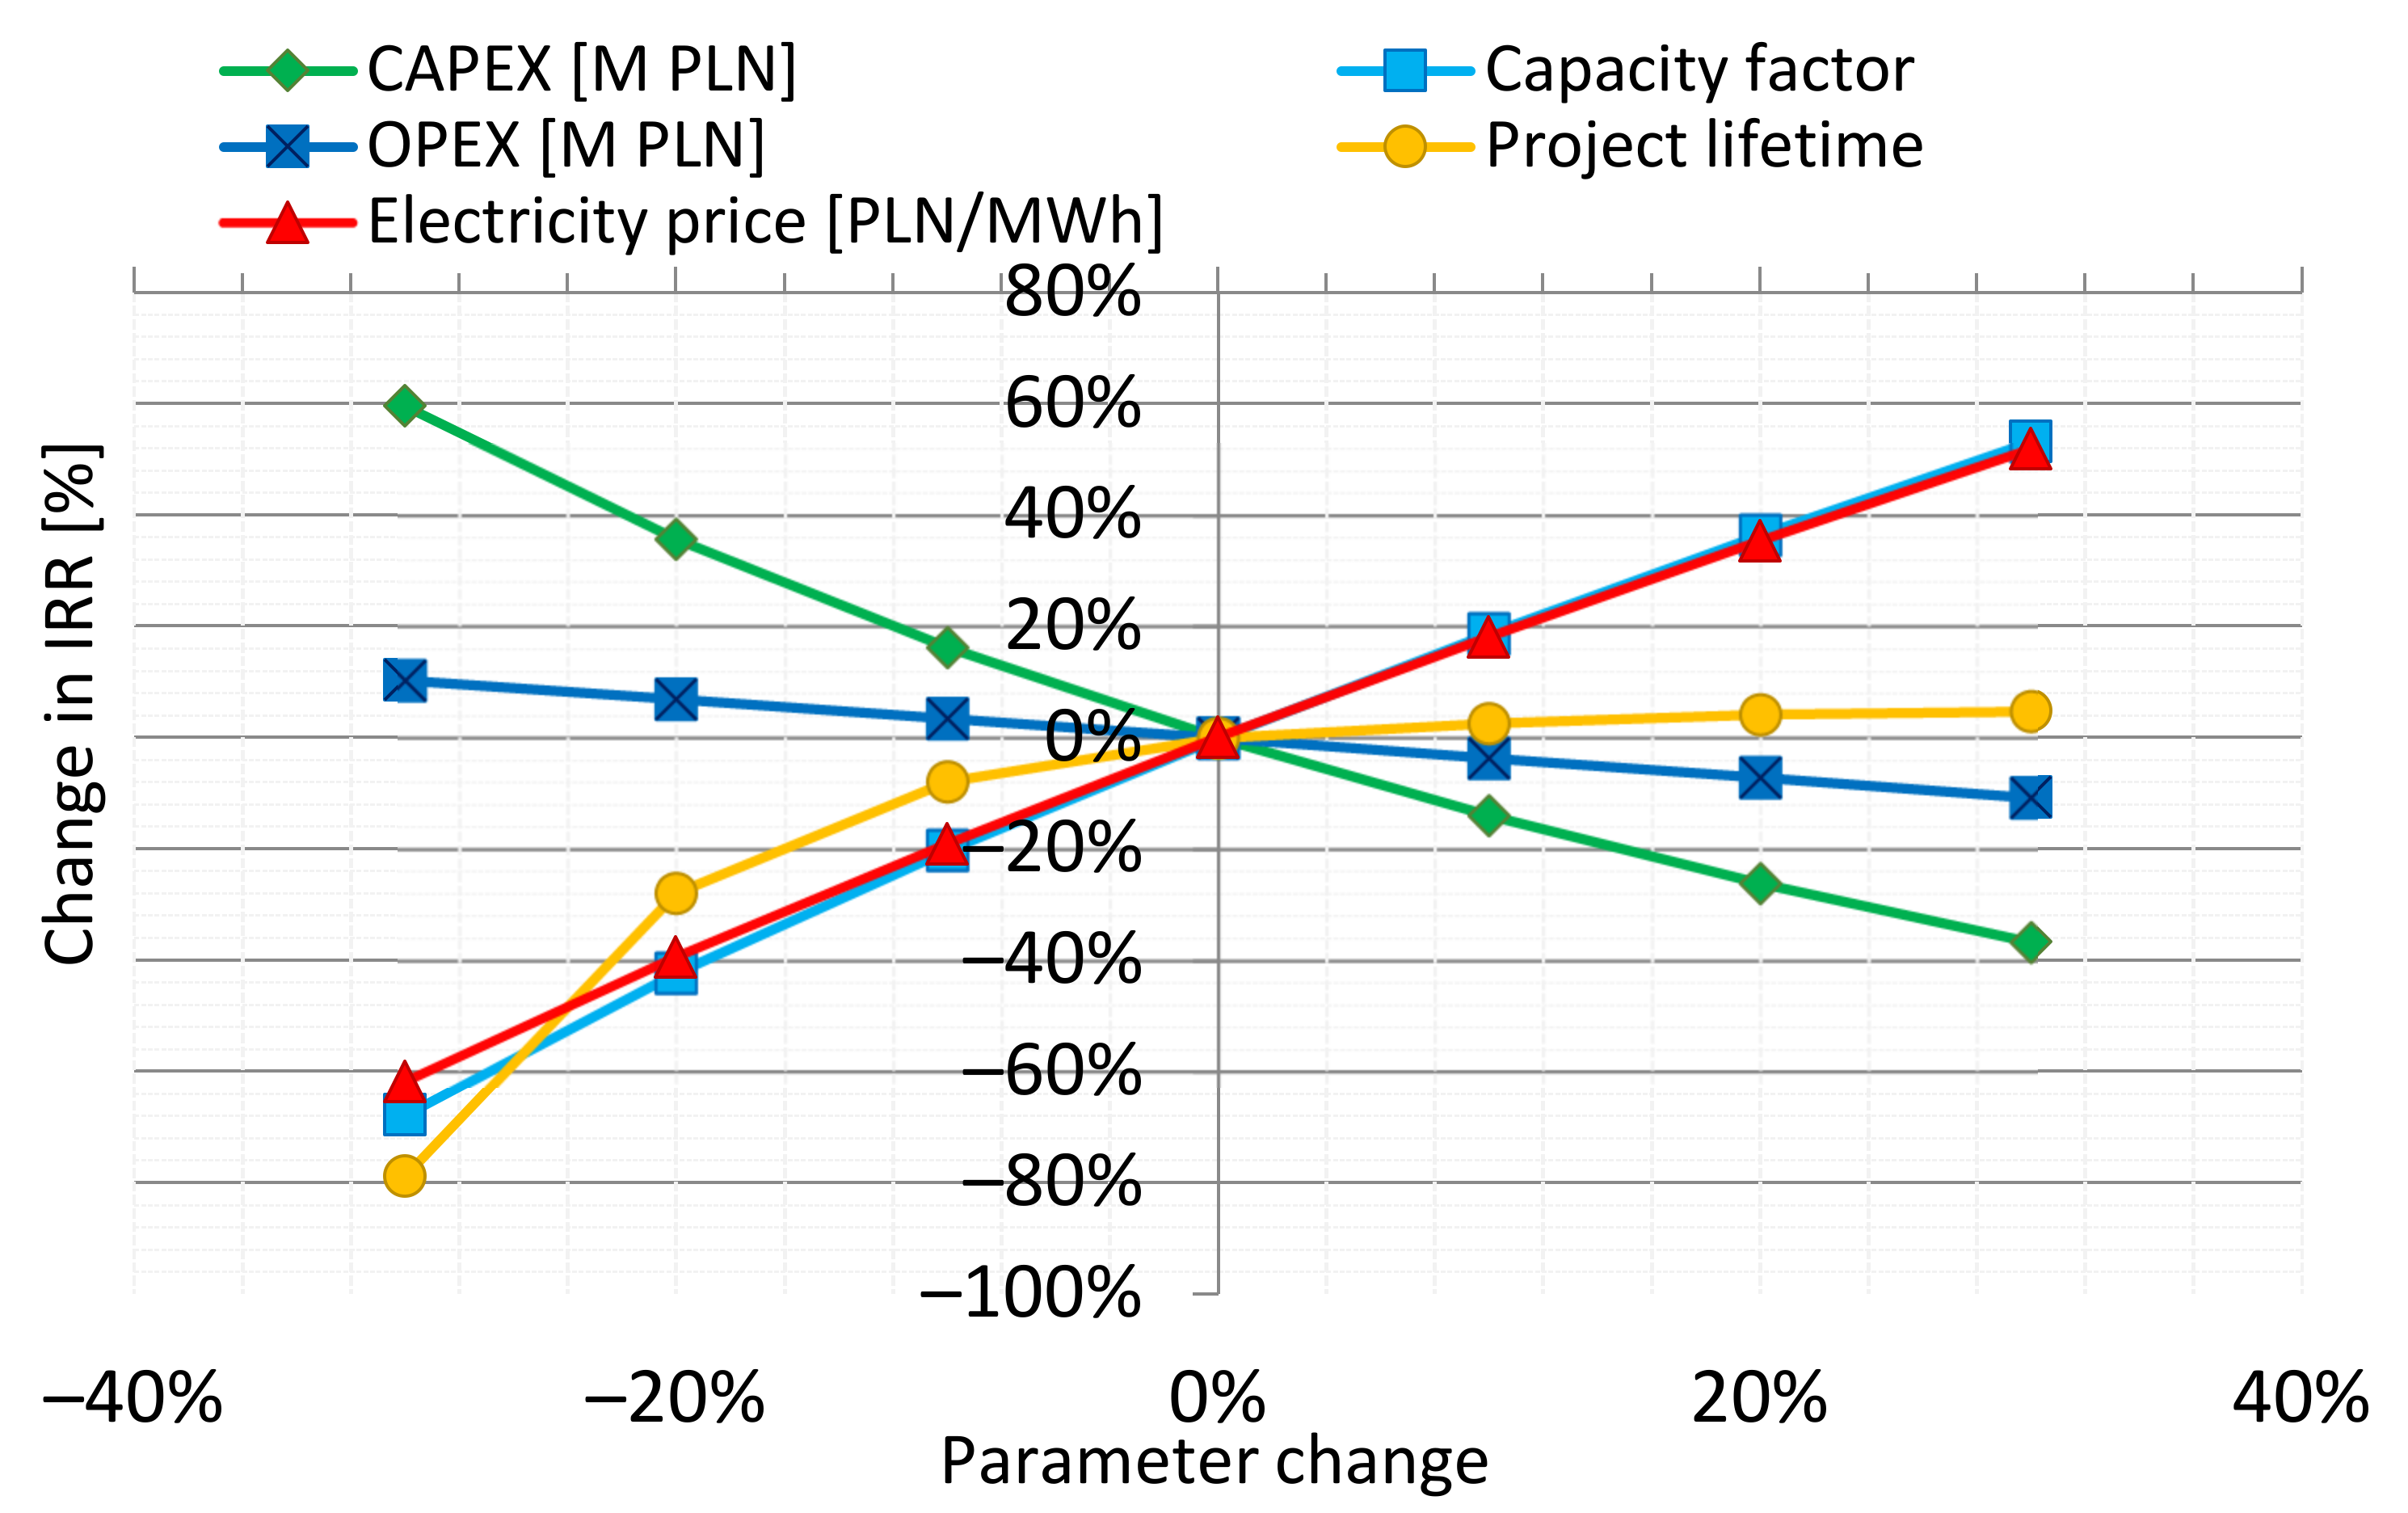
- CAPEX;
- capacity factor (CF);
- electricity price;
- annual operating expenditures (OPEX);
- project lifetime.
- CAPEX—±15%,
- CF—±10%,
- electricity price—±10%,
- OPEX—±10%,
- project lifetime—±5%.
3. Results
- capacity factor, CF, (1.46%);
- electricity price (1.40%).
4. Discussion
- capacity factor—1.28%;
- price of electricity—1.23%,
- operating expenses—0.46%;
- lifetime—0.17%;
5. Conclusions
- capital expenditures: 1.71%;
- capacity factor: 1.46%;
- electricity price: 1.40%;
- operating costs: 0.53%;
- project lifetime: 0.20%.
- (1)
- results are rather indicative; UnCrnty and CnSqnce values should be determined for particular project individually;
- (2)
- slopes of the sensitivity lines were averaged;
- (3)
- variable assessment accuracies may be different for particular projects;
- (4)
- identifying only a limited number of risk factors influencing a wind project;
Author Contributions
Funding
Acknowledgments
Conflicts of Interest
References
- Wójcik-Jurkiewicz, M.; Czarnecka, M.; Kinelski, G.; Sadowska, B.; Bilińska-Reformat, K. Determinants of Decarbonisation in the Transformation of the Energy Sector: The Case of Poland. Energies 2021, 14, 1217. [Google Scholar] [CrossRef]
- PSE: Polish Power Network (Polskie Sieci Elektroenergetyczne). National Power System (KSE) Annual Report 2020. Available online: https://www.pse.pl/dane-systemowe/funkcjonowanie-kse/raporty-roczne-z-funkcjonowania-kse-za-rok/raporty-za-rok-2020 (accessed on 8 April 2021).
- D’Angelo, M. Onshore Wind Energy Market Analysis of Sweden, Poland, and Romania. Master’s Thesis, KTH School of Industrial Engineering and Management, Stockholm, Sweden, 2020. TRITA-ITM-EX 2020:469. Available online: http://kth.diva-portal.org/smash/get/diva2:1472686/FULLTEXT01.pdf (accessed on 7 April 2021).
- GUS—Statistics Poland. Energy from Renewable Sources in 2019. Available online: https://stat.gov.pl/files/gfx/portalinformacyjny/pl/defaultaktualnosci/5485/3/14/1/energia_ze_zrodel_odnawialnych_w_2019_r.pdf (accessed on 8 April 2020).
- Kotowicz, J.; Kwiatek, B. Analysis of Wind Farm Production Potential. Rynek Energii Energy Mark. J. 2019, 4, 38–47. (In Polish). Available online: https://www.cire.pl/pliki/2/2019/analiza_potencjalu_wytworczego_farmy_wiatrowej.pdf (accessed on 7 April 2021).
- Drożdż, W.; Kinelski, G.; Czarnecka, M.; Wójcik-Jurkiewicz, M.; Maroušková, A.; Zych, G. Determinants of Decarbonization—How to Realize Sustainable and Low Carbon Cities? Energies 2021, 14, 2640. [Google Scholar] [CrossRef]
- Sejm Rzeczypospolitej Polskiej [Polish Parliament]. Deputies’ Bill on Amendments to the Act on Investments in Wind Plants. Available online: https://www.sejm.gov.pl/sejm9.nsf/PrzebiegProc.xsp?id=AF1614D32FD8858FC12584E90044AE8C (accessed on 27 April 2021). (In Polish)
- DECC—Department of Energy & Climate Change. Electricity Generation Costs 2013. 2013. Available online: https://assets.publishing.service.gov.uk/government/uploads/system/uploads/attachment_data/file/223940/DECC_Electricity_Generation_Costs_for_publication_-_24_07_13.pdf (accessed on 7 April 2021).
- Kinelski, G. The main factors of successful project management in the aspect of energy enterprises’ efficiency in the digital economy environment. Polityka Energetyczna Energy Policy J. 2020, 23, 5–20. [Google Scholar] [CrossRef]
- KPMG. Cost of Capital Study 2019. The Calm before the Storm—Rising Profits and Deflated Values? KPMG International Cooperative 2019. Available online: https://assets.kpmg/content/dam/kpmg/ch/pdf/cost-of-capital-study-2019.pdf (accessed on 16 April 2021).
- Oxera. Discount Rates for Low-Carbon and Renewable Generation Technologies—Prepared for the Committee on Climate Change. April 2011. Available online: https://www.oxera.com/wp-content/uploads/2018/03/Oxera-report-on-low-carbon-discount-rates.pdf (accessed on 7 April 2021).
- Hern, R.; Radov, D.; Carmel, A.; Spasovska, M.; Guo, J. Electricity Generation Costs and Hurdle Rates. Lot 1: Hurdle Rates Update for Generation Technologies, Report Prepared for the Department of Energy and Climate Change (DECC), NERA Economic Consulting. 2015. Available online: https://www.nera.com/content/dam/nera/publications/2016/NERA_Hurdle_Rates_for_Electricity_Generation_Technologies.pdf (accessed on 7 April 2021).
- Zamasz, K. Discount Rates for the Evaluation of Energy Projects—Rules and Problems. Scientific Journal of Silesian University of Technology. Organ. Manag. Ser. 2017, 101, 571–584. [Google Scholar]
- Mucha-Kuś, K.; Sołtysik, M.; Zamasz, K.; Szczepańska-Woszczyna, K. Coopetitive Nature of Energy Communities—The Energy Transition Context. Energies 2021, 14, 931. [Google Scholar] [CrossRef]
- Smirnova, E.; Szczepańska-Woszczyna, K.; Yessetova, S.; Samusenkov, V. Supplying Energy to Vulnerable Segments of the Population: Macro-Financial Risks and Public Welfare. Energies 2021, 14, 1834. [Google Scholar] [CrossRef]
- Hirth, L.; Steckel, J.C. The Role of Capital Costs in Decarbonizing the Electricity Sector. Environ. Res. Lett. 2016, 11, 114010. Available online: https://0-iopscience-iop-org.brum.beds.ac.uk/article/10.1088/1748-9326/11/11/114010 (accessed on 8 October 2021). [CrossRef]
- Shrimali, G.; Nelson, D.; Goel, S.; Konda, C.; Kumar, R. Renewable Deployment in India: Financing Costs and Implications for Policy. Energy Policy 2013, 62, 28–43. [Google Scholar] [CrossRef]
- Tagliapietra, S.; Zachmann, G.; Fredriksson, G. Estimating the Cost of Capital for Wind Energy Investments in Turkey. Energy Policy 2019, 131, 295–301. [Google Scholar] [CrossRef] [Green Version]
- Steffen, B. Estimating the Cost of Capital for Renewable Energy Projects. Energy Econ. 2020, 88, 104783. [Google Scholar] [CrossRef]
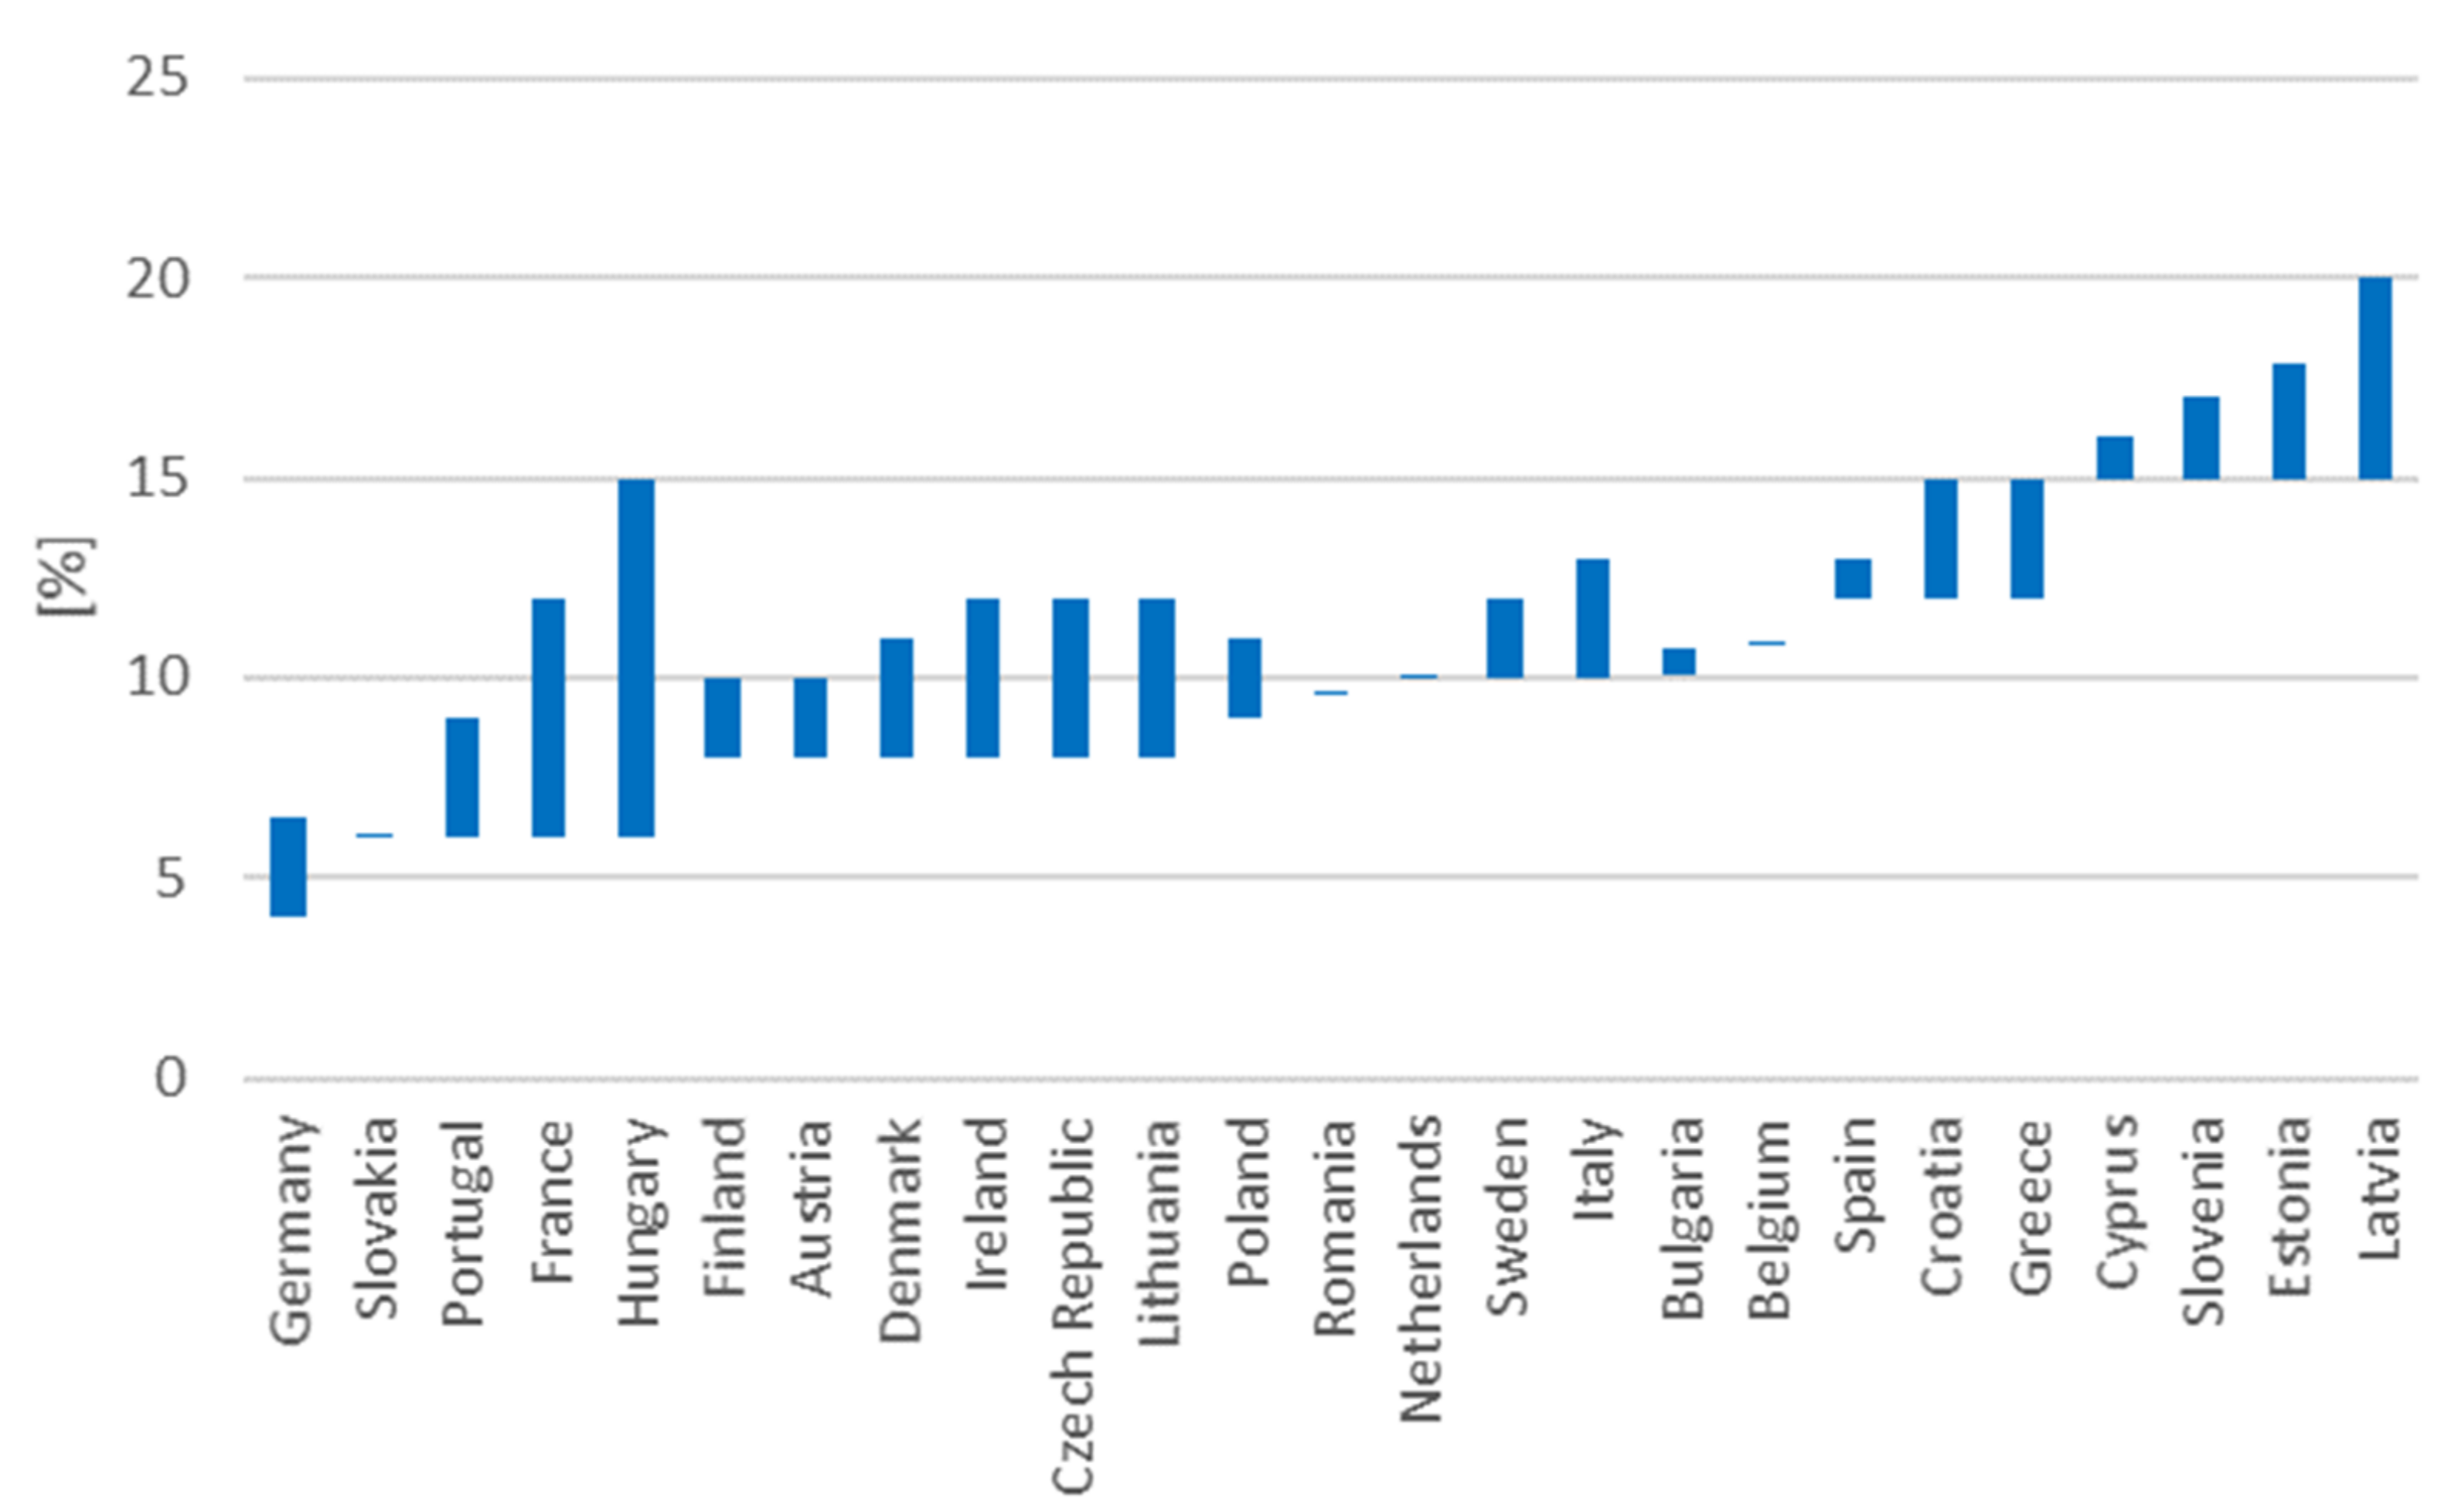
- Angelopoulos, D.; Brückmann, R.; Jirouš, F.; Konstantinavičiūtė, I.; Noothout, P.; Psarras, J.; Tesnière, L.; Breitschopf, B. Risks and Cost of Capital for Onshore Wind Energy Investments in EU Countries. Energy Environ. 2016, 27, 82–104. [Google Scholar] [CrossRef] [Green Version]
- Saługa, P.W.; Kamiński, J. The Cost of Equity in the Energy Sector. Polityka Energetyczna Energy Policy J. 2018, 21, 81–96. [Google Scholar] [CrossRef]
- Smith, L.D. Discount Rates and Risk Assessment in Mineral Project Evaluations. Can. Inst. Min. Metall. Bull. 1995, 88, 34–43. [Google Scholar]
- Estache, A.; Steichen, A.S. Is Belgium Overshooting in Its Policy Support to Cut the Cost of Capital of Renewable Sources of Energy? De Boeck Supérieur. Reflets et Perspectives de la vie Économique 2015/1; Tome LIV. pp. 33–45. Available online: https://www.cairn.info/revue-reflets-et-perspectives-de-la-vieeconomique-2015-1-page-33.htm (accessed on 5 October 2021).
- Partridge, I. Cost Comparisons for Wind and Thermal Power Generation. Energy Policy 2018, 112, 272–279. [Google Scholar] [CrossRef]
- Egli, F. Renewable Energy Investment Risk: An Investigation of Changes over Time and the Underlying Drivers. Energy Policy 2020, 140, 111428. [Google Scholar] [CrossRef]
- Brückmann, R. Cost of Capital for Onshore Wind in EU Member States—Some Good, Some Bad and Some Ugly News. Conference Presentation at Wind Europe Bilbao, 3 April 2019. Available online: https://ec.europa.eu (accessed on 11 April 2021).
- Dukan, M.; Kitzing, L.; Bruckmann, R.; Jimeno, M.; Wigand, F.; Kielichowska, I.; Klessmann, C.; Breitschopf, B. Effects of Auctions on Financing Conditions for Renewable Energy: A Mapping of Auction Designs and Their Effects on Financing; DTU Library 2019. Available online: Orbit.dtu.dk (accessed on 11 March 2021).
- Damodaran Online. Current and Archived Data. Discount Rate Estimation. Costs of Capital by Industry Sector (Europe). Website of Aswath Damodaran. 2021. Available online: http://pages.stern.nyu.edu/~adamodar/ (accessed on 15 April 2021).
- Grant Thornton. Renewable Energy Discount Rate Survey Results—2018. A Grant Thornton and Clean Energy Pipeline Initiative. 2019. Available online: https://www.grantthornton.co.uk/globalassets/1.-member-firms/united-kingdom/pdf/documents/renewable-energy-discount-rate-survey-results-2018.pdf (accessed on 15 April 2021).
- Bachner, G.; Mayer, J.; Steininger, K.W. Costs or Benefits? Assessing the Economy-Wide Effects of the Electricity Sector’s Low Carbon Transition—The Role of Capital Costs, Divergent Risk Perceptions and Premiums. Energy Strategy Rev. 2019, 26, 100373. [Google Scholar] [CrossRef]
- ARUP. Onshore Wind Financing. Cost of Capital Benefits of Revenue Stabilisation via a Contract for Difference. An Arup Report for Scottish Power Renewables. 2018. Available online: https://www.arup.com/perspectives/publications/research/section/onshore-wind-financing (accessed on 16 March 2021).
- Deloitte. Establishing the Investment Case—Wind Power. 2014. Available online: https://www2.deloitte.com/content/dam/Deloitte/global/Documents/Energy-and-Resources/gx-er-deloitte-establishing-the-wind-investment-case-2014.pdf (accessed on 16 March 2021).
- IRENA—International Renewable Energy Agency. Future of Wind—Deployment Investment, Technology, Grid Integration and Socio-Economic Aspects. A Global Energy Transformation Paper. 2019. Available online: https://www.irena.org/-/media/Files/IRENA/Agency/Publication/2019/Oct/IRENA_Future_of_wind_2019.pdf (accessed on 16 April 2021).
- Halleraker, E.E.; Skjefrås, B.H. Investment in Wind Power Development—A Comparative Study Between Norway, Denmark, and Sweden. Master’s Thesis, UiS Business School, Faculty of Social Sciences, University of Stavanger, Stavanger, Norway, 2017. Available online: https://uis.brage.unit.no/uis-xmlui/bitstream/handle/11250/2456664/Halleraker_and_Skjefraas.pdf?sequence=4&isAllowed=y (accessed on 16 April 2021).
- Łukaszewski, T.; Głoćko, W. An Assessment of Wind Farm Construction Efficiency Using the Real Option Method. Folia Oeconomica Stetin. 2016, 16, 84–102. [Google Scholar] [CrossRef] [Green Version]
- Addessi, C. Planning and Valuation of Green Investments in the Energy Supply: A Wind Investment Valuation. LUISS Guido Carli—Libera Universita’ Internationale Degli Studi Sociali, Department of Business and Management. 2014. Available online: https://tesi.luiss.it/11892/2/addessi-carlo-sintesi-2014.pdf (accessed on 20 April 2021).
- Steffen, B. The Importance of Project Finance for Renewable Energy Projects. Energy Econ. 2018, 69, 280–294. [Google Scholar] [CrossRef] [Green Version]
- Cloete, S. The Risks Related to Onshore Wind Power Investment. Energy Post. 2018. Available online: https://energypost.eu/the-risks-related-to-wind-power-investment/ (accessed on 16 April 2021).
- Energy Ventures Analysis. Canisteo Wind Energy Center—Decommissioning Assessment. Prepared for: The Towns of Cameron, Canisteo, Greenwood, Jasper, Troupsburg, and West Union. 2019. Available online: http://documents.dps.ny.gov/public/Common/ViewDoc.aspx?DocRefId=%7B92CC174A-9E28-4394-AEAA-CDDCC8358484%7D (accessed on 16 April 2021).
- Jensen, J.P. Evaluating the Environmental Impacts of Recycling Wind Turbines. Wind Energy 2019, 22, 316–326. [Google Scholar] [CrossRef]
- Krohn, S.; Morthorst, P.E.; Awerbuch, S. (Eds.) The Economics of Wind Energy—A report by the European Wind Energy Association. EWEA 2009. Available online: https://www.ewea.org/fileadmin/files/library/publications/reports/Economics_of_Wind_Energy.pd (accessed on 16 March 2021).
- Kroener, L. Economic Assessment of PV and Wind for Energy Planning. IRENA Global Atlas Spatial Planning Techniques—2-Day Seminar. 2014. Available online: https://www.irena.org/-/media/Files/IRENA/Agency/Events/2014/Jul/15/17_Economic_assessment_of_PV_and_wind_for_energy_planning_Lima_Peru-_EN.pdf?la=en&hash=D972733F4A10CE4AD3314060FFB97DFC8BA9DB9A (accessed on 22 April 2021).
- URE—Energy Regulatory Office of Poland. Odnawialne Źródła Energii—Ogłoszenia i Wyniki Aukcji. Available online: https://www.ure.gov.pl/pl/oze/aukcje-oze/ogloszenia-i-wyniki-auk (accessed on 21 April 2021).
- Saługa, P.W.; Szczepańska-Woszczyna, K.; Miśkiewicz, R.; Chłąd, M. Cost of Equity of Coal-Fired Power Generation Projects in Poland: Its Importance for the Management of Decision-Making Process. Energies 2020, 13, 4833. [Google Scholar] [CrossRef]
- Montealegre, F.; Boutsikoudi, S. Wind Resource Assessment and Yield Prediction—Post Construction Analysis—Hoevensche Beemden, Laakse Vaart, Zwartenbergseweg. 2014. Available online: https://www.eneco.nl/~/media/files/e3/eneco/pdf/voorwaarden-en-brochures/hollandsewind-certificaten/windrapportecofys.ashx?la=nl-nl (accessed on 22 April 2021).
- Wiser, R.; Rand, J.; Seel, J.; Beiter, P.; Baker, E.; Lantz, E.; Gilman, P. Expert Elicitation Survey Predicts 37% to 49% Declines in Wind Energy Costs by 2050. Nat. Energy 2021, 6, 555–565. [Google Scholar] [CrossRef]


| Risk Factor | UnCrnty (Assessment Accuracy) | CnSqnce (Slope) | Risk Product | Relative Risk | Risk Component |
|---|---|---|---|---|---|
| Risk-free rate (real) | 2.35% | ||||
| Capital expenditures, CAPEX (M PLNs) | 15% | 1.51 | 0.2269 | 0.323 | 1.71% |
| Capacity factor, CF | 10% | 1.94 | 0.1944 | 0.276 | 1.46% |
| Electricity price (PLN/MWh) | 10% | 1.86 | 0.1858 | 0.264 | 1.40% |
| Operating expenses, OPEX (M PLNs) | 20% | 0.35 | 0.0703 | 0.100 | 0.53% |
| Project lifetime | 5% | 0.52 | 0.0261 | 0.037 | 0.20% |
| Risk portion (SUM) | 0.7035 | 1.000 | 5.30% | ||
| Cost of equity—risk-adjusted discount rate (real) | 7.65% | ||||
Publisher’s Note: MDPI stays neutral with regard to jurisdictional claims in published maps and institutional affiliations. |
© 2021 by the authors. Licensee MDPI, Basel, Switzerland. This article is an open access article distributed under the terms and conditions of the Creative Commons Attribution (CC BY) license (https://creativecommons.org/licenses/by/4.0/).
Share and Cite
Saługa, P.W.; Zamasz, K.; Dacko-Pikiewicz, Z.; Szczepańska-Woszczyna, K.; Malec, M. Risk-Adjusted Discount Rate and Its Components for Onshore Wind Farms at the Feasibility Stage. Energies 2021, 14, 6840. https://0-doi-org.brum.beds.ac.uk/10.3390/en14206840
Saługa PW, Zamasz K, Dacko-Pikiewicz Z, Szczepańska-Woszczyna K, Malec M. Risk-Adjusted Discount Rate and Its Components for Onshore Wind Farms at the Feasibility Stage. Energies. 2021; 14(20):6840. https://0-doi-org.brum.beds.ac.uk/10.3390/en14206840
Chicago/Turabian StyleSaługa, Piotr W., Krzysztof Zamasz, Zdzisława Dacko-Pikiewicz, Katarzyna Szczepańska-Woszczyna, and Marcin Malec. 2021. "Risk-Adjusted Discount Rate and Its Components for Onshore Wind Farms at the Feasibility Stage" Energies 14, no. 20: 6840. https://0-doi-org.brum.beds.ac.uk/10.3390/en14206840