
Assessing the Techno-Economic Impact of Derating Factors on Optimally Tilted Grid-Tied Photovoltaic Systems

 ,
,  , and
, and 
Abstract
:1. Introduction

| Ref. | System Configuration | Grid Connection | Optimization and Sensitivity Analysis Considering PV Related Features | Optimization Criteria | Optimization Tool/Method | ||||||||
|---|---|---|---|---|---|---|---|---|---|---|---|---|---|
| Different Climate/Solar Radiation | Tracking | Tilt Angle | Azimuth | MPPT | Temperature | Derating Factor | Ground Reflectance | Lifetime | |||||
| This Study | PV | ✔ | - | ✔ | - | - | - | ✔ | ✔ | ✔ | ✔ | T/E | HOMER |
| Ref. [34] | Wind-PV -Battery | - | - | - | ✔ | - | - | ✔ | - | - | - | T/E | HOMER |
| Ref. [5] | PV-Diesel | - | ✔ | - | ✔ | ✔ | - | ✔ | - | - | - | T/E | HOMER |
| Ref. [15] | PV-PSH | - | - | ✔ | - | - | - | - | - | - | - | T/E | NSGAII |
| Ref. [18] | PV-Wind | - | - | ✔ | ✔ | - | - | - | - | - | - | T/E | HOMER |
| Ref. [14] | PV | ✔ | - | ✔ | - | - | - | - | - | - | - | T/E | HOMER |
| Ref. [35] | PV-Battery | - | - | ✔ | ✔ | - | - | - | - | - | - | T/E/V | HOMER |
| Ref. [36] | PV-Diesel | - | ✔ | - | - | - | - | - | - | - | - | T/E/V | HOMER |
| Ref. [37] | PV-Wind | ✔ | - | - | ✔ | - | - | - | - | - | - | T | GA |
| Ref. [6] | PV | - | - | - | ✔ | - | - | - | ✔ | - | - | T | MATLAB |
| Ref. [38] | PV | ✔ | - | - | - | - | - | - | - | - | - | T/E | DER-CAM |
| Ref. [39] | PV-Diesel -Storage | ✔ | - | - | - | - | - | - | - | - | - | T/E | DER-CAM |
| Ref. [7] | PV | - | - | - | - | - | - | ✔ | ✔ | - | - | T | Experimental |
| Ref. [40] | PV-Battery -Hydrogen | ✔ | - | - | - | - | - | - | - | - | ✔ | T/E | ODYSSEY |
| Ref. [8] | PV | - | - | - | - | - | - | ✔ | - | - | T | Experimental | |
| Ref. [41] | PV-Wind -Diesel-battery | - | ✔ | - | - | - | - | - | - | - | - | E | HOMER |
| Ref. [42] | PV-Wind -Battery | - | ✔ | - | - | - | - | - | - | - | - | E | HOMER |
| Ref. [43] | PV | ✔ | - | - | - | - | - | - | - | - | - | T/E/V | PSO |
| Ref. [44] | PV | - | - | - | - | - | ✔ | - | - | - | - | T | PSO |
| Ref. [45] | PV-Wind | - | - | - | - | - | - | - | - | - | - | T/E | NSGA-II |
| Ref. [46] | PV | ✔ | - | - | ✔ | - | - | - | - | - | - | T/E | GA |
- Several works were performed to analyze the influence of PV loss parameters on the technical and financial performance of PV systems, but those were done separately and specifically for a single loss parameter. Again, this has not been extensively analyzed in the literature, especially for the region in Bangladesh, save this study. A comprehensive table is presented comparing the PV characteristics covered in this study with 20 other existing literature works.
- Furthermore, the study intends to help other countries that share the same climatic conditions to design and apply their PV projects both off-grid and grid-tied by reflecting the PV derating factor. Again, the findings from the paper may help the power system planning of various islands where ample solar energy is available and is to be extracted via PV modules.
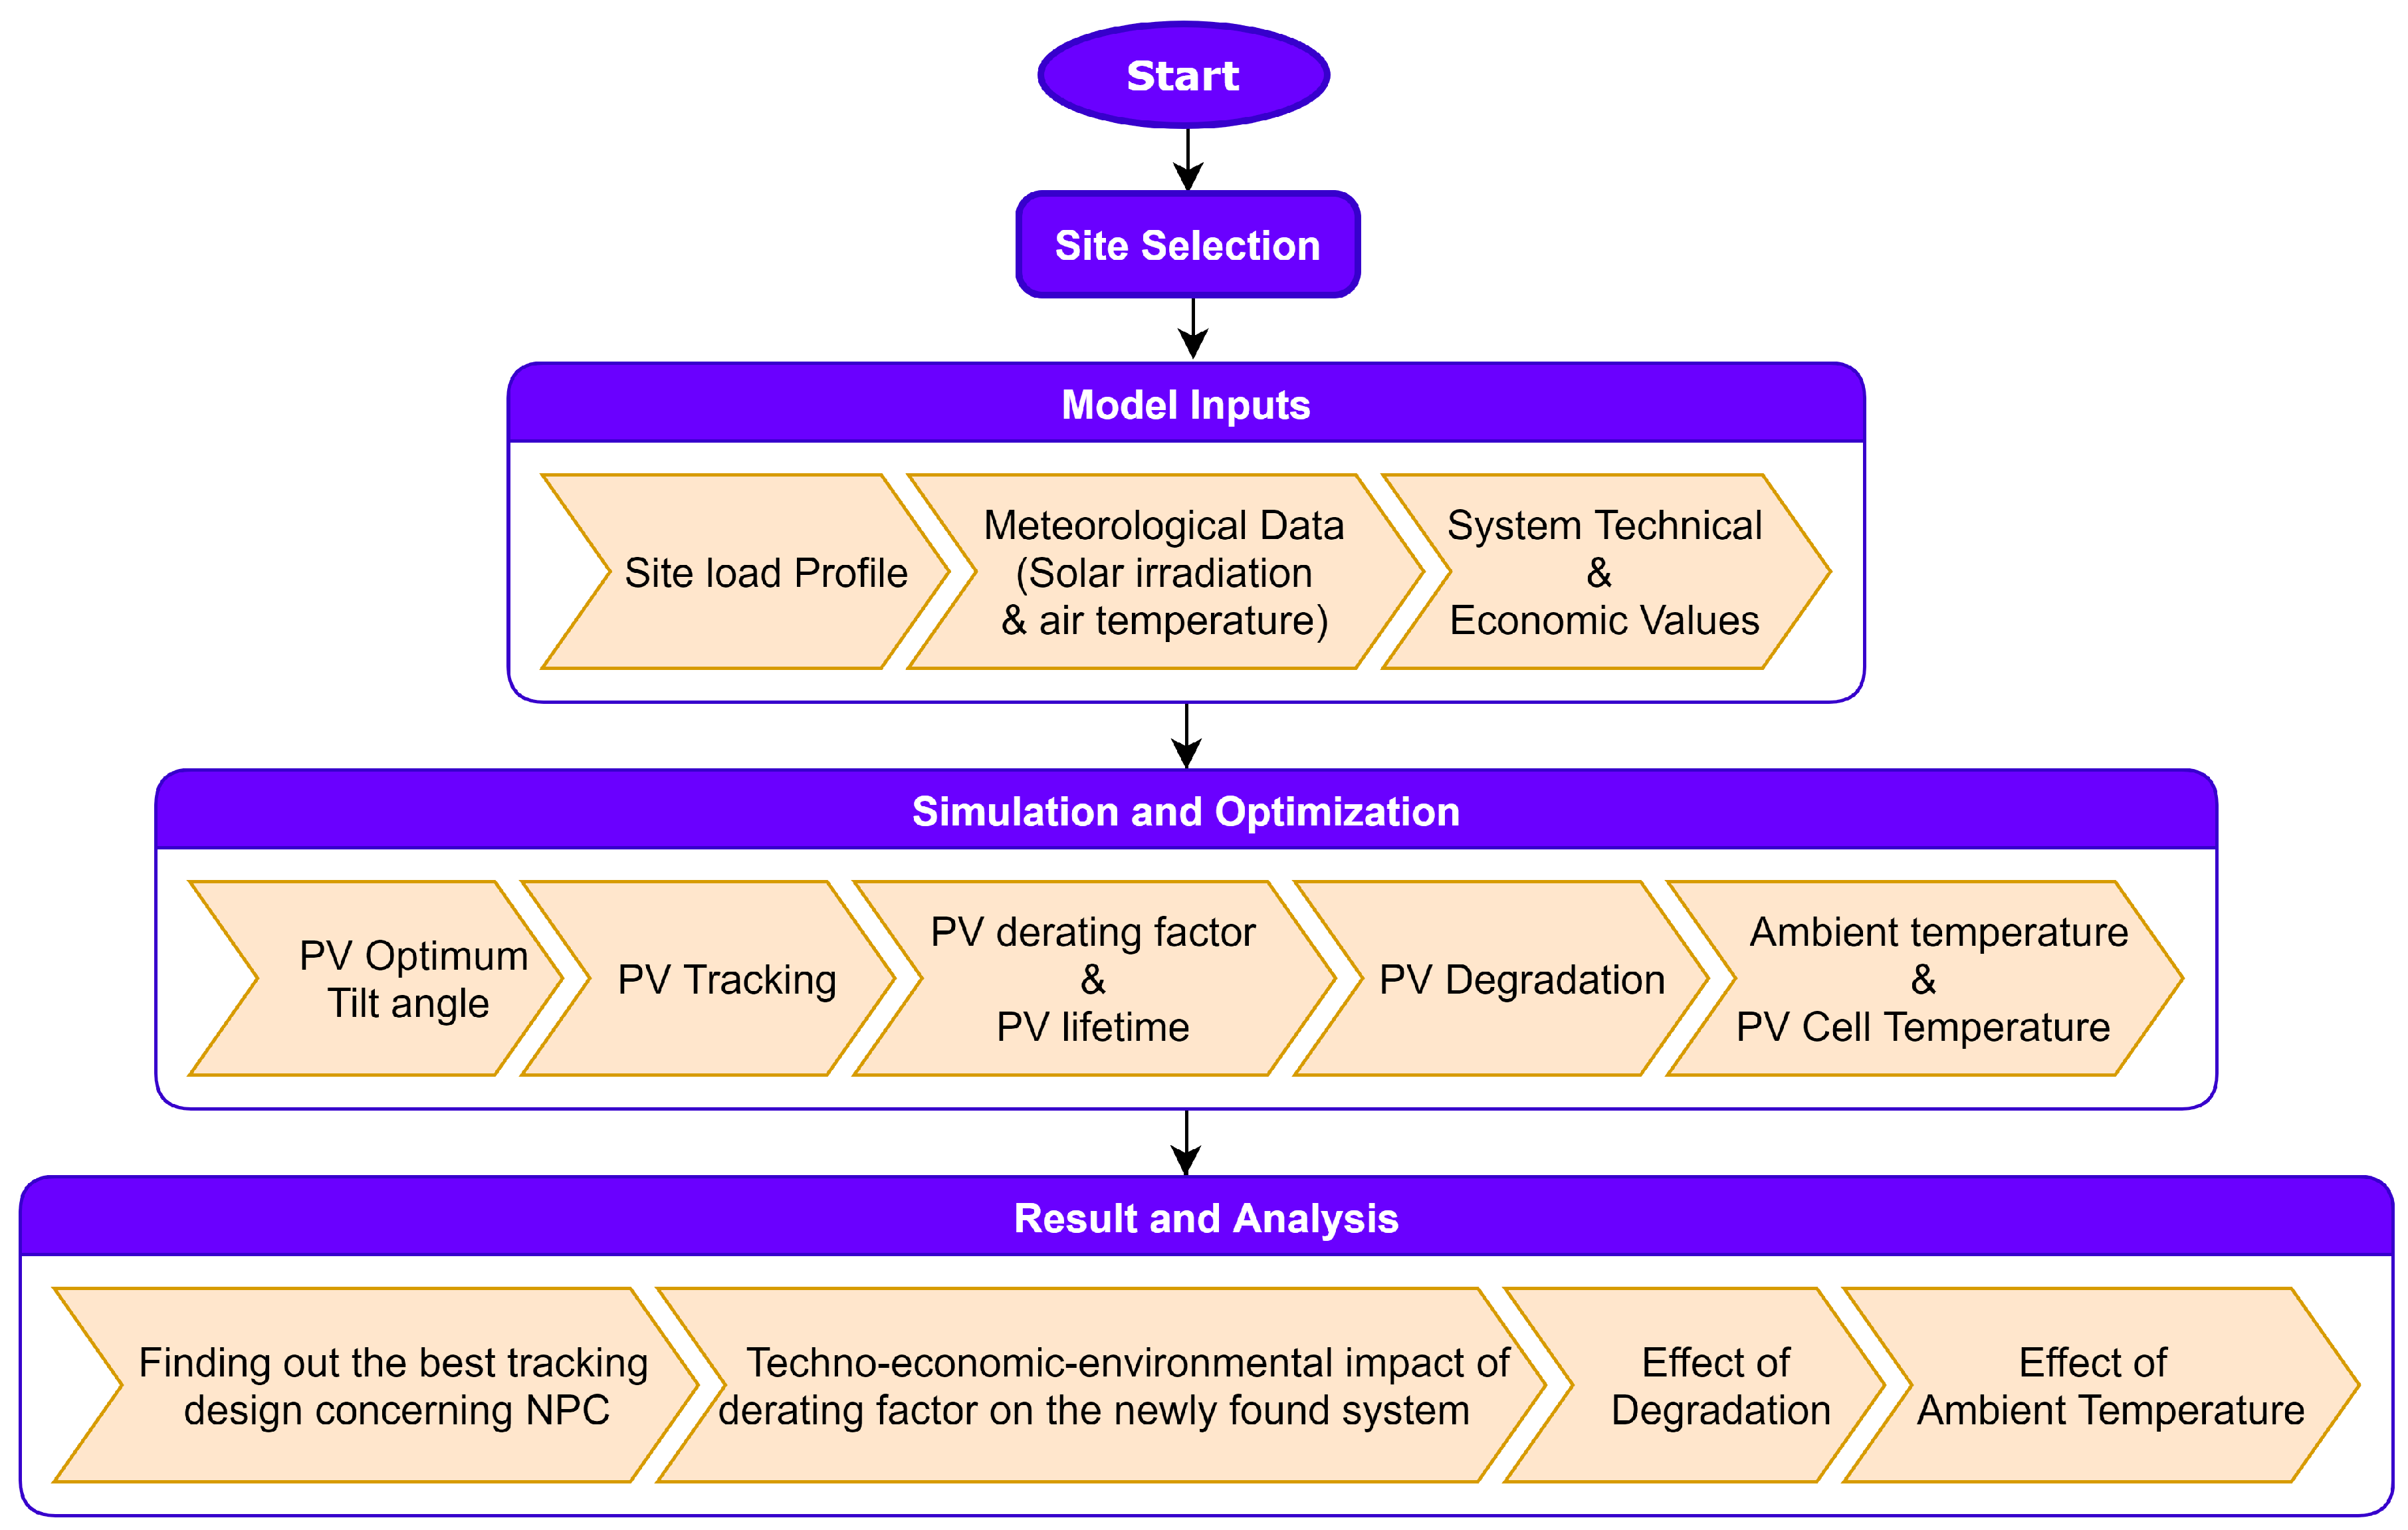
2. Research Methodology
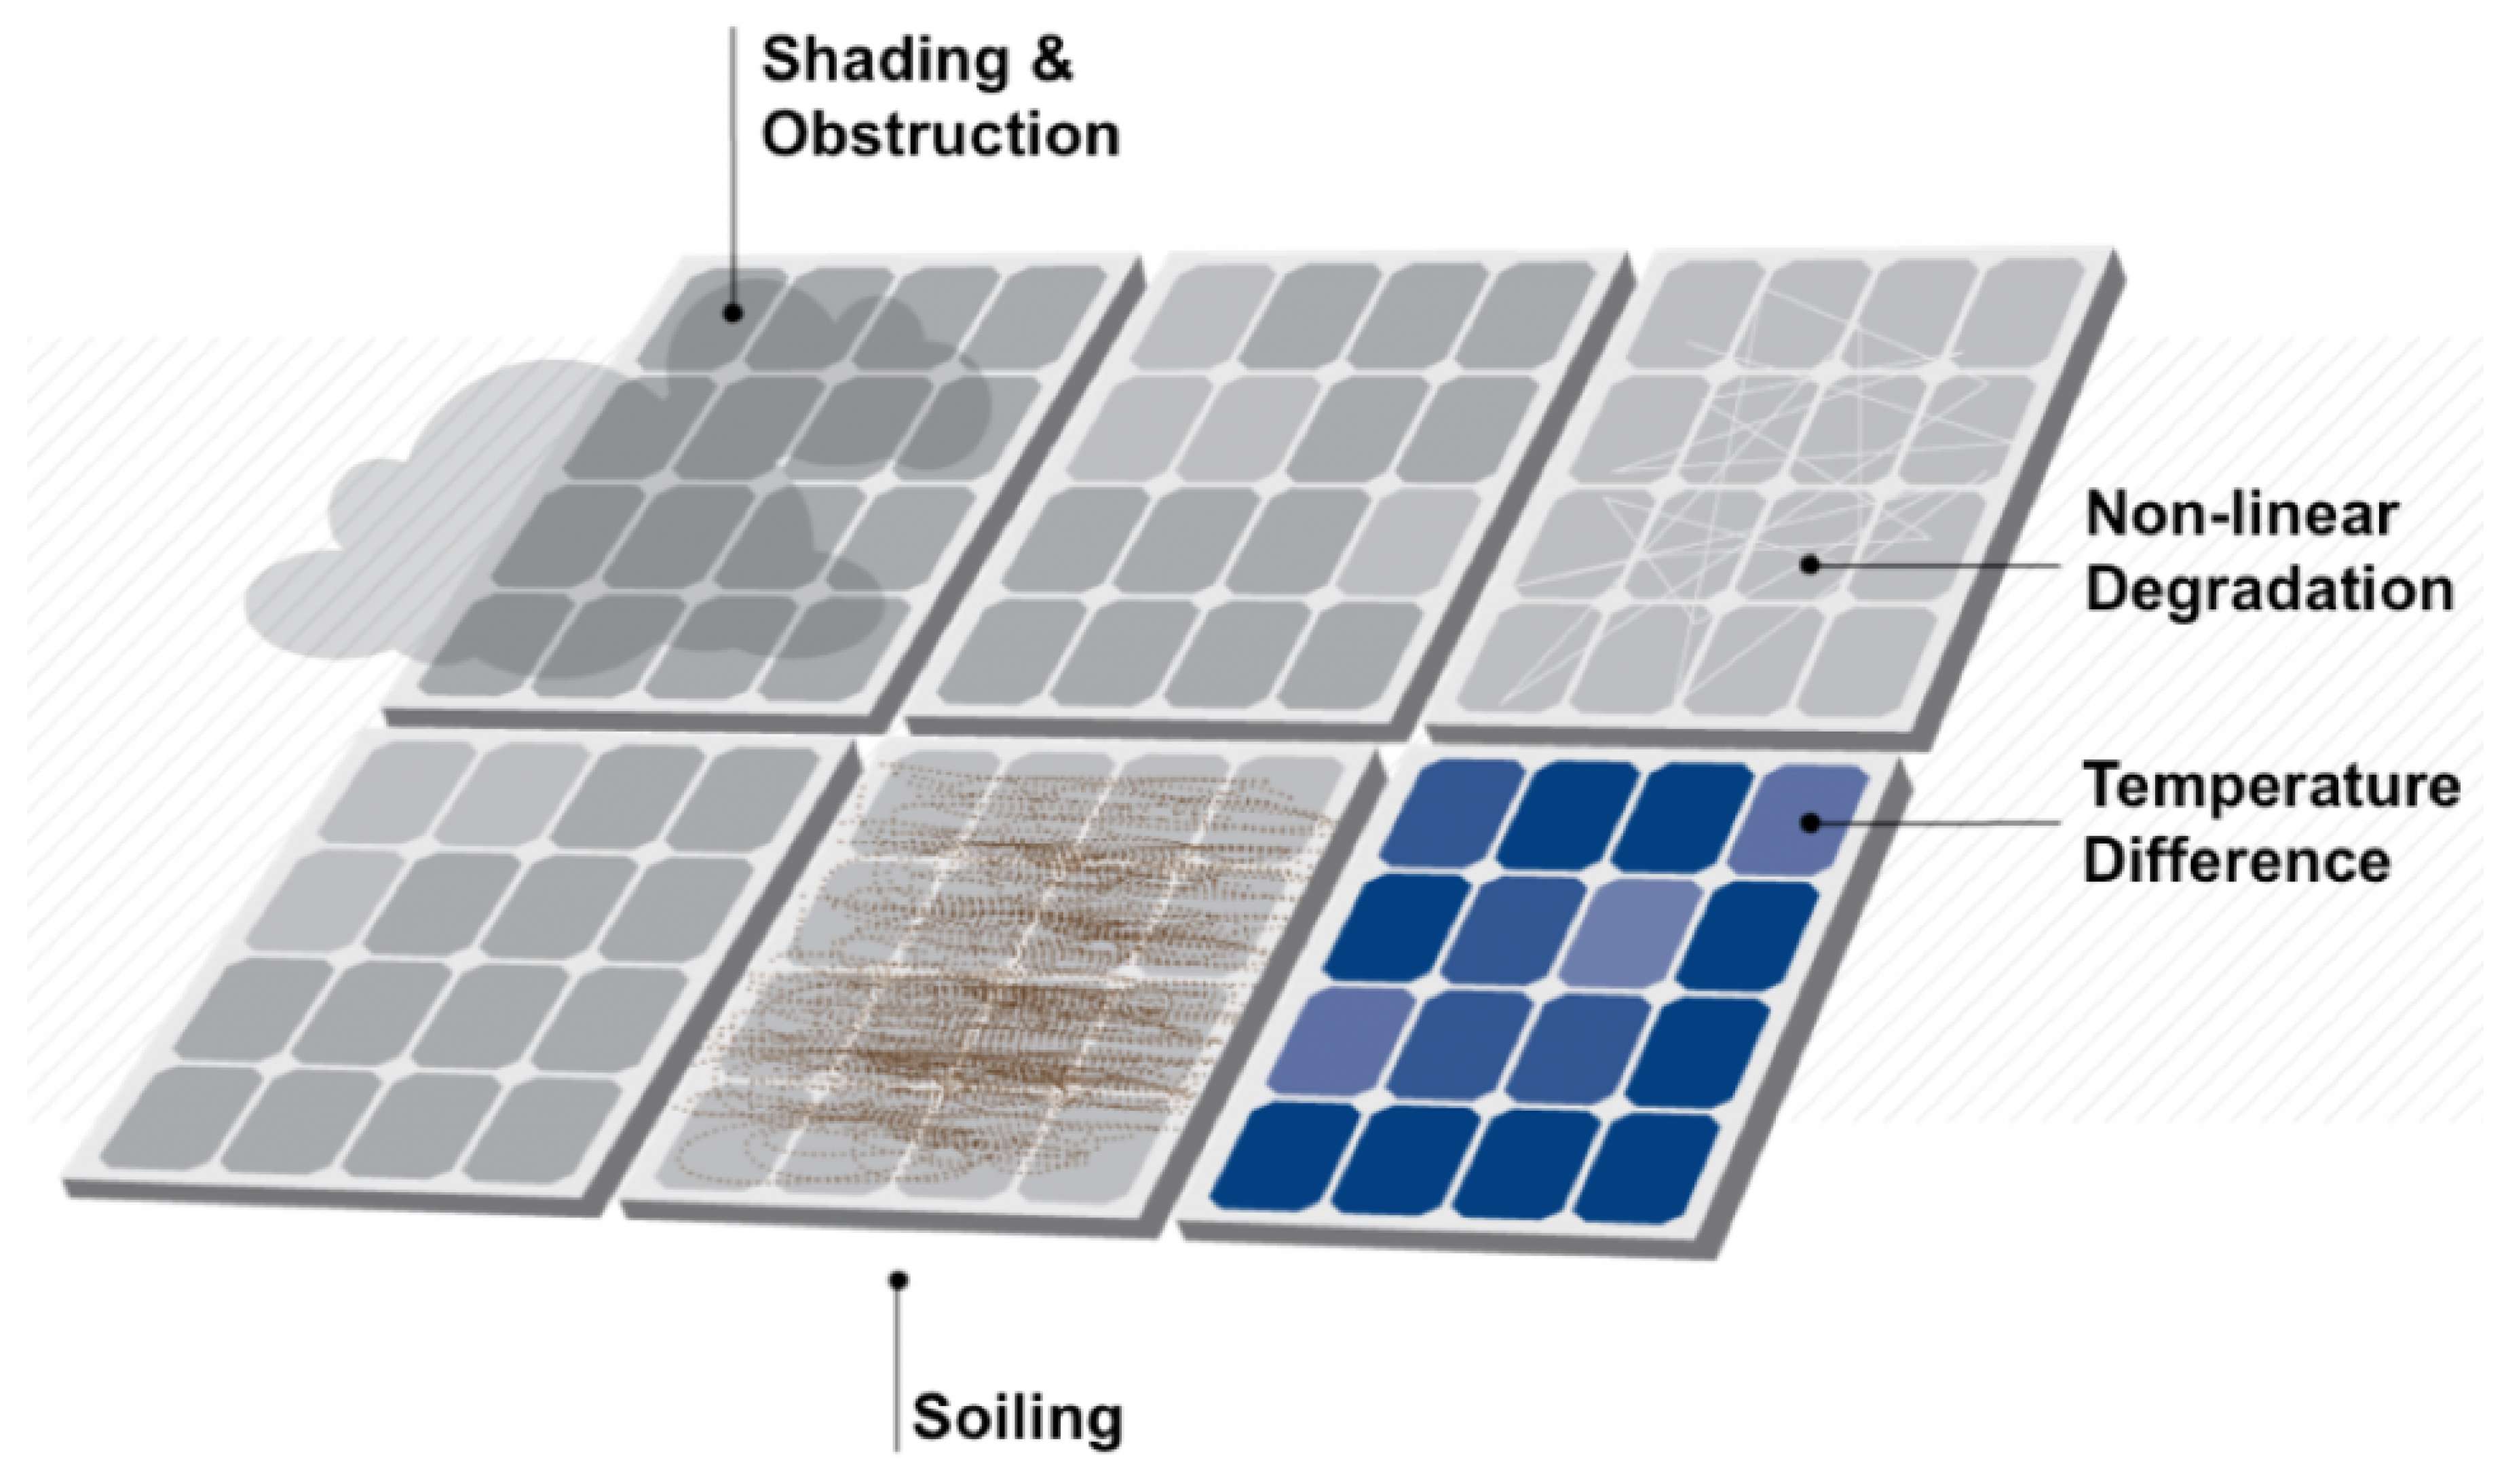
2.1. Derating Factor
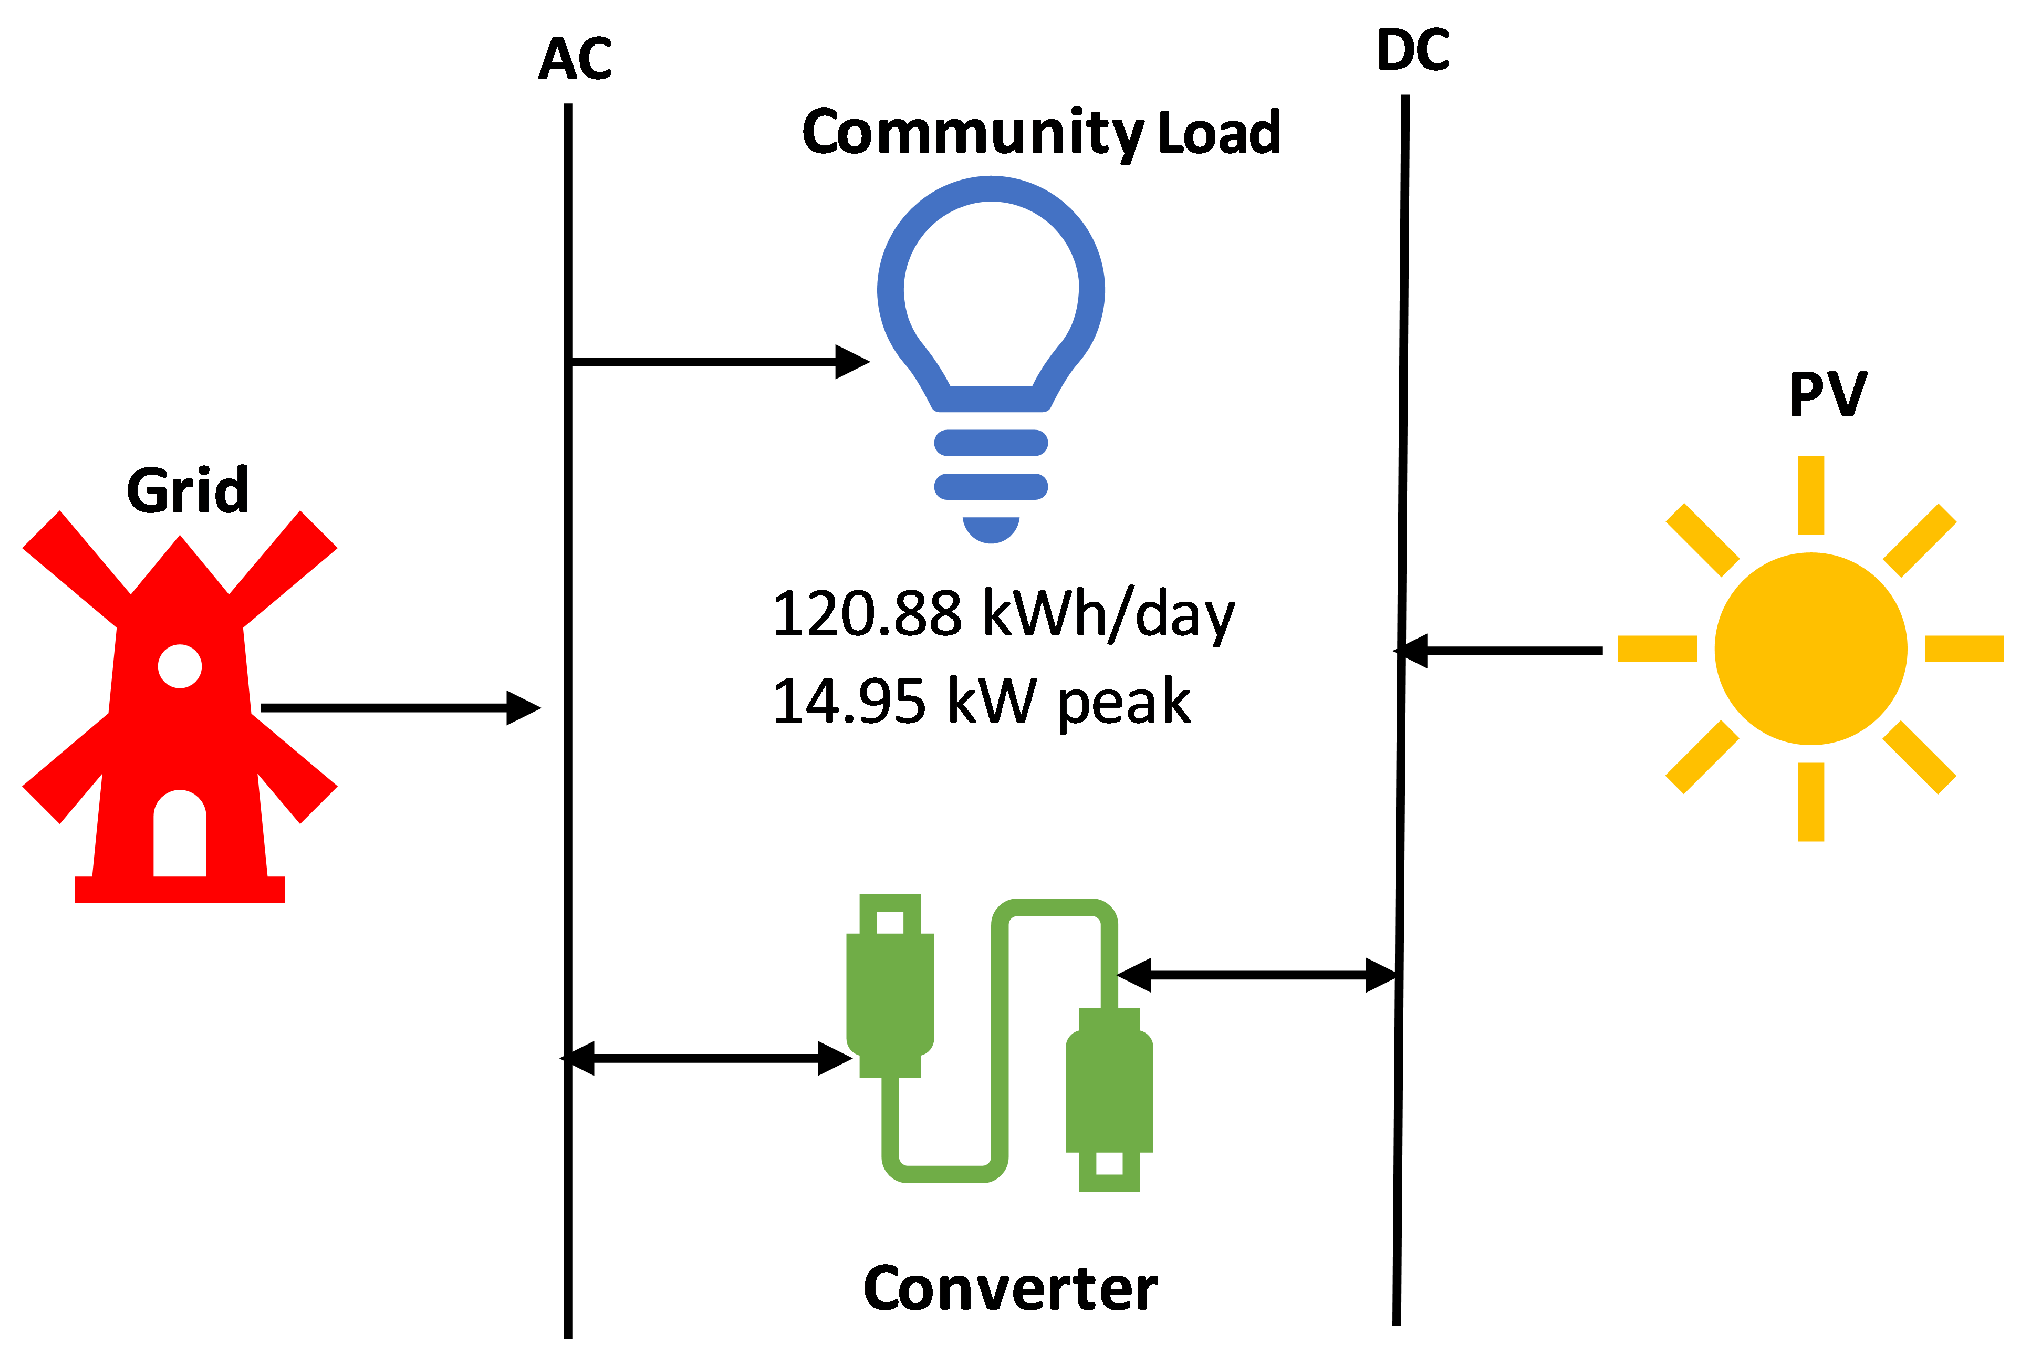
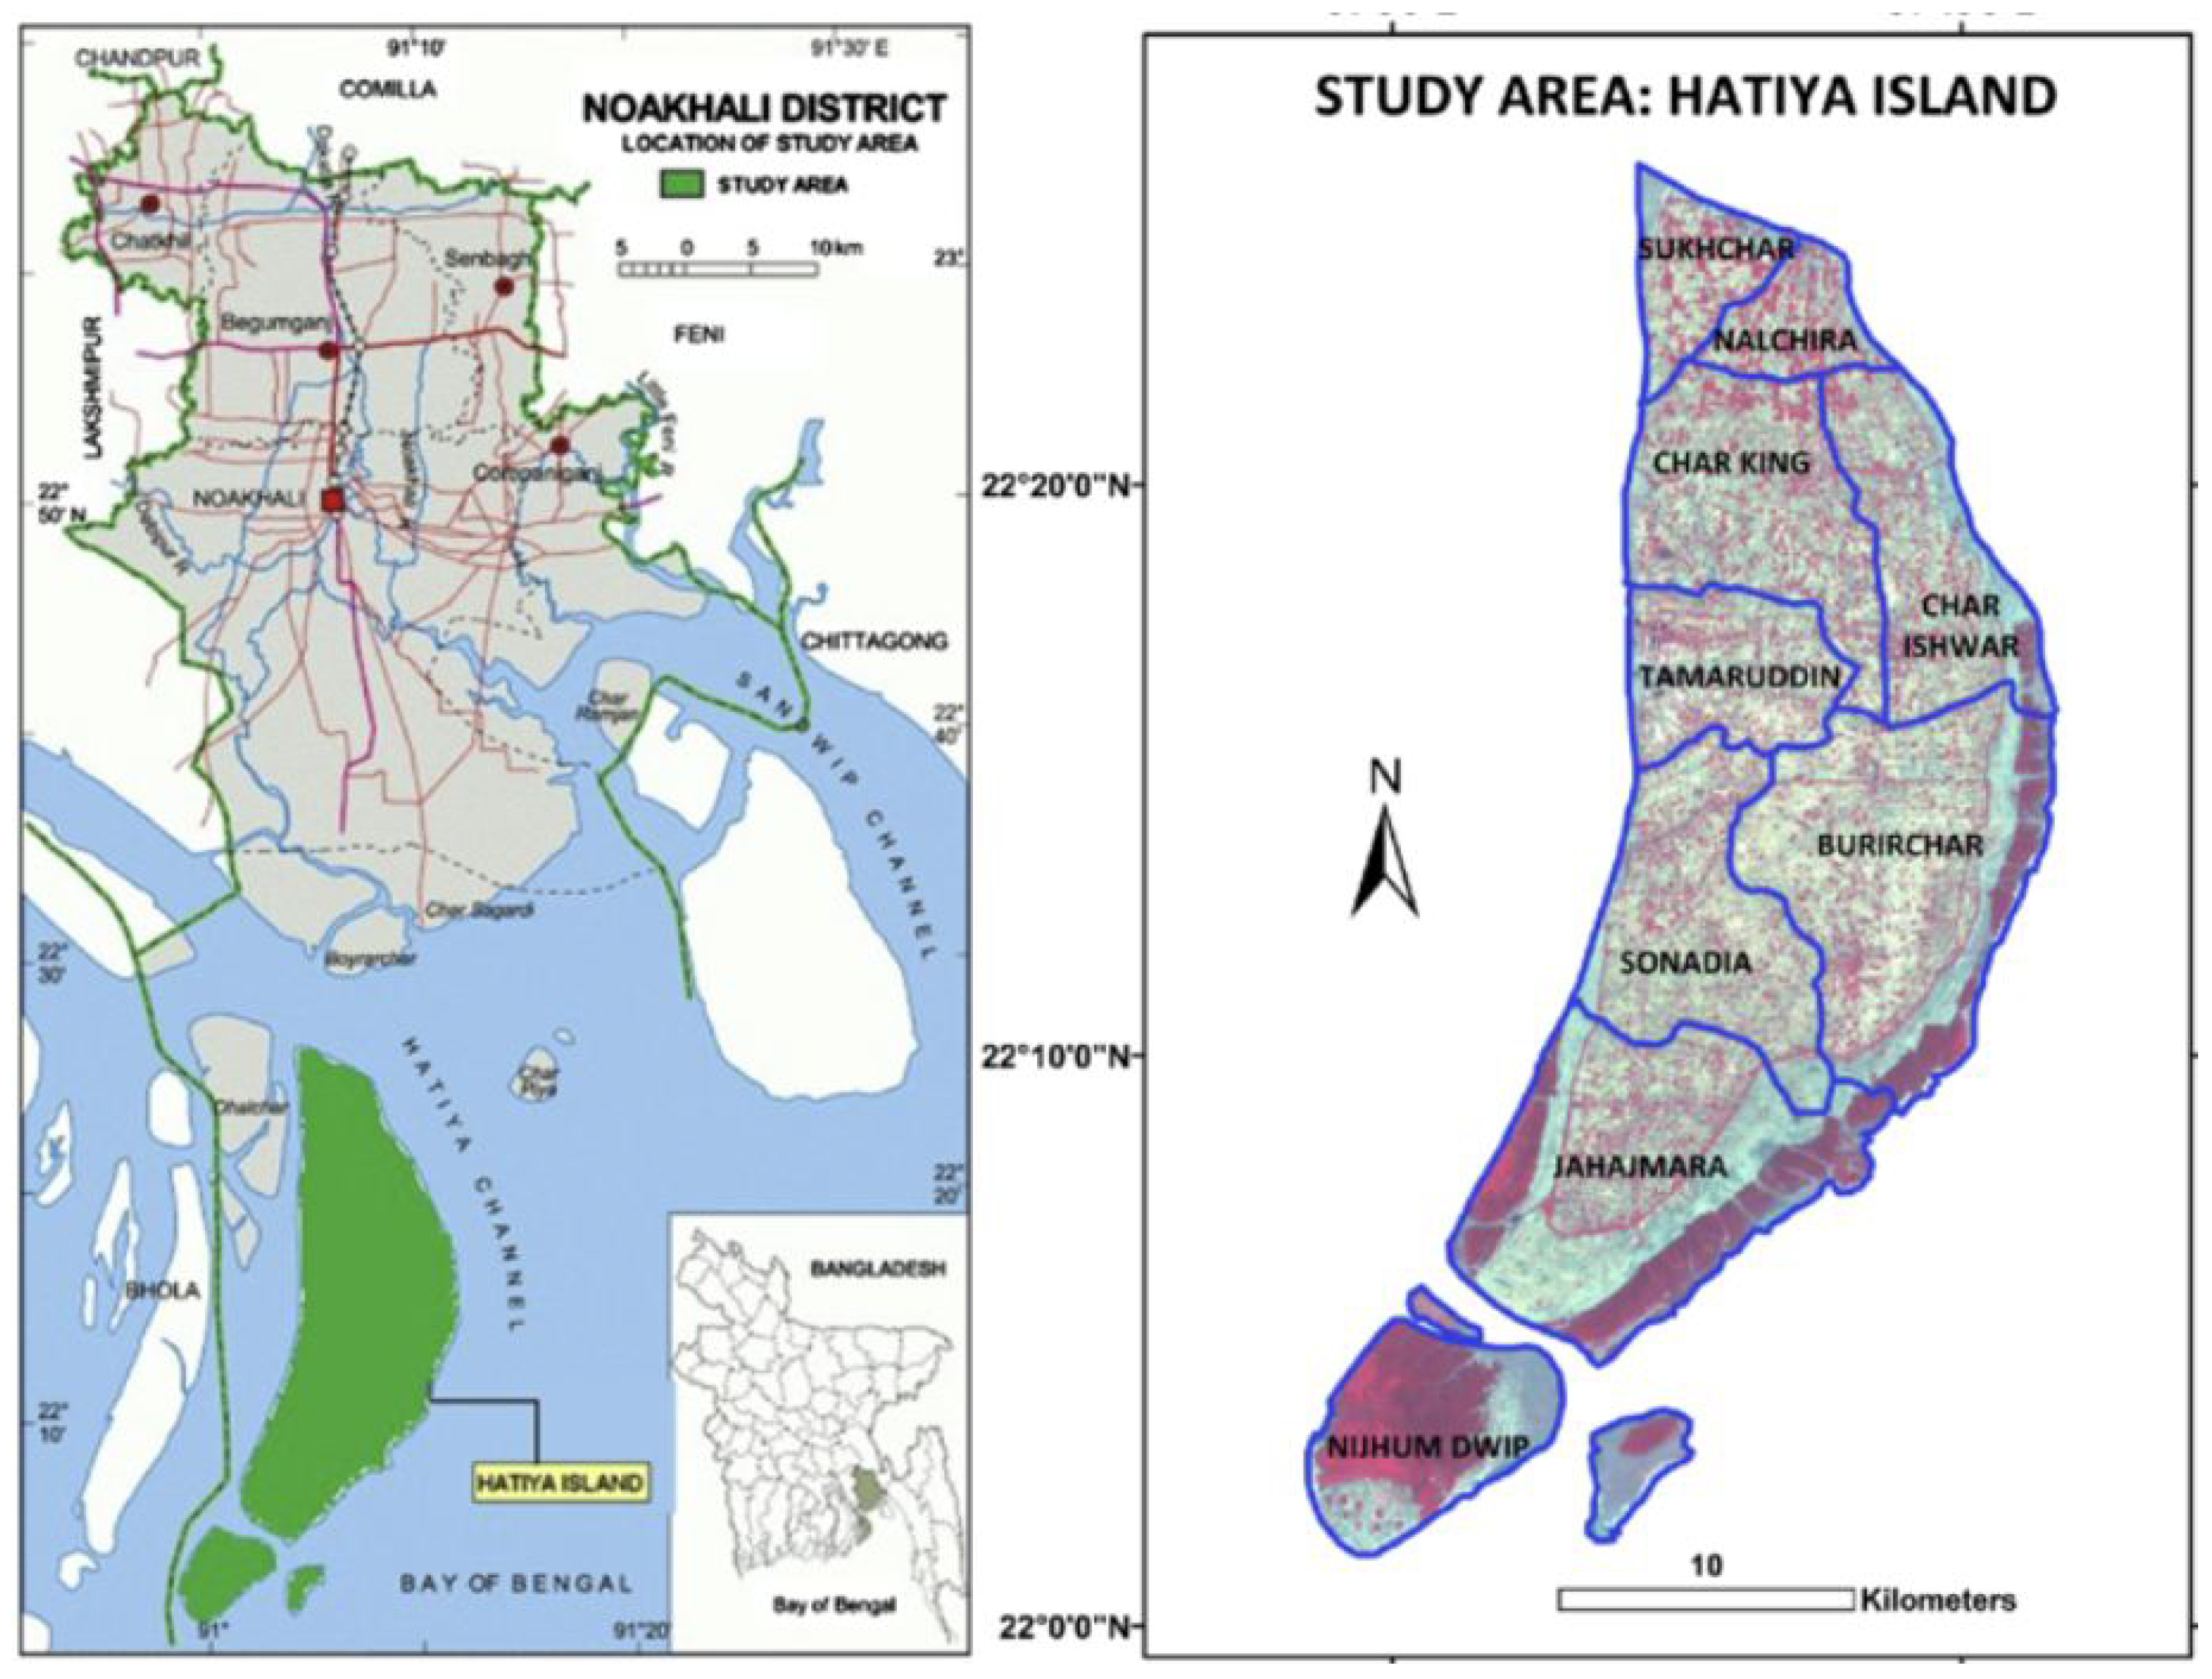
2.2. Case Study
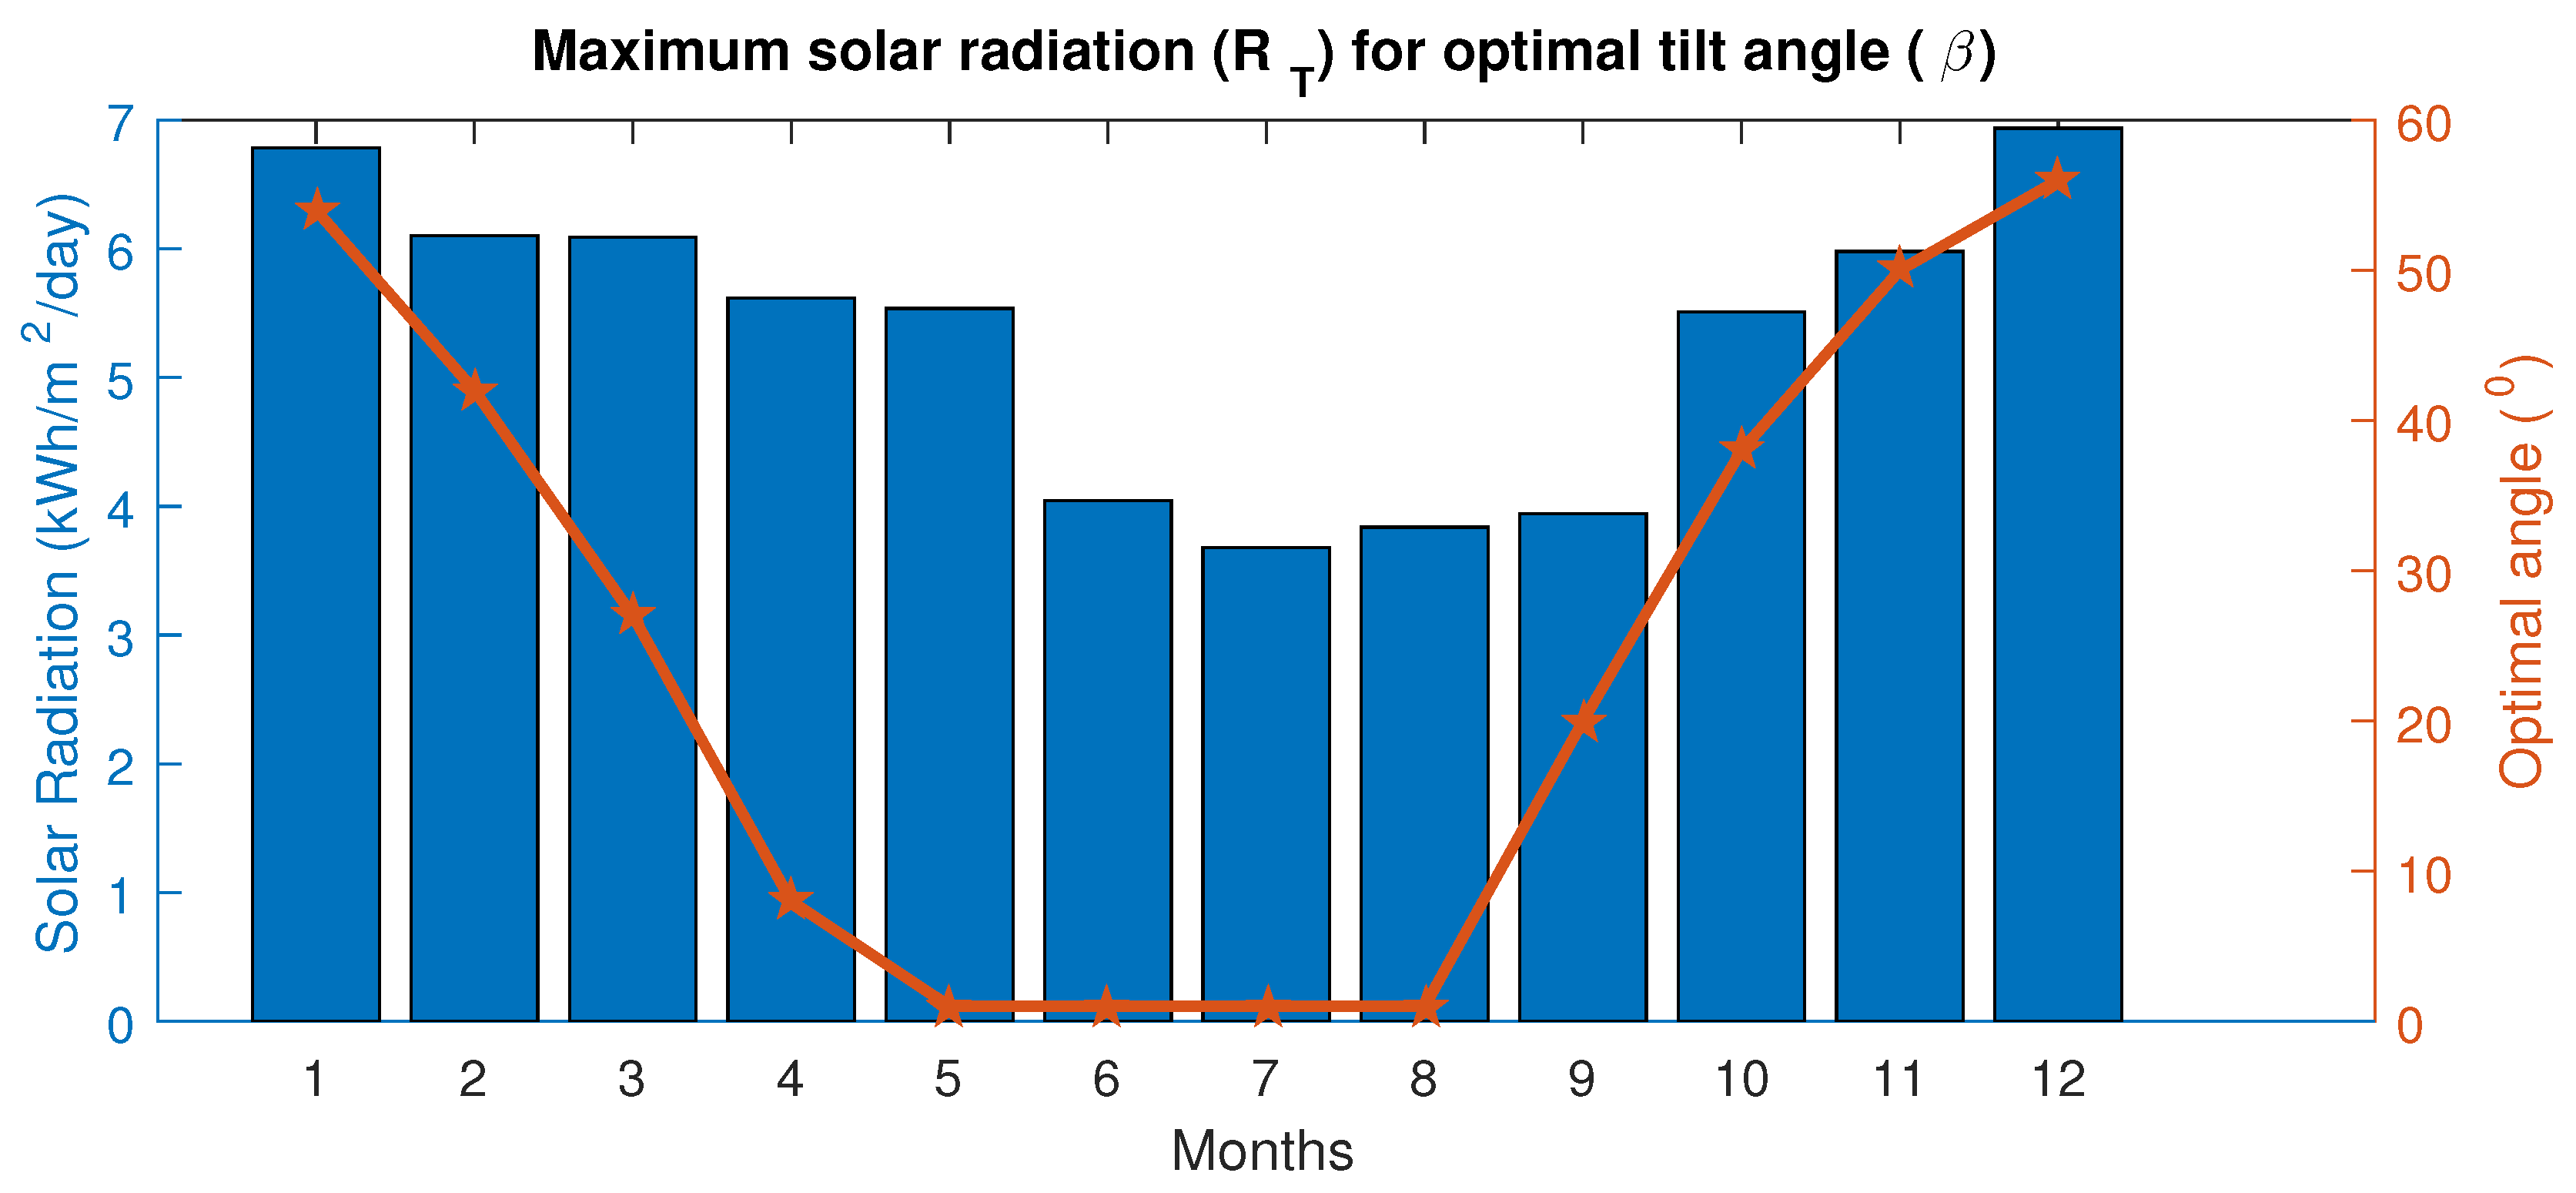
2.3. Optimum Angle of the PV Panel
| Algorithm 1: Optimization of the PV panel tilt angle. |
| for Every month do |
| Consider latitude, global solar radiation, and Julian day |
| Vary 0° −90° with a 1° step |
| Calculate extraterrestrial radiation (Equation (2)), declination angle (Equation (3)), sunshine hour angle (Equation (4)), and clearness index (Equation (7)) |
| if ws < 0 then |
| Calculate using Equation (6) |
| else |
| Calculate using Equation (5) |
| end if |
| Calculate using Equation (8) with the support of Equations (9) and (10) |
| Find the optimal angle for the maximum RT |
| end for |
2.4. Model Inputs
2.4.1. Meteorological Data
2.4.2. Grid Tariff
2.5. Load Profile
2.6. Solar Photovoltaic Module
2.7. Converter
2.8. Economic Parameters
3. Results
3.1. PV Tracking
3.2. Performance of PV Systems Based on Derating Factor and Lifetime
3.2.1. Technical Performance
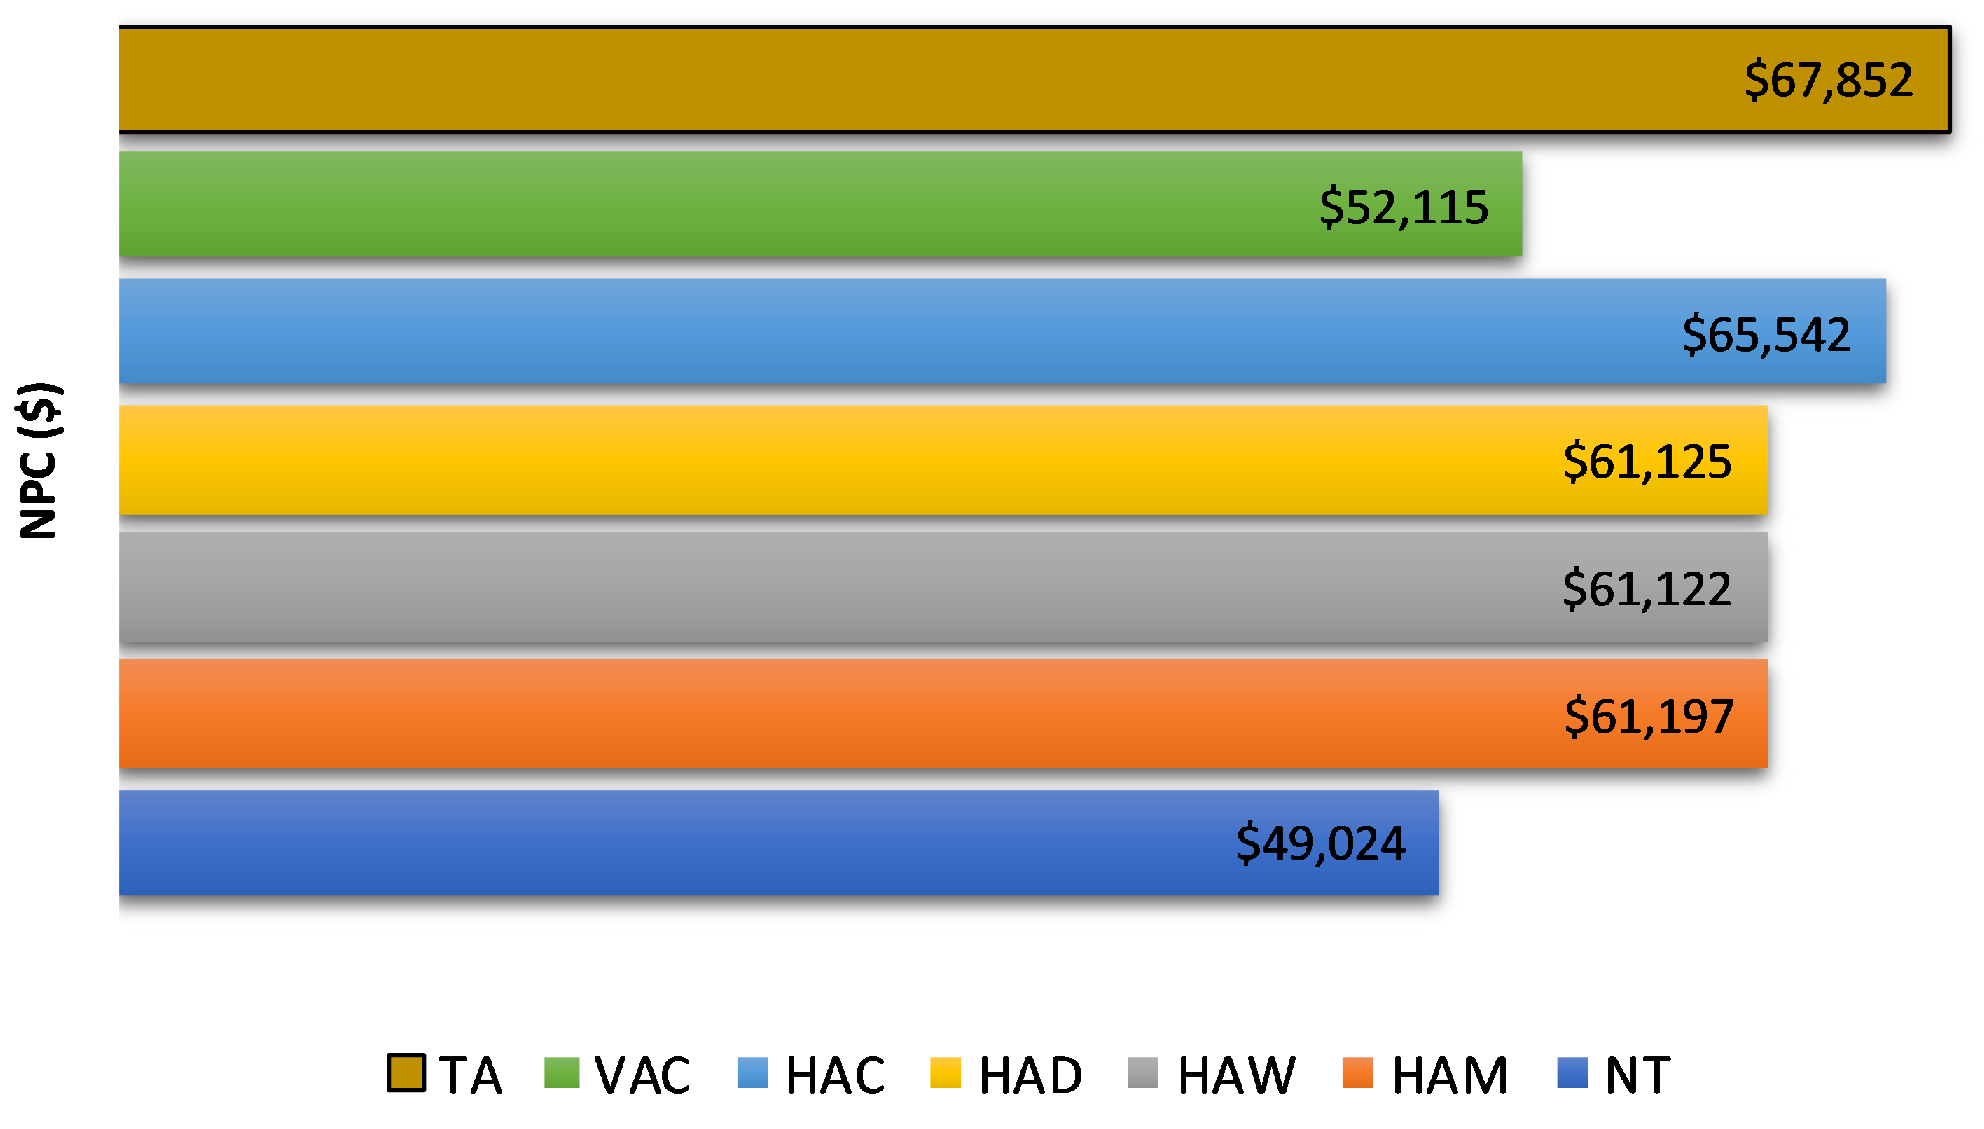
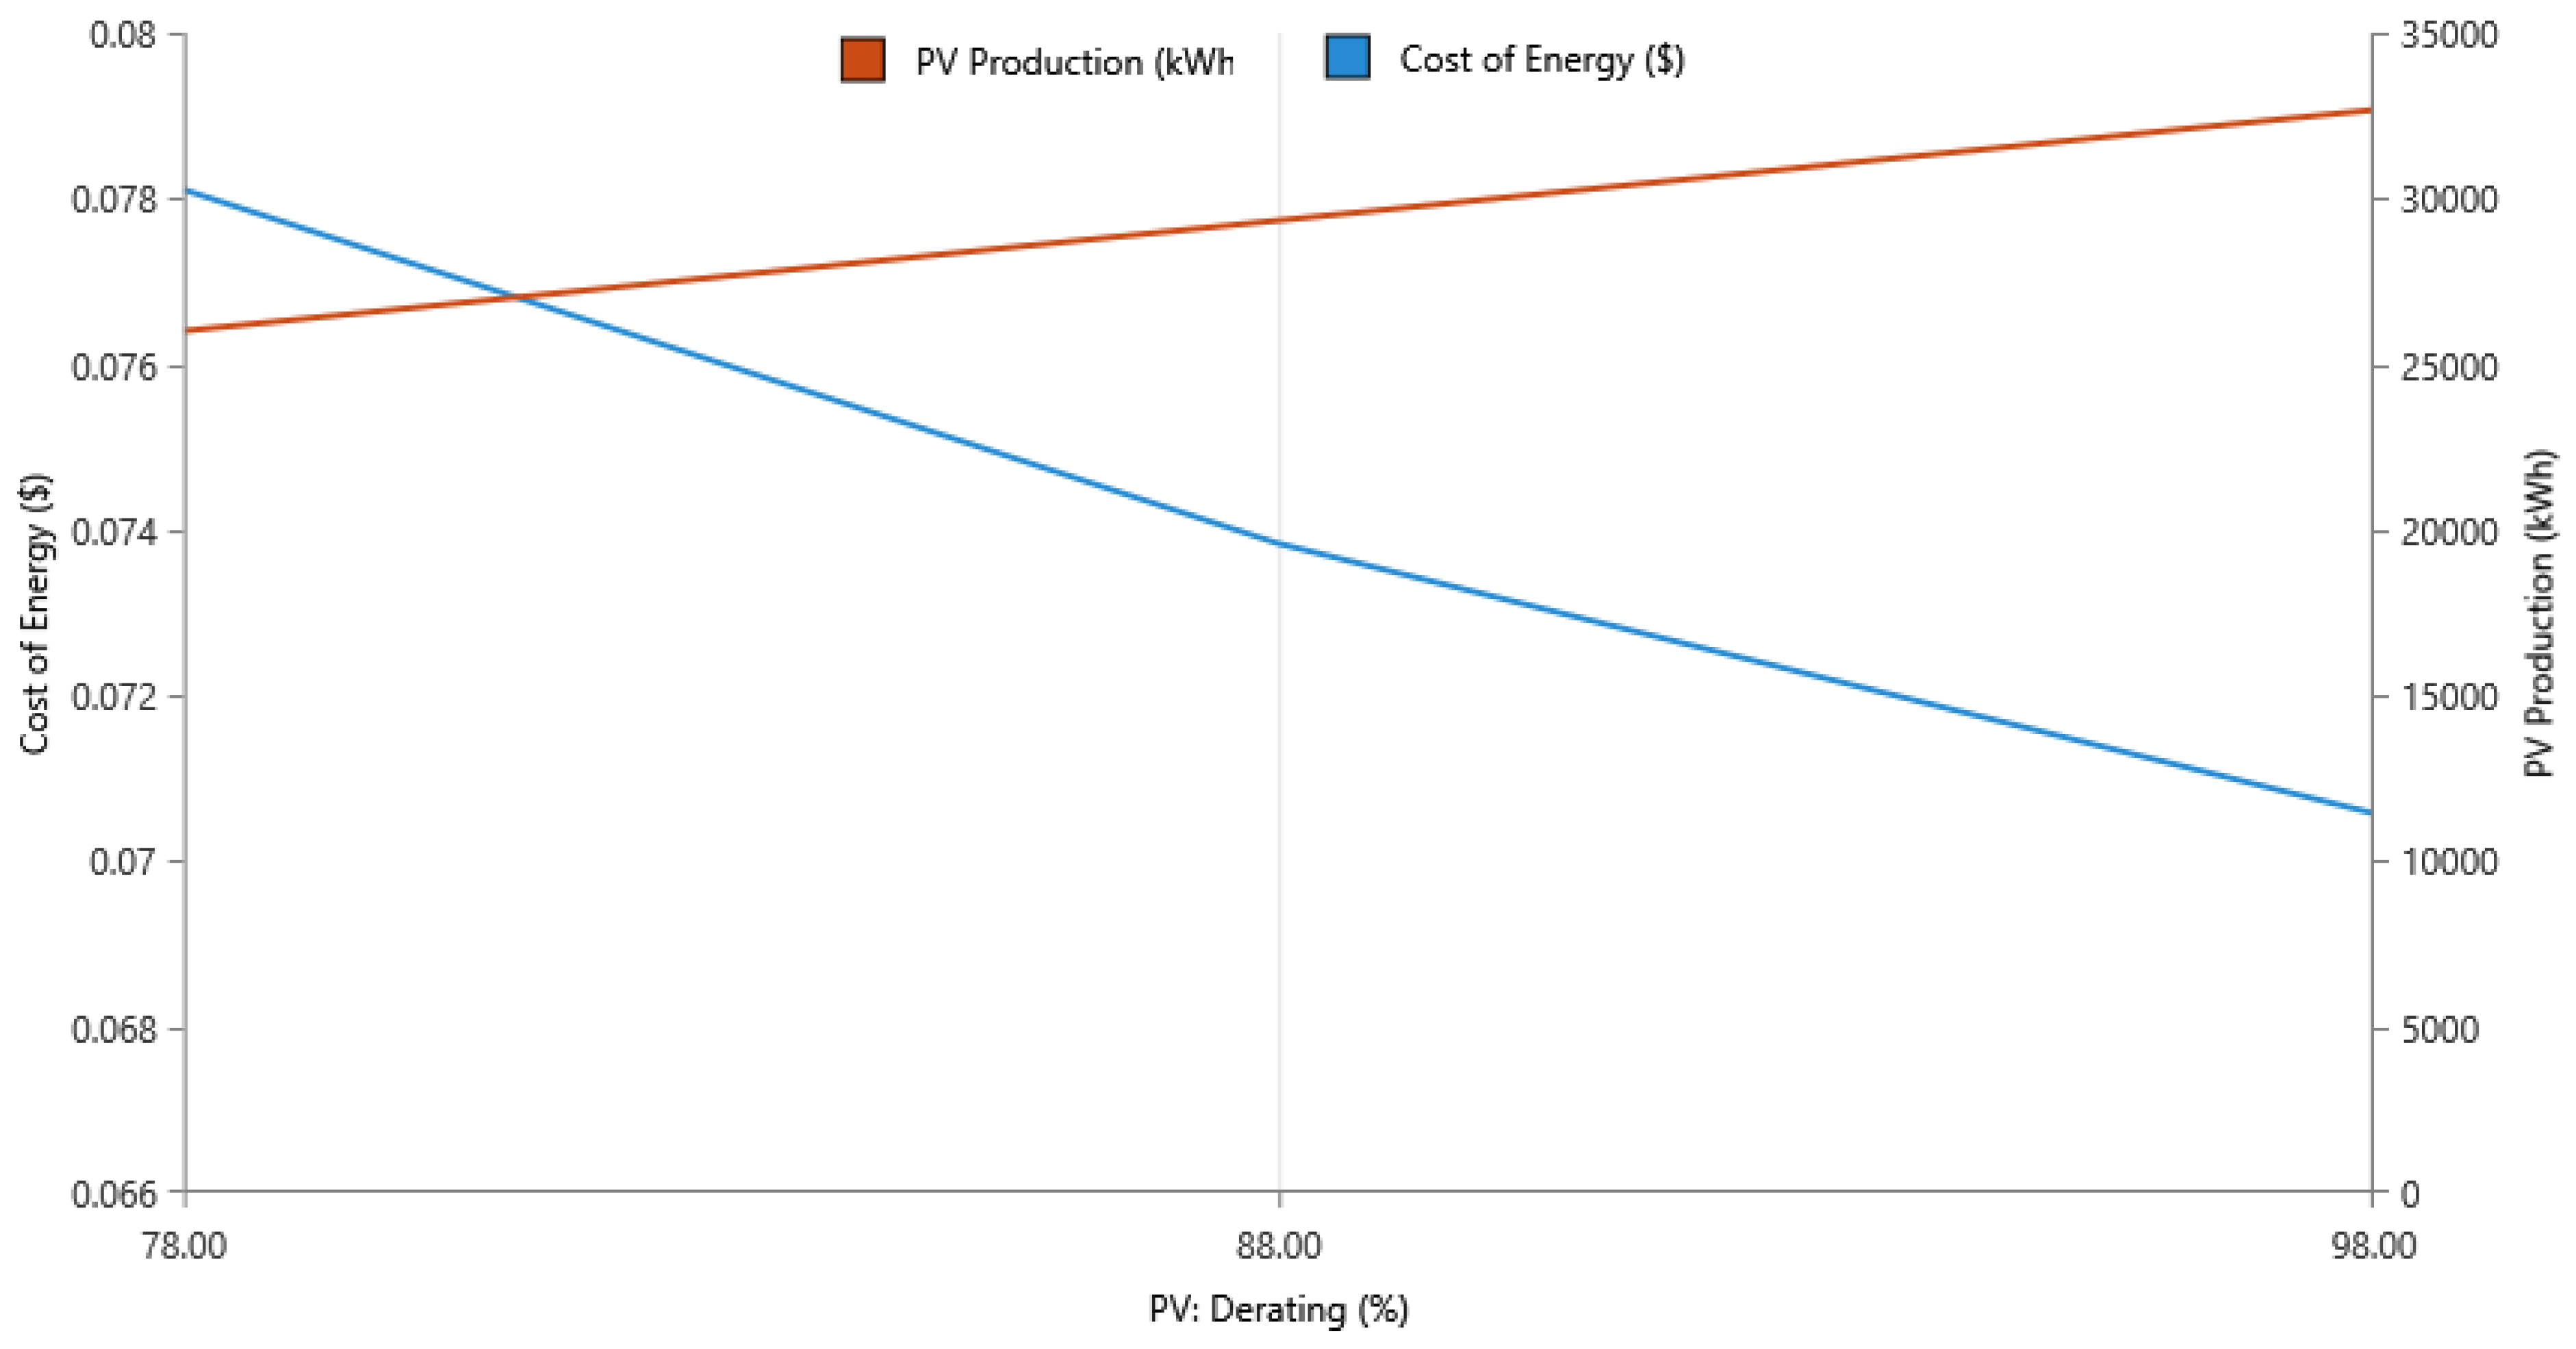
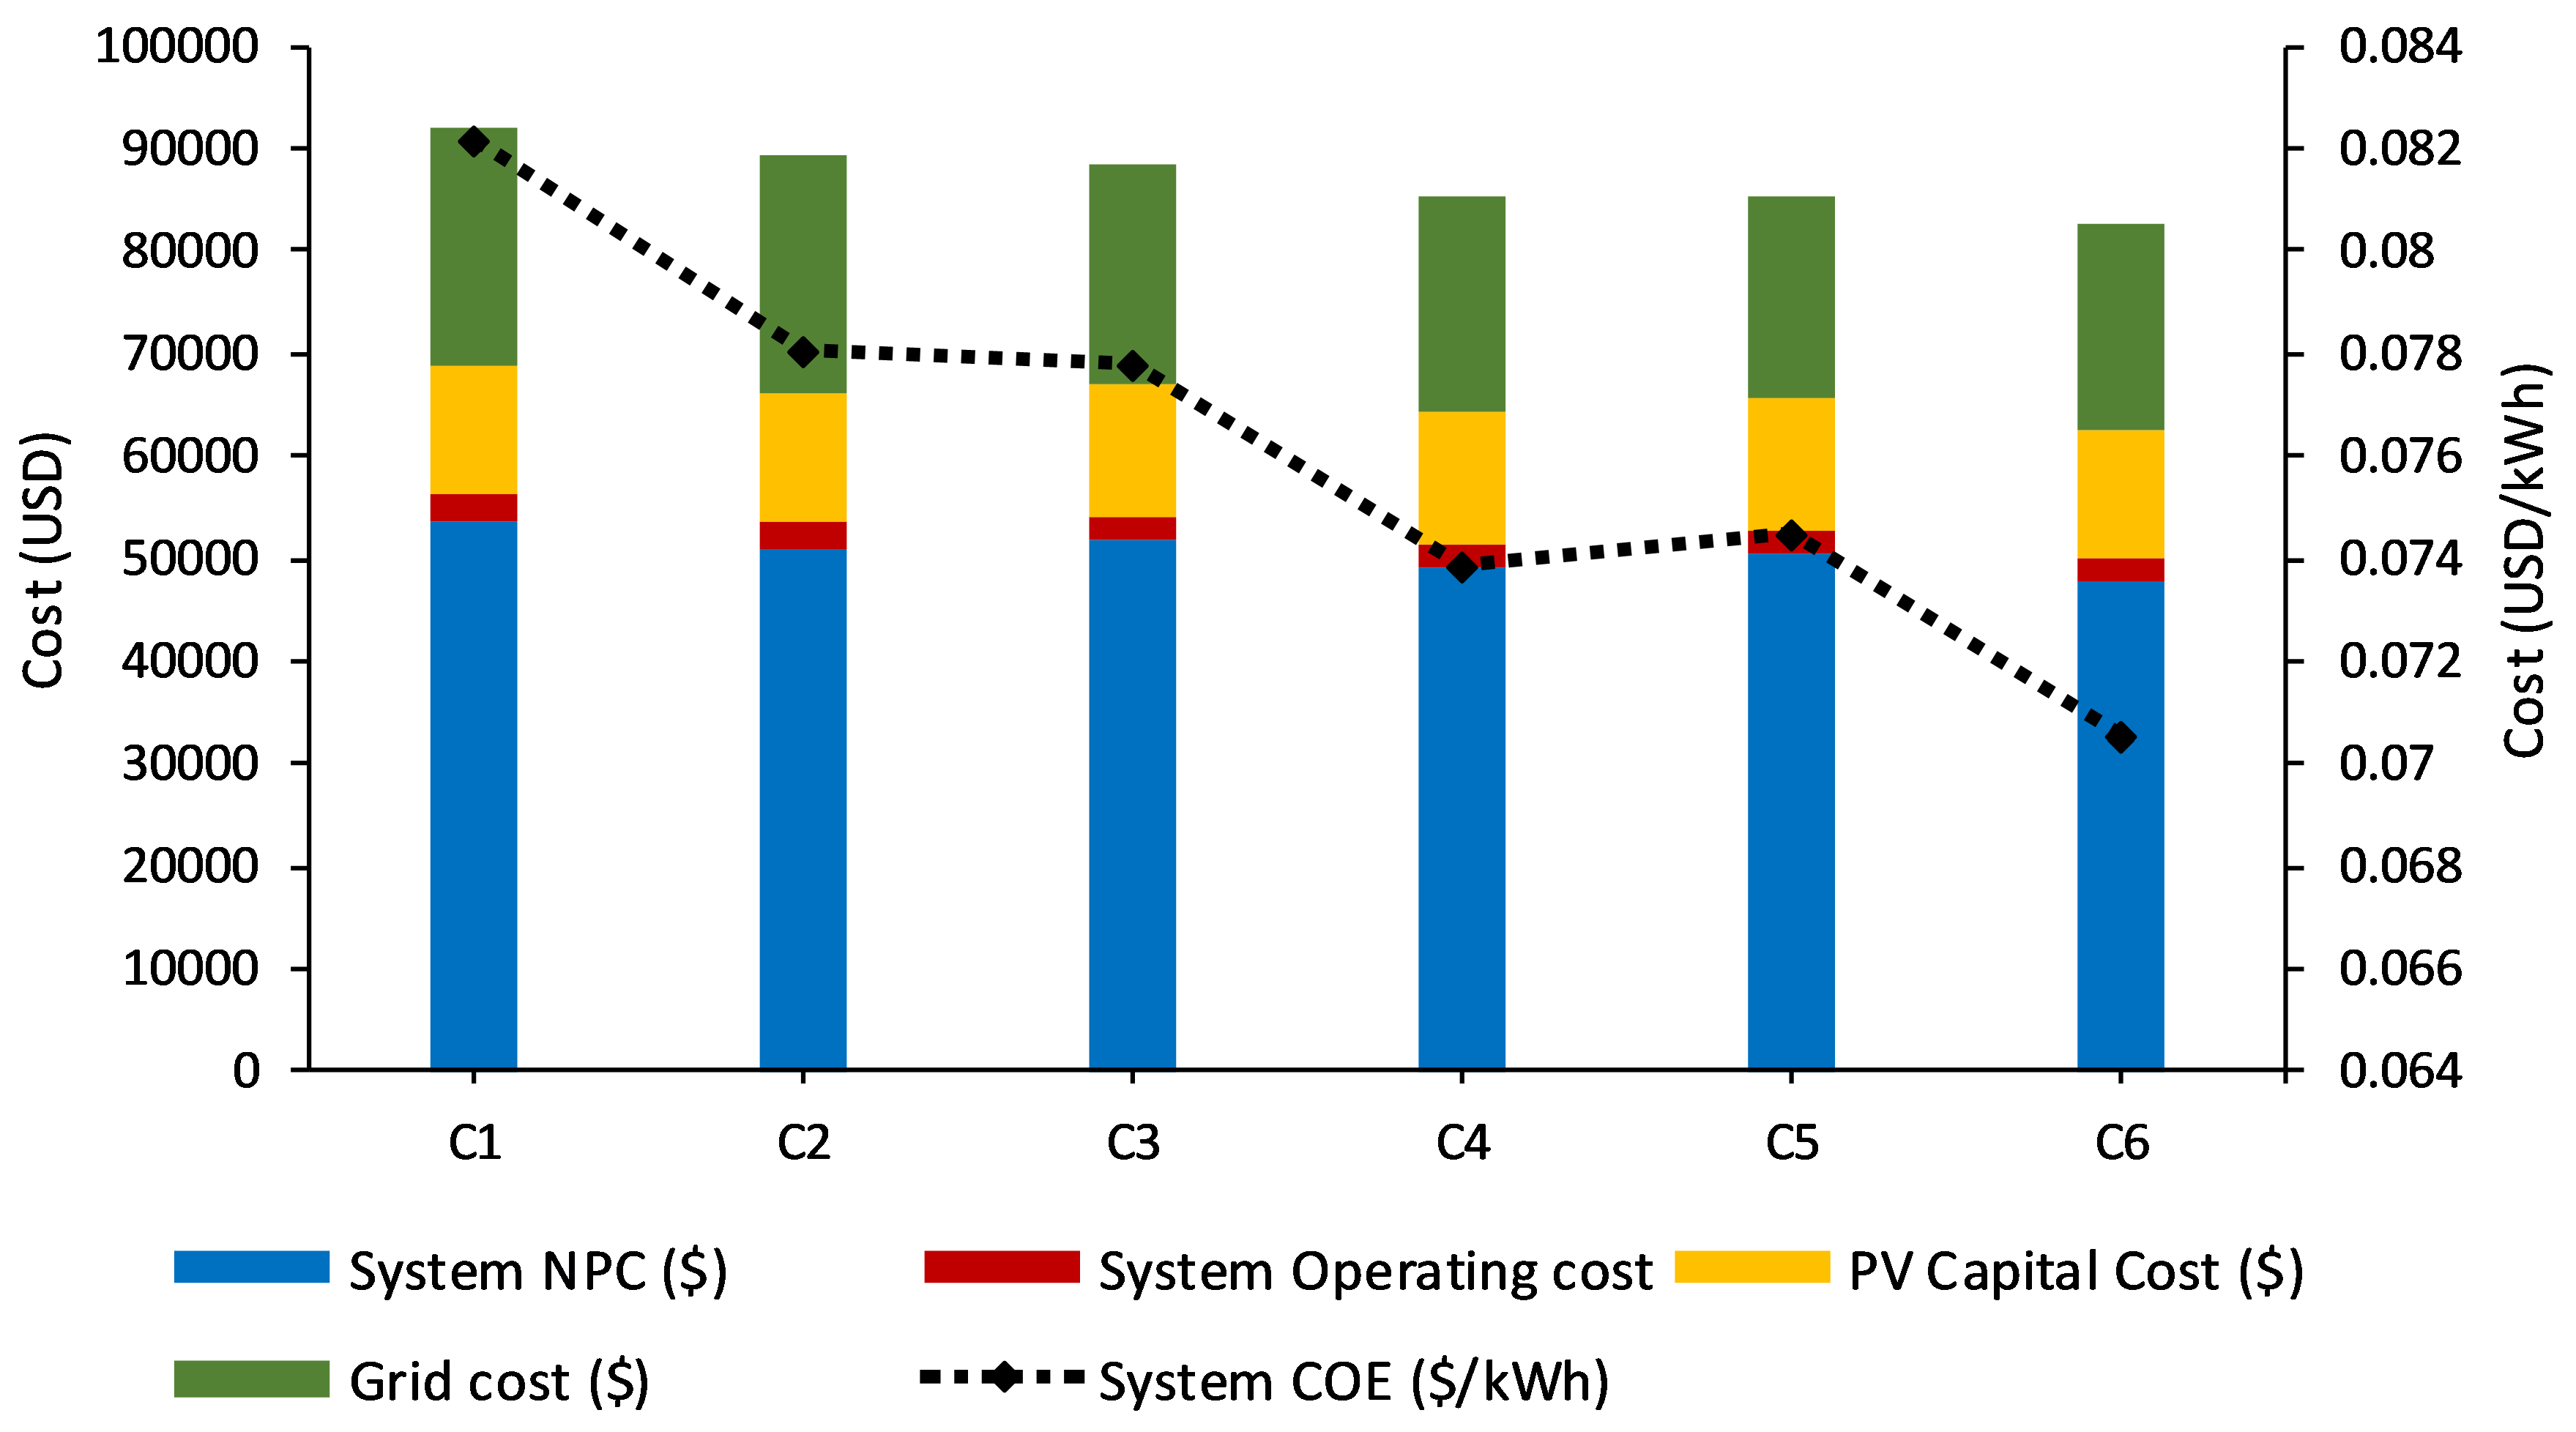
3.2.2. Economic Performance
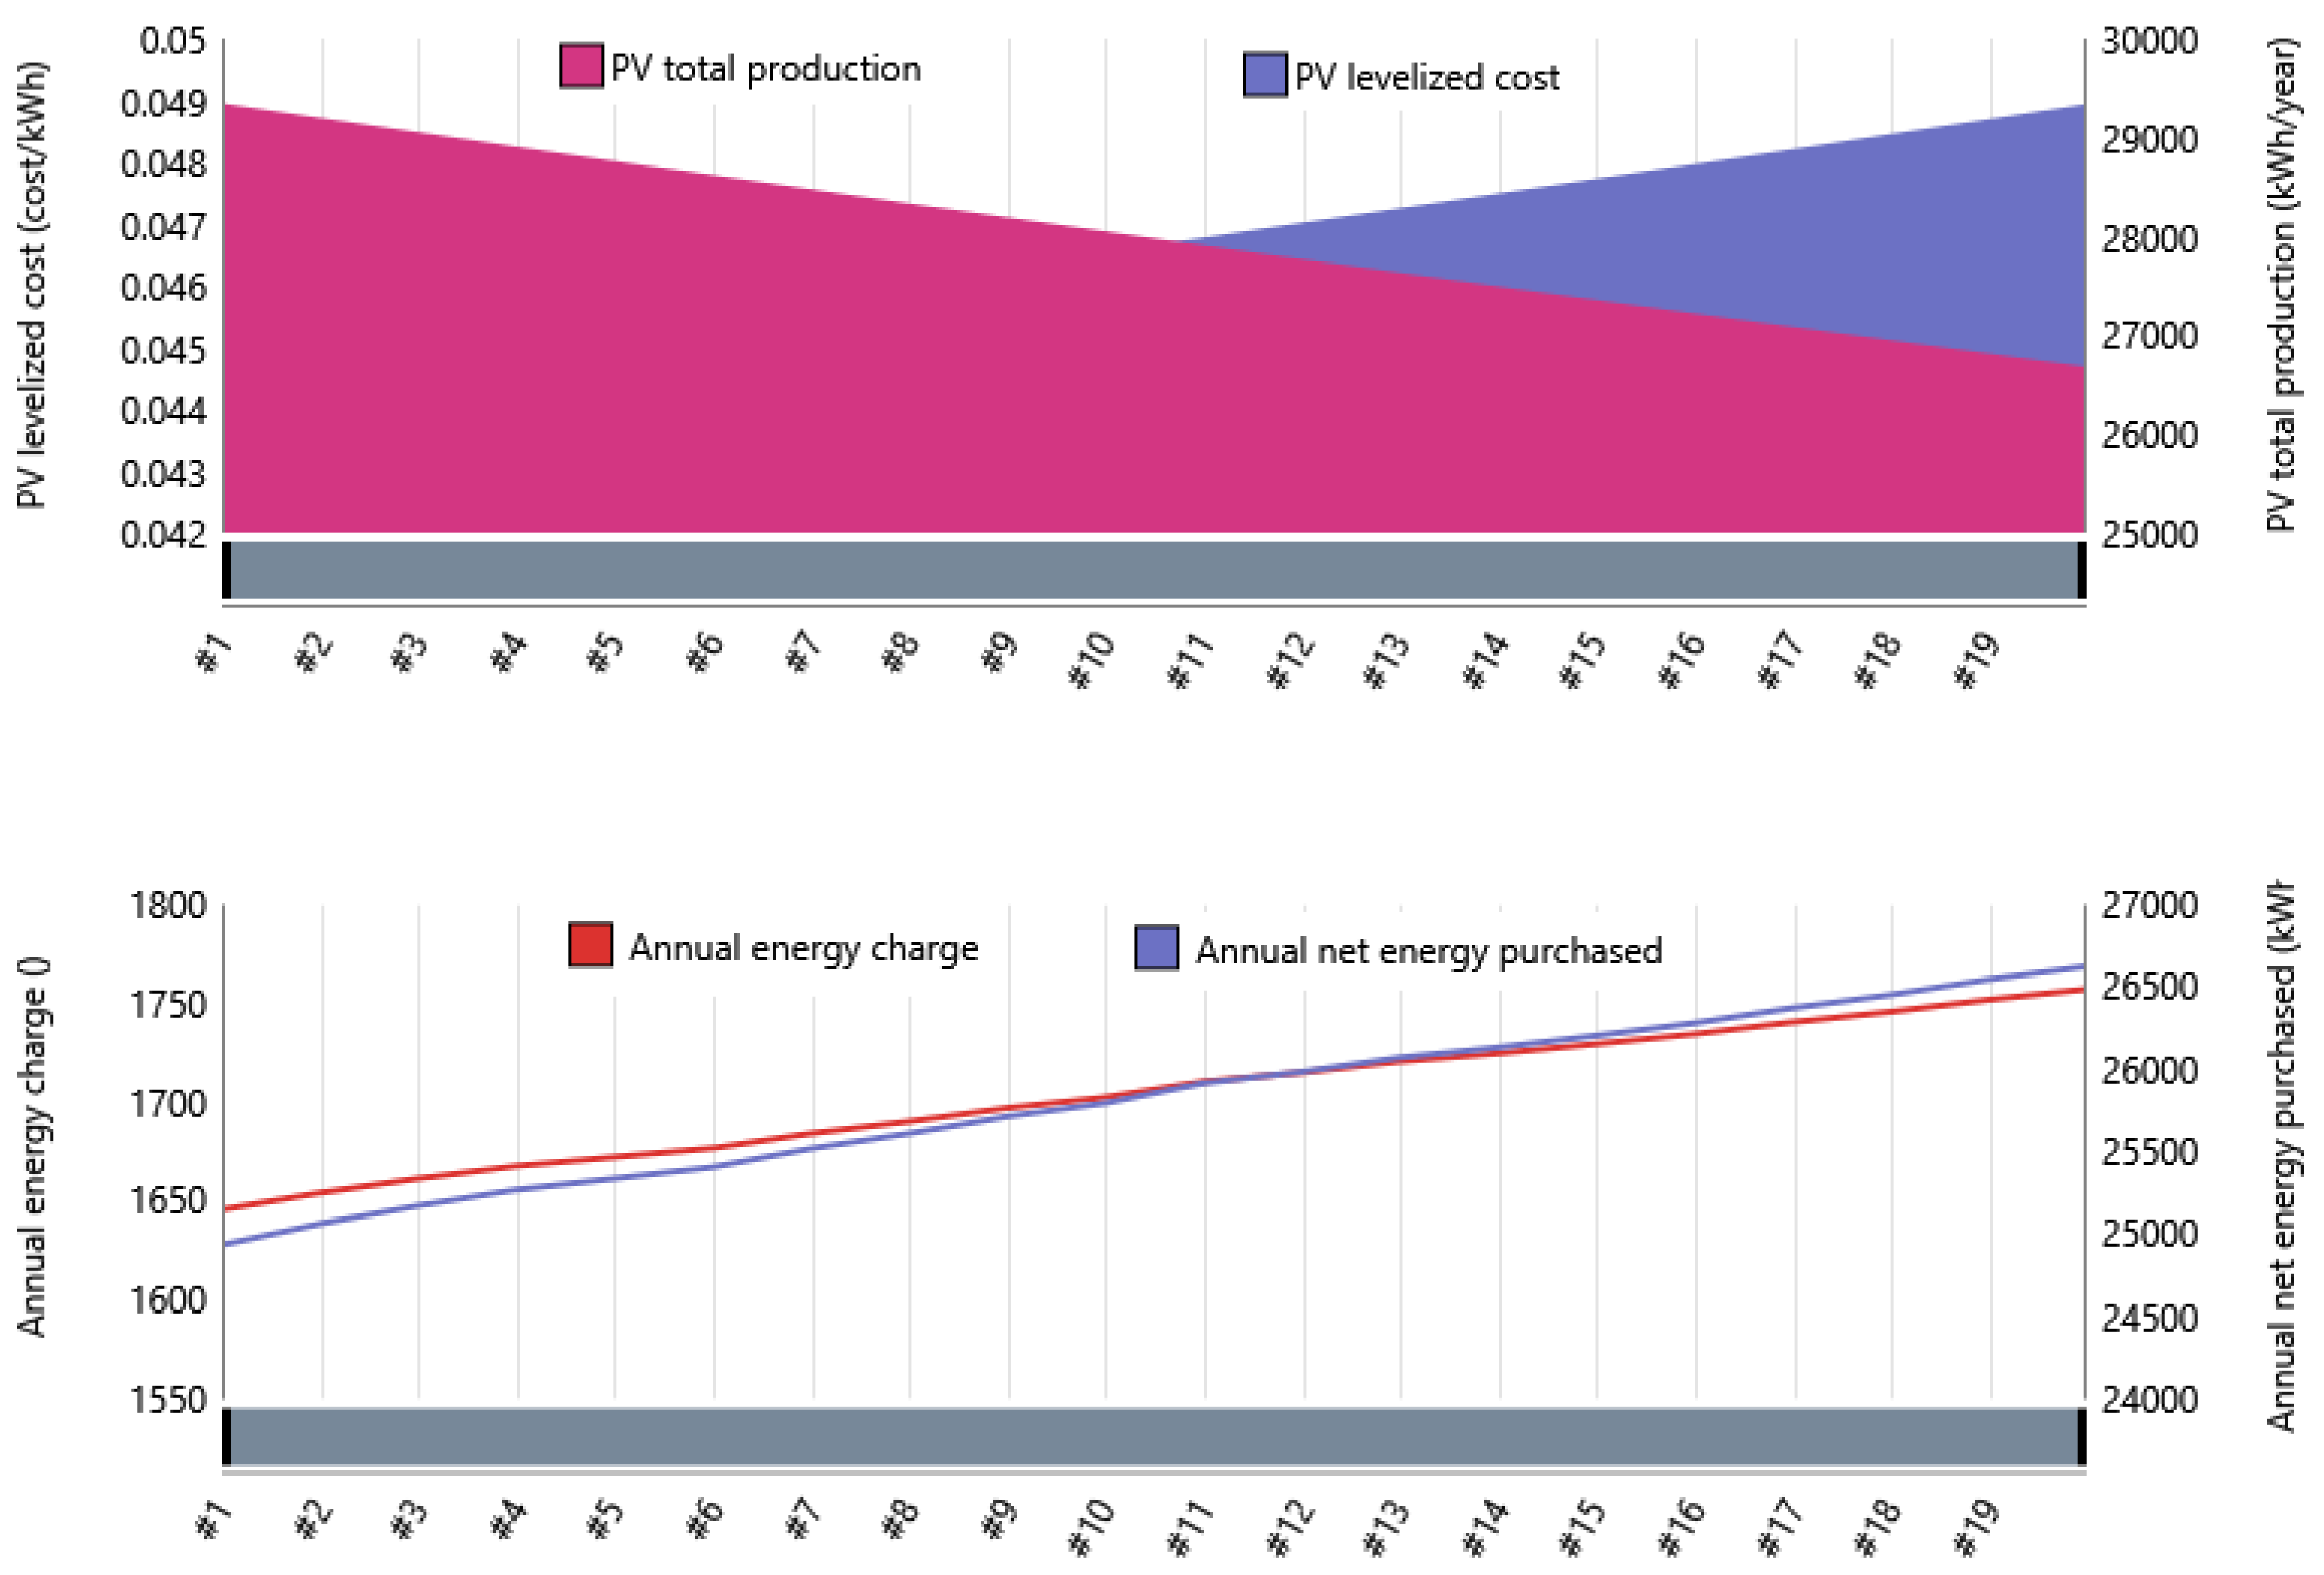
3.3. Impact of Degradation on PV Systems
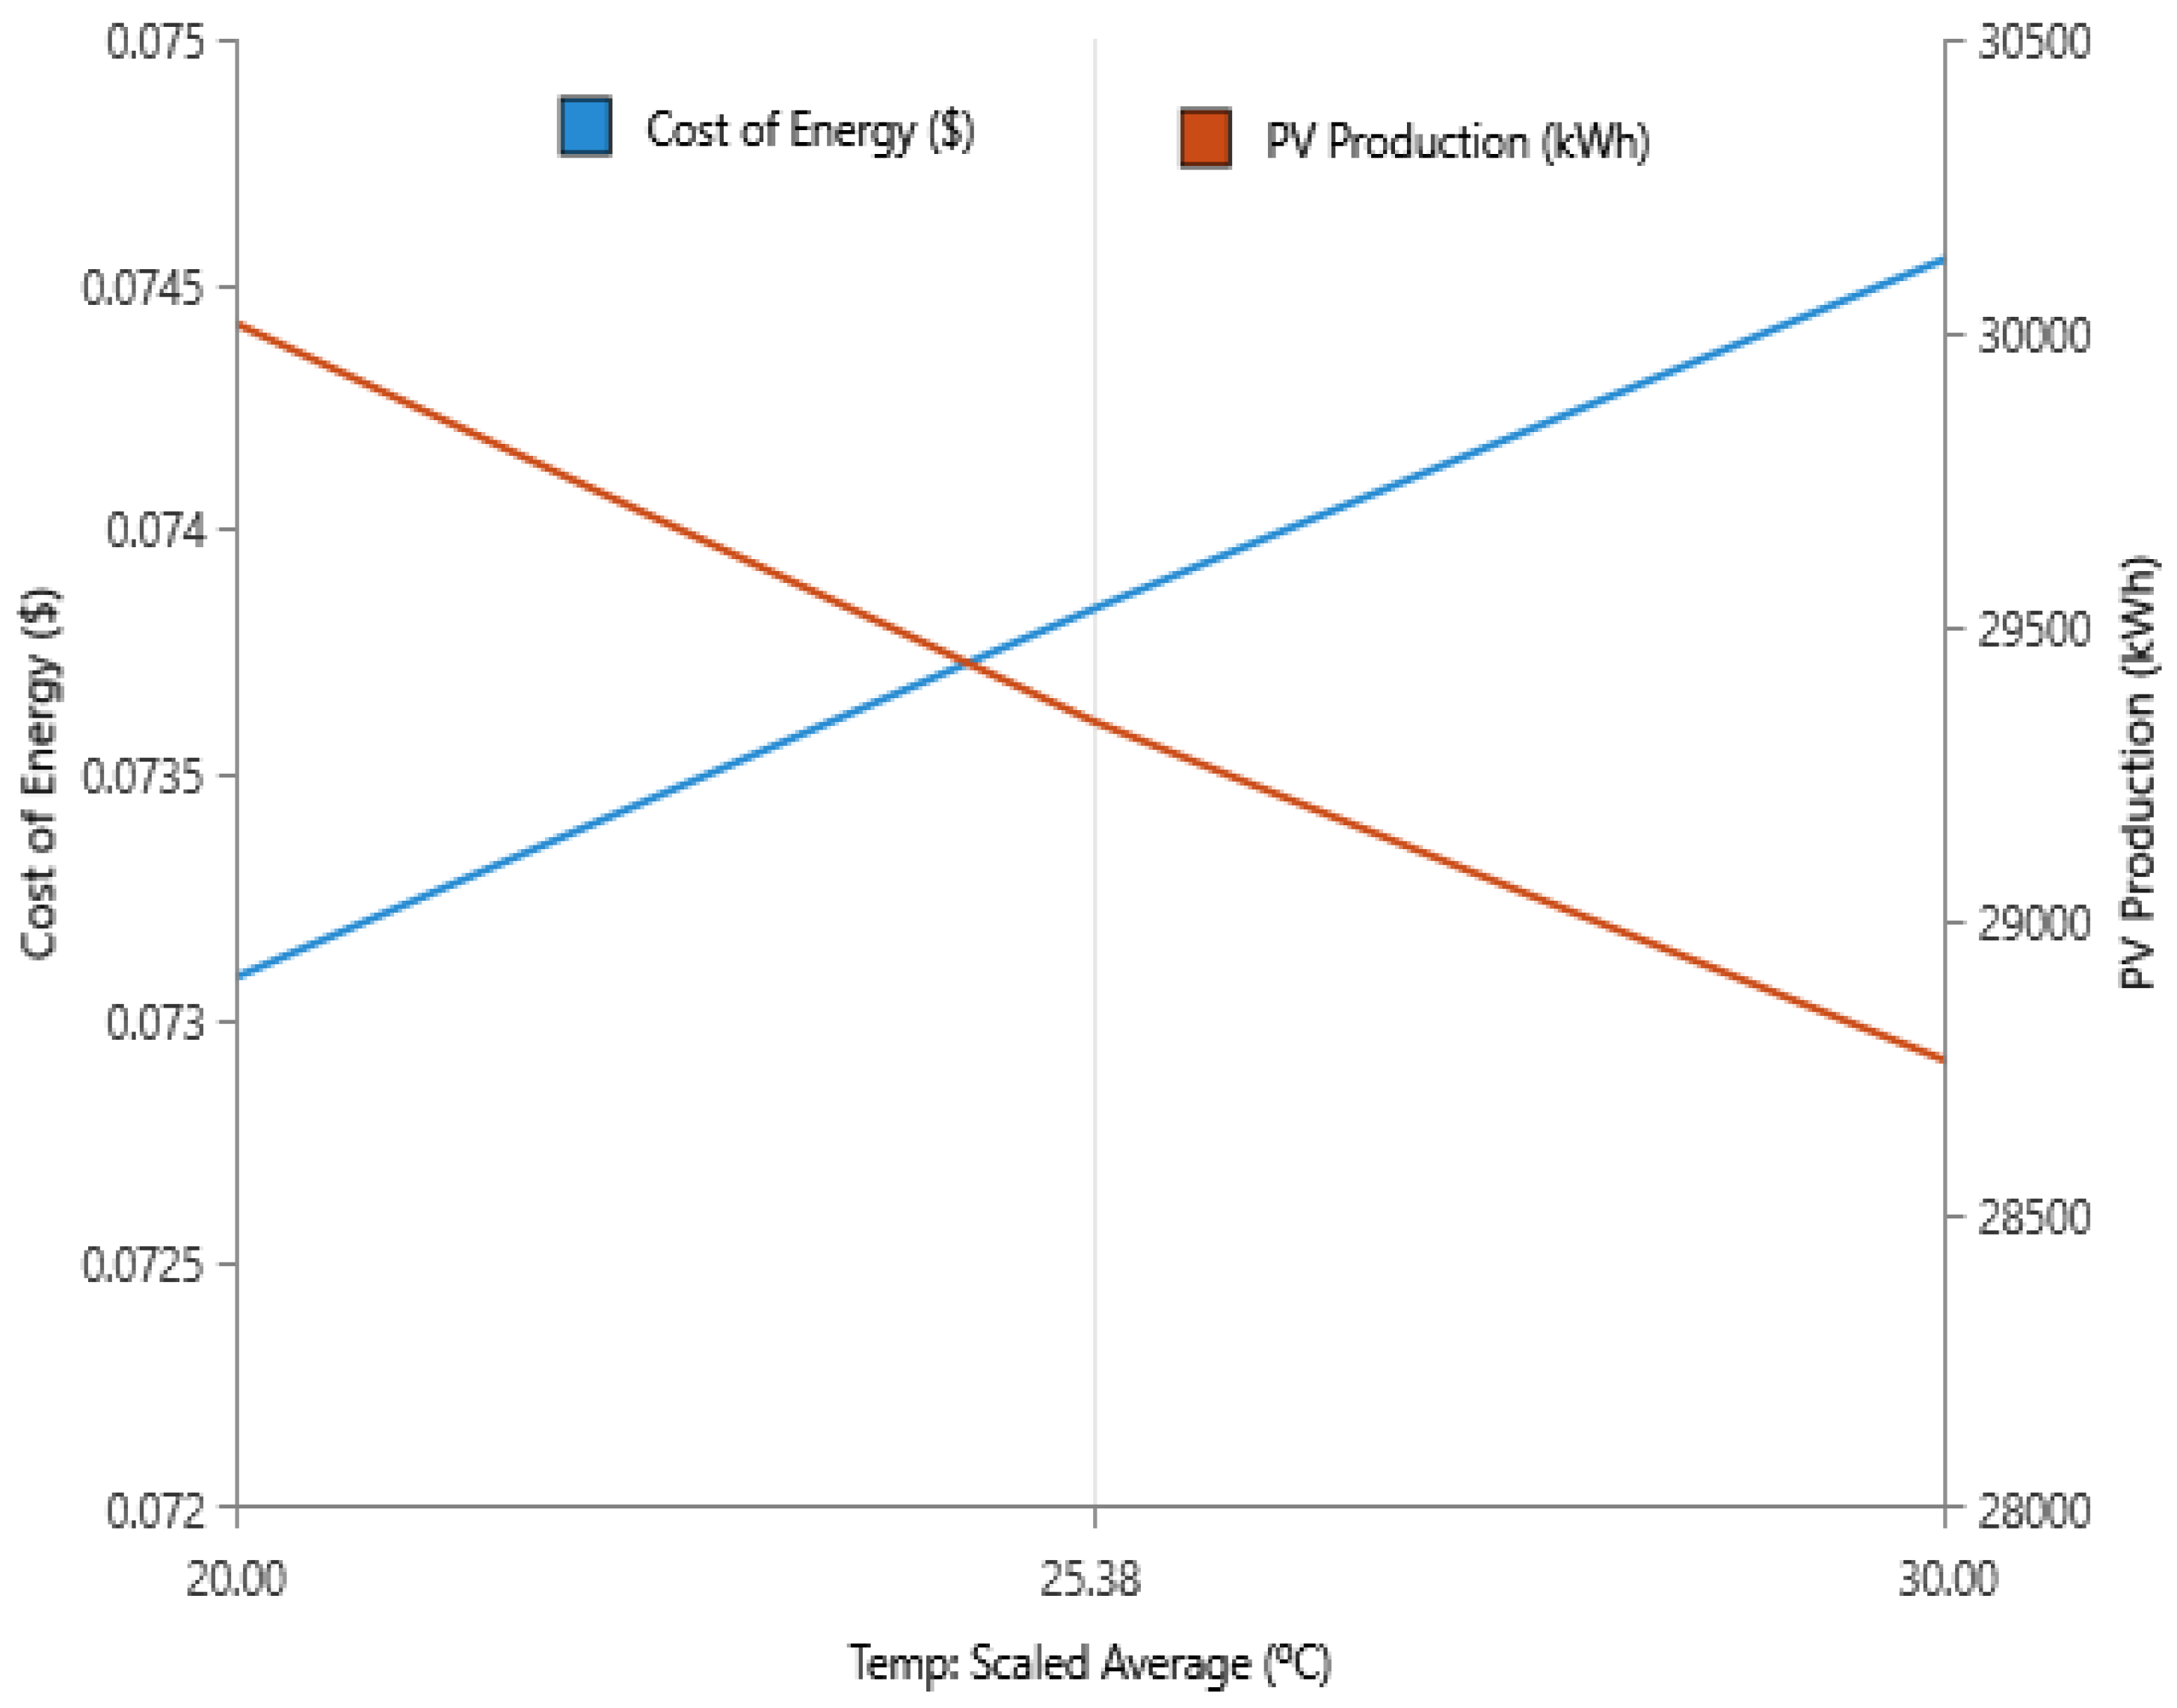
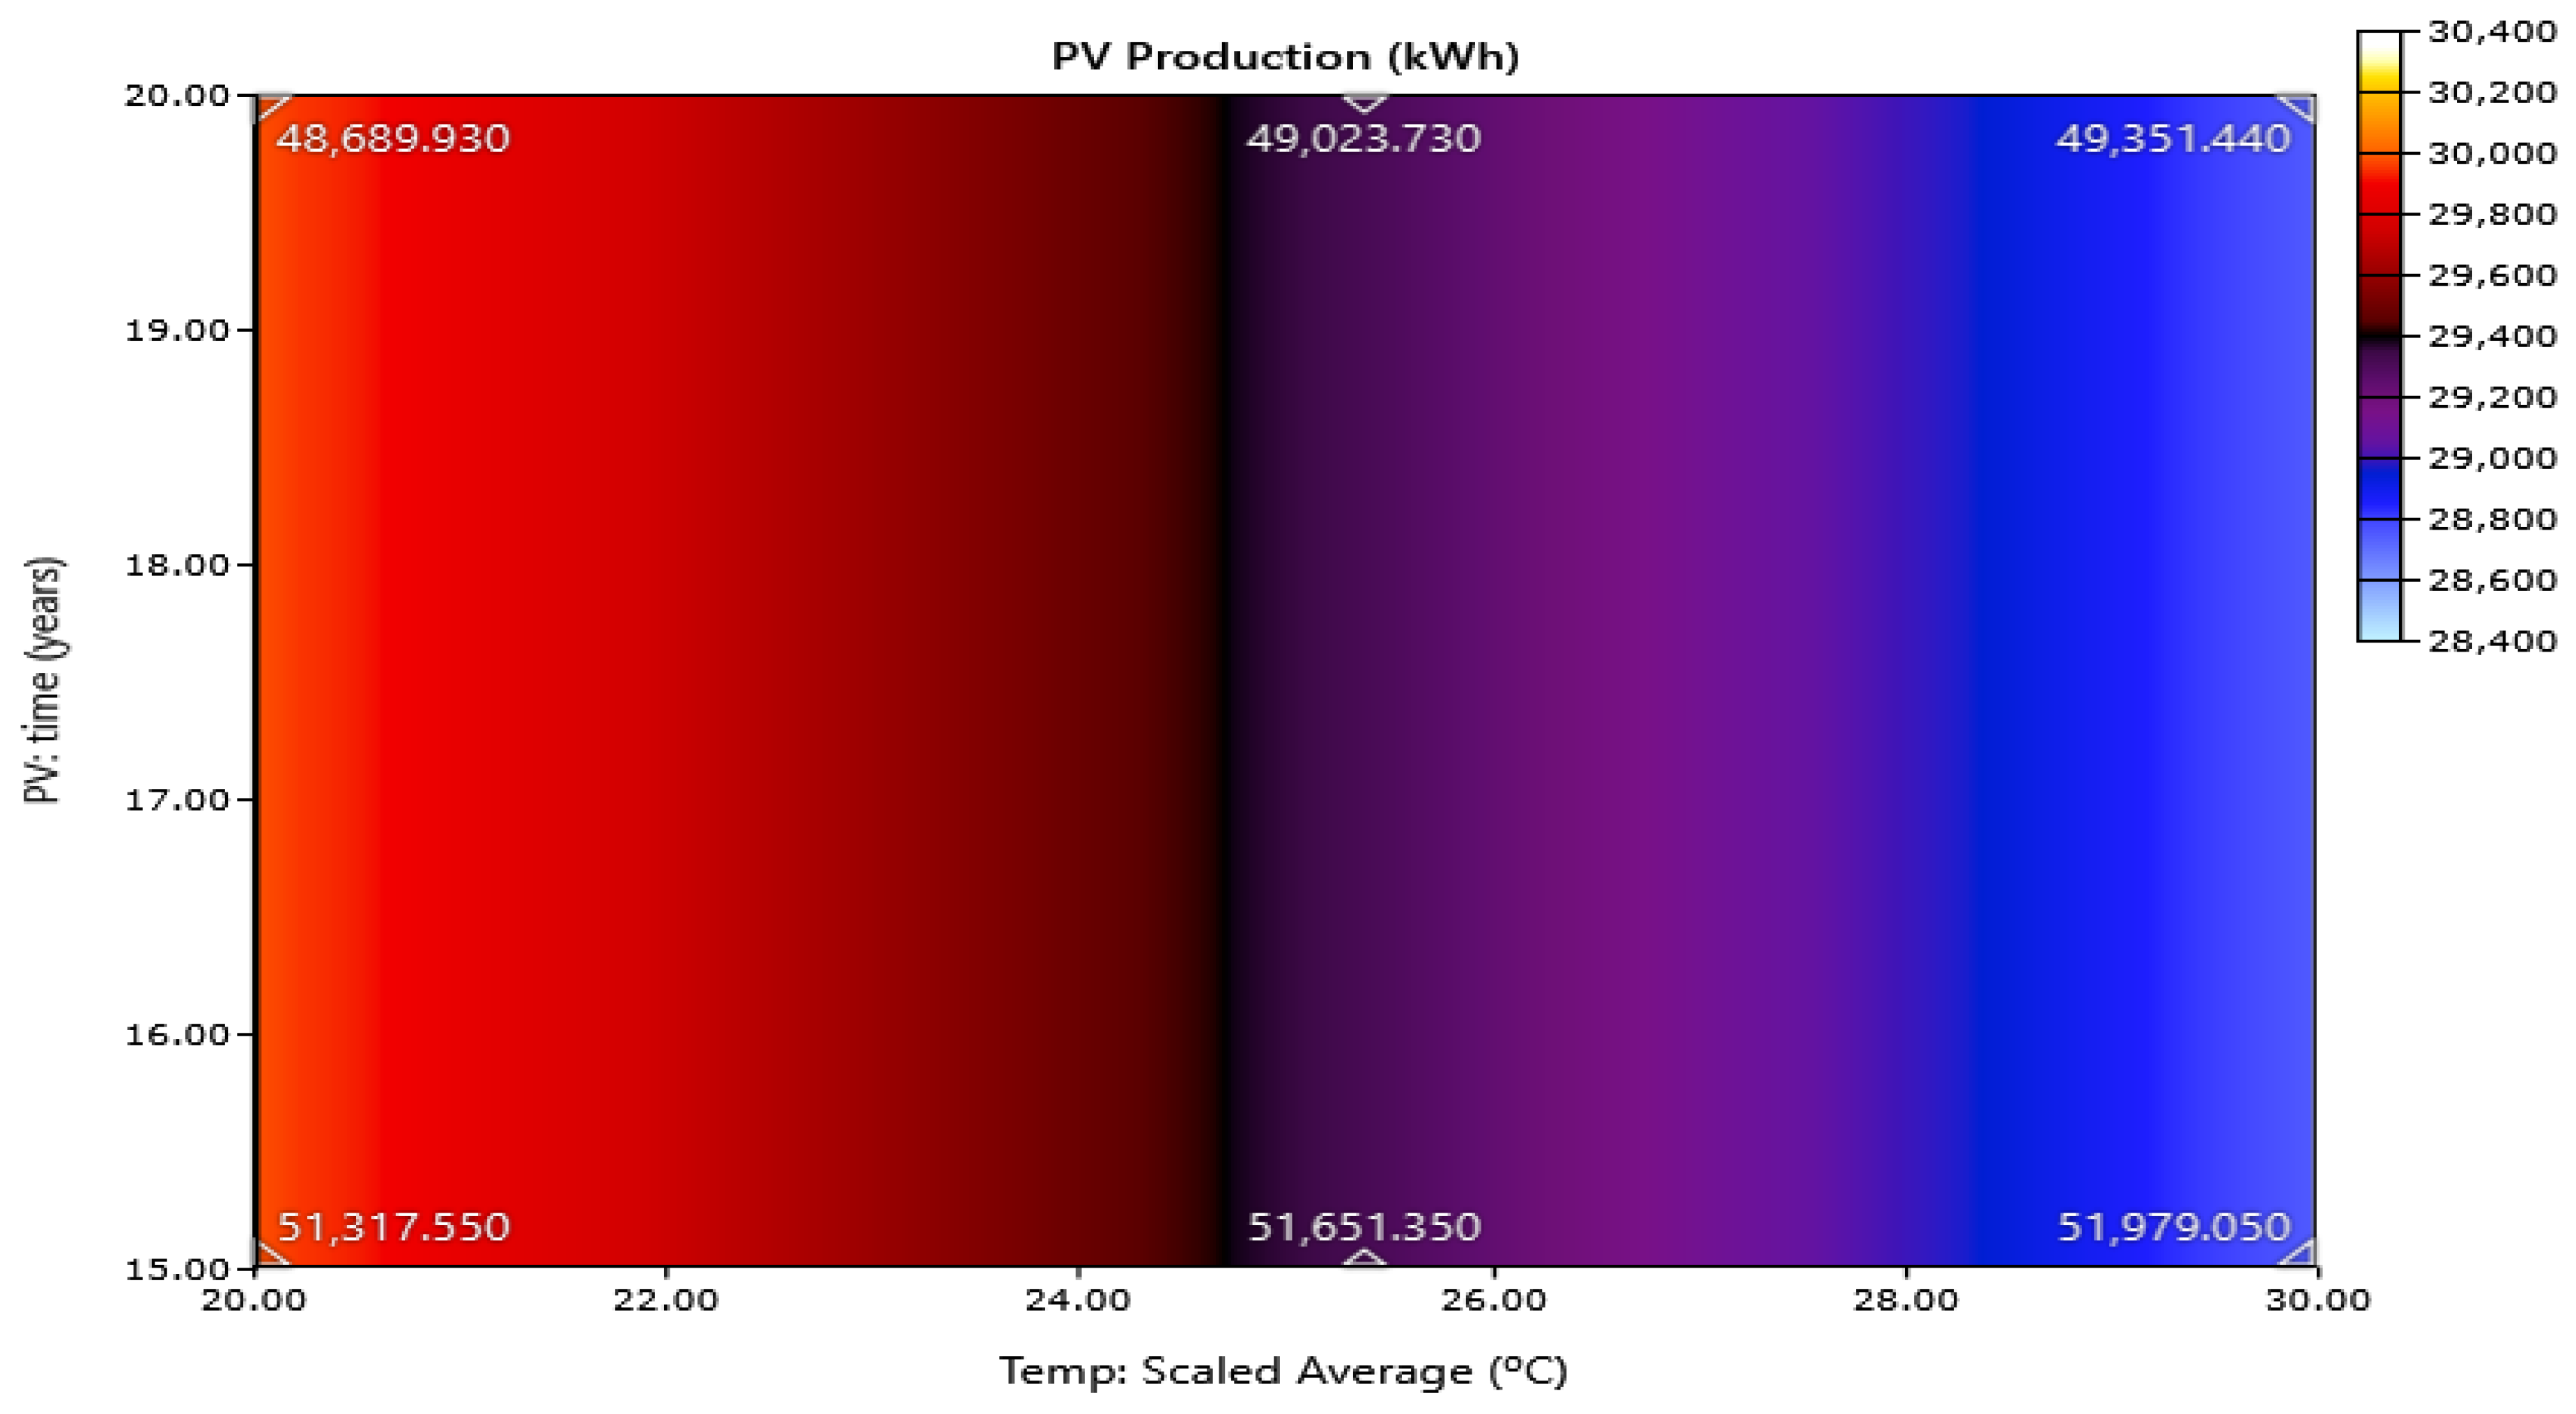
3.4. Impact of Ambient Temperature
4. Conclusions and Future Works
Supplementary Materials
Author Contributions
Funding
Institutional Review Board Statement
Informed Consent Statement
Data Availability Statement
Conflicts of Interest
References
- Renewables Global Status Report—REN21. 2019. Available online: https://www.ren21.net/reports/global-status-report/ (accessed on 6 September 2020).
- Future of Solar Photovoltaic—IRENA. 2019. Available online: https://www.irena.org/-/media/Files/IRENA/Agency/Publication/2019/Nov/IRENA_Future_of_Solar_PV_2019.pdf (accessed on 8 October 2020).
- Dobos, A.P. PVWatts Version 5 Manual; Technical Report; National Renewable Energy Lab. (NREL): Golden, CO, USA, 2014.
- Marion, B.; Adelstein, J.; Boyle, K.; Hayden, H.; Hammond, B.; Fletcher, T.; Canada, B.; Narang, D.; Kimber, A.; Mitchell, L.; et al. Performance Parameters for Grid-Connected PV Systems. In Proceedings of the Conference Record of the Thirty-first IEEE Photovoltaic Specialists Conference, Lake Buena Vista, FL, USA, 3–7 January 2005. [Google Scholar] [CrossRef] [Green Version]
- Lau, K.Y.; Tan, C.W.; Yatim, A.H.M. Effects of ambient temperatures, tilt angles, and orientations on hybrid photovoltaic/diesel systems under equatorial climates. Renew. Sustain. Energy Rev. 2018, 81, 2625–2636. [Google Scholar] [CrossRef]
- Ullah, A.; Imran, H.; Maqsood, Z.; Butt, N.Z. Investigation of optimal tilt angles and effects of soiling on PV energy production in Pakistan. Renew. Energy 2019, 139, 830–843. [Google Scholar] [CrossRef]
- Yerli, B.; Kaymak, M.K.; İzgi, E.; Öztopal, A.; Şahin, A.D. Effect of derating factors on photovoltaics under climatic conditions of Istanbul. World Acad. Sci. Eng. Technol. 2010, 44, 1400–1404. [Google Scholar]
- Appels, R.; Lefevre, B.; Herteleer, B.; Goverde, H.; Beerten, A.; Paesen, R.; De Medts, K.; Driesen, J.; Poortmans, J. Effect of soiling on photovoltaic modules. Sol. Energy 2013, 96, 283–291. [Google Scholar] [CrossRef]
- Cordero, R.R.; Damiani, A.; Laroze, D.; MacDonell, S.; Jorquera, J.; Sepúlveda, E.; Feron, S.; Llanillo, P.; Labbe, F.; Carrasco, J.; et al. Effects of soiling on photovoltaic (PV) modules in the Atacama Desert. Sci. Rep. 2018, 8, 1–14. [Google Scholar] [CrossRef] [Green Version]
- Lopez-Garcia, J.; Pozza, A.; Sample, T. Long-term soiling of silicon PV modules in a moderate subtropical climate. Sol. Energy 2016, 130, 174–183. [Google Scholar] [CrossRef]
- Maghami, M.R.; Hizam, H.; Gomes, C.; Radzi, M.A.; Rezadad, M.I.; Hajighorbani, S. Power loss due to soiling on solar panel: A review. Renew. Sustain. Energy Rev. 2016, 59, 1307–1316. [Google Scholar] [CrossRef] [Green Version]
- Hocine, L.; Mounia Samira, K. Optimal PV panel’s end-life assessment based on the supervision of their own aging evolution and waste management forecasting. Sol. Energy 2019, 191, 227–234. [Google Scholar] [CrossRef]
- Rahman, M.M.; Islam, M.A.; Karim, A.H.M.Z.; Ronee, A.H. Effects of Natural Dust on the Performance of PV Panels in Bangladesh. 2019. Available online: http://www.mecs-press.org/ijmecs/ijmecs-v4-n10/v4n10-4.html (accessed on 16 November 2019).
- Al Garni, H.Z.; Awasthi, A.; Ramli, M.A.M. Optimal design and analysis of grid-connected photovoltaic under different tracking systems using HOMER. Energy Convers. Manag. 2018, 155, 42–57. [Google Scholar] [CrossRef]
- Shabani, M.; Mahmoudimehr, J. Techno-economic role of PV tracking technology in a hybrid PV-hydroelectric standalone power system. Appl. Energy 2018, 212, 84–108. [Google Scholar] [CrossRef]
- Ilse, K.; Micheli, L.; Figgis, B.W.; Lange, K.; Daßler, D.; Hanifi, H.; Wolfertstetter, F.; Naumann, V.; Hagendorf, C.; Gottschalg, R.; et al. Techno-Economic Assessment of Soiling Losses and Mitigation Strategies for Solar Power Generation. Joule 2019, 3, 2303–2321. [Google Scholar] [CrossRef] [Green Version]
- Song, Z.; McElvany, C.L.; Phillips, A.B.; Celik, I.; Krantz, P.W.; Watthage, S.C.; Liyanage, G.K.; Apul, D.; Heben, M.J. A technoeconomic analysis of perovskite solar module manufacturing with low-cost materials and techniques. Energy Environ. Sci. 2017, 10, 1297–1305. [Google Scholar] [CrossRef]
- Sinha, S.; Chandel, S.S. Analysis of fixed tilt and sun tracking photovoltaic–micro wind based hybrid power systems. Energy Convers. Manag. 2016, 115, 265–275. [Google Scholar] [CrossRef]
- Quansah, D.A.; Adaramola, M.S. Ageing and degradation in solar photovoltaic modules installed in northern Ghana. Sol. Energy 2018, 173, 834–847. [Google Scholar] [CrossRef]
- Tanesab, J.; Parlevliet, D.; Whale, J.; Urmee, T. Energy and economic losses caused by dust on residential photovoltaic (PV) systems deployed in different climate areas. Renew. Energy 2018, 120, 401–412. [Google Scholar] [CrossRef]
- You, S.; Lim, Y.J.; Dai, Y.; Wang, C.H. On the temporal modelling of solar photovoltaic soiling: Energy and economic impacts in seven cities. Appl. Energy 2018, 228, 1136–1146. [Google Scholar] [CrossRef] [Green Version]
- Micheli, L.; Fernández, E.F.; Aguilera, J.T.; Almonacid, F. Economics of seasonal photovoltaic soiling and cleaning optimization scenarios. Energy 2021, 215, 119018. [Google Scholar] [CrossRef]
- Malvoni, M.; Kumar, N.M.; Chopra, S.S.; Hatziargyriou, N. Performance and degradation assessment of large-scale grid-connected solar photovoltaic power plant in tropical semi-arid environment of India. Sol. Energy 2020, 203, 101–113. [Google Scholar] [CrossRef]
- Limmanee, A.; Songtrai, S.; Udomdachanut, N.; Kaewniyompanit, S.; Sato, Y.; Nakaishi, M.; Kittisontirak, S.; Sriprapha, K.; Sakamoto, Y. Degradation analysis of photovoltaic modules under tropical climatic conditions and its impacts on LCOE. Renew. Energy 2017, 102, 199–204. [Google Scholar] [CrossRef]
- Jordan, D.C.; Kurtz, S.R.; VanSant, K.; Newmiller, J. Compendium of photovoltaic degradation rates. Prog. Photovoltaics Res. Appl. 2016, 24, 978–989. [Google Scholar] [CrossRef]
- Theristis, M.; Livera, A.; Jones, C.B.; Makrides, G.; Georghiou, G.E.; Stein, J.S. Nonlinear Photovoltaic Degradation Rates: Modeling and Comparison Against Conventional Methods. IEEE J. Photovoltaics 2020, 10, 1112–1118. [Google Scholar] [CrossRef]
- Micheli, L.; Theristis, M.; Talavera, D.L.; Almonacid, F.; Stein, J.S.; Fernández, E.F. Photovoltaic cleaning frequency optimization under different degradation rate patterns. Renew. Energy 2020, 166, 136–146. [Google Scholar] [CrossRef]
- California Energy Commission. A guide to photovoltaic (PV) system design and installation. Endecon Eng. 2001, 347, 4–10. [Google Scholar]
- Enphase Microinverters|Enphase Microinverter Solar Systems Geelong. 2020. Available online: https://enphase.com/en-in (accessed on 12 September 2020).
- Alam Hossain Mondal, Md.; Sadrul Islam, A.K.M. Potential and viability of grid-connected solar PV system in Bangladesh. Renew. Energy 2011, 36, 1869–1874. [Google Scholar] [CrossRef]
- Islam, A.; Shima, F.A.; Khanam, A. Analysis of grid connected solar PV system in the southeastern part of Bangladesh. Appl. Sol. Energy 2013, 49, 116–123. [Google Scholar] [CrossRef]
- Shuvho, M.B.A.; Chowdhury, M.A.; Ahmed, S.; Kashem, M.A. Prediction of solar irradiation and performance evaluation of grid connected solar 80KWp PV plant in Bangladesh. Energy Rep. 2019, 5, 714–722. [Google Scholar] [CrossRef]
- Sarkar, Md.N.I.; Ghosh, H.R. Techno-economic analysis and challenges of solar powered pumps dissemination in Bangladesh. Sustain. Energy Technol. Assess. 2017, 20, 33–46. [Google Scholar] [CrossRef]
- Li, C.; Ge, X.; Zheng, Y.; Xu, C.; Ren, Y.; Song, C.; Yang, C. Techno-economic feasibility study of autonomous hybrid wind/PV/battery power system for a household in Urumqi, China. Energy 2013, 55, 263–272. [Google Scholar] [CrossRef]
- Kumar, N.M.; Vishnupriyan, J.; Sundaramoorthi, P. Techno-economic optimization and real-time comparison of sun tracking photovoltaic system for rural healthcare building. J. Renew. Sustain. Energy 2019, 11, 015301. [Google Scholar] [CrossRef]
- Vishnupriyan, J.; Manoharan, P.S. Prospects of hybrid photovoltaic–diesel standalone system for six different climate locations in Indian state of Tamil Nadu. J. Clean. Prod. 2018, 185, 309–321. [Google Scholar] [CrossRef]
- Khatib, T.; Mohamed, A.; Sopian, K. Optimization of a PV/wind micro-grid for rural housing electrification using a hybrid iterative/genetic algorithm: Case study of Kuala Terengganu, Malaysia. Energy Build. 2012, 47, 321–331. [Google Scholar] [CrossRef]
- Sharma, H.; Mishra, S. Techno-economic analysis of solar grid-based virtual power plant in Indian power sector: A case study. Int. Trans. Electr. Energy Syst. 2019, 30, e12177. [Google Scholar] [CrossRef]
- Jung, J.; Villaran, M. Optimal planning and design of hybrid renewable energy systems for microgrids. Renew. Sustain. Energy Rev. 2017, 75, 180–191. [Google Scholar] [CrossRef]
- Guinot, B.; Champel, B.; Montignac, F.; Lemaire, E.; Vannucci, D.; Sailler, S.; Bultel, Y. Techno-economic study of a PV-hydrogen-battery hybrid system for off-grid power supply: Impact of performances’ aging on optimal system sizing and competitiveness. Int. J. Hydrogen Energy 2015, 40, 623–632. [Google Scholar] [CrossRef]
- Hossain, M.; Mekhilef, S.; Olatomiwa, L. Performance evaluation of a stand-alone PV-wind-diesel-battery hybrid system feasible for a large resort center in South China Sea, Malaysia. Sustain. Cities Soc. 2017, 28, 358–366. [Google Scholar] [CrossRef]
- Abdilahi, A.M.; Mohd Yatim, A.H.; Mustafa, M.W.; Khalaf, O.T.; Shumran, A.F.; Mohamed Nor, F. Feasibility study of renewable energy-based microgrid system in xn–Somalilands-uxn urban centers. Renew. Sustain. Energy Rev. 2014, 40, 1048–1059. [Google Scholar] [CrossRef]
- Mao, M.; Jin, P.; Chang, L.; Xu, H. Economic Analysis and Optimal Design on Microgrids With SS-PVs for Industries. IEEE Trans. Sustain. Energy 2014, 5, 1328–1336. [Google Scholar] [CrossRef]
- Ishaque, K.; Salam, Z.; Amjad, M.; Mekhilef, S. An Improved Particle Swarm Optimization (PSO)–Based MPPT for PV With Reduced Steady-State Oscillation. IEEE Trans. Power Electron. 2012, 27, 3627–3638. [Google Scholar] [CrossRef]
- Kaur, R.; Krishnasamy, V.; Kandasamy, N.K. Optimal sizing of wind–PV-based DC microgrid for telecom power supply in remote areas. IET Renew. Power Gener. 2018, 12, 859–866. [Google Scholar] [CrossRef]
- Kornelakis, A.; Koutroulis, E. Methodology for the design optimisation and the economic analysis of grid-connected photovoltaic systems. IET Renew. Power Gener. 2009, 3, 476–492. [Google Scholar] [CrossRef]
- Ma, W.; Fan, J.; Fang, S.; Liu, G. Techno-economic potential evaluation of small-scale grid-connected renewable power systems in China. Energy Convers. Manag. 2019, 196, 430–442. [Google Scholar] [CrossRef]
- Sinha, S.; Chandel, S.S. Review of software tools for hybrid renewable energy systems. Renew. Sustain. Energy Rev. 2014, 32, 192–205. [Google Scholar] [CrossRef]
- Masrur, H.; Howlader, H.O.R.; Elsayed Lotfy, M.; Khan, K.R.; Guerrero, J.M.; Senjyu, T. Analysis of Techno-Economic-Environmental Suitability of an Isolated Microgrid System Located in a Remote Island of Bangladesh. Sustainability 2020, 12, 2880. [Google Scholar] [CrossRef] [Green Version]
- Gevorkian, P. Grid-Connected Photovoltaic Power Generation by Peter Gevorkian. Camb. Core 2017, 7–34. [Google Scholar] [CrossRef]
- HOMER Pro User Manual. 2019. Available online: https://www.homerenergy.com/products/pro/docs/3.10/index.html (accessed on 10 December 2019).
- Akinyele, D. Techno-economic design and performance analysis of nanogrid systems for households in energy-poor villages. Sustain. Cities Soc. 2017, 34, 335–357. [Google Scholar] [CrossRef]
- Jordan, D.C.; Kurtz, S.R. Photovoltaic Degradation Rates—an Analytical Review. Prog. Photovoltaics Res. Appl. 2013, 21, 12–29. [Google Scholar] [CrossRef] [Green Version]
- Monocrystalline vs. Polycrystalline Solar Panels|EnergySage. 2020. Available online: https://www.energysage.com/solar/101/monocrystalline-vs-polycrystalline-solar-panels/ (accessed on 2 September 2020).
- Performance Analysis of PV Cells under Monsoon Climate. 2020. Available online: https://www.researchgate.net/publication/331864280_Performance_Analysis_of_PV_Cells_under_Monsoon_Climate (accessed on 4 September 2020).
- Climate Chittagong Division: Temperature, Climate Graph, Climate Table. 2021. Available online: https://en.climate-data.org/asia/bangladesh/chittagong-division-2276/ (accessed on 3 February 2020).
- Yadav, A.K.; Malik, H. Optimization of Tilt Angle for Intercepting Maximum Solar Radiation for Power Generation. In Optimization of Power System Problems; Springer: Berlin/Heidelberg, Germany, 2020; pp. 195–213. [Google Scholar]
- Masrur, H.; Othman, M.L.; Arefin, A.A.; Hizam, H.B.; Wahab, N.I.A.; Islam, S.Z.; Senjyu, T. Determining Optimal Tilt Angle to Maximize the PV Yield. In Proceedings of the 2020 IEEE International Conference on Power and Energy (PECon), Penang, Malaysia, 7–8 December 2020; pp. 219–223. [Google Scholar] [CrossRef]
- NREL-NSRDB Data Viewer. 2019. Available online: https://maps.nrel.gov/nsrdb-viewer/ (accessed on 13 October 2020).
- Chowdhury, N.; Hossain, C.A.; Longo, M.; Yaïci, W. Optimization of Solar Energy System for the Electric Vehicle at University Campus in Dhaka, Bangladesh. Energies 2018, 11, 2433. [Google Scholar] [CrossRef] [Green Version]
- Technical Standards for IDCOL Solar Home Systems Program. 2019. Available online: https://idcol.org/home/downloads (accessed on 14 December 2019).
- Datasheet, Canadian Solar. 2020. Available online: https://www.csisolar.com/downloads/ (accessed on 2 September 2020).
- LEONICS Inverter S-210 Series. 2020. Available online: http://www.leonics.com/product/renewable/inverter/inverter_apollo_s-210_en.php (accessed on 2 October 2020).
- Javed, M.S.; Song, A.; Ma, T. Techno-economic assessment of a stand-alone hybrid solar-wind-battery system for a remote island using genetic algorithm. Energy 2019, 176, 704–717. [Google Scholar] [CrossRef]
- Lambert, T.; Gilman, P.; Lilienthal, P. Micropower system modeling with HOMER. Integr. Altern. Sources Energy 2006, 1, 379–385. [Google Scholar]
- Imam, A.A.; Al-Turki, Y.A. Techno-Economic Feasibility Assessment of Grid-Connected PV Systems for Residential Buildings in Saudi Arabia—A Case Study. Sustainability 2020, 12, 262. [Google Scholar] [CrossRef] [Green Version]


| Loss Parameters | Value (%) |
|---|---|
| Soiling | 2 |
| Shading | 3 |
| Mismatch | 2 |
| Wiring | 2 |
| Connections | 0.5 |
| Light-induced degradation | 1.5 |
| Nameplate rating | 1 |
| Availability | 3 |
| Appliances | Power Rating (W) | Quantity | Daily Usage (Hours) |
|---|---|---|---|
| Lighting | 10 | 3 | 10 |
| Ceiling Fan | 40 | 2 | 18 |
| TV Set | 80 | 1 | 10 |
| Refrigerator | 400 | 1 | 24 |
| Mobile Charger | 4 | 1 | 1.5 |
| Component | Manufacturer (Model) | Size (kW) | Lifetime (Years) | Cost ($) | Technical Parameters | Ref. | |||||||
|---|---|---|---|---|---|---|---|---|---|---|---|---|---|
| Capital | O&M | Replacement | Derating Factor (%) | Panel Type | Ground Reflectance (%) | Temperature Coefficient () | NOCT (%/°C) | Efficiency (%) | |||||
| PV | Canadian Solar (CS6k-MS) | 1 | 20 | 640 | 10 | 640 | 88 | Flat plate | 20 | -0.390 | 45 | 17.72 @ STC | [14,62] |
| Converter | Leonics (S-219Cp) | 1 | 20 | 600 | 10 | 600 | - | - | - | - | - | 96 | [63] |
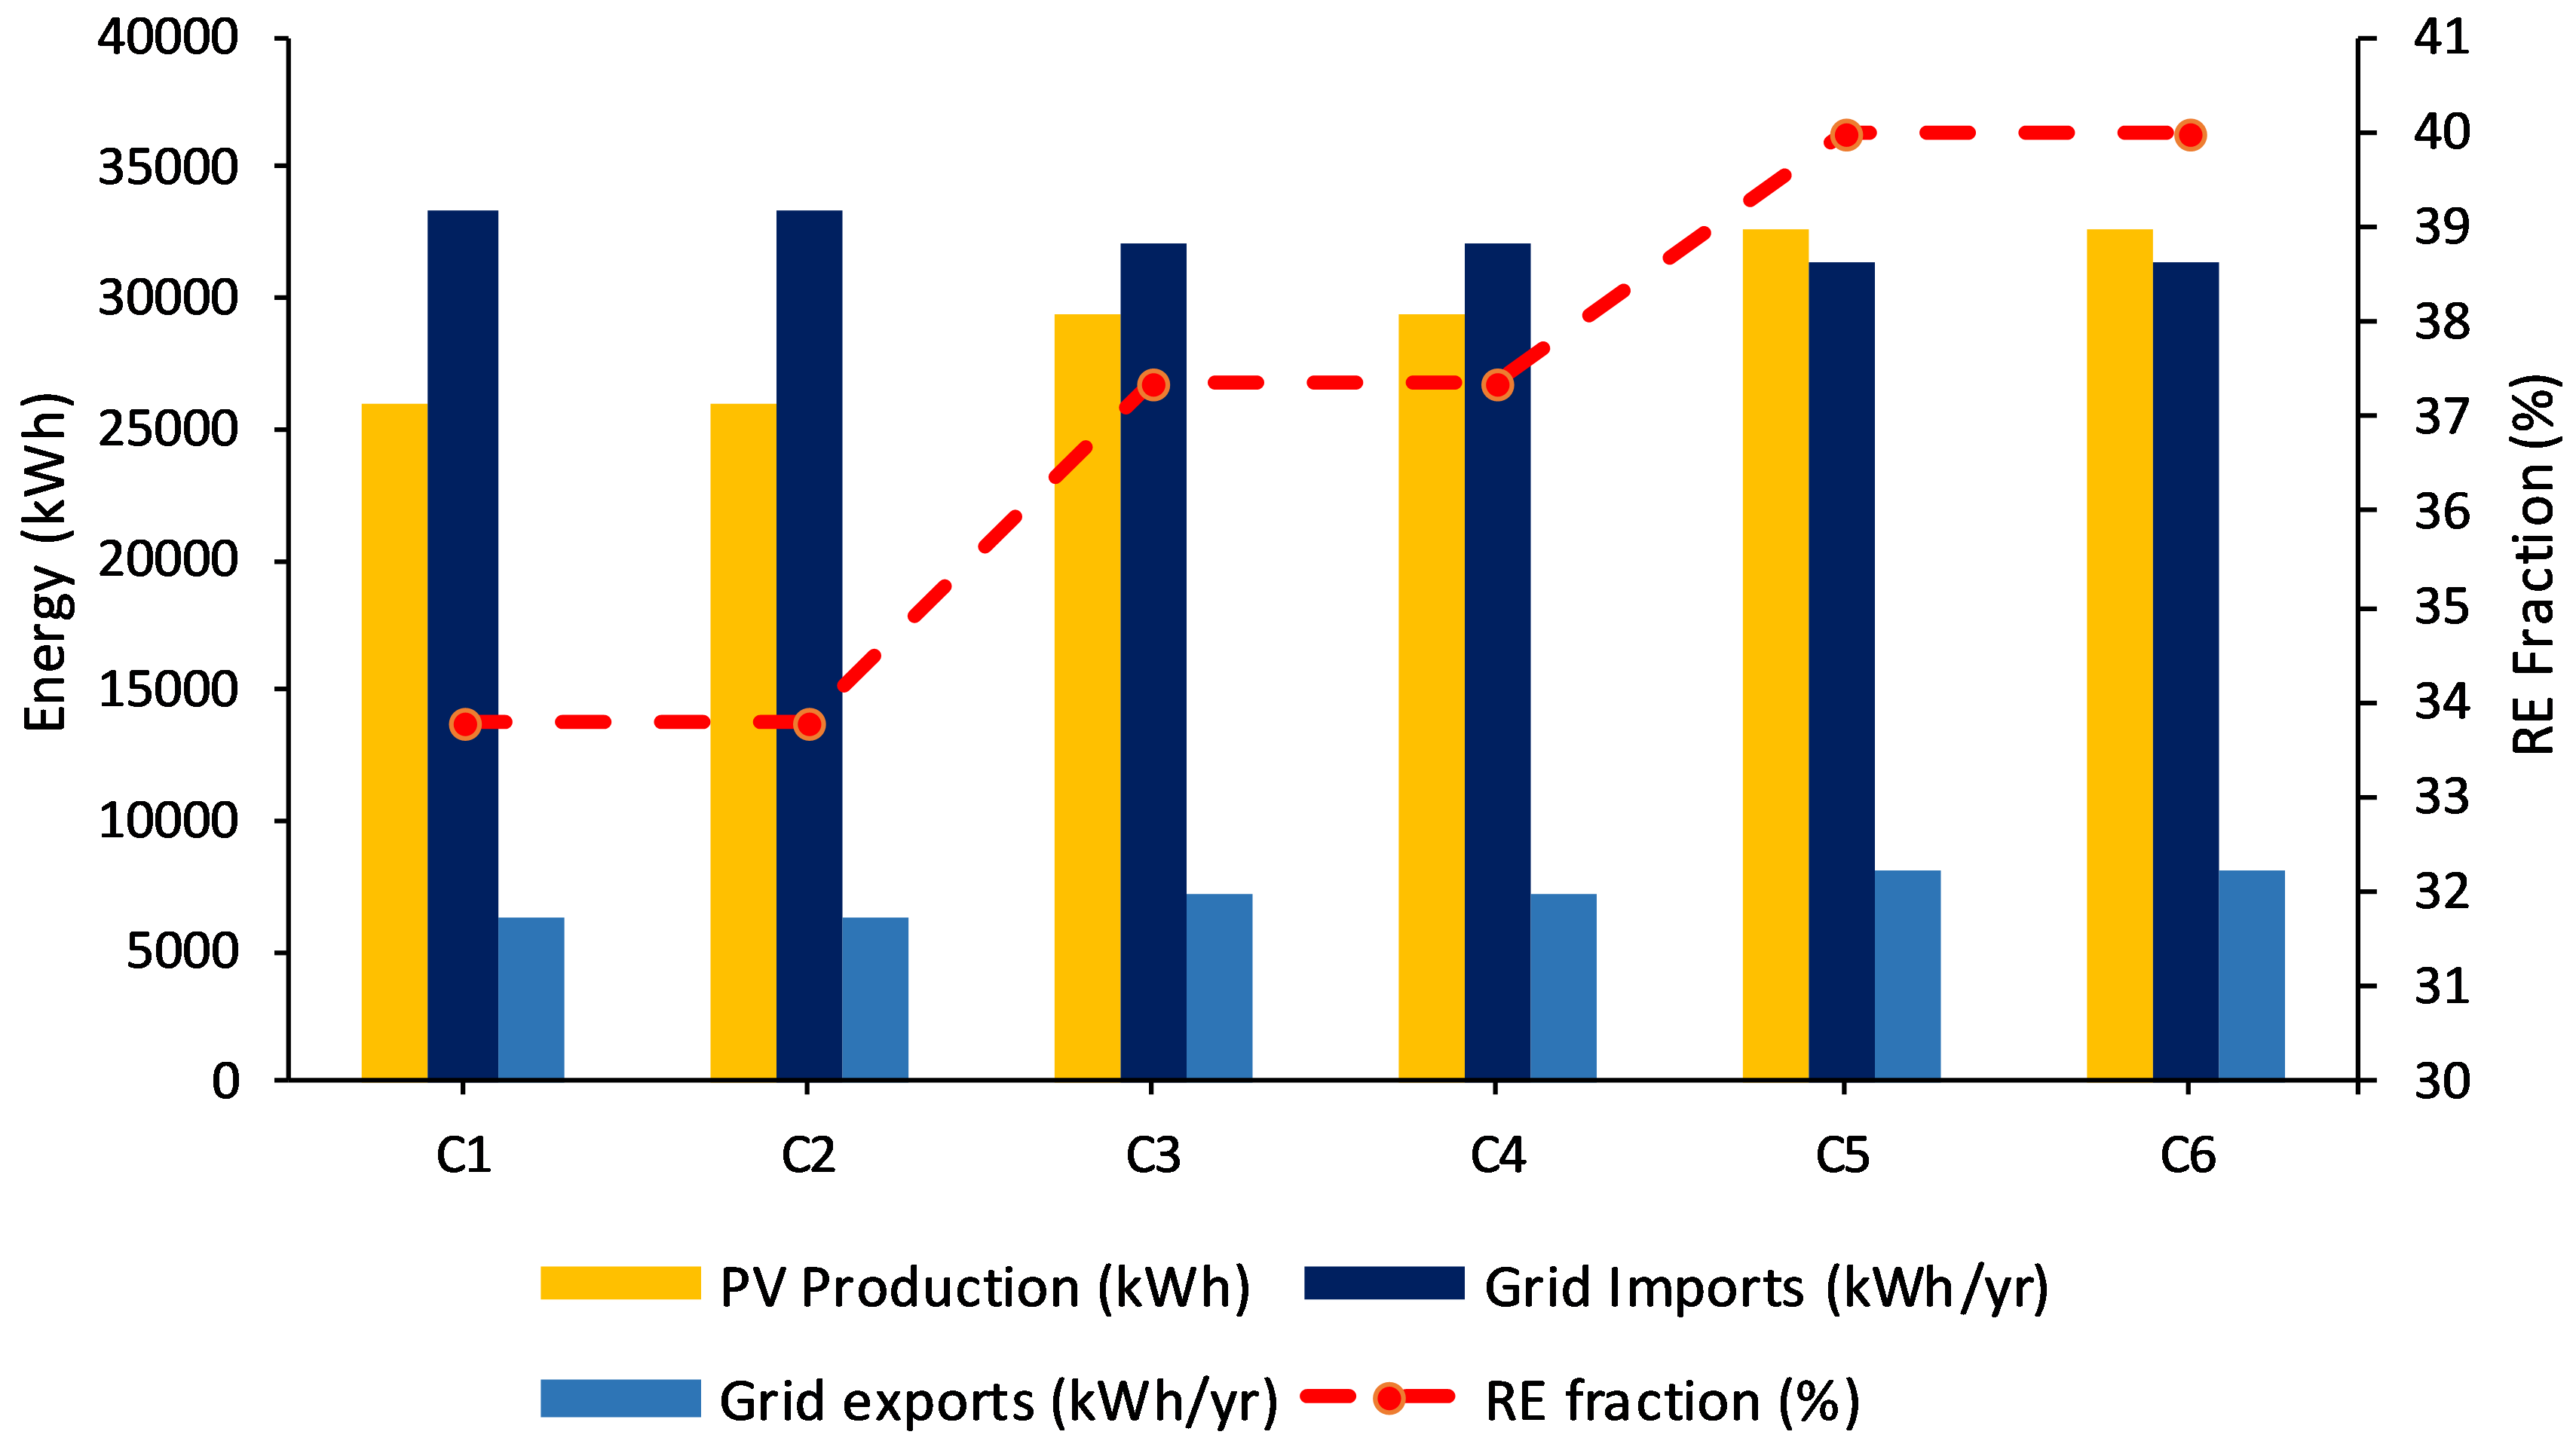
| Config. | PV Production (kWh) | PV Lifetime (Years) | PV Derating (%) | System COE ($) | System NPC ($) | System Operating Cost ($) | RE Fraction (%) | PV Capital Cost ($) | Grid Cost ($) | Grid Imports (kWh) | Grid Exports (kWh) |
|---|---|---|---|---|---|---|---|---|---|---|---|
| C1 | 26,006.54 | 15 | 78 | 0.0821 | 53,503.65 | 2684.479 | 33.769 | 12,800 | 23,127.61 | 33,370.68 | 6264.29 |
| C2 | 26,006.54 | 20 | 78 | 0.0781 | 50,876.04 | 2481.222 | 33.769 | 12,800 | 23,127.61 | 33,370.68 | 6264.29 |
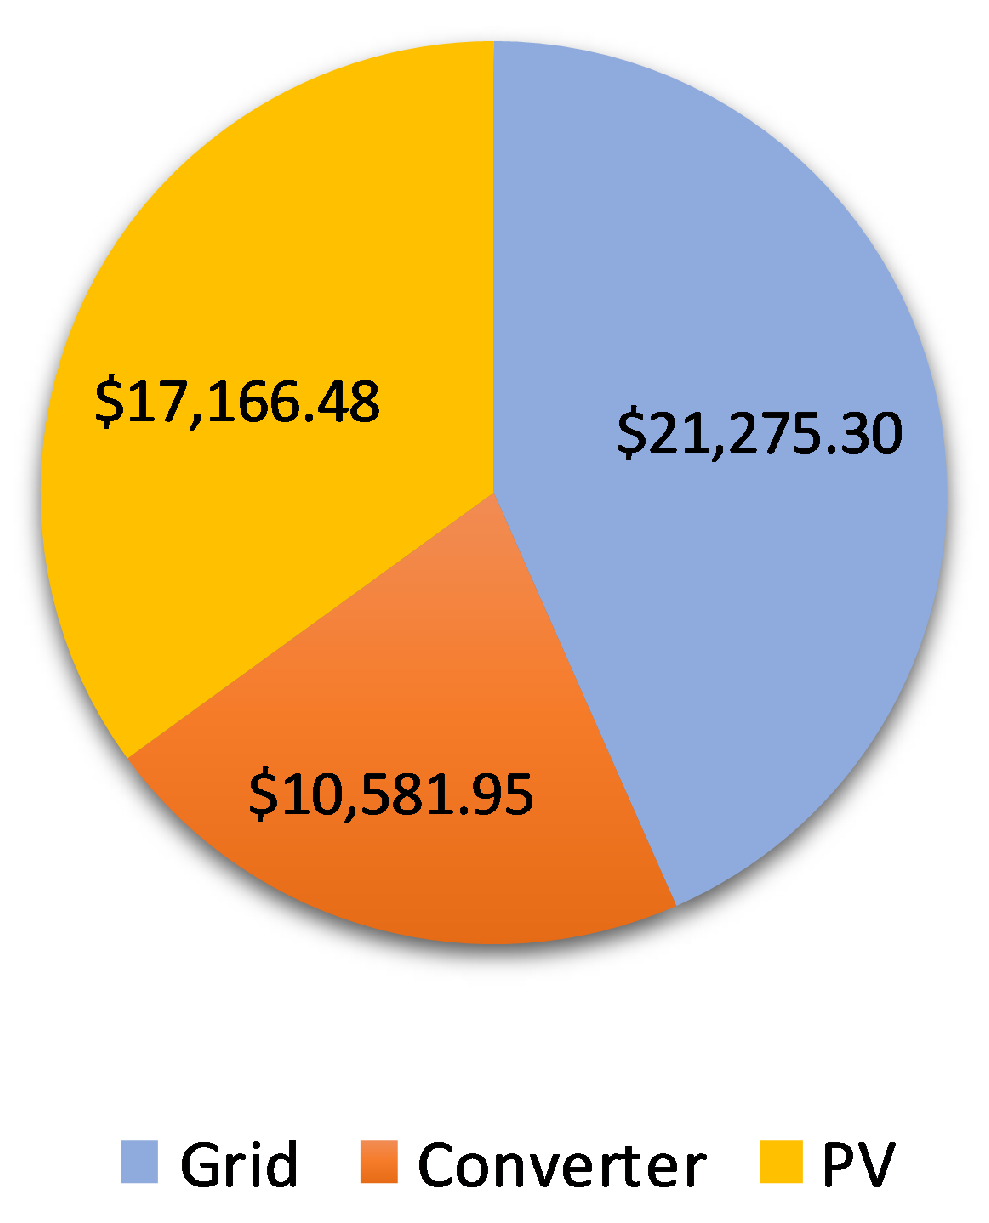
| C3 | 29,340.71 | 15 | 88 | 0.0778 | 51,651.35 | 2541.196 | 37.355 | 12,800 | 21,275.30 | 32,174.84 | 7239.42 |
| C4 | 29,340.71 | 20 | 88 | 0.0738 | 49,023.73 | 2337.938 | 37.355 | 12,800 | 21,275.30 | 32,174.84 | 7239.42 |
| C5 | 32,674.89 | 15 | 98 | 0.0745 | 50,226.79 | 2431 | 39.976 | 12,800 | 19,850.75 | 31,313.18 | 8047.39 |
| C6 | 32,674.89 | 20 | 98 | 0.0706 | 47,599.18 | 2227.743 | 39.976 | 12,800 | 19,850.75 | 31,313.18 | 8047.39 |
Publisher’s Note: MDPI stays neutral with regard to jurisdictional claims in published maps and institutional affiliations. |
© 2021 by the authors. Licensee MDPI, Basel, Switzerland. This article is an open access article distributed under the terms and conditions of the Creative Commons Attribution (CC BY) license (http://creativecommons.org/licenses/by/4.0/).
Share and Cite
Masrur, H.; Konneh, K.V.; Ahmadi, M.; Khan, K.R.; Othman, M.L.; Senjyu, T. Assessing the Techno-Economic Impact of Derating Factors on Optimally Tilted Grid-Tied Photovoltaic Systems. Energies 2021, 14, 1044. https://0-doi-org.brum.beds.ac.uk/10.3390/en14041044
Masrur H, Konneh KV, Ahmadi M, Khan KR, Othman ML, Senjyu T. Assessing the Techno-Economic Impact of Derating Factors on Optimally Tilted Grid-Tied Photovoltaic Systems. Energies. 2021; 14(4):1044. https://0-doi-org.brum.beds.ac.uk/10.3390/en14041044
Chicago/Turabian StyleMasrur, Hasan, Keifa Vamba Konneh, Mikaeel Ahmadi, Kaisar R. Khan, Mohammad Lutfi Othman, and Tomonobu Senjyu. 2021. "Assessing the Techno-Economic Impact of Derating Factors on Optimally Tilted Grid-Tied Photovoltaic Systems" Energies 14, no. 4: 1044. https://0-doi-org.brum.beds.ac.uk/10.3390/en14041044