Article

Comparative Analysis of Reactive Power Compensation Devices in a Real Electric Substation

1
Faculty of Electrical and Control Engineering, Gdańsk University of Technology, Narutowicza 11/12 str., 80-233 Gdańsk, Poland
2
National Transmission and Despatch Company, Lahore 54000, Pakistan
3
Department of Electronic Engineering, Fatima Jinnah Women University, Rawalpindi 46000, Pakistan
4
College of Engineering and Computing, University of South Carolina, Columbia, SC 29208, USA
5
Department of Electrical and Computer Engineering, King Abdulaziz University, Jeddah 21589, Saudi Arabia
6
Electrical Engineering Department, College of Engineering, King Khalid University, Abha 61421, Saudi Arabia
7
Electric Engineering Department, Faculty of Engineering, Kafrelsheikh University, Kafrelsheikh 33516, Egypt
*
Author to whom correspondence should be addressed.
Submission received: 17 May 2022 / Revised: 7 June 2022 / Accepted: 12 June 2022 / Published: 18 June 2022
(This article belongs to the Special Issue Electrical Power System Dynamics: Stability and Control)

Abstract

:
A constant worldwide growing load stress over a power system compelled the practice of a reactive power injection to ensure an efficient power network. For this purpose, multiple technologies exist in the knowledge market out of which this paper emphasizes the usage of the flexible alternating current transmission system (FACTS) and presents a comparative study of the static var compensator (SVC) with the static synchronous compensator (STATCOM), inducted in a real electric substation. The aim is to improve the power factor (PF) and power quality and to encounter reliably extreme conditions. A 220 kV electric substation was opted for the analysis, and both the static and dynamic conditions were observed with the help of a power system analysis tool termed PowerFactory-DIgSILENT. Multiple aspects were investigated via software simulations to assess the performance of the aforementioned FACTS devices, such as the voltage profile evaluation via the load flow analysis method (LFA), the harmonic response via the power quality and harmonic analysis tool, and the short-circuit response via the RMS simulation tool. The outcomes were verified and compared with permissible values included in the universal standards, such as IEC and IEEE. The superiority of the STATCOM over the SVC was proven in light of the simulative results.

1. Introduction

Energy and power demand have been conspicuously maximized in the world for the last few decades, and developing countries are scarcely tackling this scenario [1]. Under such a high energy demand, the whole power system is overloaded most of the time [2,3]. In order to overcome the aforesaid concern, three methods are commonly met, i.e.,
  • Load shedding;
  • Re-dispatch of active power;
  • Reactive power compensation.
Reactive power compensation is extremely crucial for maintaining the power quality that includes voltage, current, and power system stability [4], and it can be ensured using different techniques, including capacitor-banks, synchronous generators, and, likewise, via the flexible alternating current transmission system (FACTS) [5,6]. If there is no reactive power compensation, it may lead to a complete power system collapse [7,8]. The world has already seen some radical cases of major blackouts, such as Tokyo in 1987 and Italy in 2003. Both of these contingencies resulted in massive economic and social lags [8,9]. Traditionally, in the past, utilizing a synchronous condenser system was considered a reliable approach, not only for the provision of reactive power but also for the power factor improvement [10,11]. But now, a variety of broader techniques are being considered, such as series/shunt connected compensators that can tackle the power system’s instability setbacks more effectively [12]. Among these compensation practices, FACTS are proven to be a more dynamic and effective model, as compared to the aforementioned conventional technologies, for voltage stability and regulation, with the capability of generating, as well as absorbing, the reactive power [13,14]. The FACTS is a power electronic- based system that offers enhanced controllability, flexibility, and reliability over the power network and has numerous advantages, such as boosting the transmission line’s capacity, mitigating the transmission and distribution losses, magnifying the adaptability, harmonic extenuation, and escalating the dynamic and static stability of the power system [15,16,17]. FACTS can be categorized into four different technologies [17], i.e.,
  • Series-connected;
  • Shunt-connected;
  • Series–series connected;
  • Series–shunt connected.
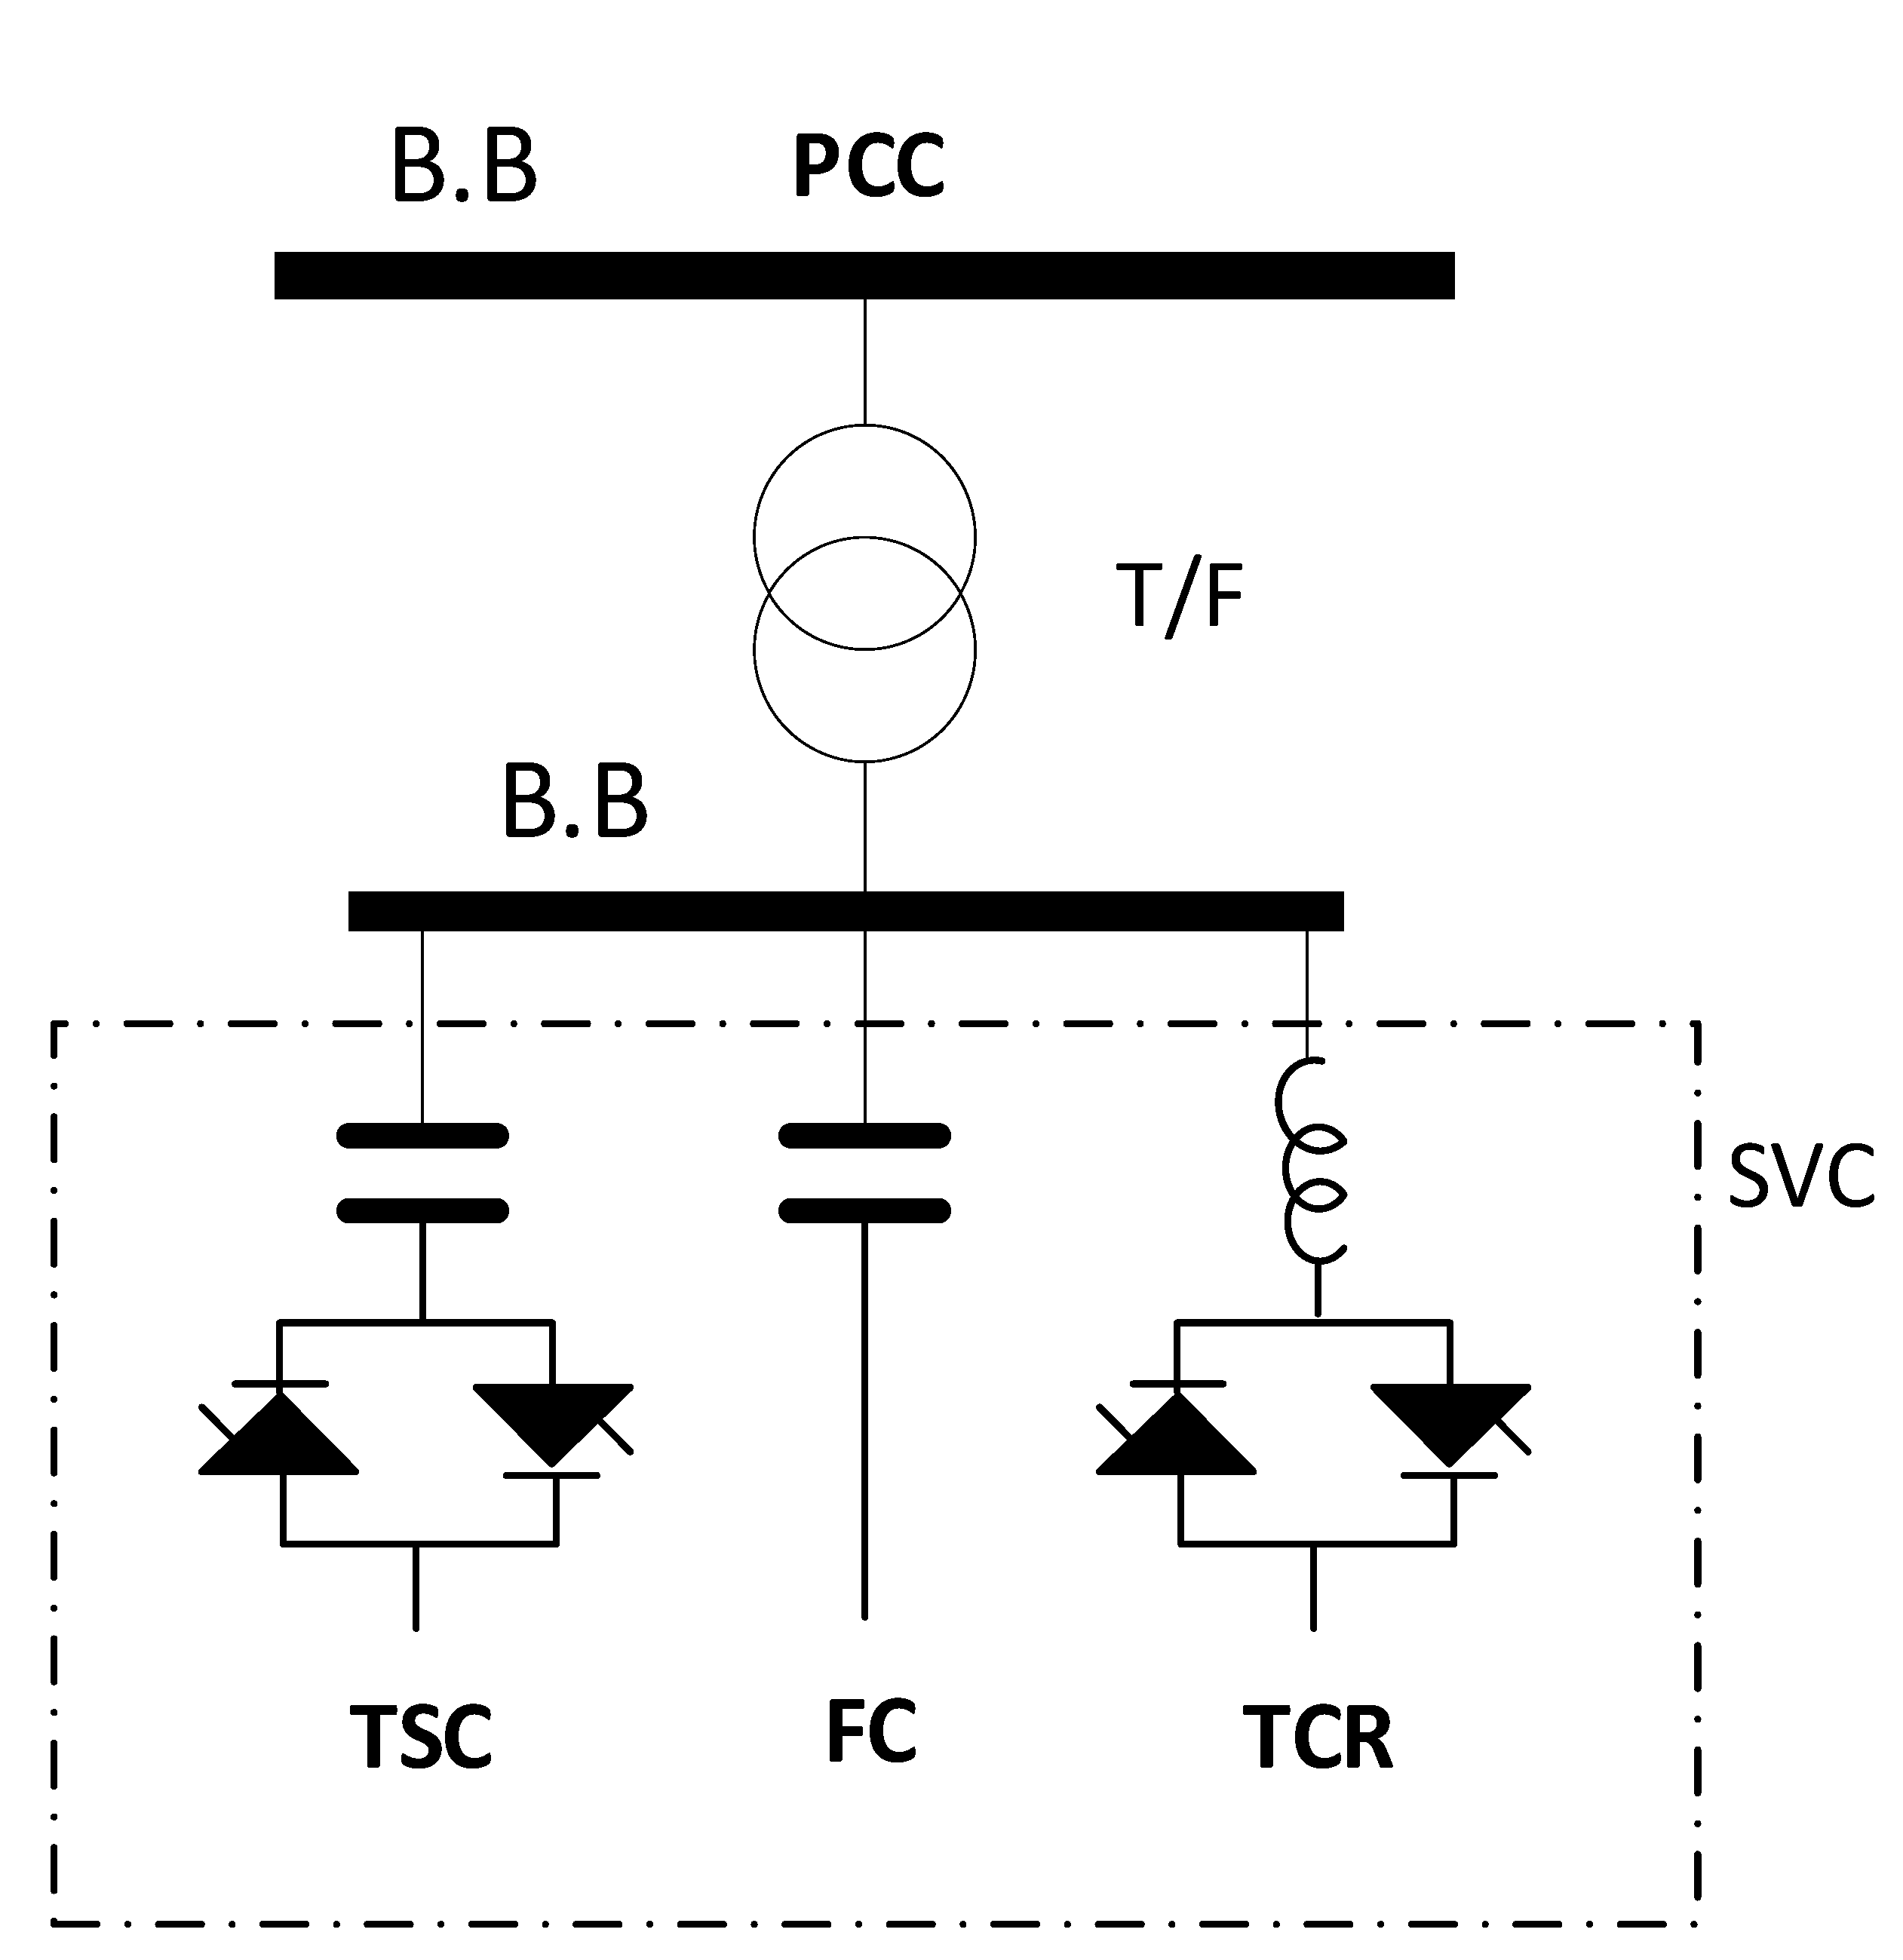
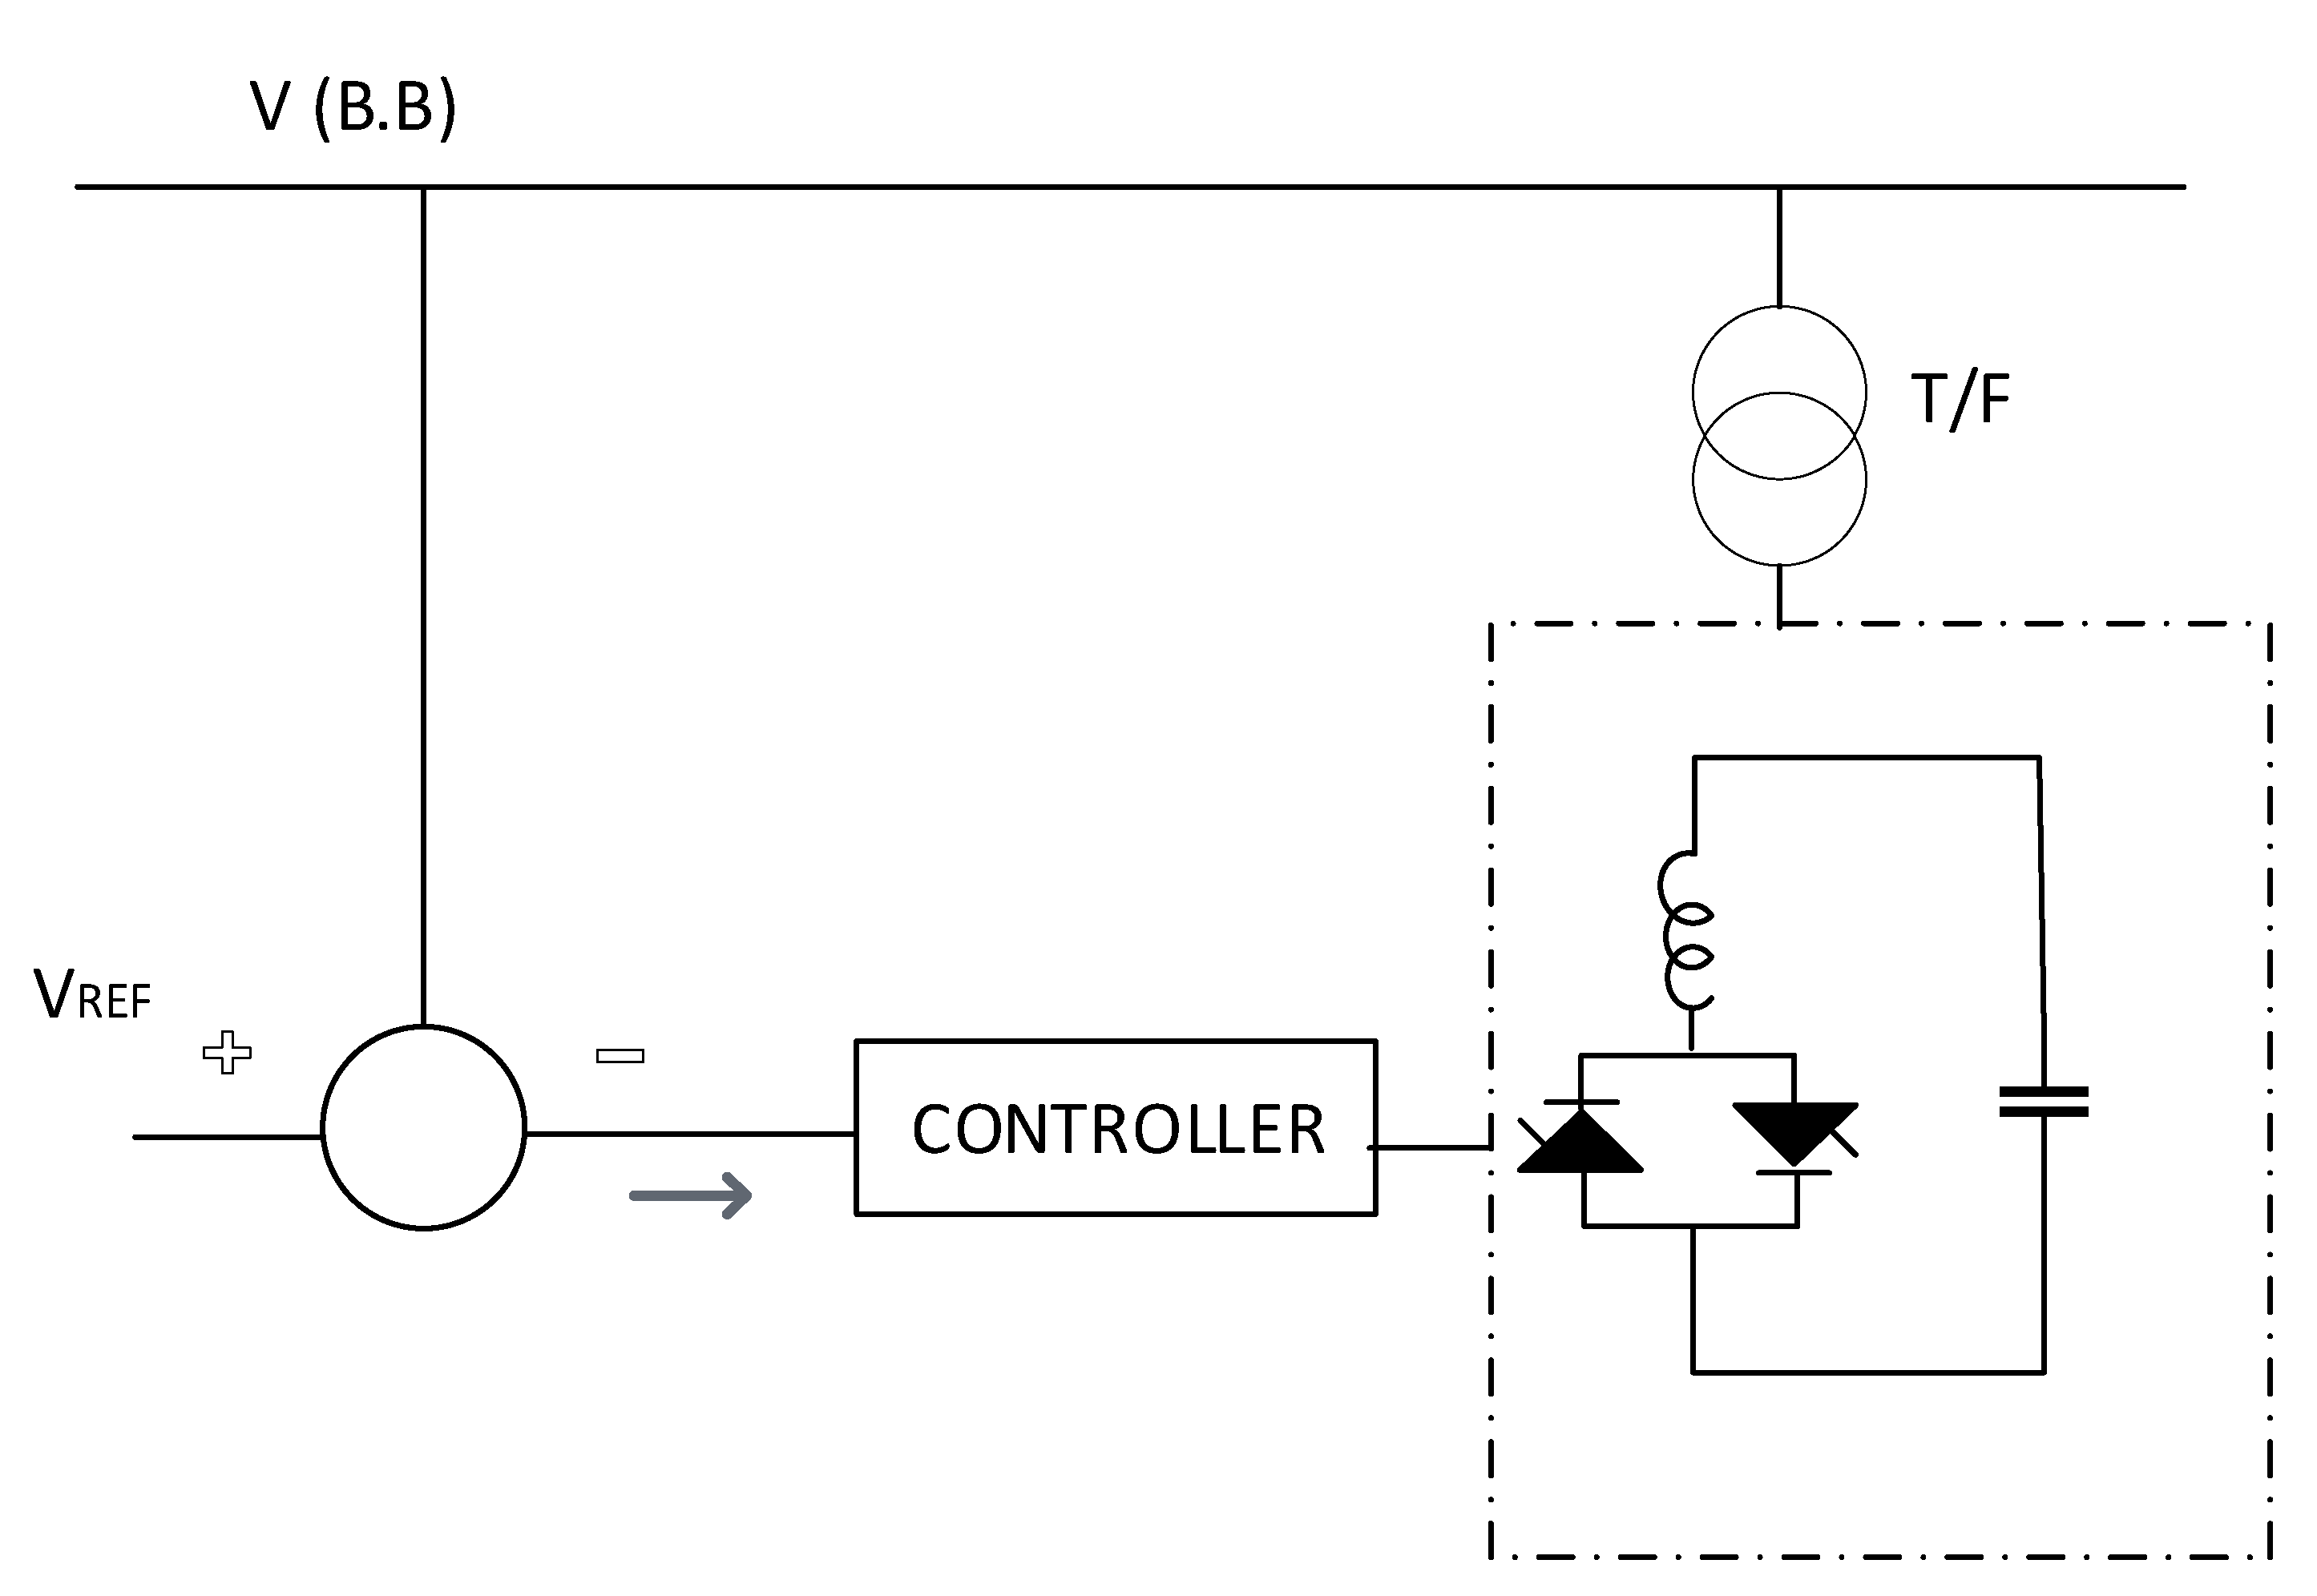
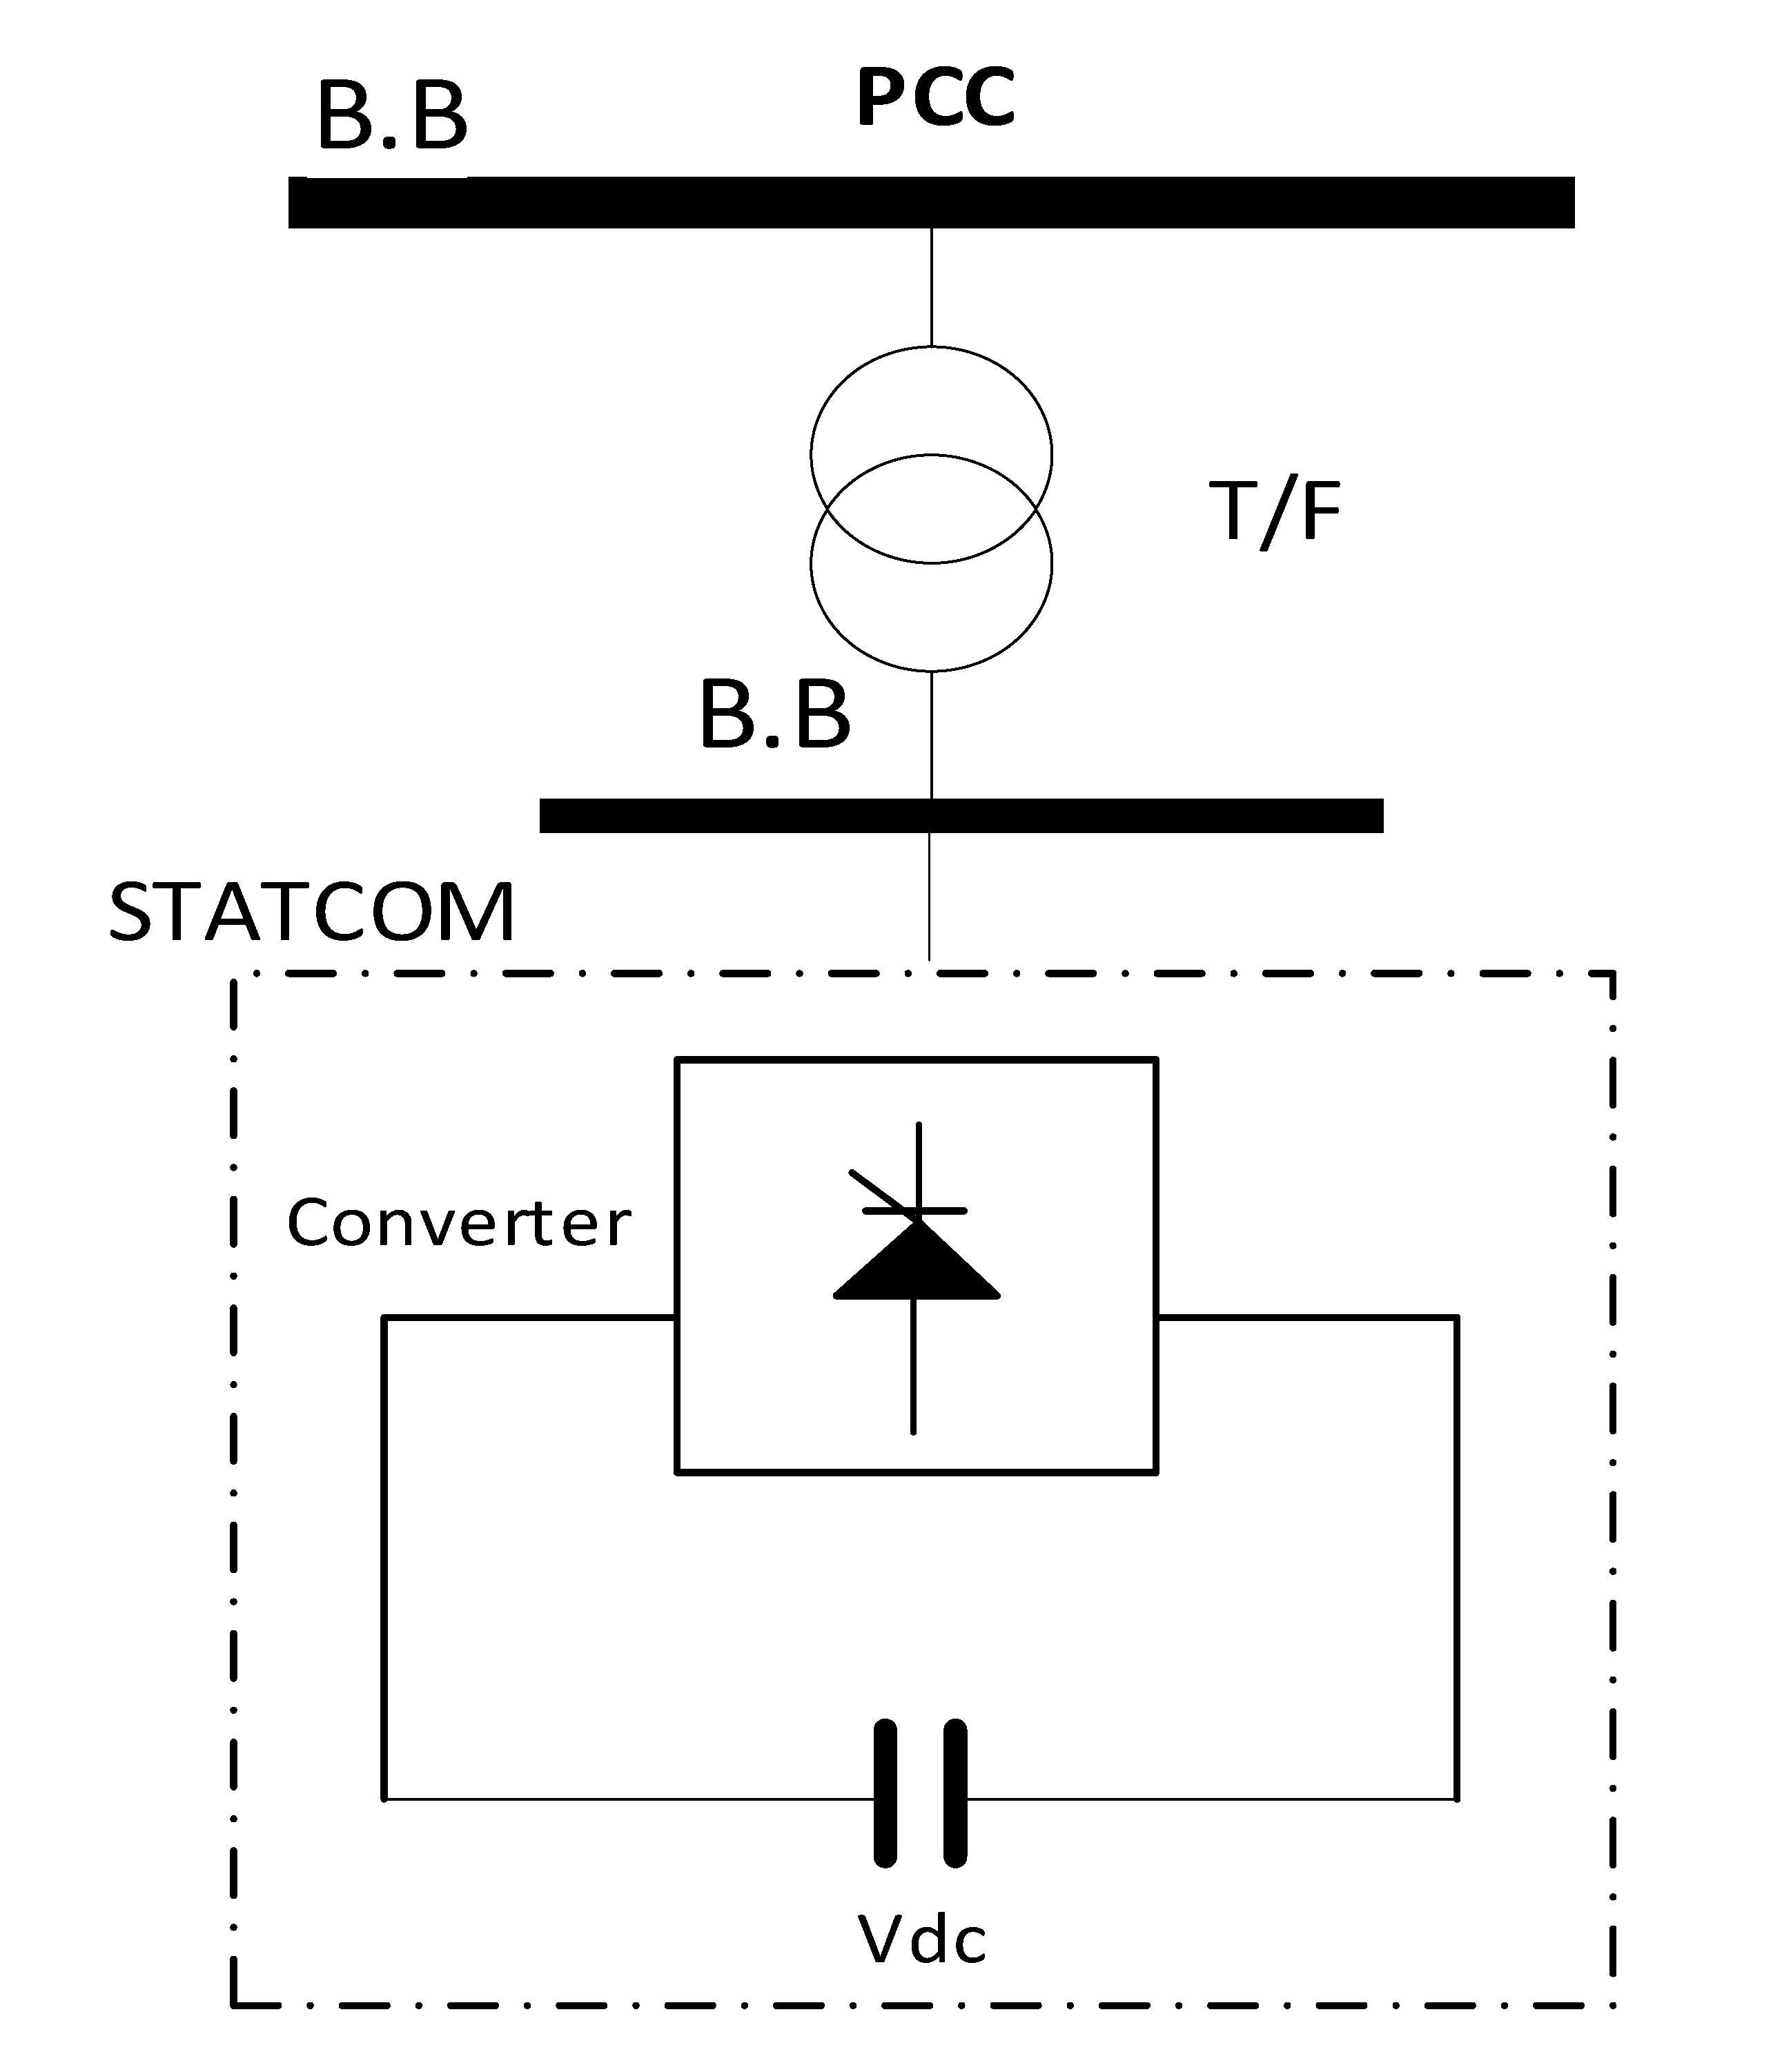
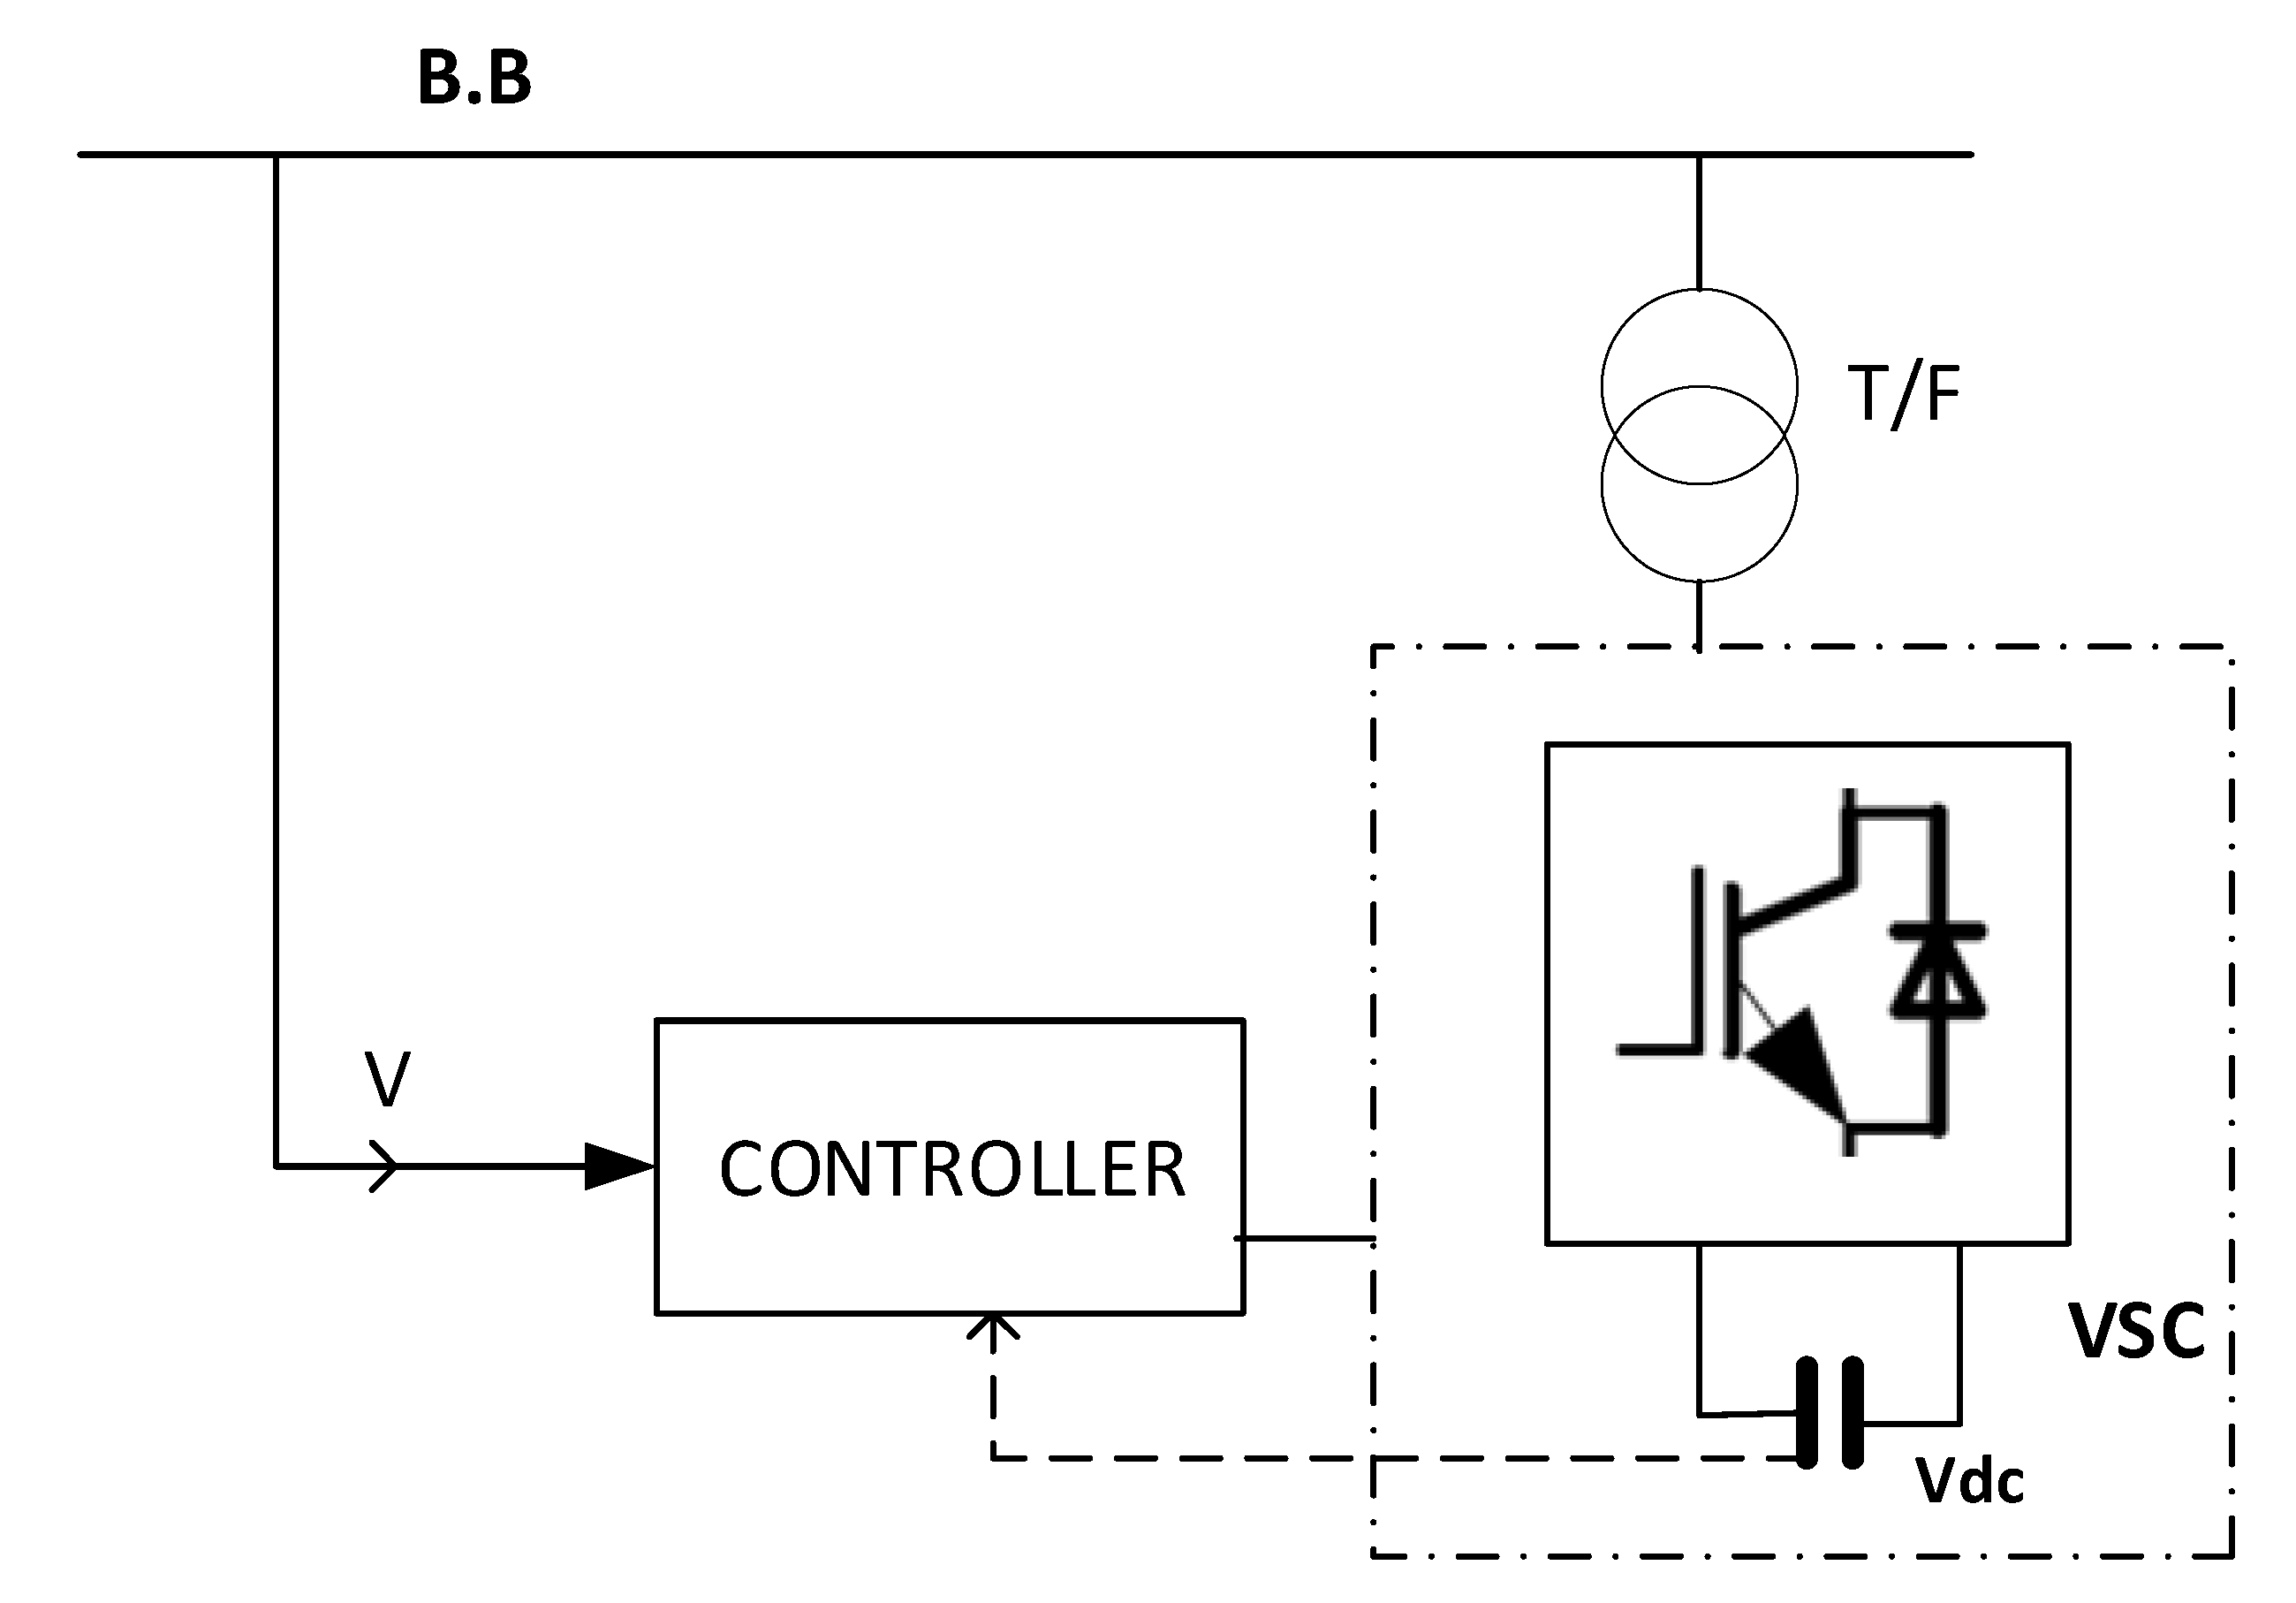
Among the aforementioned strategies, this research is going to focus on the shunt-connected devices, such as the static synchronous compensator (STATCOM) and static var compensator (SVC).
A fine amount of research has been done in the field of reactive power compensation accounting FACTS, but there are still many aspects that are needed to be investigated in terms of real engineering practices. For example, in article [18], the SVC has been discussed in terms of harmonic characteristics, but no solution has been proposed for mitigating the excessive ones or an alternative method to avoid unnecessary harmonics. In any power system, undue harmonics might lead to a partial or complete system failure because of a disturbance in the waveform at the point of common coupling (PCC) [19,20]. Then, in paper [21], general load flow studies have been carried out with and without an SVC installation, and the betterment of the voltage profile has been discussed; however, the SVC‘s dynamic response, and its role in the power system’s stability, were not considered. FACTS can also be dedicated to enhance the stability (the steady and dynamic state) of a power system and countering extreme conditions. As in paper [22], it has been concluded that with the advent of the first-generation FACTS, i.e., the SVC, the system can recover faster from instability to a stable operating mode. The STATCOM has also been referred to as a stability enhancement factor during fault exposures and for the regulation of voltage as well [23], hence, increasing the voltage stability of the system with the integration of STATCOM [24].
Thus, both the SVC and STATCOM are not just used to improve the system’s operational flexibility, power factor, stability, and reliability but could also be effective in mitigating the power system’s oscillations, real and reactive power losses, and, moreover, in minimizing the system’s operating cost [25,26]. Both aforementioned FACTS are considered exceptionally effective techniques in terms of reactive power compensation when compared to other conventional compensation systems, such as capacitor banks [27,28]. However, when both techniques are compared with each other, few studies have highlighted the superiority of the STATCOM in comparison to the SVC, such as in the research [29], where the STATCOM has been declared a better approach in terms of transient stability response, but the cost has not been taken into account in this study, which is, itself, a very important aspect in opting for a technique. As in article [30], it has been concluded that there is a need for a cost-benefit analysis while preferring any FACTS device (the SVC or STATCOM) over conventional power system stabilizers. Among all the mentioned research, none of them focused on the comparison of both techniques, i.e., the STATCOM and SVC, while recording actual data readings from an original site whose stability is conditional to the reactive power compensation. Also, no comparison has been shown among both techniques (the SVC and STATCOM) in terms of a short-circuit response and harmonic injection (disturbance) into the power system while considering a real electric substation.
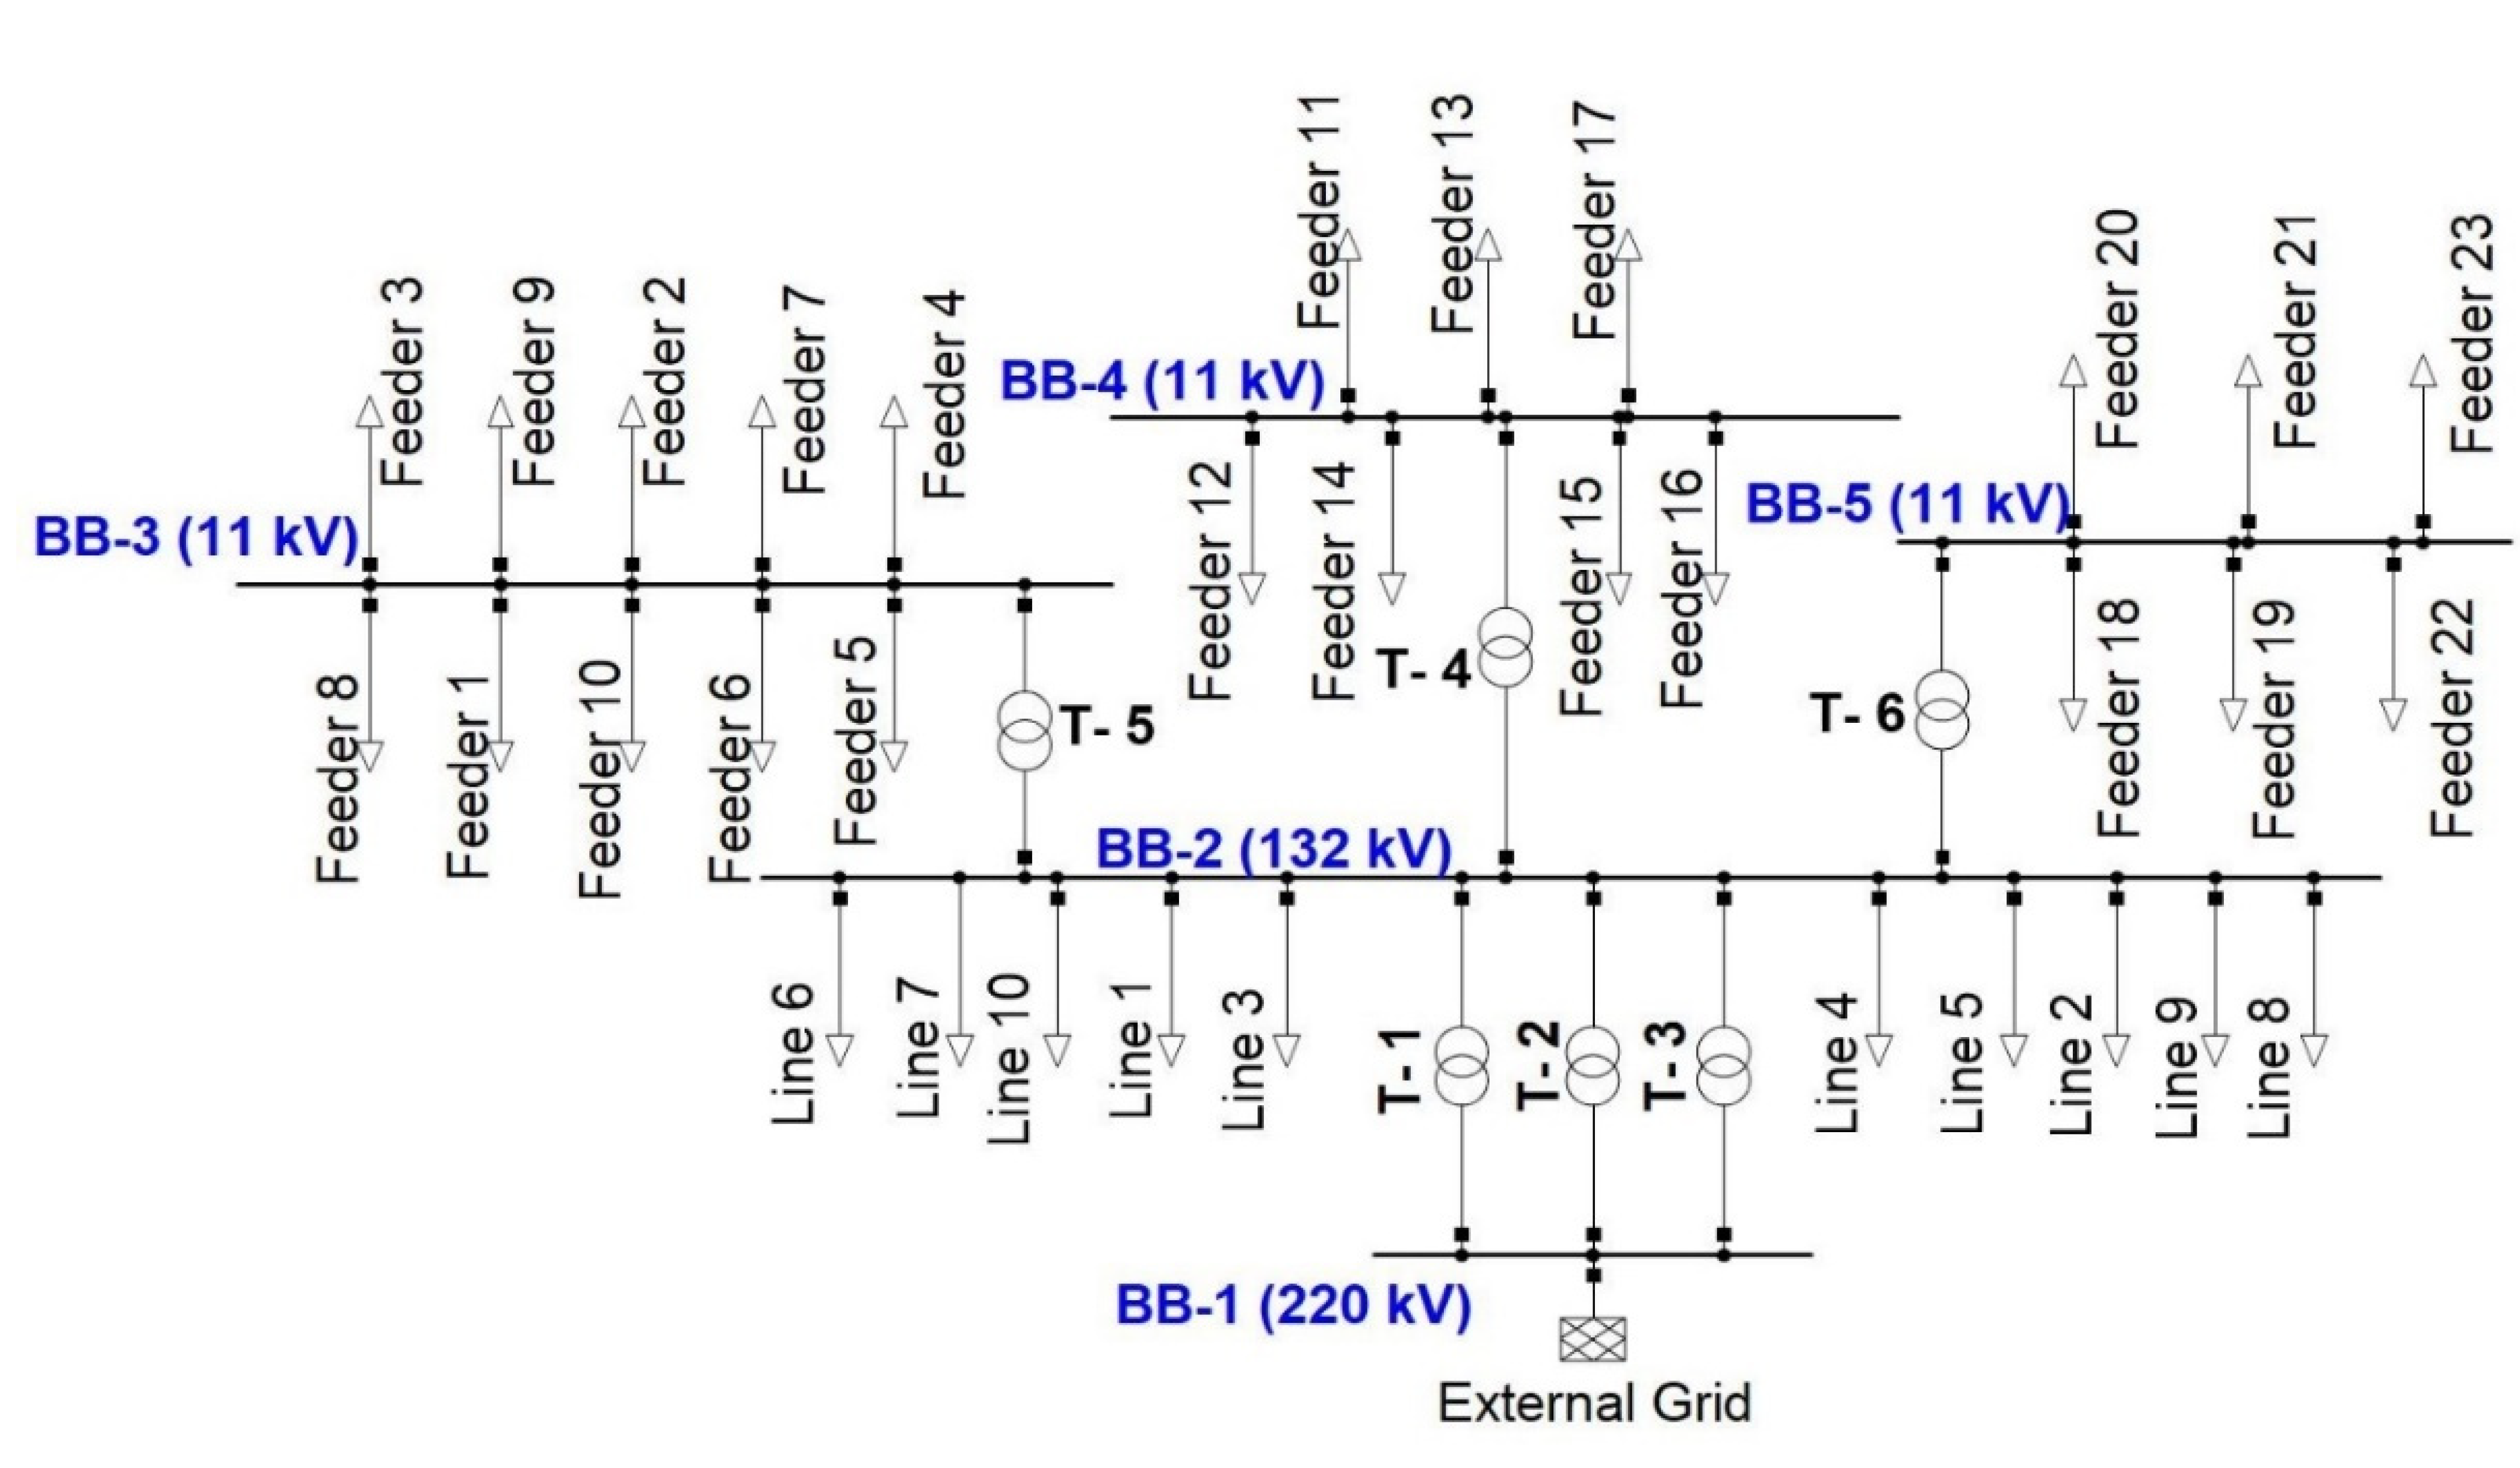
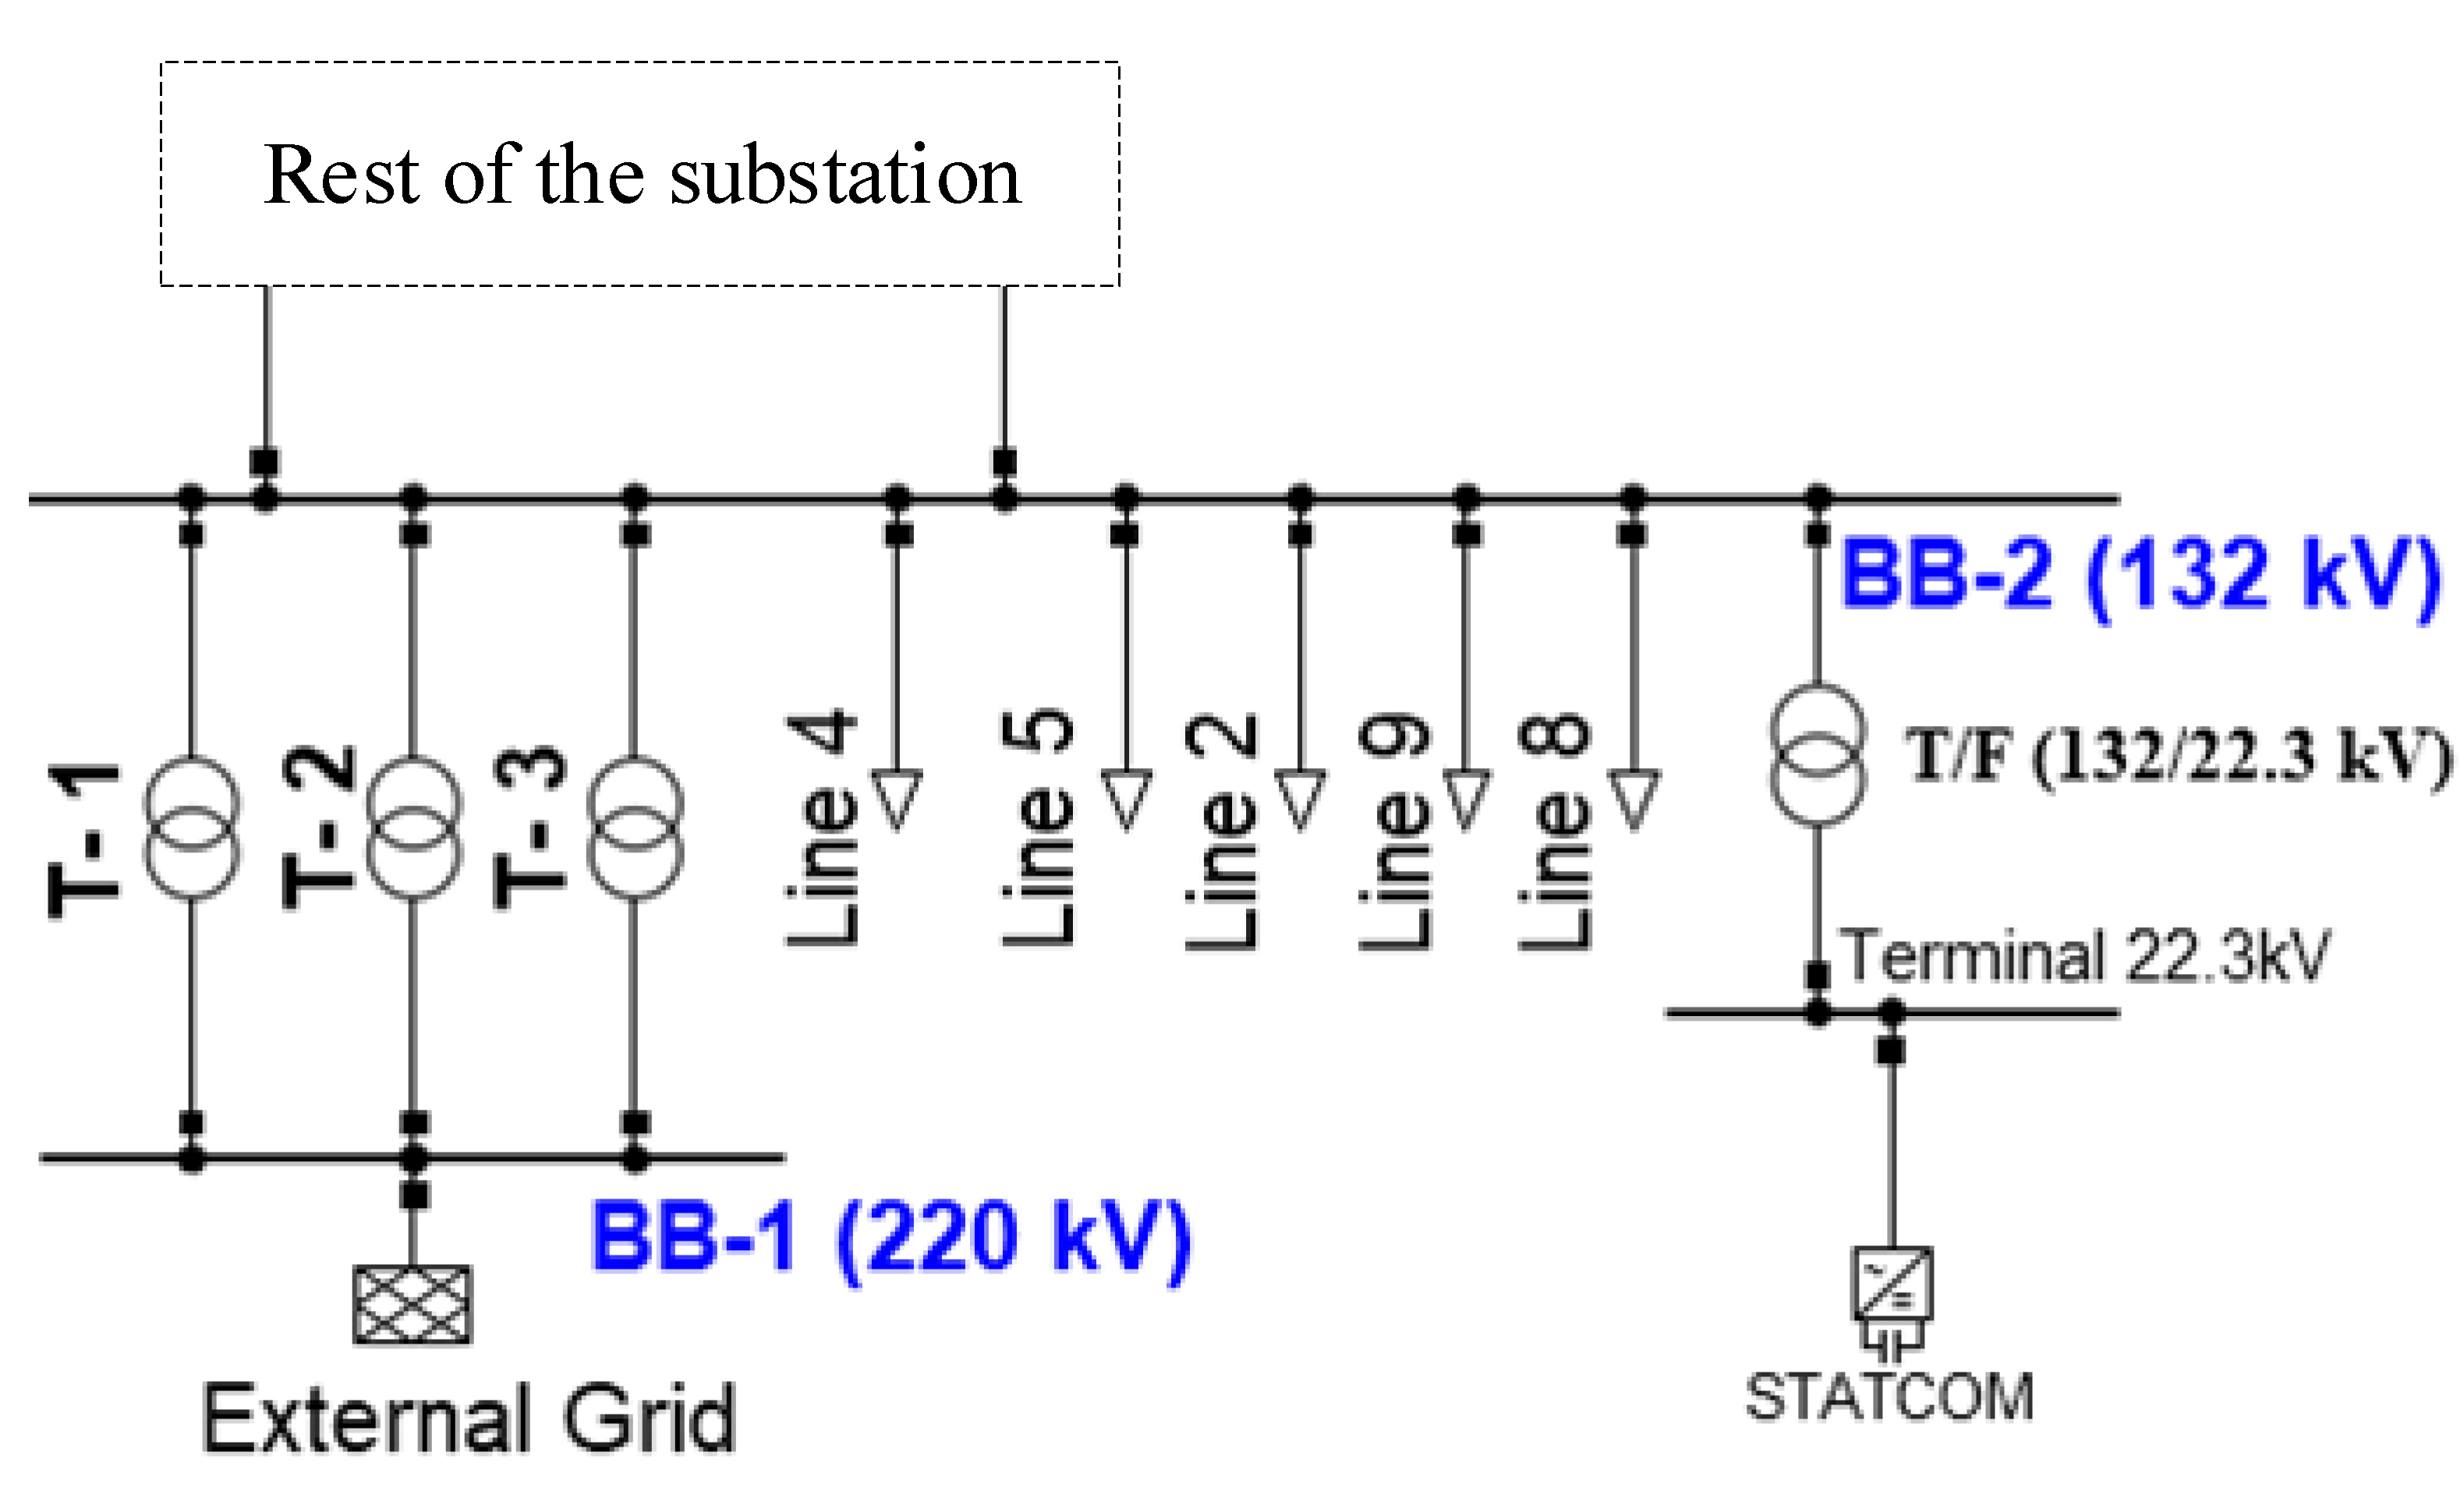
Taking all of the aforementioned invalidated key aspects into consideration, in this research, a real-life scenario of a 220 kV electric substation in South Asia has been chosen that has the adverse effects of a voltage drop, power instability, poor power factor, power losses, and a decreased power capacity. This research has shown a comparative analysis among both mentioned FACTS and a solution has been given regarding the mentioned substation that, so far, has been facing some difficulties; the paper can be subdivided as follows:
  • In the first part, load flow studies will be carried out without the involvement of the FACTS for the validation of the system’s limitations.
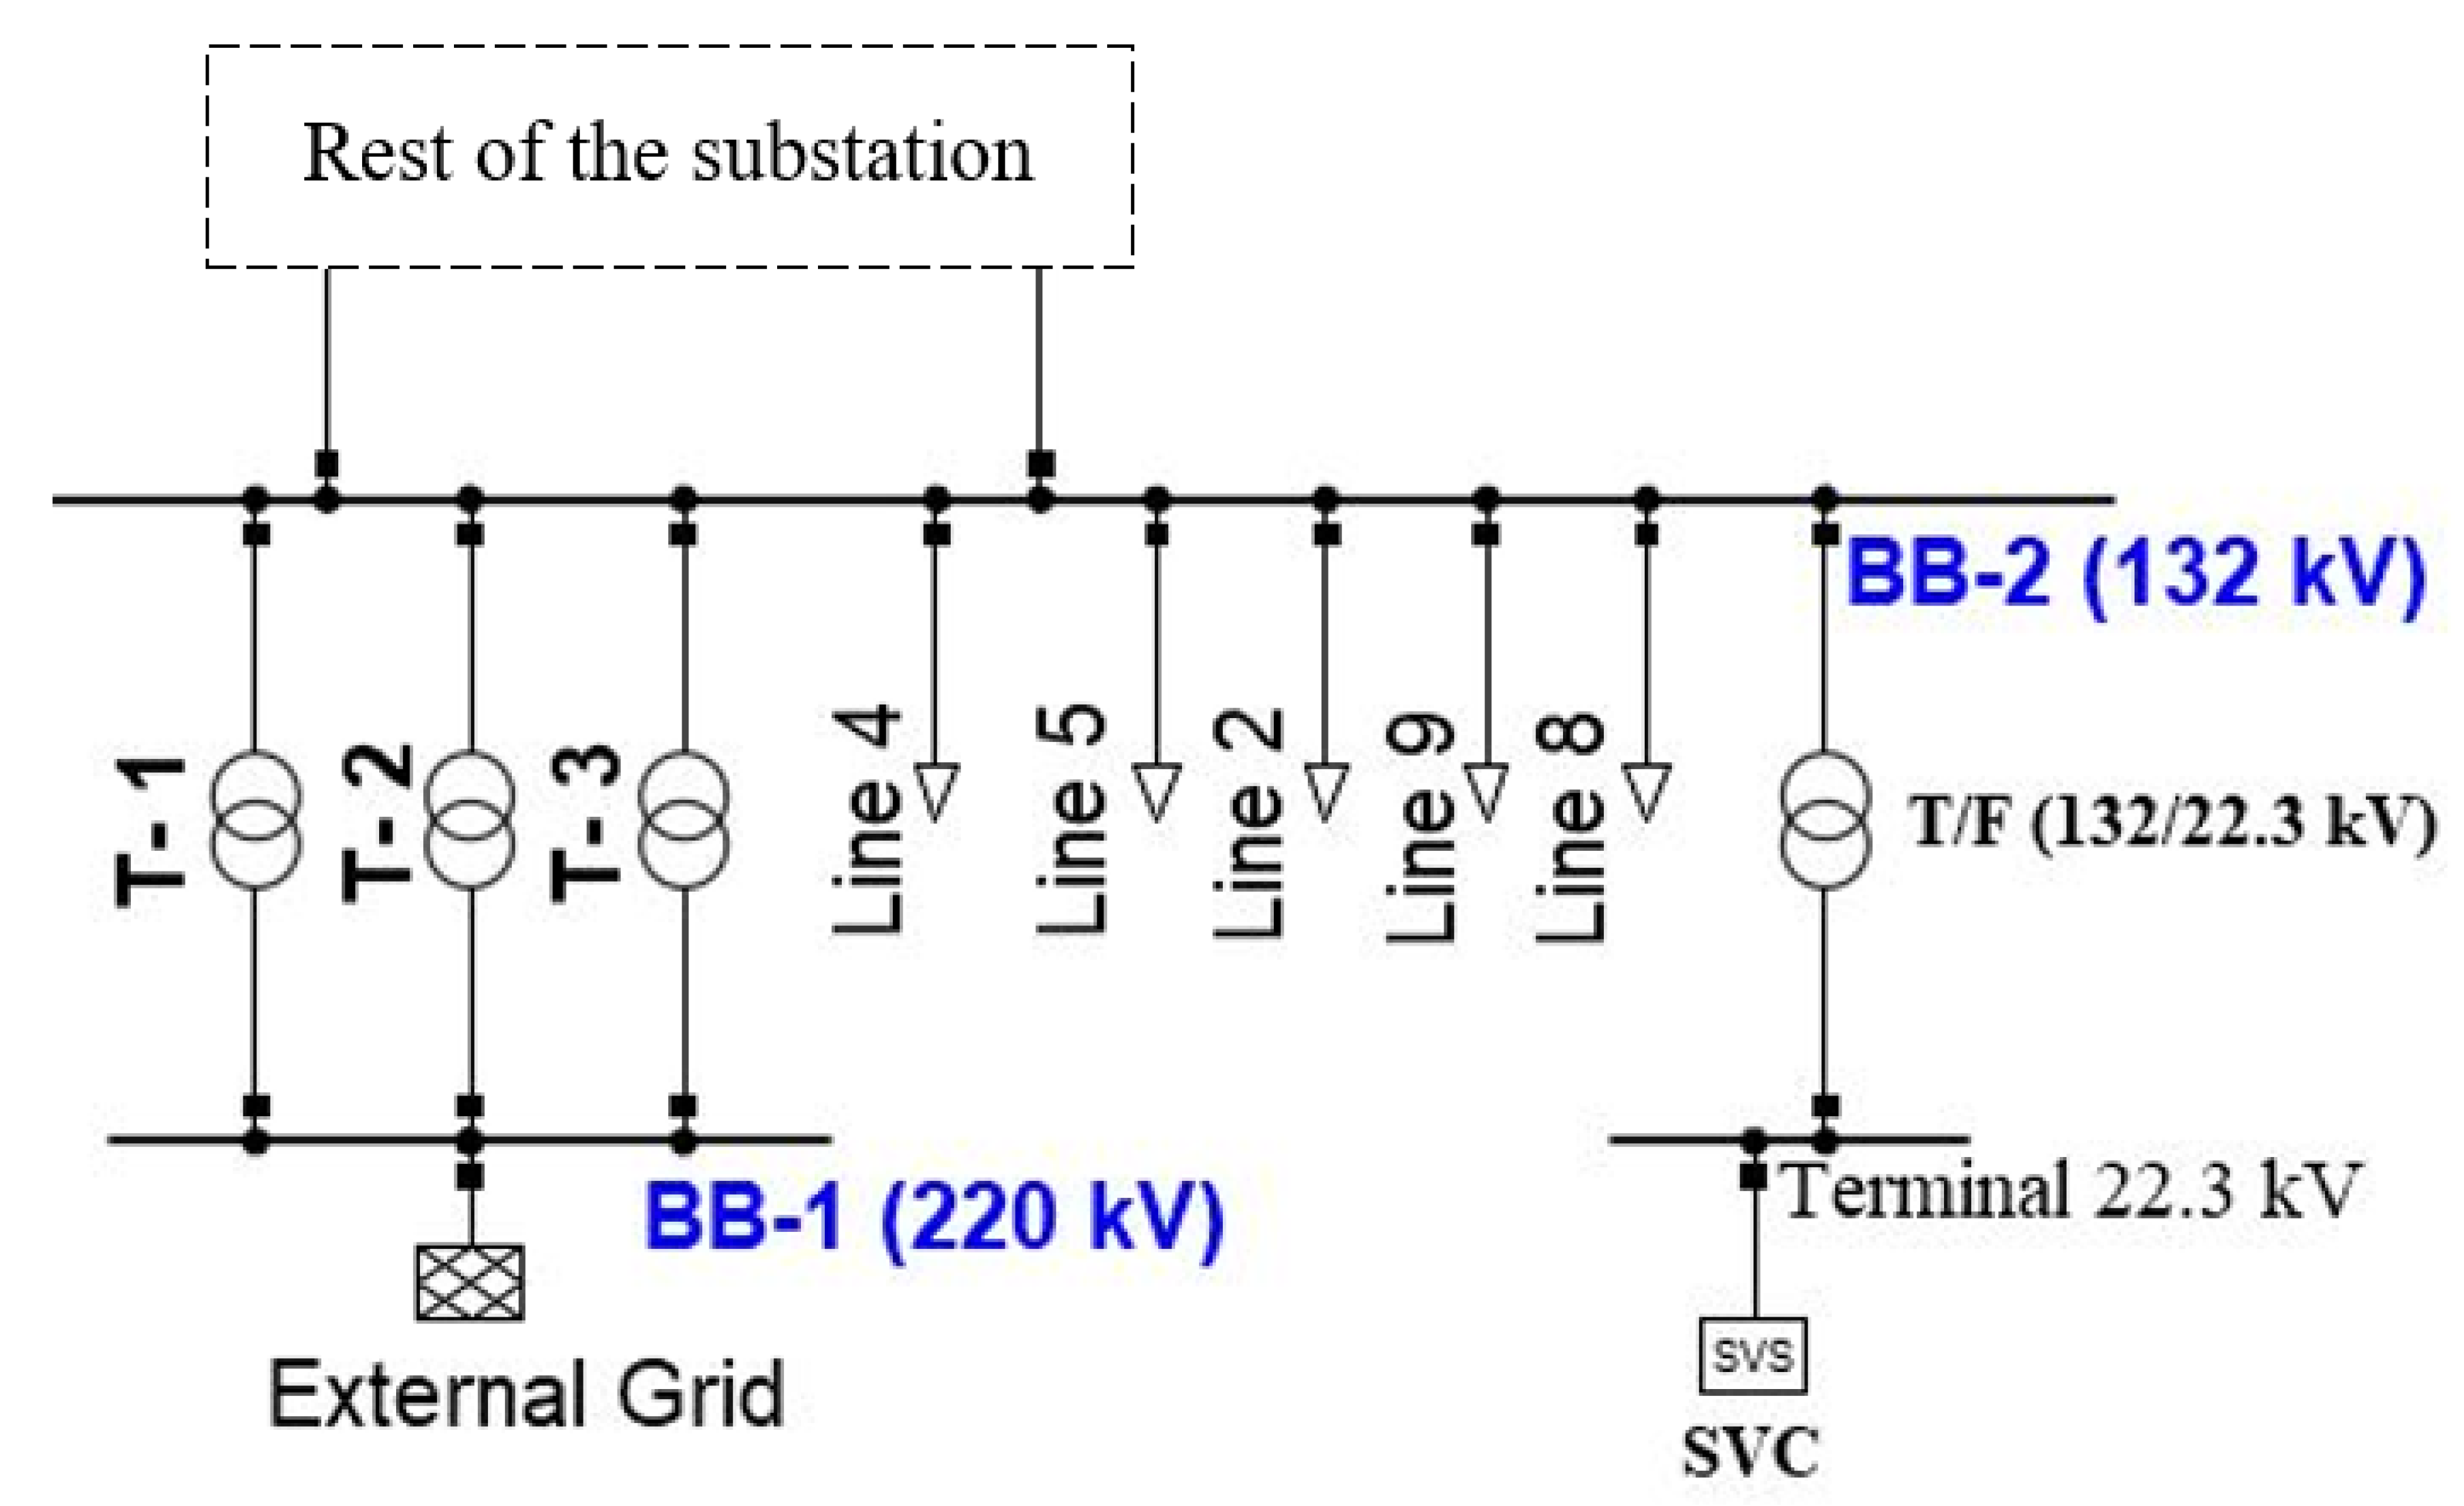
  • The second part will focus on proposing the SVC and STATCOM at the weakest bus bar (discovered during the first part) and observing the betterment of the power system’s behavior in terms of recorded values using the software. This includes the betterment of initially overloaded transformers and the voltage regulation of the bus bars.
  • The third part contains the harmonic analysis (using the power quality and harmonics tool) and short-circuit response (using the RMS simulation tool) of the power network after the installation of the SVC and STATCOM. Again, both techniques are compared with the help of the recorded results.
  • The fourth and last part focuses on the comparison of the simulative outcomes and cost of both FACTS (the SVC and STATCOM). Eventually, at the end, a declaration of the superiority of one of the technologies (the SVC or STATCOM) and the best one for each specific analysis that was considered in this paper will be stated.

2. Power System Modelling

2.1. Substation Modeling

A 220 kV electric substation opted for this simulative study, and it was completed using a software entitled PowerFactory-DIgSILENT. Figure 1 presents a single line diagram (SLD) of the equipment involved in this study; it comprises:
  • A 220 kV bus bar connected with a power source (an external grid)—a reference bus;
  • Three auto transformers (T/F) responsible for 220/132 kV (T-1, T-2, and T-3);
  • A 132 kV bus bar;
  • Three power transformers (T/F) responsible for 132/11 kV (T-4, T-5, and T-6);
  • Ten outgoing 132 kV distribution lines (the primary distributive region);
  • Twenty-three outgoing 11 kV distribution feeders (the secondary distributive region).

2.2. Static VAR Compensator (SVC) Modeling

Initially, this study proposed the first-generation FACTS, which is an SVC to be inducted in a conventional manner, i.e., operation under bus voltage control [31]. A thyristor-controlled reactor (TCR)-based model connected to the power network through a step-down transformer is shown in Figure 2, and the proposed ratings are presented in Table 1. The SVC can improve the system’s stability in dynamic conditions by supporting the voltage at the point of common coupling (PCC) during extreme conditions and also during the steady-state by providing the reactive power and, eventually, reducing the system’s losses [32]. The amount of reactive power injection into the system is dependent on the voltage deviation relative to the reference voltage (VREF) [33]. Figure 3 and Figure 4 present a simpler scheme of the TCR mechanism and the SVC’s structure using the PowerFactory software, where the SVC was attached to the power system via a step-down coupling transformer (T/F).

2.3. STATCOM Modeling

In the final stage, the behavior of the STATCOM was observed after installing it with the network. A STATCOM is proposed to be inducted for compensation of the poor parameters of the substation connected via the PCC (BB-2). A model system is shown in Figure 5 and was connected through a step-down coupling transformer (T/F) to the power network. In the case of the STATCOM, a voltage source converter (VSC) is mainly responsible for providing the reactive power to the system via PCC. The DC source (Vdc) plays a great role during the power compensation phenomenon, along with the VSC. Figure 6 presents a simplified scheme of the VSC’s role in the STATCOM [34], and Figure 7 presents the STATCOM structure in the PowerFactory software. Here, the STATCOM was attached to the PCC (BB-2) through a step-down transformer (132 kV/22.3 kV).

3. Simulative Results

3.1. Load Flow Study—Without Compensation

Load flow analysis (LFA) has been designated as a largely used method for power system planning and operation [35]. Various studies benefitted from LFA while concluding power system studies and by mainly using the Newton–Raphson method to carry out the analysis [36,37,38]. Conventionally, the core objective of performing a load flow analysis is to conclude voltages along with the real and reactive power of individual bus bars and transformers’ parameters in the power grid [39]. A load flow study of the modeled substation was carried out with the help of the aforementioned software. At this stage, the LFA was performed without any participation of the FACTS devices and implemented to verify the substation equipment loadings and performance in the peak-load condition. The results are presented in Table 2 and Table 3. Observing the results of the LFA, it is evidently clear that the power network is facing setbacks, such as a poor voltage profile and heavily loaded transformers. Table 2 explains the condition of the transformers after the LFA, which shows that the transformers are overloaded in terms of the country’s power system regulations that observe the provision of the IEC standard 60354 [40]. According to the aforementioned standard, constant loading of the oil-immersed transformers beyond the limit of 80% will result in reducing the constructive lifespan of the equipment. The results of all of the transformers are approximately similar, but, somehow, T-5 and T-6 are in a better loading state as compared to T-1, T-2, T-3, and T-4.
Similarly, the LFA results of the involved bus bars are also not very promising, as shown in Table 3. The primary distributive region, i.e., the 132 kV bus bar (BB-2), was recorded with a voltage level of 121.5 kV, which depicts a drop of 13.8%. Again, the percentage voltage drop was not adhering to the country’s power system provisions, i.e., a ±6% tolerance. Similar behavior was observed in the case of the secondary distributive region (11 kV) bus bars, i.e., BB-3, BB-4, and BB-5, which demonstrate a voltage drop of approximately 13%. Considering the statistics of the LFA, the primary distributive bus bar (BB-2), i.e., 132 kV, is believed to be the most overloaded bus bar in the system. Hence, this study proposes the BB-2 to be the attachment as the point of common coupling (PCC) for the FACTS and for the provision of reactive power into the network.

3.2. Load Flow Study—With Proposed SVC

BB-2 (132 kV) has proven to be the weakest bus bar in the power network. Multiple mechanisms and ratings were opted for performing the LFA; however, only the best outcomes are presented here. The proposed SVC was installed at a 132 kV bus bar (Figure 1), and the results of the LFA were taken into account during the peak-load scenario. Table 4 and Table 5 present the LFA results after the reactive power compensation using the SVC. After the installation of the SVC with the power network, a certain improvement was seen in terms of the over-burdened transformers. In Table 4, while observing the transformers’ LFA results, T-1, T-2, and T-3, which were previously (without a compensation state—Table 2) 94.5%-loaded, are now at 76.6%, approximately, which shows an upgradation of 17%. Likewise, transformers T-4, T-5, and T-6 have shown a lot of improvement after the SVC compensation and are currently at 83%, 80.1%, and 79.3%, respectively. An identical outcome was observed in the case of the primary distributive bus bars of the substation, as exhibited in Table 5. After the SVC installation and reactive power provision into the system, BB-2 (132 kV) showed a betterment of the voltage profile with a newly recorded voltage of 130.4 kV instead of 121.5 kV (without the SVC compensation state), which roughly amounts to an improvement of 13% in the recorded value. Similarly, for the secondary distributive region, i.e., the 11 kV bus bars (BB-3, BB-4, and BB-5) presented an increase of 7.5% after the SVC’s compensation. The results exhibited in Table 4 and Table 5 seem to be adhering to the country’s power system regulations and to the IEC standard [34], as well.

3.3. Load Flow Study—With Proposed STATCOM

The proposed STATCOM was installed with the power network at the PCC, i.e., BB-2 (132 kV). Again, the presented results were recorded in the scenario of the peak-load condition. Table 6 and Table 7 exhibit the results obtained by the LFA of the substation after the installation of the STATCOM. The behavior of the transformers can be observed in Table 6; a fair improvement was observed in the case of T-1, T-2, and T-3, as they are now with a reduced percentage of loading.
However, unexpectedly, other transformers (T-4, T-5, and T-6) showed an almost similar response, as was for the case of the SVC, despite the better performance of the high-voltage region transformers (T-1, T-2, and T-3). In Table 7, the recorded voltages of the bus bars are presented, and the value of BB-2 (132 kV) is slightly better than the case of the SVC, i.e., 131.1 kV instead of 130.4 kV (the case of the SVC). Comparative to the SVC, no significant improvement was observed (with the STATCOM) for the case of the secondary distributive region’s bus bars, i.e., BB-3, BB-4, and BB-5.

3.4. Harmonic Response

Nowadays, avoiding excessive harmonics has become inevitable because of the non-linear loads and due to the installation of high-frequency power electronic equipment at electric substations and power stations, as well. It is the main cause of the distortion of the standard sinusoidal waveform, hence disrupting the power system’s efficacy [41]. Under such circumstances, harmonic analysis has become a significant parameter for power system studies and the system’s design [42]. IEEE and IEC both have stated certain permissible limits for harmonics in the power system [43,44]. In this paper, harmonic studies were carried out using the software analysis tool for both cases, i.e., the SVC and STATCOM, at BB-2 (132 kV), which is considered a PCC. For the case of the SVC, the results of the harmonic distortion are presented in Figure 8. Considering the results, the SVC triggered excessive odd harmonics (the 5th and 7th) because of the TCR, which exceeded the limits of the standards cited by IEEE (explained in Table 8) and was taken as a violation of the country’s power system regulations, as well. The resultant distorted waveform of BB-2 (132 kV) has been shown in Figure 9. Such a large number of harmonics can be curtailed by high-rated harmonic filters. However, for the case of the STATCOM, no significant harmonic distortion was observed due to the fact that the design of the STATCOM can be helpful in suppressing the excessive harmonics. In a few studies, the STATCOM is stated as a self-compensatory device for the mitigation of harmonics, and they even stated that no additional filters are needed when attaching the STATCOM to a power network [45,46]. The waveform generated after executing the harmonic analysis in the presence of the STATCOM is shown in Figure 9.

3.5. Response to Faulty Condition

This section focuses on the behavior of both FACTS devices (the SVC and STATCOM) when exposed to extreme conditions in the substation. The BB-5 (11 kV) bus bar was opted as the point of a planned fault occurrence in the form of an intended short-circuit at the time instant of 2 s. Figure 10 presents the voltage profile of the BB-2 (132 kV) bus bar in response to a short-circuit at 2 s in the presence of the SVC. Due to fault, the bus bar voltage was dropped to a 0.85 p.u value; this is the point where the SVC started injecting reactive power into the system in order to stabilize the bus bar voltages. After the reactive power injection into the system, the bus bar voltage was amplified up to 1.02 p.u before stabilizing it to the closest value of 1 p.u. In Figure 10, also the voltage profile of BB-2 is depicted in the presence of the STATCOM. In response to the aforementioned faulty case, the STATCOM reacted in a finer manner as compared to the SVC. The voltage drop value was 0.87 p.u instead of 0.85 p.u (in the case of the SVC), and, after the reactive power injection, the amplified voltage was, again, more stabilized with a p.u value of 1.02. The apparently minimal difference of the voltage values between 1.02 p.u and 1.03 p.u approximately amounts to the difference of 1.8 kV.

4. Discussion: SVC vs. STATCOM

Nowadays, reinforcing the power network via reactive power is in frequent practice. Among all of the reactive power compensation approaches, the FACTS is considered an effective technique. In this paper, both the SVC and STATCOM showed satisfactory outcomes with respect to enhancing the voltage capacity of the power system. For example, in Table 4 and Table 5, improved results after the SVC reactive power compensation are presented, which depict the enhancement of the voltage figures of the transformers and bus bars. Moreover, in light of the IEC standard and the country’s power system regulations, the heavily loaded transformers are now within the recommended limits, i.e., ~80%. Likewise, the event of the STATCOM power compensation explained in Table 6 and 
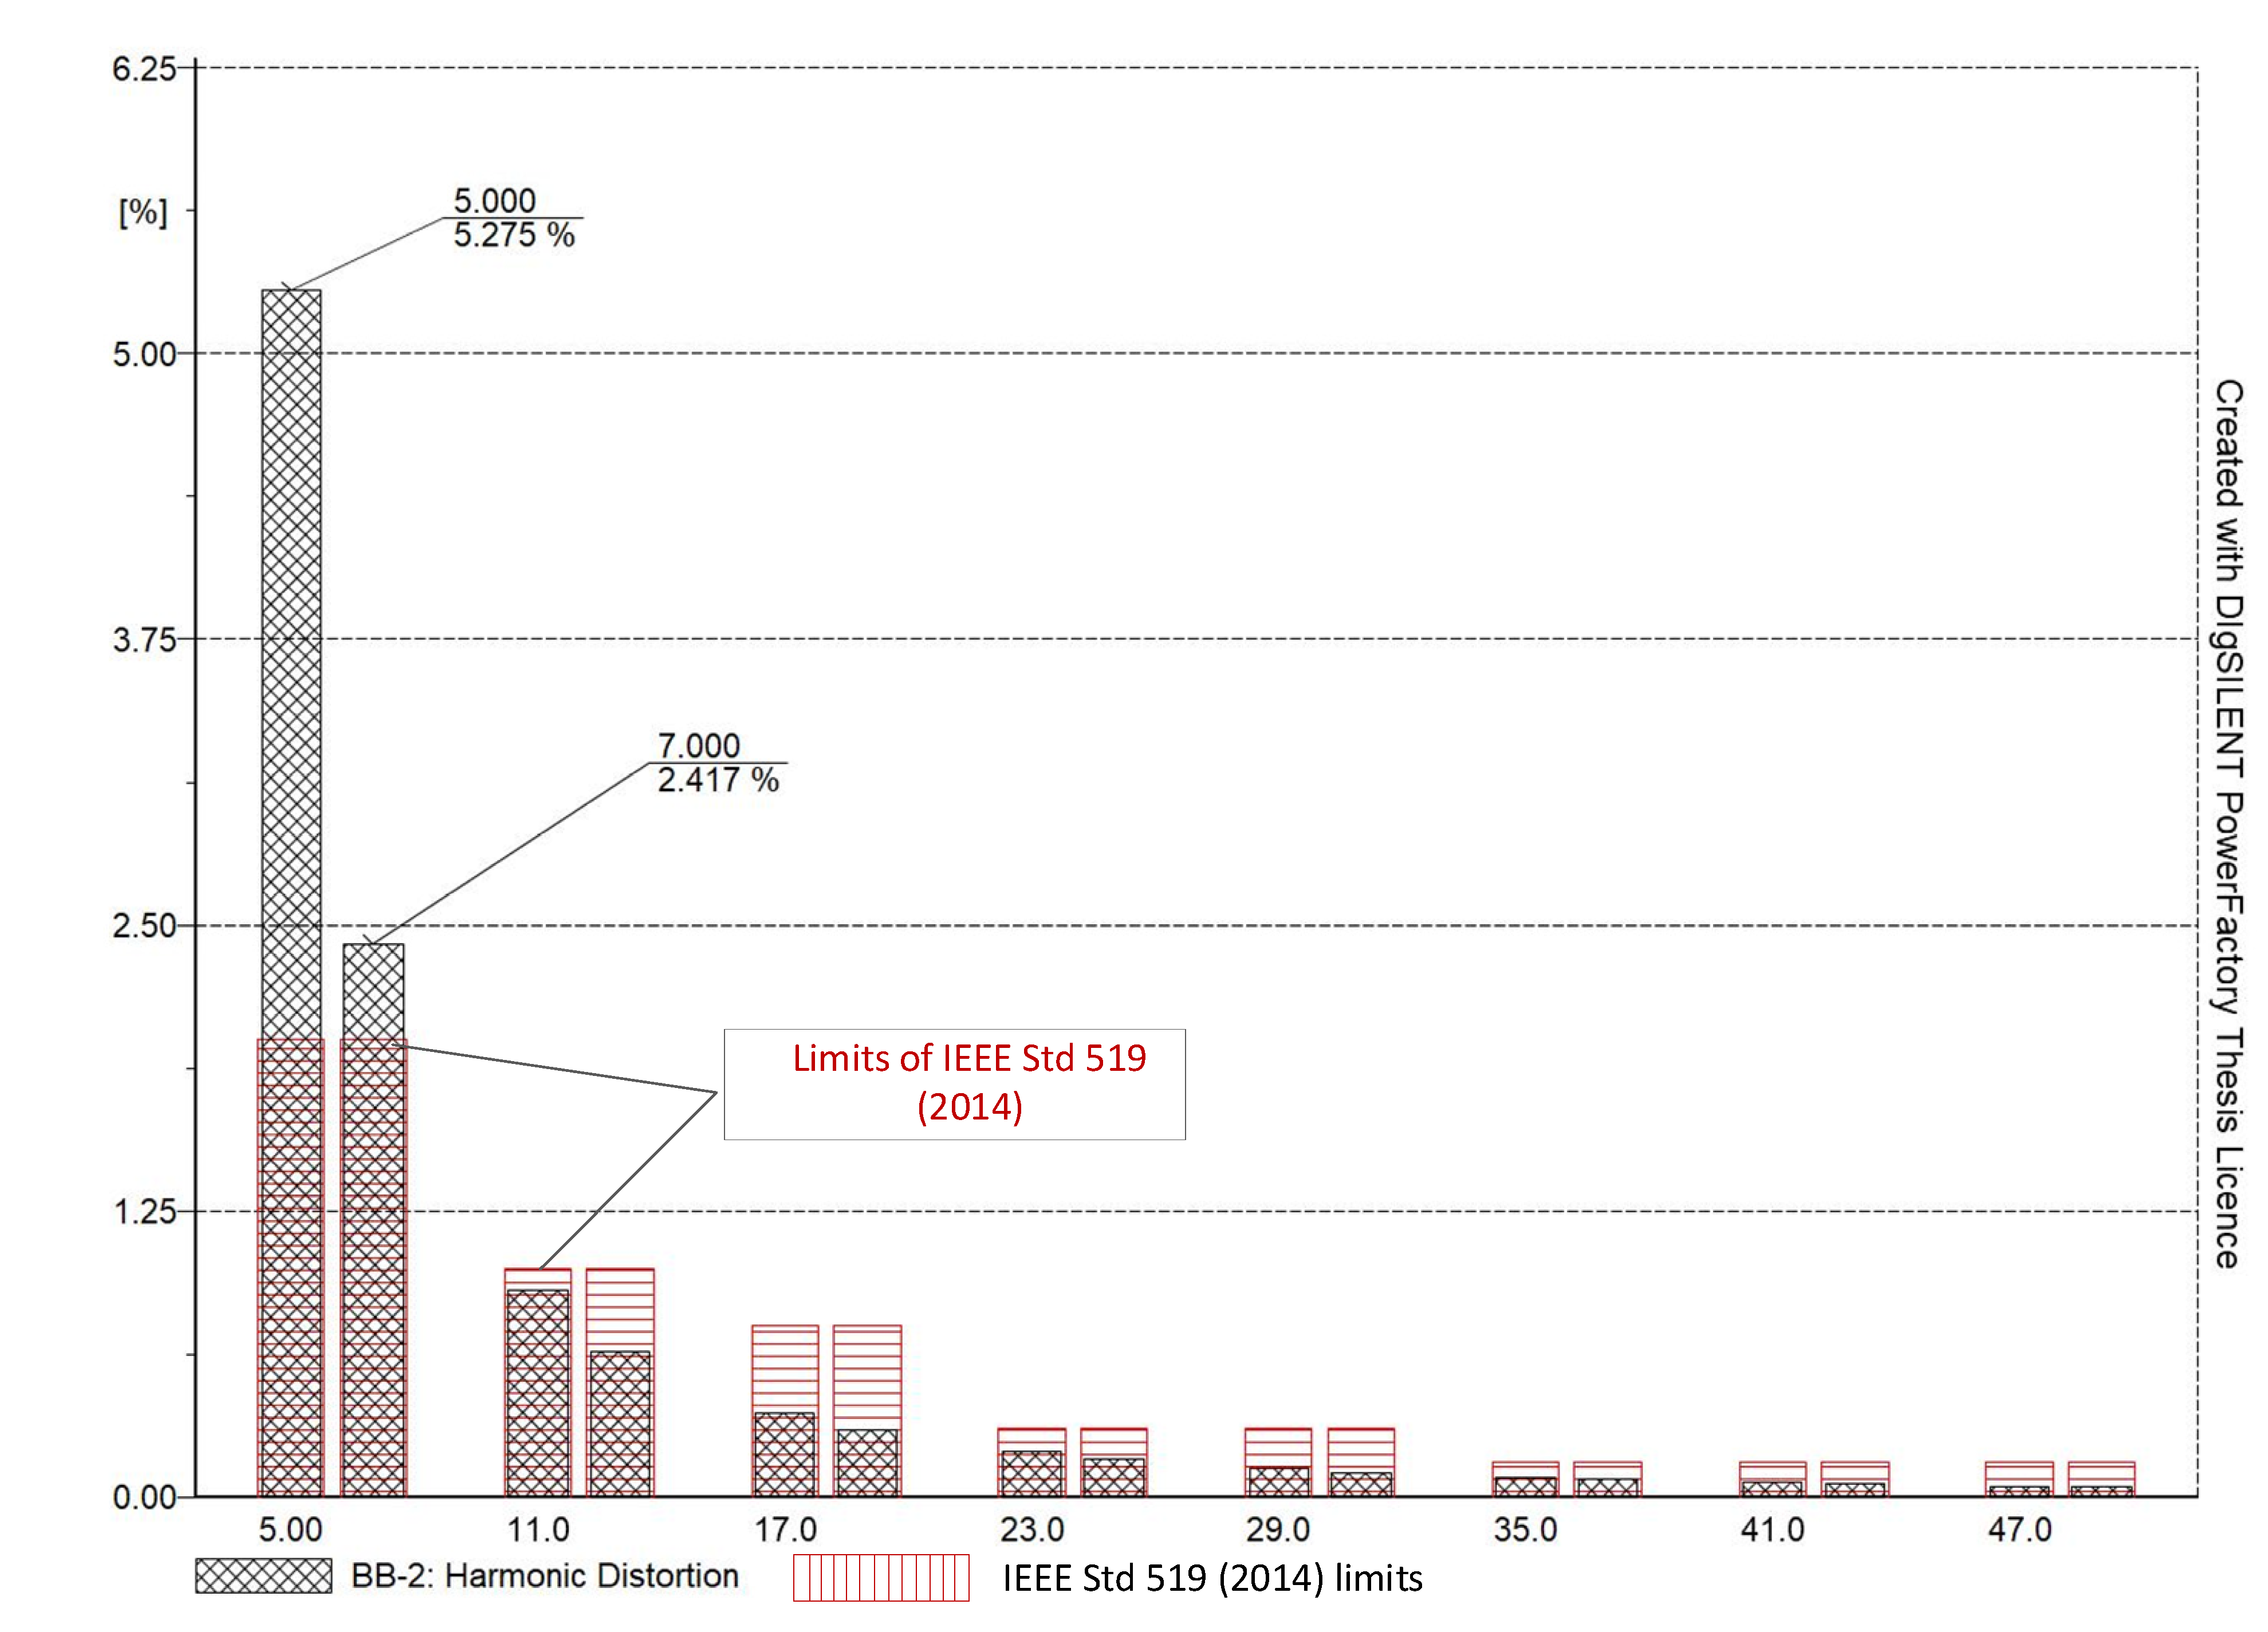
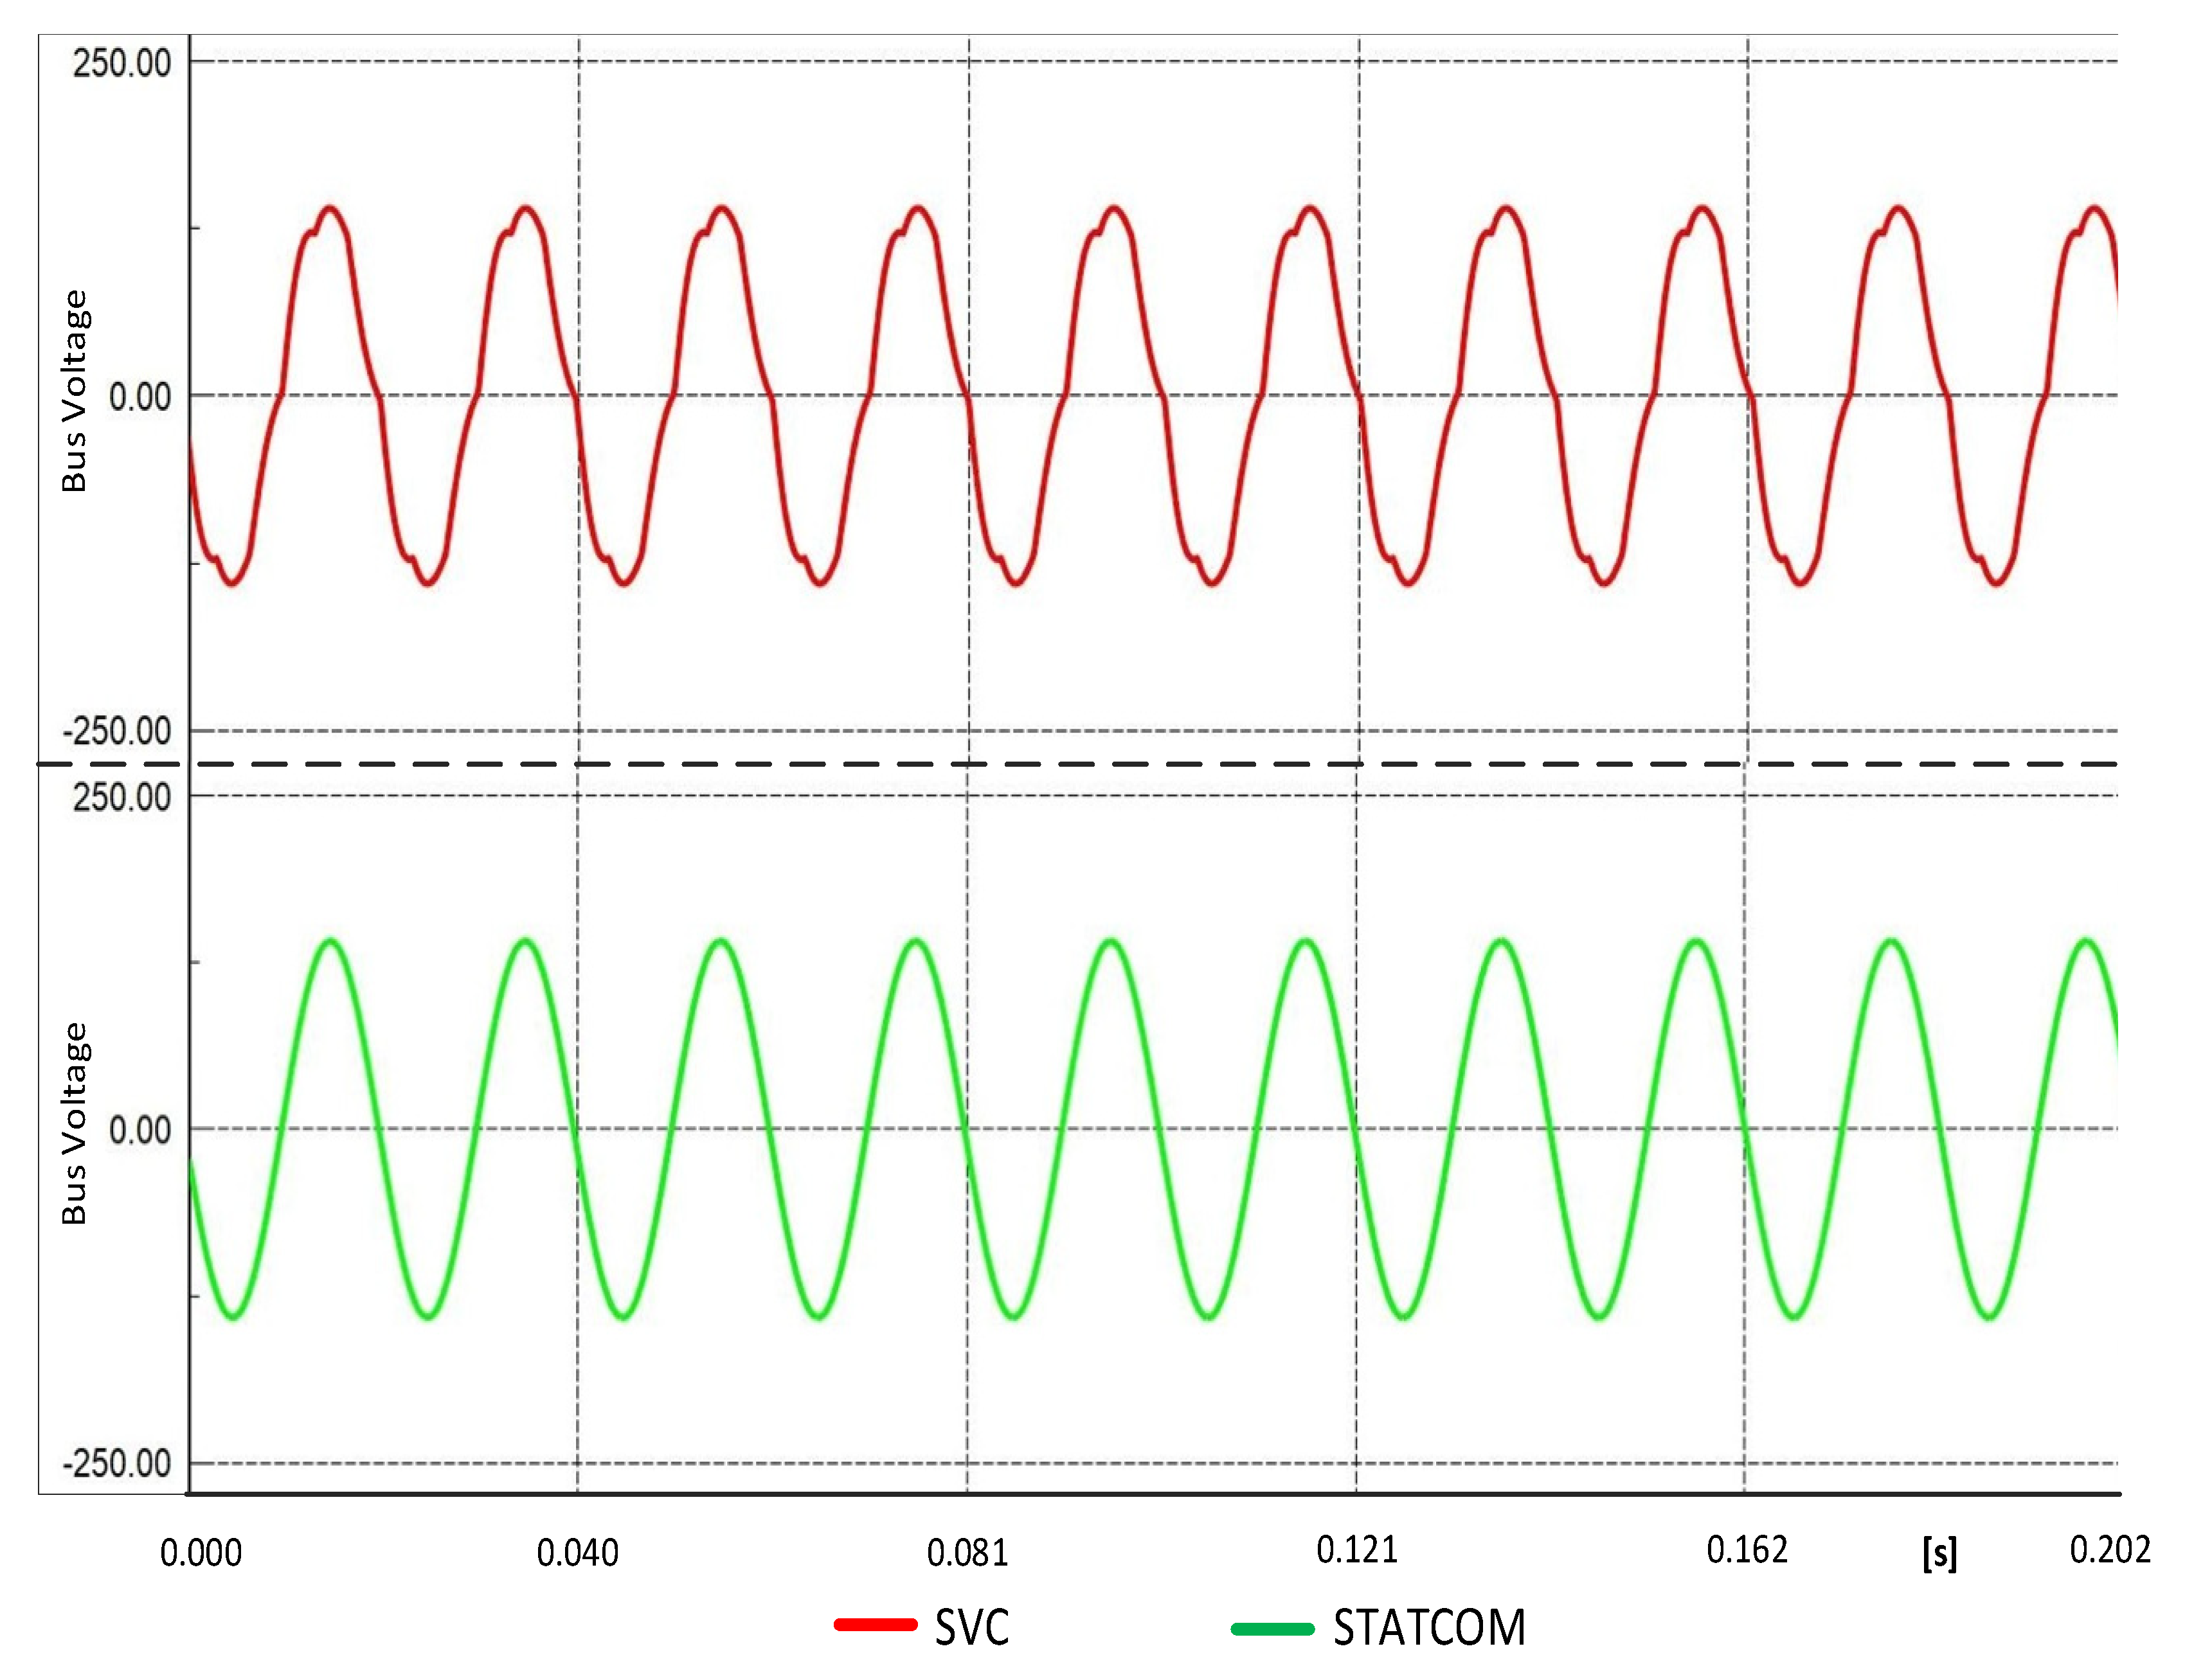
Table 7 describes exclusive findings, which are even better than the SVC’s. The voltage level of the BB-2 (132 kV) bus bar is at 131.1 kV (the STATCOM case) instead of 130 kV, as in the case of the SVC. The STATCOM case, thus, gives a voltage value closer to the nominal. Similarly, considering the harmonic analysis, yet again the STATCOM’s findings (Figure 9—the green-colored waveform) are way better than the SVC (Figure 9—the red-colored waveform), where the SVC is the cause of odd (the 5th and 7th) harmonics (
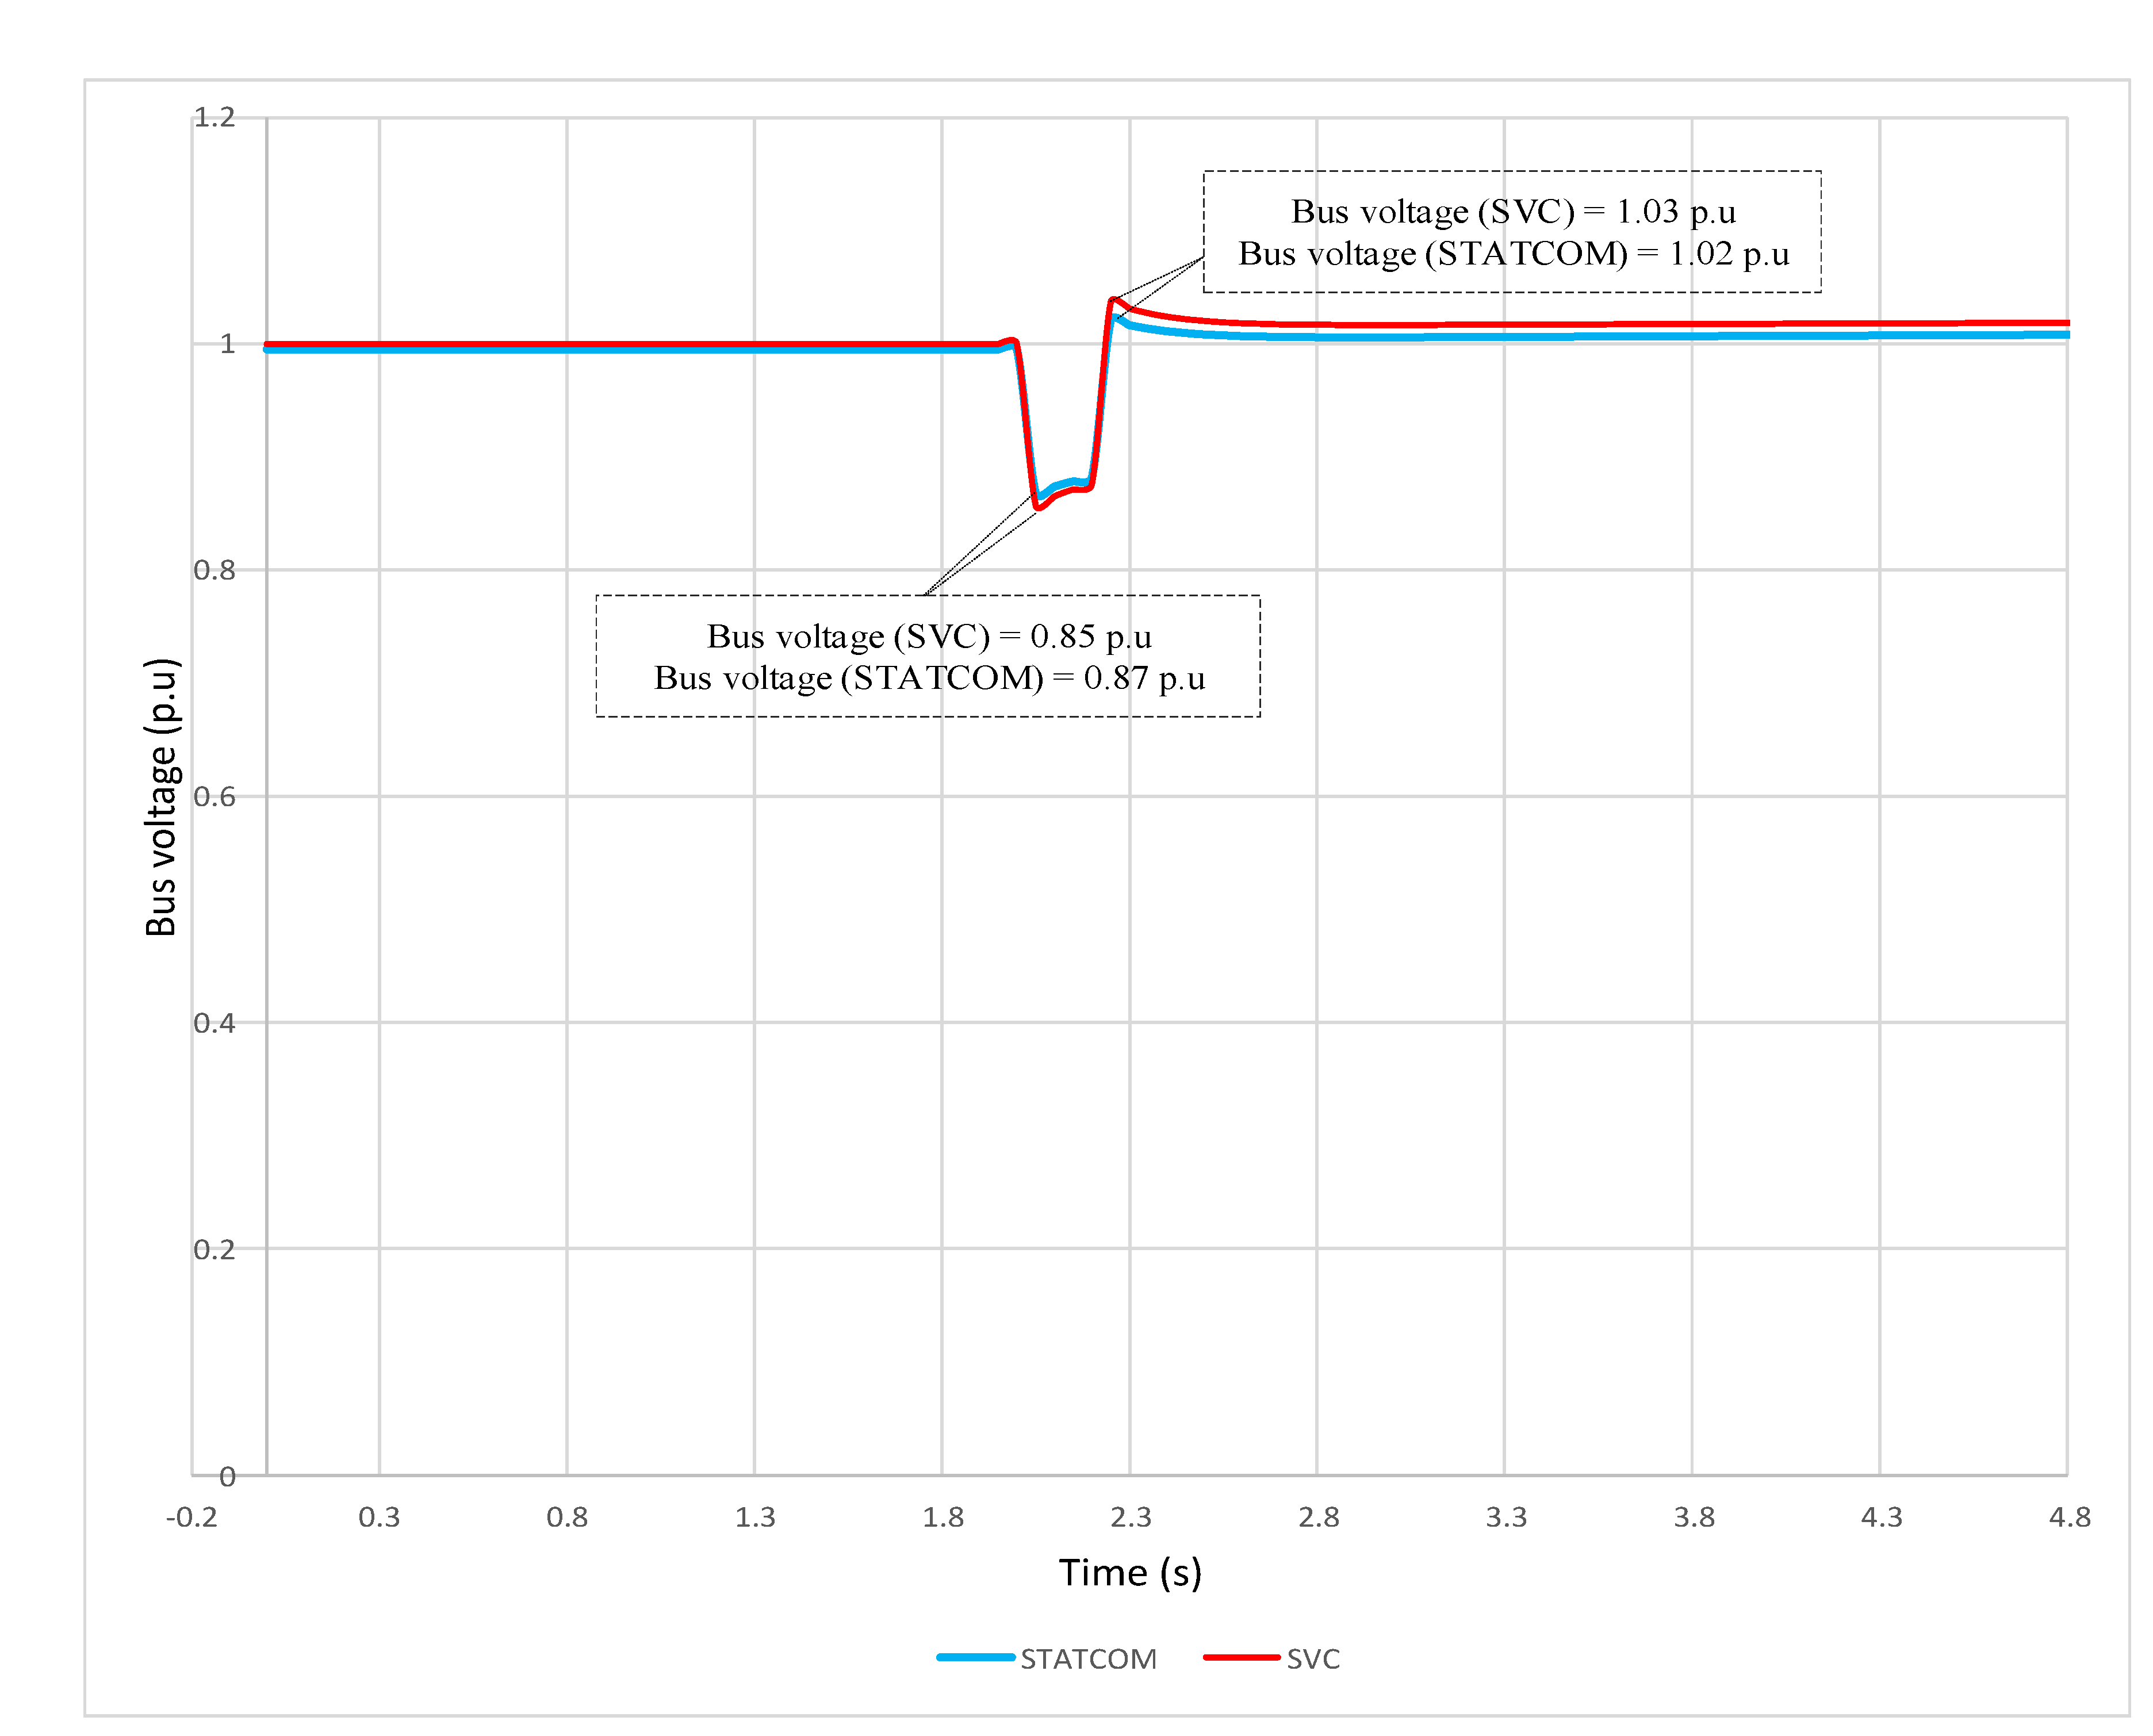
Figure 8). The usage of harmonic filters would be mandatory with the SVC installation—increasing the capital cost of the system. Finally, for the dynamic response of the discussed FACTS devices, the STATCOM has tackled the imposed fault in the form of a short-circuit in a more proficient manner than the SVC. In Figure 10 (the blue-colored plot), the rapid reaction of the STATCOM in response to the voltage drop (due to the short-circuit) is visible and stabilizing the power network (the BB-2 bus bar) sooner than the SVC (Figure 10—the red-colored plot) affirms the exclusiveness of the technique.
Among all the key findings, the cost assessment for both techniques, i.e., the SVC and STATCOM, is also a decisive feature in opting for a FACTS device. Considering the cost, the STATCOM is more expensive compared to the SVC; in the paper [47], the cost of the SVC has been stated as 40 US$/kvar, whereas the cost of the STATCOM is 50 US$/kvar. However, for high-rating compensating units, the cost would be more, which is approximately 55 US$/kvar for the SVC and 71.2 US$/kvar for the STATCOM [48]. In this paper, the proposed value for the reactive power compensation for the substation is 340 Mvar. Taking the values into account, the cost of both techniques can be calculated as follows:
C SVC = 55 USD / kvar
C STAT = 71.2 USD / kvar
C Total ( SVC ) = 55 × 340 M var = 18.7 million USD
C Total ( STAT ) = 71.2 × 340 Mvar = 24.2 million USD
where,
  • CSVC is per kvar cost of the SVC;
  • CSTAT is per kvar cost of the STATCOM;
  • CTotal(SVC) is the total cost of the SVC for the subjective electric substation;
  • CTotal(STAT) is the total cost of the STATCOM for the subjective electric substation.
Considering the aforementioned values in Equations (3) and (4), it is visible that the STATCOM has near a 17% additional cost as compared to the SVC. While looking at the results, this seems to be the only limitation of the STATCOM. However, for the SVC, being the cost-effective technology among the two discussed, the generation of excessive harmonics that eventually resulted in a distorted sinusoidal waveform of BB-2 is the biggest limitation. Table 9 presents a brief comparison of the SVC and STATCOM and the superiority of the specific technique in terms of performed analysis in this research.

5. Conclusions

The simulative study led by the authors and the outcomes of the various analysis for the comparison of the FACTS devices, i.e., the SVC and STATCOM, demonstrate the merits and demerits of both technologies.
  • The influence of both shunt technologies on the power network is quite satisfactory in the static and dynamic state, as well.
  • However, the STATCOM participates in the voltage stability and mitigation of harmonics in a better manner as compared to the SVC. Likewise, the dynamic performance of the STATCOM is better than the SVC, i.e., countering the short-circuit condition in a power network.
  • On the other hand, while taking cost into consideration, the STATCOM is quite more expensive (by nearly 17% more) than the SVC. It is obvious that choosing a compensation method is dependent on efficiency and cost, as well. The SVC can be preferred at the substations when there is no existing problem of excessive harmonics because the SVC will trigger more harmonics into the power system and could be the cause of system failure.
  • Observing the results of the analyses, the STATCOM has a better performance in all, but the best one is in harmonic mitigation (Figure 9). As compared to the SVC, no excessive harmonics were found in the case of the STATCOM; it can be referred to as an ideal-though-expensive compensating technique for the substations with already existing problems of harmonic distortion in the power system.
  • So, while preparing the feasibility report, along with the technical parameters, a cost-benefit analysis should be conducted before opting for any compensating device, either the SVC or STATCOM, although, apart from cost, the superiority of the STATCOM is noticeable as compared to the SVC’s.
  • In the future, the SVC’s and STATCOM’s protection/fault analysis could be done while taking the aforementioned substation into account. A protection/fault analysis includes the behavior and effectiveness of various protective relays and schemes in the forced faulty environment and the isolation of the faulty zones from a healthy system within a certain time frame, as stated by universal standards.

Author Contributions

Conceptualization, H.T. and S.C.; methodology, H.T. and S.C.; software, H.T. and S.T.; validation, S.T., K.M.C. and A.H.; formal analysis, H.T., S.C. and A.H.; investigation, H.T.; resources, A.H.M., S.A. and K.M.C.; data curation, S.T.; writing—original draft preparation, H.T. and A.H.; writing—review and editing, K.M.C.; visualization, A.H.M., S.A. and S.C.; supervision, S.C.; project administration, A.H.M., S.A. and Z.M.S.E.; funding acquisition, A.H.M. and Z.M.S.E. All authors have read and agreed to the published version of the manuscript.

Funding

This research was funded by the Deanship of Scientific Research at King Khalid University under Grant number RGP. 1/133/43.

Institutional Review Board Statement

Not applicable.

Informed Consent Statement

Not applicable.

Data Availability Statement

Data is contained within the article.

Acknowledgments

The authors extend their appreciation to the Deanship of Scientific Research at King Khalid University for funding this work through RGP. 1/133/43.

Conflicts of Interest

The authors declare no conflict of interest.

References

  1. Iqbal, S.; Jan, M.U.; Rehman, A.U.; Shafiq, A.; Rehman, H.U.; Aurangzeb, M. Feasibility Study and Deployment of Solar Photovoltaic System to Enhance Energy Economics of King Abdullah Campus, University of Azad Jammu and Kashmir Muzaffarabad, AJK Pakistan. IEEE Access 2022, 10, 5440–5455. [Google Scholar] [CrossRef]
  2. Khanna, M.; Rao, N.D. Supply and Demand of Electricity in the Developing World. Annu. Rev. Resour. Econ. 2009, 1, 567–596. [Google Scholar] [CrossRef] [Green Version]
  3. Al-shaalan, A.M. Problems Associated with Power System Planning in Developing Countries. J. Electron. Electr. Eng. 2014, 1, 43–48. [Google Scholar]
  4. Iqbal, S.; Xin, A.; Jan, M.U.; Abdelbaky, M.A. Applied sciences Improvement of Power Converters Performance by an Efficient Use of Dead Time Compensation Technique. Appl. Sci. 2020, 10, 3121. [Google Scholar] [CrossRef]
  5. Ma, Y.; Cao, L.; Zhou, X.; Gao, Z. Research on reactive power compensation technology in distribution grid. In Proceedings of the 2017 29th Chinese Control And Decision Conference (CCDC), Chongqing, China, 28–30 May 2017; pp. 1409–1414. [Google Scholar]
  6. Marzbali, A.G.; Gheydi, M.; Samadyar, H.; Fashami, R.H.; Eslami, M.; Golkar, M.J. Optimal reactive power control to improve stability of voltage in power systems. In Reactive Power Control in AC Power Systems; Springer: Cham, Switzerland, 2017; pp. 251–273. [Google Scholar]
  7. Gu, W.; Milano, F.; Jiang, P.; Zheng, J. Improving large-disturbance stability through optimal bifurcation control and time domain simulations. Electr. Power Syst. Res. 2008, 78, 337–345. [Google Scholar] [CrossRef]
  8. Zhang, Y.J.; Chen, C.; Li, Y.; Wu, G.B. Dynamic voltage support planning for receiving end power systems based on evaluation of state separating and transferring risks. Electr. Power Syst. Res. 2010, 80, 1520–1527. [Google Scholar] [CrossRef]
  9. Halacli, M.G.; Demiroren, A. Robust Voltage/VAR Control Using PSO Based STATCOM: A Case Study in Turkey. Electr. Power Compon. Syst. 2016, 44, 894–902. [Google Scholar] [CrossRef]
  10. Richter, B. Surge Arrester Application of Mv-Capacitor Banks to Mitigate Problems of Switching Restrikes. In Proceedings of the 19th International Conference on Electricity Distribution, Vienna, Austria, 21–24 May 2007; pp. 21–24. [Google Scholar]
  11. Dixon, J.; Morán, L.; Rodríguez, J.; Domke, R. Reactive power compensation technologies: State-of-the-art review. Proc. IEEE 2005, 93, 2144–2163. [Google Scholar] [CrossRef]
  12. Bisanovic, S.; Hajro, M.; Samardzic, M. One approach for reactive power control of capacitor banks in distribution and industrial networks. Int. J. Electr. Power Energy Syst. 2014, 60, 67–73. [Google Scholar] [CrossRef]
  13. Szabo, D.; Regul’A, M.; Bodnar, R.; Altus, J. Control of a SVC for power factor correction. In Proceedings of the 10th International Conference ELEKTRO, Rajecke Teplice, Slovakia, 19–20 May 2014; pp. 379–382. [Google Scholar]
  14. City, C.M. Keywords: Loadability, FACTS, TCSC, SVC. Eigenvalue 2017, 3, 579–594. [Google Scholar]
  15. Darabian, M.; Jalilvand, A. Designing a wide area damping controller to coordinate FACTS devices in the presence of wind turbines with regard to time delay. IET Renew. Power Gener. 2018, 12, 1523–1534. [Google Scholar] [CrossRef]
  16. Siddique, A.; Xu, Y.; Aslaml, W.; Albatsh, F.M. Application of series FACT devices SSSC and TCSC with POD controller in electrical power system network. In Proceedings of the 2018 13th IEEE Conference on Industrial Electronics and Applications (ICIEA), Wuhan, China, 31 May 2018–2 June 2018; pp. 893–899. [Google Scholar]
  17. Kotsampopoulos, P.; Georgilakis, P.; Lagos, D.T.; Kleftakis, V.; Hatziargyriou, N. Facts providing grid services: Applications and testing. Energies 2019, 12, 17. [Google Scholar] [CrossRef] [Green Version]
  18. Shawon, M.H.; Hanzelka, Z.; Dziadecki, A. Voltage-current and harmonic characteristic analysis of different FC-TCR based SVC. In Proceedings of the 2015 IEEE Eindhoven PowerTech, Eindhoven, The Netherlands, 29 June 2015–2 July 2015; pp. 20–32. [Google Scholar]
  19. Mumtaz, M.; Khan, S.I.; Chaudhry, W.A.; Khan, Z.A. Harmonic incursion at the point of common coupling due to small grid-connected power stations. J. Electr. Syst. Inf. Technol. 2015, 2, 368–377. [Google Scholar] [CrossRef] [Green Version]
  20. Abedin, T.; Lipu, M.S.H.; Hannan, M.A.; Ker, P.J.; Rahman, S.A.; Yaw, C.T.; Tiong, S.K.; Muttaqi, K.M. Dynamic modeling of hvdc for power system stability assessment: A review, issues, and recommendations. Energies 2021, 14, 4829. [Google Scholar] [CrossRef]
  21. Katira, M.J.; Porate, K.B. Load flow analysis of 132/11 kV distribution sub station using static var compensator for voltage enhancement—A case study. In Proceedings of the TENCON 2009—2009 IEEE Region 10 Conference, Singapore, 23–26 January 2009; pp. 521–526. [Google Scholar]
  22. Hameed, S.; Garg, P. Improvement of power system stability using genetically optimized SVC controller. Int. J. Syst. Assur. Eng. Manag. 2014, 5, 475–486. [Google Scholar] [CrossRef]
  23. Sreedharan, S.; Joseph, T.; Joseph, S.; Chandran, C.V.; Vishnu, J.; Das, V. Power system loading margin enhancement by optimal STATCOM integration—A case study. Comput. Electr. Eng. 2020, 81, 106521. [Google Scholar] [CrossRef]
  24. Dorile, P.O.; Jagessar, D.R.; McCann, R.A. Techno-economic assessment of voltage stability improvement using SSSC and STATCOM in a wind-dominated power system. In Proceedings of the 2021 IEEE Kansas Power and Energy Conference (KPEC), Manhattan, KS, USA, 19–20 April 2021; pp. 3–8. [Google Scholar] [CrossRef]
  25. Samet, H. Evaluation of digital metering methods used in protection and reactive power compensation of micro-grids. Renew. Sustain. Energy Rev. 2016, 62, 260–279. [Google Scholar] [CrossRef]
  26. Singh, B.; Kumar, R. A comprehensive survey on enhancement of system performances by using different types of FACTS controllers in power systems with static and realistic load models. Energy Rep. 2020, 6, 55–79. [Google Scholar] [CrossRef]
  27. Elechi, P. Comparative Analysis of Shunt Capacitor Banks and Static Var Compensators Performance on Distribution Network. Int. J. Anal. Electr. Mach. 2020, 6, 28–40. [Google Scholar] [CrossRef]
  28. Laouer, M.; Mekkaoui, A.; Younes, M. STATCOM and capacitor banks in a fixed-speed wind farm. Energy Procedia 2014, 50, 882–892. [Google Scholar] [CrossRef] [Green Version]
  29. Lijie, D.; Yang, L.; Yiqun, M. Comparison of high capacity SVC and STATCOM in real power grid. In Proceedings of the 2010 International Conference on Intelligent Computation Technology and Automation, Changsha, China, 11–12 May 2010; Volume 1, pp. 993–997. [Google Scholar]
  30. Nassif, A.B.; Domingues, A.F.; de Oliveira, M.C.; da Silva, L.C.P.; da Costa, V.F. Comparison of PSS, SVC and STATCOM for damping power system local mode oscillations. Ser. Energy Power Syst. 2004, 18, 533–538. [Google Scholar]
  31. Kazemi, A.; Badrzadeh, B. Modeling and simulation of SVC and TCSC to study their limits on maximum loadability point. Int. J. Electr. Power Energy Syst. 2004, 26, 619–626. [Google Scholar] [CrossRef]
  32. Gandoman, F.H.; Ahmadi, A.; Sharaf, A.M.; Siano, P.; Pou, J.; Hredzak, B.; Agelidis, V.G. Review of FACTS technologies and applications for power quality in smart grids with renewable energy systems. Renew. Sustain. Energy Rev. 2018, 82, 502–514. [Google Scholar] [CrossRef]
  33. Naderipour, A.; Abdul-Malek, Z.; Gandoman, F.H.; Nowdeh, S.A.; Shiran, M.A.; Moghaddam, M.J.H.; Davoodkhani, I.F. Optimal designing of static var compensator to improve voltage profile of power system using fuzzy logic control. Energy 2020, 192, 116665. [Google Scholar] [CrossRef]
  34. Eltamaly, A.M.; Sayed, Y.; El-sayed, A.M.; Nasr, A.; Elghaffar, A. Adaptive static synchronous compensation techniques with the transmission system for optimum voltage control. Ain Shams Eng. J. 2020, 11, 35–44. [Google Scholar] [CrossRef]
  35. Ivanovi, B. Application of combined Newton—Raphson method to large load flow models. Electr. Power Syst. Res. 2015, 127, 134–140. [Google Scholar]
  36. Kulworawanichpong, T. Simplified Newton-Raphson power-flow solution method. Int. J. Electr. Power Energy Syst. 2010, 32, 551–558. [Google Scholar] [CrossRef]
  37. Method, R.; Acha, E.; Member, S.; Kazemtabrizi, B. A New STATCOM Model for Power Flows Using. IEEE Trans. Power Syst. 2012, 28, 2455–2465. [Google Scholar]
  38. Singh, B.; Sharma, N.K.; Tiwari, A.N.; Singh, S.P. Incorporation of FACTS Controllers in Newton Raphson Load Flow for Power Flow Operation, Control and Planning: A Comprehensive Survey. Int. J. Comput. Sci. Eng. 2010, 02, 2117–2124. [Google Scholar]
  39. Elrayyah, A.; Sozer, Y.; Elbuluk, M.E. A novel load-flow analysis for stable and optimized microgrid operation. IEEE Trans. Power Deliv. 2014, 29, 1709–1717. [Google Scholar] [CrossRef]
  40. International Electrotechnical Commission. Loading Guide for Oil-Immersed Power Transformers; IEC Publications: Geneva, Switzerland, 2006; Volume 1991, p. 13. [Google Scholar]
  41. Wakileh, G.J. Power System Harmonics Fundamentals, Analysis and Filter Design; Springer: Berlin, Germany, 2001; pp. 67–85. [Google Scholar]
  42. Ma, Z.; You, G.; Xu, Z. Harmonic Evaluation of Grid with Multiple Harmonic Sources Based on DIgSILENT. In Proceedings of the 2014 International Conference on Power System Technology, Chengdu, China, 20–22 October 2014; pp. 20–22. [Google Scholar]
  43. IEEE Std 519-2014; IEEE Recommended Practice and Requirements for Harmonic Control in Electric Power Systems. Revision of IEEE Std 519-1992. Institute of Electrical and Electronics Engineers: Manhattan, NY, USA, 2014; pp. 1–29.
  44. IEC 61000-3-2; Electromagnetic Compatibility (EMC)—Part 3-2: Limits—Limits for Harmonic Current Emissions (Equipment Input Current ≤ 16 A per Phase) Edition 5.0 2018-01. International Electrotechnical Commission: Geneva, Switzerland, 2018.
  45. Jdeed, D. A New Method of STATCOM Controlling For Harmonic Mitigation And Power Factor Correction. J. Arab. Am. Univ. 2018, 4, 2098–2112. [Google Scholar]
  46. Tareen, W.U.K.; Aamir, M.; Mekhilef, S.; Nakaoka, M.; Seyedmahmoudian, M.; Horan, B.; Memon, M.A.; Baig, N.A. Mitigation of power quality issues due to high penetration of renewable energy sources in electric grid systems using three-phase APF/STATCOM technologies: A review. Energies 2018, 11, 18. [Google Scholar] [CrossRef] [Green Version]
  47. Sode-Yome, A.; Mithulananthan, N. Comparison of shunt capacitor, SVC and STATCOM in static voltage stability margin enhancement. Int. J. Electr. Eng. Educ. 2004, 41, 158–171. [Google Scholar] [CrossRef]
  48. Molinas, M.; Suul, J.A.; Undeland, T. Low voltage ride through of wind farms with cage generators: STATCOM versus SVC. IEEE Trans. Power Electron. 2008, 23, 1104–1117. [Google Scholar] [CrossRef]
Figure 1. Substation modeled in PowerFactory-DIgSILENT.
Energies 15 04453 g001
Figure 2. SVC model: B.B—bus bar; T/F—coupling transformer; TSC—thyristor switched capacitor; FC—fixed capacitor (filters); TCR—thyristor controller reactor.
Energies 15 04453 g002
Figure 3. Simplified scheme of the TCR: V (B.B)—voltage of bus bar 2 (132 kV); VREF—reference voltage; T/F—coupling transformer.
Energies 15 04453 g003
Figure 4. SVC structure in PowerFactory-DIgSILENT.
Energies 15 04453 g004
Figure 5. STATCOM model: PCC—point of common coupling; B.B—bus bar; T/F—coupling transformer; Vdc—D.C voltage source.
Energies 15 04453 g005
Figure 6. Simplified scheme of the voltage source converter (VSC): B.B—bus bar (BB-2); T/F—coupling transformer; Vdc—D.C voltage source.
Energies 15 04453 g006
Figure 7. STATCOM structure in PowerFactory-DIgSILENT.
Energies 15 04453 g007
Figure 8. Harmonic distortion—with SVC.
Energies 15 04453 g008
Figure 9. The voltage waveform of BB-2 (132 kV)—with SVC and STATCOM.
Energies 15 04453 g009
Figure 10. Short circuit response of STATCOM and SVC at BB-2 (132 kV).
Energies 15 04453 g010
Table 1. Ratings of the SVC equipment.
EquipmentRating
Capacitors340 Mvar—170 × 2
Coupling transformer450 MVA (132/22 kV)
Reactor170 Mvar
Table 2. LFA results of the transformers—without compensation.
EquipmentRatings% LoadingCurrent Loading (kA)—LV Side
Transformer T-1250 MVA (220/132) kV94.51.033
Transformer T-2250 MVA (220/132) kV94.51.033
Transformer T-3250 MVA (220/132) kV94.51.033
Transformer T-440 MVA (132/11) kV90.71.903
Transformer T-540 MVA (132/11) kV86.81.822
Transformer T-640 MVA (132/11) kV86.81.822
Table 3. LFA results of the bus bars—without compensation.
EquipmentRated Value (kV)Recorded Value (kV)
Bus bar (BB-2)132121.5
Bus bar (BB-3)119.5
Bus bar (BB-4)119.6
Bus bar (BB-5)119.6
Table 4. LFA results of the transformers—with SVC.
EquipmentRatings% LoadingCurrent Loading (kA)—LV Side
Transformer T-1250 MVA (220/132) kV76.60.843
Transformer T-2250 MVA (220/132) kV76.60.843
Transformer T-3250 MVA (220/132) kV76.60.843
Transformer T-440 MVA (132/11) kV83.01.743
Transformer T-540 MVA (132/11) kV80.11.682
Transformer T-640 MVA (132/11) kV79.31.666
Table 5. LFA results of the bus bars—with SVC.
EquipmentRated Value (kV)Recorded Value (kV)
Bus bar (BB-2)132130.4
Bus bar (BB-3)1110.3
Bus bar (BB-4)1110.4
Bus bar (BB-5)1110.4
Table 6. LFA results of the transformers—with STATCOM.
EquipmentRatings% LoadingCurrent Loading (kA)—LV Side
Transformer T-1250 MVA (220/132) kV64.30.703
Transformer T-2250 MVA (220/132) kV64.30.703
Transformer T-3250 MVA (220/132) kV64.30.703
Transformer T-440 MVA (132/11) kV83.11.745
Transformer T-540 MVA (132/11) kV80.21.684
Transformer T-640 MVA (132/11) kV79.41.668
Table 7. LFA results of the bus bars—with STATCOM.
EquipmentRated Value (kV)Recorded Value (kV)
Bus bar (BB-2)132131.1
Bus bar (BB-3)1110.3
Bus bar (BB-4)1110.5
Bus bar (BB-5)1110.4
Table 8. IEEE Standard 519’s (2014) permissible limits.
Harmonic
Order (H.O)
Permissible Limit (%)
3 ≤ H.O < 112.0
11 ≤ H.O < 171.0
17 ≤ H.O < 230.75
23 ≤ H.O < 350.3
35 ≤ H.O < 500.15
Table 9. Comparative analysis.
Comparative
Analysis/Parameters
Comments
Load FlowFor the SVC’s results shown in Table 4 and Table 5, the transformers and bus bars, respectively, are satisfactory. In comparison to the STATCOM’s results, shown in Table 6 and Table 7, it is clear that the STATCOM provides a better approach to tackling the bus bar’s poor parameters, such as current loading and voltages. The voltage of BB-2 in the SVC’s presence was recorded as 130.4 kV, and for the STATCOM, it was 131.1 kV.
Harmonic responseLooking at the harmonic response waveforms in Figure 9 the SVC and STATCOM, it is evidently obvious that the STATCOM would be the best option to avoid excessive harmonics as compared to the SVC. For the case of the SVC, the 5th and 7th harmonics were recorded as 5.27% and 2.47%, respectively (Figure 8), which is a violation of the limits of IEEE standard 519, i.e., 2.0%.
Short-circuit responseAgain, the STATCOM has its superiority over the SVC (Figure 10) while stabilizing the bus bar (BB-2) voltage after being exposed to a faulty environment. The BB-2 voltage was closest to nominal (132 kV) in the case of the STATCOM by a difference of 1.8 kV as compared to the case of the SVC.
CostEquations (3) and (4) show a comparison of the cost between both techniques, i.e., the SVC and STATCOM. Here, clearly, the SVC has its superiority over the STATCOM. A clear difference of 17% is visible, i.e., the SVC is quite less expensive than the STATCOM.
Publisher’s Note: MDPI stays neutral with regard to jurisdictional claims in published maps and institutional affiliations.

